A Method of Power Supply Mode Selection for Urban Distribution Network Planning Based on Association Rules
-
Cunbin Li
 ,
Shuke Li
,
Shuke Li

Abstract
Based on association rules, this article proposed a method for intelligent recommendation of power supply mode, which helps decision-makers in the selection of many schemes. Firstly, a history database which includes the forecasting models and correlative factors was first built and association rule mining was conducted; then combined with the correlative factors in the designated area, the criteria matching in the rules mined were carried out with CBR technique; finally automatic recommendation of the power supply modes was achieved under the given conditions. By application of an example, it is demonstrated that the proposed method can not only automatically analyze the applicability of power supply modes and the intrinsic relationship between correlative factors but also provide, to some extent, theoretical basis for selection of power supply modes and practical utility for urban distribution network planning.
1 Introduction
Because different wiring modes of distribution network have different characteristics in economy and reliability, at the same time different regions have difference in reliability requirement of power supply and the return on investment of distribution network, power conditions, power grid-channel conditions etc., the selection of applicable power supply mode for designed region can not only provide security of power supply for users but also improve the return on investment of distribution network in order to achieve lean management of electric network and orderly development of electric network construction. Given this, how to select applicable wiring modes of distribution network for different regions requirement has been drawn great researches interest in the field of distribution network planning. In practice of power supply and consumption, no matter how perfect management method is and how mature the technology is, the risk can be of common occurrence due to be affected by a variety of risk factors[1]. Therefore, scientifically to select power supply mode is one of the important methods to effectively reduce the risk of power supply.
There are many methods to solve this real problem of selecting applicable power supply mode for designed region in real distribution network planning. At present, following methods have been widely used, they are ΑΗΡ (analytic hierarchy process)[2], TOPSIS[3], PCA (principal component analysis)[4] and emergent new methods such as artificial neural network algorithm[5]. These methods have different advantage and defects respectively due to difference of motive and solving thoughts. There are many different wiring modes of distribution network with different characteristics in economy and reliability[6–15]. So it is necessary to select applicable power supply modes according to real requirement and characteristics of methods and various correlative factors. Based on matching recognition theory, literature [16] provided different power supply plans on the basis of different wiring modes and forecasting models which match different region characteristics.
However, to employ which method for selecting an applicable plan from mass plans of power supply mode is the most cardinal problem for decision-makers. Based on previous researches, this article proposed a method of power supply mode selection for urban distribution network planning based on Association Rules. The main contributions of this article are as follows. Firstly, Association Rules is applied to analysis of database which is composed of correlative factors of power supply modes in urban distribution network; then, the correlations between correlative factors and power supply modes are found; finally, by rules matching, intelligent recommendation for applicable wiring mode selection was obtained.
The article is organized as follows. Section 2 introduced preliminary concepts of association rules. Section 3 detailed building process of history database for forecasting model of urban power supply modes using correlative factors. Section 4 presented the whole process of mode selecting which by data analysis and data generalization, association rules mining, rules matching to obtain rational mode recommendation results. Section 5 described a real-life application of the proposed method in selection of power supply modes by using history data of multiple cities in China. Finally, in Section 6, some conclusions are made.
2 Association Rule
Association Rule was first proposed by Agrawal in 1993, which is one of theories that have been widely used in data mining[17] with a purpose to discover associations between itemsets in mass data. Association rules are basically used to build a model for prediction; they can also be used to describe correlations between itemsets and class labels [18] and identify dependencies between items of a database[19]. There are many real applications in which the discovery of association rules has been employed to extract interesting knowledge from databases. Numerous previous researches always have been focused on mining Boolean and quantitative association rules[20–24], however in recent years, many researchers have proposed methods to mine fuzzy association rules (FARs)[25–29] in order to help decision-makers make good decisions and tackle new types of problems[30]. Literature [31] proposed a novel intelligence recommendation model for insurance products using associate rule algorithm.
Association rule can be expressed as a relationship of the form A ⇒ B, where A and B are sets of items, I is sum of all itemsets, A ∊ Ι, Β ∊ Ι, A ∩ B = ∅. A ⇒ B represents the probability that contain A simultaneously also contain B among the items of a database. There are two important concepts namely support and confidence in association rule analysis.
2.1 Support
The support of rule R is the proportion of the tuples which contain A and Β to total tuples, represents probability that A and Β simultaneously exist in database, denoted by
where DA∪B represents the number of tuples which contain A and B, D represents the number of total tuples.
2.2 Confidence
The confidence of ruler is the proportion of the tuples contain A and B to the tuples contain A, represents the probability of occurrence B in items in which A has occurred, denoted by
where DA∪B represents the number of tuples contain A and B, Da represents the number of tuples contain A.
The implementation for mining association rules consist of two phases. In the 1st phase, frequent itemsets are mined from the dataset namely finding the sets of items that satisfies constraints which their support is greater than minimum support thresholds. In the 2nd phase, is to mine the sets of strong association rules namely finding all sets of association rules that their confidence is greater than minimum confidence thresholds from frequent itemsets.
Where, frequent itemsets can be defined as the items with constraints which their support is greater than minimum support thresholds in the case of given dataset and minimum support thresholds namely sup(A) ≥ min Sup; In the case of given dataset and minimum support thresholds as well as minimum confidence thresholds, strong association rules can be defined as the rules in the association rules A ⇒ B that satisfy following constraints
3 History Database Building
In this section, we will build history database for forecasting models, which includes selection of correlative factors of power supply modes and analysis of their applicability.
3.1 Correlative Factors Selecting
There are many correlative factors which influence power supply modes, this article referred to correlative factors in literature [32], as shown in Table 1. Correlative factors information are obtained by real planning data, which usually includes historical data of regional load, population, industrial proportion, developmental level of GDP, climatic conditions, forecasting period, city centrality, city function, and so on. It is crucial to keep the continuity of them and can’t be disconnected when selecting the correlative factors, and supplement of correlative factors should be done when necessary. For different existing schemes, the given correlation factors are different, however, there are always some general characters among them. In the analysis of actual correlative factors, correlative factors which were employed usually are population, industrial proportion, developmental level of GDP, climatic conditions, forecasting period. This article employed factor analysis method of literature [33] for preliminary selection of correlative factors data.
Correlative factors of power supply mode in urban distribution network
| ID | Symbolic Representation | Correlative Factors | Classification and Representation |
|---|---|---|---|
| 1 | CC | Classes of Cities | Littoral/ Inland |
| 2 | CE | Centrality | Municipality/ County/ Country |
| 3 | FU | Function | Industry/ Agriculture/ Tourism |
| 4 | CL | Climate | Tropic/ Temperate Zone/ Frigid Zone |
| 5 | PO | Population | Quantities |
| 6 | EC | Economy Development | Quantities |
| 7 | ES | Economy Structure | Quantities |
| 8 | HY | Historical Years for Forecasting | Data of Year |
| 9 | NY | Nowadays Years for Forecasting | Data of Year |
| 10 | GY | Goal Years for Forecasting | Data of Year |
| 11 | LS | Load Status | Saturation/ Unsaturation/ Hysteresis Saturation |
| … | … | … | … |
3.2 Applicability Evaluation of Power Supply Modes
The other part of history database of power supply mode in urban distribution network is applicable level of the models. The modes of actual use in planning are results of preferential choices which experts have selected according to characteristic of designed area, and which have reflected the expert’s preferences. These results can be used as candidate items for choosing fit modes. But not all candidate modes used in the past have good effectiveness in the new task, and the case that the mode was not adopted in the past can be the best choice in present can’t be excluded from. Therefore, it is necessary to conduct applicability evaluation of power supply modes when building history database for forecasting models. This article employed the methods of literature [34] and literature [35] for applicability evaluation of power supply mode. Applicability evaluation of power supply mode needs starting from demands of the mode itself, such as certain modes must depend on correlative factors to select. In this article, the applicability of power distribution district and each of power supply mode is classified as quantitatively different levels, which is as a kind of correlative factors to be considered. Value range of applicability of power supply mode is 0~1. Where, 0 represents the mode can’t fit demands under the given conditions, 1 represents the mode is fit. When the number is greater than 0 and less than 1, represents applicable level of the mode which is chose to use and the designed areas, which can be set with reference to practical experience.
Based on the above two parts in Section 3, raw database of power supply modes in urban distribution network with correlative factors is built. The parts of database of power supply modes are shown in Table 2. In Table 2, the transverse and longitudinal items can be extended. On the basis of raw database, association rules mining are conducted in order to obtain objective rulebase.
History database for forecasting models of urban power load using correlative factors
| ID | District | CC | CE | FU | CL | PO (×104) | EC (×l09RMB) |
|---|---|---|---|---|---|---|---|
| 1 | Al city | 0 | Provincial | Tourism | Subtropics | 35.53 | 12.32 |
| 2 | Al city | 1 | Provincial | Industry | Temperate Zone | 35.75 | 13.53 |
| 3 | Bl city | 1 | Municipality | Industry | Subtropics | 34.54 | 13.86 |
| 4 | B2 city | 0 | Municipality | Industry | Subtropics | 74.67 | 216.48 |
| 5 | B3 city | 1 | Provincial | Industry | Subtropics | 74.22 | 242.77 |
| 6 | B4 city | 1 | Ordinary city | Industry | Temperate Zone | 37.09 | 7.07 |
| 7 | CI district | 1 | County and Township | Agriculture | Subtropics | 37.51 | 7.73 |
| 8 | C2 district | 1 | Ordinary city | Agriculture | Subtropics | 40.79 | 21.48 |
| 9 | C3 district | 1 | County and Township | Agriculture | Subtropics | 98.48 | 14.67 |
| … | … | … | … | … | … | … | … |
| ID | ES (%) | LR (%) | HY | NY | GY | PW (108kWh) | LD/MW | T-HHW |
|---|---|---|---|---|---|---|---|---|
| 1 | 57.53 | 22.08 | 2012 | 2013 | 2015 | 7.98 | 136.07 | 0.75 |
| 2 | 51.92 | 9.61 | 2012 | 2013 | 2015 | 9.01 | 170.24 | 0.75 |
| 3 | 49.50 | 4.05 | 2012 | 2013 | 2015 | 10.20 | 186.54 | 0.75 |
| 4 | 57.53 | 13.67 | 2012 | 2013 | 2015 | 10.92 | 193.66 | 0.25 |
| 5 | 51.92 | 7.26 | 2012 | 2013 | 2015 | 12.60 | 221.13 | 0.25 |
| 6 | 47.09 | 8.95 | 2012 | 2013 | 2015 | 10.33 | 185.13 | 1.00 |
| 7 | 48.66 | 17.52 | 2012 | 2013 | 2015 | 10.65 | 197.34 | 1.00 |
| 8 | 57.18 | 7.10 | 2012 | 2013 | 2015 | 11.32 | 213.40 | 1.00 |
| 9 | 63.65 | 8.09 | 2012 | 2013 | 2015 | 13.62 | 247.39 | 0.00 |
| … | … | … | … | … | … | … | … | … |
Note: LR (represents growth rate of GDP); PW (represents power quantity of district); LD (represents load of district); T-HHW (represents applicability of hand in hand wiring of T way to power distribution district).
4 Mode Selecting
4.1 The Whole Process of Mode Selecting
For mode selection, the first is to establish the historical database, which contains the data of all the correlative factors and modes applicability after the evaluation, taking a mode as the target mode with all the historical correlative factors to conduct data generalization; after that association rules mining between correlative factors and the mode applicability is conducted to get the association rules which meet the conditions; at last, in allusion to target mode to conduct rules matching. Putting the given conditions into the historical database, data generalization of the given conditions is conducted according to reference standard which is the same as historical data, applicable conclusion of target mode can be obtained after rules matching between known ranked data and the mined rules. Where, data generalization, association rule mining and rules matching are all to take one mode as study objective in application of mode selection, the applicability of each mode under given conditions can be obtained by conducting the same study process for other modes. Whole process for mode selecting is shown in Figure 1.
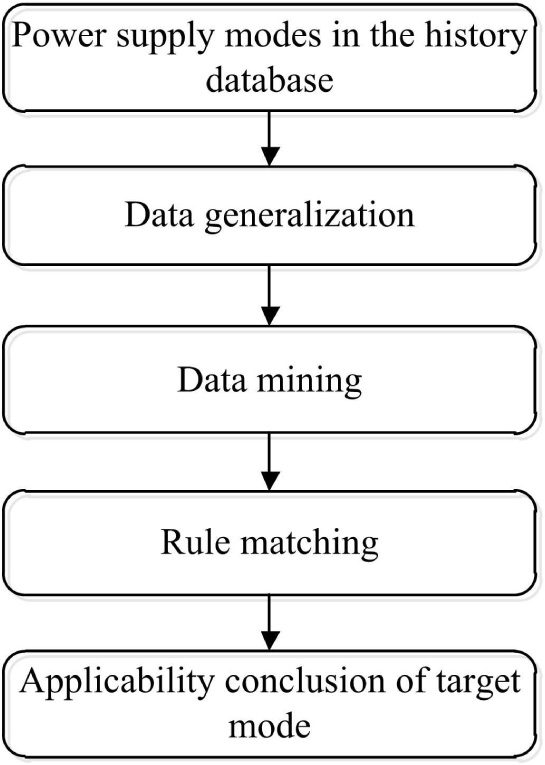
Flow chart of the whole process
4.2 Data Analysis and Data Generalization
By consulting a source, correlative factors with no need for quantization already have a certain partition basis; quantitative data analysis and data generalization mainly use k-means clustering algorithm literature [36] employed, which the outside does not need to set clustering center, but need to set the number of cluster centers. This article set number of cluster center is 5, dynamic computing each of the cluster centers according to the historical data so as to grade the existing data in order to obtain generalized database which can be used directly in association rule mining algorithm. In database every correlative factor is represented by different letters, as shown in Table 3.
History database after data staging for forecasting models of urban load using correlative factors
| ID | District | ES% | EC | LR% | PO | PW | LD/MW | HY | NY | GY | FU | T-HHW | |
|---|---|---|---|---|---|---|---|---|---|---|---|---|---|
| (100kWh) | |||||||||||||
| 1 | A1 city | E2 | R0 | L0 | P1 | D0 | L2 | H1 | N1 | G1 | Z2 | T3 | |
| 2 | A1 city | E2 | R0 | L1 | P1 | D0 | L2 | H1 | N1 | G2 | Z2 | T3 | |
| 3 | B1 city | E2 | R0 | L0 | P1 | D0 | L3 | H1 | N1 | G2 | Z3 | T3 | |
| 4 | B2 city | E2 | R2 | L1 | P3 | D1 | L4 | H0 | N0 | G1 | Z3 | T1 | |
| … | … | … | … | … | … | … | … | … | … | … | … | … | … |
4.3 Association Rules Mining
Essence of association rule mining is to find out the relationship between the correlative factors and power supply mode in urban distribution with the generalized data, and to construct the database of association rules with constrains of minimum support and minimum confidence and the effectiveness is larger than 1. The core computation of association rule mining widely uses the FP-Growth algorithm which basic idea is to highly compress the data of historical database into a frequent pattern tree structure, where the compressed data still has kept the original information, then by using method of pattern-growth to generate frequent item sets, and then to mine association rules. The FP-Growth algorithm includes 2 stages, the first stage is to search for all frequent itemsets and to form a tree structure; the second stage is to set minimum support and minimum confidence so as to generate association rules that satisfy the itemsets constraints. At present, there are 2 methods of threshold setting. One is to set different thresholds in each layer of the rules mining, another is to set the only value in the whole algorithm. In this article, the only threshold standard is set for simplicity. Because of all the rules have upper and lower limits of support and confidence, which is the direct basis which user conduct setting. If want to get more rules, the lower limit of support and confidence are as the main reference for setting, whereas reference to the upper limit. The first stage is the core of the algorithm. At last, association rules are obtained which rules format is such as R0&E2:T4, which represents that if corresponding correlative factors satisfy R0 and E2 conditions, applicable level of the target model is T4.
4.4 Rules Matching
For the new task, the result that each correlative factor was graded can be obtained after data generalization of the known data according to each the clustering center in history database, such as the result is R1 and P4 respectively, can be represented as R1&P4. Such, status quo of correlative factors in this area can be obtained and serve as known conditions to match with rules of association rulesbase which by above data mining obtained. At last, the conclusion of the applicability of the mode can be obtained by Case Based Reasoning (CBR) method. CBR is an analogy reasoning method which is by accessing solutions of past similar problems in knowledge base to obtain solution of the current problem. That is, by using the old cases and experience to solve new problems and evaluate new problem, and to explain the abnormal conditions or to understand the new situation.
Rules matching have the following 3 kinds of circumstances[32].
If there is only one matched result in the rule base, applicable level of the supply mode in distribution network corresponding to the matching conditions will be recommended out.
If there are multiple matching results corresponding to known conditions in the rule base, ranking them in accordance with the support degree and association degree from high to low, the rule with the highest support will be directly as the final conclusion.
If there is no relevant rule in the rule database to match with the known conditions, reminder of “current history database without the matching result” is given directly. At this point you can try to use other mechanisms to select power supply mode in distribution network. The matching process is shown in Figure 2.

Flow chart of rules matching with CBR
5 Example
This article uses the text data of power system planning of China multiple cities as an example to apply the proposed method for selection of power supply mode in distribution network of China’s certain city.
5.1 History Database Building
This article chose initial data of 42 representative domestic urban areas as source of historical database, selected correlative factors are the city population, the development level of GDP, the proportion of second industry, the applicable level of power supply modes in distribution network is also considered as correlative factor. After the applicability evaluation of modes, generated initial historical database is shown in Table 4.
History database including applicability evaluation of modes by using correlative factors
| ID | T-DXS | ES% | EC(×109RMB) | PO(x104) |
|---|---|---|---|---|
| 1 | 0.75 | 53.10 | 10.98 | 33.00 |
| 2 | 0.75 | 46.90 | 12.26 | 34.10 |
| 3 | 0.75 | 44.95 | 13.06 | 30.60 |
| 4 | 0.25 | 53.0 | 197.10 | 68.20 |
| 5 | 0.25 | 48.00 | 219.30 | 68.07 |
| 6 | 1.00 | 43.01 | 6.53 | 34.15 |
| 7 | 1.00 | 43.94 | 6.93 | 33.95 |
| 8 | 1.00 | 52.08 | 20.11 | 36.98 |
| 9 | 0.00 | 58.16 | 14.03 | 90.05 |
| … | … | … | … | … |
It is observed from Table 4 that, for the target mode, under given known conditions, only the area which is corresponding to scheme 9 did not adopt target mode, its applicable level is 0. The areas which are corresponding to other schemes all adopted the target mode, but degree of dependence to target mode is different. Where, scheme 6~8 fully adopted target mode, setting their quantization data is 1; degree of dependence of scheme 1~3 to target model is 0.75, the degree of dependence of the remaining schemes is set to 0.25. The raw data is used as a basis of the follow-up association rules mining.
5.2 Cluster Analysis and Data Generalization
Original data is divided into definite grade after data generalization and is represented by different letters. After data generalization for the data in Table 4, database which association rules mining can use directly was obtained. Part of the data is as shown in Table 5.
Original database after data staging
| ID | T-DXS | ES% | EC(×109RMB) | PO(×104) |
|---|---|---|---|---|
| 1 | T3 | E2 | R0 | PI |
| 2 | T3 | E2 | R0 | PI |
| 3 | T3 | E2 | R0 | PI |
| 4 | Tl | E2 | R2 | P3 |
| 5 | Tl | E2 | R2 | P3 |
| 6 | T4 | E2 | R0 | PI |
| 7 | T4 | E2 | R0 | PI |
| 8 | T4 | E2 | R0 | PI |
| 9 | TO | E3 | R0 | P4 |
| … | … | … | … | … |
5.3 Database for Association Rules
Association rules mining is conducted by taking the generalized data as the mining object. In the example, 132 efficiently strong association can be get by setting constrains of minimum confidence is 0.1, the minimum support degree is 0.02, and the effectiveness is more than 1, as shown in Table 6.
Database for association rules
| ID | Rule | Confidence | Support | Effectiveness |
|---|---|---|---|---|
| 1 | E0:T0 | 0.4960 | 0.0465 | 1.3322 |
| 2 | E0:T0 | 0.4491 | 0.0877 | 1.2031 |
| 3 | E2:T2 | 0.3031 | 0.1191 | 1.1193 |
| 4 | E3:T0 | 0.4862 | 0.1174 | 1.2445 |
| 5 | E3:T2 | 0.0725 | 0.2871 | 1.0799 |
| 6 | E4:T4 | 0.4803 | 0.0367 | 3.9172 |
| 7 | P0:T2 | 0.3350 | 0.1808 | 1.1349 |
| 8 | P1:T0 | 0.4921 | 0.1482 | 1.3270 |
| 9 | P2:T0 | 0.5215 | 0.0400 | 1.3768 |
| 10 | P3:T2 | 0.6361 | 0.0231 | 2.2495 |
| 11 | P4:T0 | 1.0469 | 0.0246 | 2.9622 |
| 12 | R0:T3 | 0.2486 | 0.2012 | 1.1607 |
| 13 | R1:T2 | 0.5372 | 0.0797 | 2.0805 |
| … | … | … | … | … |
Note: E0~E4 means gradual increase of the proportion of the second industry, T0~T4 represents gradual increase of adaptability of hand in hand wiring of Τ Way to the planning area.
5.3.1 Rules Analysis of Single-Factor
On the basis of analysis of 132 obtained strong association rules, the relationship of applicability between the proportion of the second industry, population, GDP and hand in hand wiring of Τ way can be obtained. Next, the relationship of applicability between GDP production level and hand in hand wiring of Τ way acts as an example to explain. After mining analysis, association rules between the GDP production level and hand in hand wiring of Τ way are obtained as follows.
Rule 1–R0: T3
Rule 2–R1:T2
Rule 3–R2:T0 support 0.0099, confidence 1.0000.
Rule 4–R3:T0 support 0.0099, confidence 1.0000.
Rule 5–R4:T0 support 0.0033, confidence 1.0000.
Rule 1 and Rule 2 show that when GDP production level is lower, hand in hand wiring of Τ Way is applicable. In order to further verify this, rule 3, rule 4, rule 5 are the latent rules which were obtained after support degree reduction, which show that with the increase of GDP levels, hand in hand wiring of Τ way always remains in the lowest applicable level, namely hand in hand wiring of Τ way is more suitable for the cities of lower GDP production level.
It is shown initially that between GDP and applicability of power supply mode in distribution network has a strong correlativity by the results of all single factor analysis, and that, this obvious regularity has existed in the case of no need filtering out some rules. While correlativity between the proportion of the second industry, population and hand in hand wiring of Τ way can be obtained needing filtered out individual rules, because the data of the population and the proportion of the second industry in original data need to be supplemented more or less according to outside information, it will inevitably lead to subtle biases of rules.
5.3.2 Rules Analysis of Multi-Factor
The relationship between popation and GDP and applicability of hand in hand wiring of Τ way acts as an example, through the mining analysis, obtained association rules of the population and GDP and hand in hand wiring of Τ way as follows.
Rule 1–R0&P0: T3, support 0.1320, confidence 0.2632.
Rule 2–R1&P0: T2, support 0.0363, confidence 0.6111.
Rule 3–R1&p3: T2, support 0.0231, confidence 1.0000.
To sum up, rule 1, rule 2 show that under the condition of population remains unchanged, change of GDP will make change of applicability of hand in hand wiring of Τ way; rule 2, rule 3 show that under the condition of GDP keep a certain level, change of the population will not lead to change of applicability of hand in hand wiring of Τ way. In the two correlative factors of GDP and population, GDP plays a leading role to applicability of hand in hand wiring of Τ way, which single factor rules also implied that the higher the GDP level, the lower applicability of hand in hand wiring of Τ way.
Based on above analysis of the relationship between the proportion of the second industry, population, GDP and applicability of hand in hand wiring of Τ way, it can be concluded that the proportion of the second industry play a key role in the decision process of whether hand in hand wiring of Τ way is applicable, GDP take second place, effect of the population is minimum. Hand in hand wiring of Τ way is suitable for the cities which have the lower GDP, the smaller population, the bigger proportion of the second industry.
5.4 Matching Results and Mode Selection
The above analysis is only to contrapose hand in hand wiring of T way. At present, there are more than 30 kinds of load forecasting algorithms, for each kind of power supply modes in distribution network, changing its applicability and repeating the above process of data generalization and association rules mining, corresponding association rules can be obtained for each mode. For hand in hand wiring of T way, obtained association rules is E2&P1&R1: T0
Putting the known correlative factors of the area in this example into the historical database to participate in data generalization, the obtained generalization condition is E2&P1&R1. Matching the conditions in association rule results of each mode, the applicability of each mode of the area is obtained. Part of result is shown in Table 7.
Results of mode selection in distribution network
| ID | Mode Name | Applicable | Expression for Applicable |
|---|---|---|---|
| 1 | Hand In Hand Wiring of T Way | T0 | Inapplicability |
| 2 | Double Power Looping in-out Wiring Way | T3 | Highly Applicable |
| 3 | Double Power Radiate Wiring Way | T4 | Fully Applicable |
| 4 | Double Power Overhead Hand in Hand Wiring of T Way | T3 | Highly Applicable |
| 5 | Hand in Hand Wiring Way | T1 | Low Applicable |
| … | … | … | … |
6 Conclusion
Combined with the particularity of the power industry, this article put forward the basic ideas and the solution by introducing association rules of data mining techniques into selection analysis of the power supply mode in the distribution network. By application of the proposed method in actual forecasting work, decision maker can largely determine whether using a certain power supply mode in distribution network. This method has the advantages that do not depend on a certain single expert and can synthetically consider plenty of expert experience, and that can find out rules which can’t be found easily by mankind intuitively through accumulation of a large number of forecasting data and data mining, which provides a method guarantee to avoid the risk in aspects of decision-making selection of power supply modes and security and reliability of power supply and consumption.
At first, this article constructed history scheme library which consist of application situation of power supply mode and correlative factors influencing power supply mode in distribution network; then obtained enlightening association rules through the analysis of actual planning data of a large number of cities, which has a contribution to reduce manual workload; finally, the embedded rules mining is conducted in constructed ideal data, it is verified that the proposed method is correct and effective.
References
[1] Li C B, Liu Y Q, Li S K. A dynamic model of procurement risk element transmission in construction projects. Journal of Systems Science and Information, 2015, 3(2): 133–144.10.1515/JSSI-2015-0133Search in Google Scholar
[2] Li X H, Xu J, Li D, et al. Index system of reliability evaluation for distribution network based on analytic hierarchy process. Proceedings of the Chinese Society of Universities for Electric Power System and Its Automation, 2009, 21(3): 69-74.Search in Google Scholar
[3] Liu W G, Cai L Y. The realization of TOPSIS way of decision matrix according to object divided layers with Matlab. Computer Engineering and Applications, 2002, 38(14): 129–131.Search in Google Scholar
[4] Fang J, Li Ζ Ρ, Peng H, et al. Application of BP neural network based on principal component analysis. Transformer, 2011, 48(1): 47-51.Search in Google Scholar
[5] Li L C, Xia D Z, Yang Ζ Ρ, et al. Short-term load forecasting using artificial neural network. Proceedings of the CSU-EPSA, 1994, 6(3): 33-41.Search in Google Scholar
[6] Xie X W, Liu H. Integrated contrast on connection modes of mid-voltage distribution networks. Proceedings of the CSU-EPSA, 2009, 21(4): 94-99.Search in Google Scholar
[7] Wan W, Cheng H, Wang C. The connection modes in 110 kV urban electric network. Jiangxi Electric Power, 2009, 33(1): 35-37.Search in Google Scholar
[8] Ge S Y, Guo M X, Wang C S, et al. Comparative study of connection modes in high-voltage distribution networks. Electric Power Automation Equipment, 2004, 24(2): 33–37.Search in Google Scholar
[9] Wu W J. Analysis of typical connection modes in HV distribution network. China Science and Technology Information, 2007(5): 32-35.Search in Google Scholar
[10] Yao L N, Zhang J L, Liu H, et al. Analysis of typical connection modes of urban middle voltage distribution network. Electric Power Automation Equipment, 2006, 26(7): 26–29.Search in Google Scholar
[11] Wang C S, Wang S Y, Ge S Y, et al. Economy and reliability analysis of different connection modes in MV distribution systems. Automation of Electric Power Systems, 2002, 26(24): 34–39.Search in Google Scholar
[12] Chen S L, Chen Z. Connection mode and transition mechanism of urban medium-voltage distribution system. Proceedings of the CSU-EPSA, 2008, 20(5): 76-80.Search in Google Scholar
[13] Xiong Z D, Cheng P. Economy analysis on power supply scheme of medium voltage distribution network. Proceedings of the CSU-EPSA, 2010, 22(1): 150-155.Search in Google Scholar
[14] Ge S Y, Zhang J, Chen L J. Optimization of the tie lines in urban distribution network based on two-tie connection mode. Proceedings of the CSU-EPSA, 2007, 19(5): 98-104.Search in Google Scholar
[15] Zhang W J, Cheng H Z, Cheng Z M, et al. Review of distribution network optimal planning. Proceedings of the CSU-EPSA, 2008, 20(5): 16-23, 55.Search in Google Scholar
[16] Wang L F, Lu S L, Yu J P. Mathematical matching model of distribution network based on matching recognition theory. Proceedings of the CSU-EPSA, 2011, 23(4): 106-110.Search in Google Scholar
[17] Agrawal R, Imieliski T, Swami A. Mining association rules between sets of items in large databases. ACM SIGMOD Record. ACM, 1993, 22(2): 207-216.10.1145/170035.170072Search in Google Scholar
[18] Nguyen D, Vo B, Le B. CCAR: An efficient method for mining class association rules with itemset constraints. Engineering Applications of Artificial Intelligence, 2015, 37: 115–124.10.1016/j.engappai.2014.08.013Search in Google Scholar
[19] Zhang C, Zhang S. Association rule mining: Models and algorithms. Springer-Verlag, 2002.10.1007/3-540-46027-6Search in Google Scholar
[20] Han J, Kamber M, Pei J. Data mining, southeast asia edition: Concepts and techniques. Morgan kaufmann, 2006.Search in Google Scholar
[21] Agrawal R, Srikant R. Fast algorithms for mining association rules. Proc. 20th Int. Conf. Very Large Data Bases, VLDB, 1994, 1215: 487-499.Search in Google Scholar
[22] Martin D, Rósete A, Alcalá-Fdez J, et al. A new multiobjective evolutionary algorithm for mining a reduced set of interesting positive and negative quantitative association rules. IEEE Transactions on Evolutionary Computation, 2014, 18(1): 54-69.10.1109/TEVC.2013.2285016Search in Google Scholar
[23] Martin D, Rósete A, Alcalá-Fdez J, et al. QAR-CIP-NSGA-II: A new multi-objective evolutionary algorithm to mine quantitative association rules. Information Sciences, 2014, 258(3): 1–28.10.1016/j.ins.2013.09.009Search in Google Scholar
[24] Sun K, Bai F. Mining weighted association rules without preassigned weights. IEEE Transactions on Knowledge and Data Engineering, 2008, 20(4): 489-495.10.1109/TKDE.2007.190723Search in Google Scholar
[25] Alcala-Fdez J, Alcalá R, Herrera F. A fuzzy association rule-based classification model for high-dimensional problems with genetic rule selection and lateral tuning. IEEE Transactions on Fuzzy Systems, 2011, 19(5): 857-872.10.1109/TFUZZ.2011.2147794Search in Google Scholar
[26] Chen C H, He J S, Hong T P. Moga-based fuzzy data mining with taxonomy. Knowledge-Based Systems, 2013, 54(4): 53-65.10.1016/j.knosys.2013.09.002Search in Google Scholar
[27] Chen C H, Hong T P, Tseng V S. Finding pareto-front membership functions in fuzzy data mining. International Journal of Computational Intelligence Systems, 2012, 5(2): 343–354.10.1080/18756891.2012.685314Search in Google Scholar
[28] Hong T P, Lee Y C. An overview of mining fuzzy association rules. Fuzzy Sets and Their Extensions: Representation, Aggregation and Models, Springer Berlin Heidelberg, 2008: 397–410.10.1007/978-3-540-73723-0_20Search in Google Scholar
[29] Lin C W, Hong T P, Lu W H. Linguistic data mining with fuzzy FP-trees. Expert Systems with Applications, 2010, 37(6): 4560-4567.10.1016/j.eswa.2009.12.052Search in Google Scholar
[30] Palacios A M, Palacios J L, Sánchez L, et al. Genetic learning of the membership functions for mining fuzzy association rules from low quality data. Information Sciences, 2015, 295: 358–378.10.1016/j.ins.2014.10.027Search in Google Scholar
[31] Xu W, Wang J J, Zhao Z Q, et al. A novel intelligence recommendation model for insurance products with consumer segmentation. Journal of Systems Science and Information, 2014, 2(1): 16–28.10.1515/JSSI-2014-0016Search in Google Scholar
[32] Xiao J, Geng F, Du B J, et al. Intelligent recommendation of urban power load forecasting models based on association rules. Journal of Tianjin University, 2010, 43(12): 1079–1085.Search in Google Scholar
[33] Yang Y X, Lü X, Ma J, et al. A robust factor analysis model for dichotomous data. Journal of Systems Science and Information, 2014, 2(5): 437-450.10.1515/JSSI-2014-0437Search in Google Scholar
[34] Guo R J, Dong Y L, Wang M Q, et al. DEA cross-efficiency evaluation method based on good relationship. Journal of Systems Science and Information, 2015, 3(1): 14–24.10.1515/JSSI-2015-0014Search in Google Scholar
[35] Yang F F, Fu Y H. Uncertain comprehensive evaluation method based on expected value. Journal of Systems Science and Information, 2014, 2(5): 461–472.10.1515/JSSI-2014-0461Search in Google Scholar
[36] Tang Z Z, Li B, Qiu H Y. A dynamic clustering method to large-scale distribution problems. Journal of Systems Science and Information, 2015, 3(1): 25–36.10.1515/JSSI-2015-0025Search in Google Scholar
© 2015 Walter de Gruyter GmbH, Berlin/Boston
Articles in the same Issue
- Start-Up and Acceleration Profile for Protected Left-Turn Vehicles at Signalized Intersections
- Construction and Practice of the Optimal Smooth Semi-Supervised Support Vector Machine
- Trade Potential of China’s Export to ASEAN: The Gravity Model Using New Economic Mass Proxies
- A Method of Power Supply Mode Selection for Urban Distribution Network Planning Based on Association Rules
- Generating Behavior in the University-Industry Collaboration Network: Based on the Configuration of Motifs
- Research on the Evaluation of Enterprises’ Green Growth Efficiency Based on DEMATEL-DEA
- Power of Moran’s I Test for Spatial Dependence in Panel Data Models with Time Varying Spatial Weights Matrices
- Linear Quadratic Nash Game of Stochastic Singular Time-Delay Systems with Multiple Decision Makers