
Spatial Dynamics, Vocational Education and Chinese Economic Growth
-
Jiafeng Gu


Abstract
Few would deny the contribution of vocational education on economic growth and social development, but the spatial dynamics behind the economic role of vocational education in transition economies has not been examined by the literature on economics of education. Specifically, two hypotheses are tested. First, the economic growth and vocational education development have significant global spatial autocorrelation, which means the development of economy and vocational education of one province depends on the economic or education level of neighboring provinces. Second, the economic growth and vocational education development have significant local spatial autocorrelation. With per capital GDP and vocational education scale data of 31 provinces in China from 1995 to 2008, both hypotheses are supported. Finally, the results show that the elasticity with spatial metrics is 1.522, which means the stronger economic role of vocational education because the elasticity is larger than 1, while the elasticity without spatial dynamics is only 0.926 which implies the weak economic role of vocational education. It also shows that the OLS model is confronted with the risk of spurious regression without considering spatial dynamics and the spatial error model is preferred because it’s robust.
1 Introduction
The issue of economic results of vocational education is a perennial topic in the literature [1-2]. It’s a fundamental belief that vocational education is a mechanism of economic growth by training skilled workers for industrial development. Few would argue about the basic belief between vocational education and economic growth, but the nexus between them has been the subject of a heated debate. Researches focused on individual and social return of vocational education show that vocational education facilitates economic growth by improving individual or social return of investment in vocational education[3]. However, there is little evidence across countries of a positive correlation between the scales of vocational education on the one hand, and between such measures of economic success as the level of economic development, GDP growth or economic competitiveness, on the other[4].
China’s economic growth has been remarkable since the reform and open-door policy started in 1978. As Wang and Yao pointed, the accumulation of human capital was quite rapid and it contributed significantly to growth and welfare in China[5]. China’s vocational education system supplies skilled labor to economic development and it’s an effective way to accumulate human capital. The so called ‘skilled labor shortage’ phenomenon implies the importance of expanding vocational education in China. Unfortunately, more and more resources have been invested in higher education system while the critical value of vocational education on economic growth hasn’t been emphasized. The simple relationships which are implied between vocational education and economic growth are actually highly complex, especially in a dramatic economic and social transformation country such as China[6]. In particular, the impacts of vocational education are crucially mediated or complicated by other aspects of regional development strategy. Much rare have been analyses of instances where an economy has flourished and what role vocational education may have played. This paper will examine the case of China to investigate how vocational educational contributes to China’s economic success, and what role inter-region spatial dynamics might have played.
1.1 Growth miracle and challenge of Chinese economy
The People’s Republic of China was founded in 1949. Its economic development over the past five decades can be divided into two periods: the pre-reform (1952–1977) and post-reform (after 1978) periods. According to Figure 1, economic growth was extremely slow in the prereform period and the average rate of growth was 6.8%. Since the reform and open-door policy in 1978, China has developed fast. As illustrated in Figure 1, the average rate of growth between 1978 and 2008 was 17%. The nominal gross domestic product of 2008 was 300670 million RMB yuan, which was 82 times of 1978 and 443 times of 1952. In 2010, after 30 years of rapid development, China surpassed Japan and became the world’s second largest economy. The dramatic growth of China’s economy is also called as ‘Chinese growth miracle’.
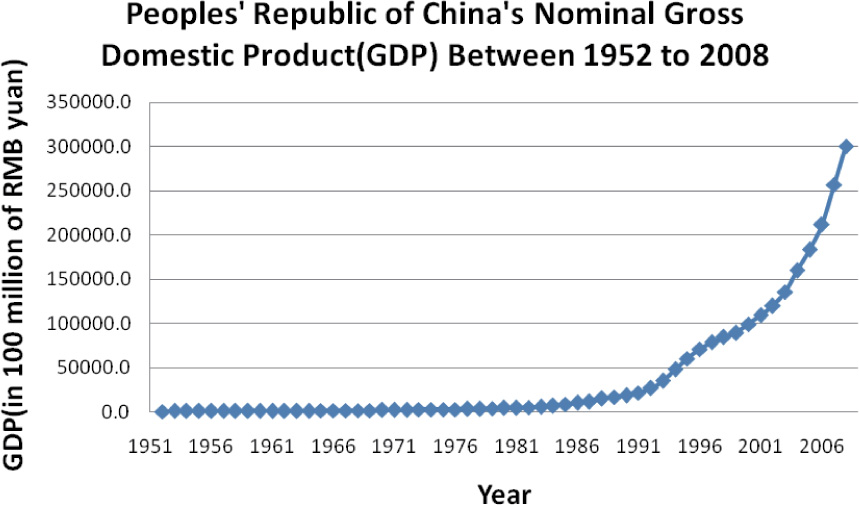
China’s nominal gross domestic product from 1952 to 2008
During China’s 30 years of reform and opening, the growth of total economic output attracts worldwide attention. The causes and mechanism making Chinese growth miracle are the persistent theme in economics’ study. China’s economic growth in those decades has been driven by several important factors such as the development of the rural non-farming sector, massive inflow of foreign capital, structural transformation, lower labor cost, increasing domestic demand integrating into the global economy, reform-induced efficiency improvement and promotion of trade. However, there is also pessimism about China’s economic development in the academic circle[7]. Can China’s economic miracle continue in the next decade? Will the economic miracle run out of stream? Those issues are still controversial.
Unquestionably, as one of the world’s major economies, China still faces a variety of challenges, both from domestic and abroad. Those internal challenges including inflationary pressures, labor and income unequal distribution and regional unbalanced development, push Chinese government to adjust the economic growth mode. While, the increase of external pressure makes economic adjustments become more complex. To deal with those challenges, Chinese government accelerates the transformation of the mode of economic development. To facilitate the transformation of the mode of economic development and to keep Chinese economic sustainable development, China’s education system has been expanded since 1978. The human capital stock has been increased dramatically and the effects on the growth of Chinese economy are significant. Because higher education is treated as one most important resource to train and supply higher quality human resource, the government prioritizes the development of higher education. In 1998, there were 34.1 million students enrolled by China’s higher education. In 2008, there were 202.1 million students enrolled by China’s higher education. In other words, during the ten years, the scale of China’s higher education in 2008 is almost six times of the scale in 1998 (China Compendium of statistics 1949–2008). China has become the largest country of higher education in the world since 2003.
1.2 The shortage of skilled worker and the development of vocational education
While the rapid expansion of higher education improves the human resource stock which facilitates the economic growth and transformation, it triggers two other consequences. On one hand, many university students can’t find a jop at all. According to the report of People’s Daily in 2004, among art and design graduates, only 59.7 percent got employed. On the other hand, China is suffering from serious shortage of skilled workers and senior technicians. The previous report also pointed that a sample survey conducted in 40 cities of China showed that technician and senior technician only account for 4 percent of total skilled workers, while enterprises need more. Over attention to academic performance and negligence of skill training in the current education system is seen as a major cause to the shortage. Skilled workers are in critically short supply in China, which marks another obstacle to the sustainable economic growth. It’s obvious that the shortage of skilled worker becomes a real choke-point in future economic growth and it’s really an issue in the labor market.
To foster skilled workers and technicians, the Chinese government expands vocational education systems systematically and rapidly. In 1980, there were 3314 vocational secondary schools, 23 thousand full-time teachers and 454 thousand students enrollment in those schools. In 2008, there were 6128 vocational secondary schools, 326 thousand full-time teachers and 7611 thousand students enrollment in those schools (China Compendium of statistics 1949–2008). With the expansion of scale, the structure and goal of China’s vocation education has been adjusted. China’s vocational education has been reformed to improve the quality to meet the demand of industry and society. Since the beginning of 21century, the planned economy has been replaced by market economy fundamentally. Correspondingly, vocational schools changed their running school model to satisfy the demand of market. In 1998, the State Education Commission issued the Principles of Opinion on Vocational Education Reform and Deepening for the 21 Century, in which the capacity-based vocational education was set as a new direction of vocational education development. The expansion and reform of China’s vocational education speeds up the training of a large of skilled workers and enhances the competitive advantage of Chinese economy. In this respect, China’s experience will provide some useful insights on the underlying philosophy, policies, choices and rationale for those who are involved in the development of vocational education systems.
1.3 Research questions
Few would deny the contribution of vocational education on economic growth but the degree and mechanism of this contribution has been the subject of heated debate[6]. Traditional wisdom of vocational education study is to use economic return of education to investigate the relation between vocational education and economic growth[1]. In reality, the development of vocational education systems in different regions is asynchronous. The vocational education systems of some provinces develop faster than others in China. The spillover effects strengthen the interregion vocational education competition[8]. The vocational education disparity across regions also is adjusted by policy learning mechanism[9]. The analysis paradigm of economic return of education can’t handle those issues. In this research, we want to investigate the relation between vocational education and economic growth within the inter-regional spatial interaction frame, into which the spatial dynamics such as spillover effect and policy learning mechanism are incorporated. The research questions are:
Is there an inherent relation between vocational education and economic growth? In other words, what’s the contribution of vocational education on economic growth?
Does spatial structure affect the relation between vocational education and economic growth? In other words, do the spatial dynamics affect the economic role of vocational education?
We use the vocational education data and per capita GDP data of 31 provinces in China from 1995 to 2008 to investigate the inherent relation between them. Besides traditional OLS regression method, we use spatial econometrics method to estimate the spatial relation between vocational education and economic growth spatial econometrics is a subfield of econometrics that deals with the treatment of spatial interaction (spatial autocorrelation) and spatial structure (spatial heterogeneity) in regression models for cross-sectional and panel data and is widely applied in the research of social science recently[10].
2 Iterature review
Empirical results show that there are significant relations between the expansion of vocational education and the level of economic development. As Psacharopoulos and Loxley observed, the lower the overall level of a country’s development, the weaker is the case for introducing vocational curriculum and diversify it[11]. The development of vocational education can also diminish unemployment rates because people have vocational skills which meet the demand of industry development. For instance, Haq and Haq observed that unemployment rates in the East Asian economies remained low essentially because the population possessed employable vocational and technical skills[12]. According to the human capital theory, the logic relationship between vocational education and economic growth is the specific human capital[13]. In the technical-functional theory, the development of vocational education is treated as the result of technological changes generated by the industrial revolution. Demands for skilled workers generated by industrialization promote the growth of vocational education that can provide training and skills for a technically proficient labor force.
However, such belief has been challenged by many ways. For example, Foster exploded the vocational school myth and called it “vocational school fallacy”[14]. Foster and later Blaug clearly argued that vocationalisation cannot be a remedy for educated unemployment[15]. Those opponents argued that vocational education cannot prepare students for specific occupations and reduce mismatches between education and the labor market[16]. Those opinions have been confirmed by later researches such as King and Martin[17]. Another challenge of vocational education is that vocational education is costlier than general education. In China the unit costs were 50∼100 per cent higher in vocational and technical schools than in general secondary schools[18]; and according to the estimates referring to 1980s and earlier period, vocational education in South Asian countries was found to be 2∼60 times higher than general education[19]. Some empirical results also supported those opponents. The empirical results of Sultana’s research showed that vocational education cannot respond to the requirements for economic development[20]. Those empirical evidences changed traditional wisdom that vocational education was a good solution to some economic problems and triggered people to rethink the economic role of vocational education.
Given the nature of the conflicting evidence available, it would be safe to conclude that the relationship between vocational education and economic development may not be linear. The expansion of vocational education gives more benefit to some economies than others and the effect of spatial dynamics should not be ignored. In China, one of the most salient features of education is regional disparity[21]. It’s reasonable that the regional disparity affects and triggers other kind of education inequities of China’s vocation education system. The main question of interest is whether the relation between vocational education and economic growth depends on regional interaction, thereby shows interdependence between those provinces in China. In the literature, such interdependence is commonly termed as “strategic interaction”[22-24]. Strategic interaction is said to occur when the levels of policy variables in one jurisdiction are influenced by the levels of those variables in neighboring jurisdictions[25]. Recent education studies that have incorporated spatial dependence are the relationship among teacher salaries in Pennsylvania school districts in Greenbaum[26], the analysis of strategic interaction among US school districts in Rincke[27], the diffusion of charter schools among California school districts in Rincke[28], price competition between U.S. universities in Mcmillen, Singell and Waddell[29].
The most popular test for strategic interaction is Moran’s I test statistic[30]. Spatial models have a long history in the regional science and geography literature. In recent years issues concerning strategic interaction between cross sectional units or neighboring units have also received increasing attention in the economics[31]. Sen derived the large sample distribution of the Moran I test statistic and Cliff and Ord generalized Moran’s I statistic in order to derive a test for spatial correlation in a linear regression model[32-33]. Since Tobler invoked the “First Law of Geography”, spatial autocorrelation and strategic interaction have been widely recognized in economic geography literature[34]. Spatial autocorrelation is characterized by a correlation in a signal among nearby locations in space and the behavior of units at different locations may not be independent[35]. Actions made at nearby locations may be closer in value than actions made at locations farther apart. This phenomenon is also called strategic interaction, which can be tested by Moran’s I test statistic[36]. Empirical researchers seem to interpret a large value of I as the existence of a high degree of strategic interaction.
Although an extensive literature has addressed strategic interaction in education fields both in the United States and China, there is very few studies that have dealt with spatial dynamics of the economic role of vocational education. The present paper contributes to the existing literature by examining the spatial dynamics behind the relation between economic growth and vocational education development to show how the inter-province spatial dynamic mechanism works. Using per capital GDP and vocational education enrollment data on 31 provinces in China from 1995 to 2008, we examine whether economic growth and vocational education expansion are spatially linked among provinces in global (national) and local (province) level. The empirical analysis focuses on the test for strategic interdependence in developing local economic growth and in expending local vocational education systems among provinces and the test for the impact of vocational education expansion on economic growth.
3 Method
3.1 Data, sample and variables
We use per capita GDP as an indicator of economic growth and the data of 31 provinces from 1995 to 2008 come from China Compendium of statistics 1949–2008. The unit of per capita GDP is RMB yuan. We use the data of student enrollment of vocational secondary schools from 1995 to 2008 in China and the data come from China Statistical Yearbook at those years. We also collect data of total population (1 million persons) of each province in those years from China Compendium of statistics 1949–2008. The former divided by the latter is the student enrollment of vocational secondary schools per million persons in each province. The reason for choosing the student enrollment of vocational secondary schools per million persons as an index to present the level of vocational education in China is the following: in China’s vocational education system secondary vocational education is the lion’s share and has direct link to labor market. Secondary vocational education comprises the senior high school level of vocational education and post-junior secondary school education for three to four years. Its aim is to prepare intermediary-level skilled workers with comprehensive occupational skills for the industrial, technology, and management sectors. Chinese secondary vocational education includes secondary specialized schools, technical school, vocational high schools, secondary specialized or technical school for adults. In 2008, there were altogether 14847 secondary vocational schools with the enrolment of 20,870,873 students and the recruitment of 8,121,103 students (China Statistical Yearbook, 2009). We use this indicator to measure the scale of the vocational education systems in each province. The sample includes 31 provinces of China.
From 1995 to 2008, the averageper capita GDP and the average scale of vocational education of each province are computed and the descriptive statistics of each province is summed in Table 1. According to Table 1, Shanghai, Beijing and Tianjin are the top three provinces in economic development level and Guizhou, Gansu and Yunnan are the last three. In vocational education field, Shanghai, Tianjin and Beijing are the top three provinces who have large scale of local vocational education systems in China. While Tibet, Guizhou and Yunnan provinces are the last three.
The descriptive statistics of economic level and vocational education scale in each province
| Province | Per capita GDP | Vocational educated scale | Provinces | Per capita GDP | Vocational educated scale | ||||
|---|---|---|---|---|---|---|---|---|---|
| Means | S.D. | Means | S.D. | Means | S.D. | Means | S.D. | ||
| Beijing | 32793 | 16508 | 90 | 25 | Hubei | 8805 | 4827 | 74 | 47 |
| Tianjin | 25478 | 14245 | 101 | 32 | Hunan | 7912 | 4285 | 57 | 37 |
| Hebei | 10815 | 5806 | 63 | 49 | Guangdong | 18122 | 9419 | 48 | 29 |
| Shanxi | 8954 | 5296 | 73 | 42 | Guangxi | 6802 | 3591 | 51 | 35 |
| Inner Mongolia | 11669 | 8774 | 53 | 32 | Hainan | 8884 | 3725 | 50 | 29 |
| Liaoning | 14778 | 7248 | 55 | 32 | Chongqing | 8231 | 4351 | 58 | 49 |
| Jilin | 10346 | 5762 | 55 | 23 | Sichuan | 7005 | 3726 | 51 | 44 |
| Heilongjiang | 11040 | 4951 | 43 | 22 | Guizhou | 3901 | 2066 | 42 | 26 |
| Shanghai | 39147 | 17530 | 102 | 30 | Yunnan | 6282 | 2780 | 43 | 24 |
| Jiangsu | 17780 | 10231 | 83 | 46 | Tibet | 6611 | 3638 | 32 | 19 |
| Zhejiang | 20074 | 10985 | 62 | 49 | Shaanxi | 7580 | 4640 | 64 | 49 |
| Anhui | 6740 | 3437 | 51 | 45 | Gansu | 5696 | 2970 | 49 | 33 |
| Fujian | 14697 | 7055 | 69 | 47 | Qinghai | 7674 | 4265 | 41 | 33 |
| Jiangxi | 6931 | 3692 | 62 | 47 | Ningxia | 7912 | 4369 | 55 | 37 |
| Shandong | 14572 | 8562 | 61 | 43 | Xinjiang | 9872 | 4749 | 54 | 22 |
| Henan | 8267 | 4984 | 60 | 47 | |||||
3.2 Empirical model
This research sketches a model of the economic role of vocational education rather different from the traditional empirical model. It is designed to formalize views that the spatial dynamics serves primarily as a dynamics mechanism that mediates the economic role of vocational education. Traditional wisdom assumes that there is no spatial interaction between regions such as provinces. We first test this assumption. Then we will sketches a spatial model and an OLS model as well to investigate the economic role of vocational education. The spatial econometrics model is capable of illuminating spatial dynamics of the economic role of vocational education and gives an interpretation alternative to the conventional one.
3.2.1 Global and local spatial autocorrelation test
We used the spatial autocorrelation statistics to test the assumption that the economic growth and vocational education development of provinces can be influenced by neighboring provinces. If the spatial autocorrelation is significant, it means there are strategic interactive behaviors in local economic growth and vocational education development between those provinces[27]. In this study, we used Moran’s I to test the spatial strategic interaction of economic growth and vocational education. For a row-standardized spatial weight matrix, Moran’s
I can be expressed as:
Where N is the number of spatial units indexed by i and j; X is the variable of interest; X̄ is the mean of X; and wij is a matrix of spatial weights. Negative (positive) values indicate negative (positive) spatial autocorrelation. Values range from –1 (indicating perfect dispersion) to +1 (perfect correlation). A zero value indicates a random spatial pattern. For statistical hypothesis testing, Moran’s I values can be transformed to Z-scores in which values greater than 1.96 or smaller than -1.96 indicate spatial autocorrelation that is significant at the 5% level.
A spatial weight matrix is one way of imposing the required structure on the study of spatial autocorrelation[37]. This is an N × N positive and symmetric matrix which exogenously determines for each observation (row) which locations (columns) belong in its neighborhood. We constructed contiguity-based spatial weights to describe the relationship between provinces. To the contiguity-based spatial weights, weights are defined:
wij= 1 if j ≠ i and unit j is a “neighbor” of unit i;
wij = 0 otherwise.
To test the local spatial autocorrelation assumption, we use Local Indicators of Spatial Association (LISA), the local spatial indictor, as a fundamental instrument. LISA measures the contribution of individual province on the global Moran’s I statistic. By LISA, we can indentify four type of clusters: (a) high-high association (High-High), a province with high economic level has neighboring provinces with high economic level; (b) low-low association (Low-Low), a province with low economic level has neighboring provinces with low economic level; (c) low-high association (Low-High), a province with low economic level has neighboring provinces with high economic level and (d) high-low association (High-Low), a province with high economic level has neighboring provinces with low economic level. The High-High and Low-Low locations suggests clustering of similar values (positive spatial correlation), whereas the High-Low and Low-High locations indicate spatial outliers (negative spatial correlation).
3.2.2 Elasticity and spatial econometrics model
In economics, elasticity is the ratio of the percent change in one variable to the percent change in another variable. Here, we want to measure the percentage change in per capita GDP caused by a percent change in vocational education scale.
According to traditional wisdom, the elasticity is estimated by the following regression model:
Where Yit is the per capita GDP of each province i at time t and Xit is the number of enrollments of vocational education per million population in province i at time t. i = 1, 2, ⋯, 31, t = 1995, 1999, · · ·, 2008. If β > 0, it means that the vocational education scale has positive effect on economic growth. If β > 1, it means that there is stronger elasticity which implies that the economic role of vocational education is stronger. If β is less than 1, it means that there is weak elasticity which implies that the economic role of vocational education is weak.
More and more evidences show that there is spatial dynamics of economic or social behavior between regions[38-39]. When the spatial factor is incorporated into the function, the spatial error model is:
Where W is the spatial weight matrix.
4 Results
4.1 Moran’I test
Before the investigating the relation between vocational education and economic growth, we must answer a critical question: does this spatial interaction of each variable between provinces in China really exist? To those variables, if the spatial interaction exists, the relation between those variables will be changed because the spatial interaction can moderate the relation. In spatial econometrics, it’s useful to implement Moran’s test testing the spatial interaction hypothesis[40]. Moran’s I value is a key measure of spatial autocorrelation. We compute the Moran’s I values of per capita GDP, an indicator of economy, and of total enrollments in vocational secondary schools per million persons, an indicator of vocational education scale from 1995 to 2008 in China, respectively. The values and the tests are illustrated in Table 2.
The results of Moran’I test
| Year | Per capita GDP | Vocational education scale | ||
|---|---|---|---|---|
| Moran’s I | P value | Moran’s I | P value | |
| 1995 | 0.4080[***] | 0.001 | 0.2085[**] | 0.023 |
| 1996 | 0.4250[***] | 0.001 | 0.2482[***] | 0.009 |
| 1997 | 0.4256[***] | 0.001 | 0.2330[**] | 0.011 |
| 1998 | 0.4272[***] | 0.001 | 0.2918[***] | 0.006 |
| 1999 | 0.4358[***] | 0.001 | 0.3053[***] | 0.004 |
| 2000 | 0.4343[***] | 0.001 | 0.2581[***] | 0.008 |
| 2001 | 0.4394[***] | 0.001 | 0.2573[***] | 0.007 |
| 2002 | 0.4448[***] | 0.001 | 0.2086[**] | 0.019 |
| 2003 | 0.4497[***] | 0.001 | 0.1398[**] | 0.058 |
| 2004 | 0.4623[***] | 0.001 | 0.4395[***] | 0.001 |
| 2005 | 0.4664[***] | 0.001 | 0.4848[***] | 0.001 |
| 2006 | 0.4604[***] | 0.001 | 0.3841[***] | 0.001 |
| 2007 | 0.4600[***] | 0.001 | 0.1969[**] | 0.031 |
| 2008 | 0.4528[***] | 0.001 | 0.0104 | 0.324 |
Note: * Significant at 10%.
According to the results of Table 2, the economic growths of 31 provinces in China are significantly spatially autocorrelated from 1995 to 2008. The Moran’s I value of each year is more than 0.4, and the P values show that all the spatial autocorrelation of economic growths are significant. All the Moran’s I values of economic growth are positive, which means that there are positive interactions between neighboring provinces in China. In other words, the economic growth of one province in China can be triggered and stimulated by the economic growths of neighboring provinces. It shows that the economic growths of provinces in China are spatial interacted, which is also called as ‘strategic interactions’.
Spatial pattern changes through time, so an important aspect stressed by many authors is to make the linkage between the spatial dynamics and temporal dynamic. We plot the Moran’s I values of per capita GDP in different years to detect the changing pattern of spatial interactions during the process of Chinese economic growth. As illustrated in Figure 2, the general trend of Moran’s values of economic growth in China has increased since 1995 and the average speed is 0.3%, which shows that there is spatial dynamics with the economic growth in China. As Chinese economy grows, the spatial interactions between provinces are also intensifying. At the regional level, there is spatial interaction in terms of trade, capital flows, migration, diffusion of technological innovation and information exchanges. The strategic interactions between provinces means policy spillover and policy learning, while inter-province competition also pushes provinces to share experience and to seek common development.
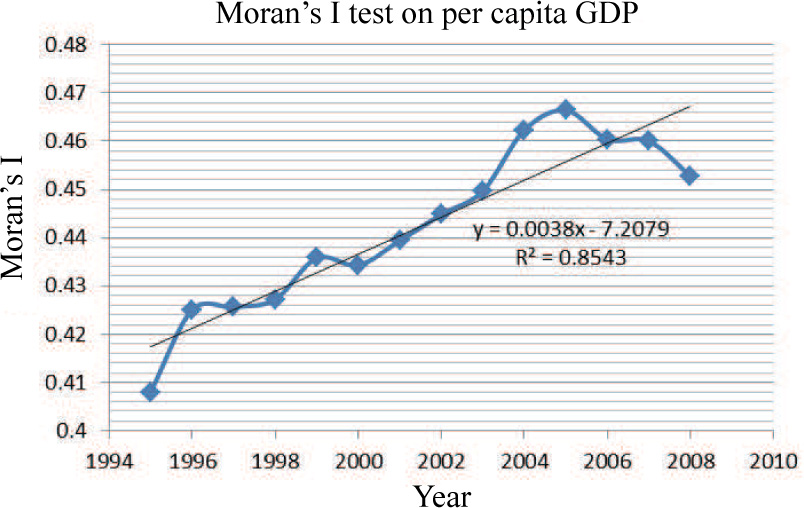
The Moran’s I test of economic growth in different years
Such spatial interactions are also detected in the vocational education field in China. According to the results of Table 2, the vocational education scales of 31 provinces in China are significantly spatially autocorrelated from 1995 to 2007, which means during those periods the scales of vocational secondary education of different provinces in China are interacted and there are strategic interactions between neighboring provinces in China. Under the leading of the central government, each province adopts special policy according to the condition of province. Every province tries to promote local economic development by developing all levels of education, in which vocational education is a key part because most of proficient labors are trained and provided in local vocational education system. The significant strategic interactions between provinces show that it’s better to incorporate the spatial feature into analysis framework to investigate the economic role of Chinese vocational education. If the spatial dynamics is ignored, there is spurious relationship.
4.2 Local spatial dynamics analysis
What is the effect of location and spatial proximity on regional economic growth and on the relation between vocational education and economic growth? Moran’s I test detects the global spatial autocorrelations in Chinese economic growth field and in vocational education field as well. Global spatial autocorrelation can predict the general spatial interactions of economic and social behaviors between spatial regions. However, when we want to scrutinize the special relationships with regional disparity and local spatial interaction, the Moran’s I test isn’t enough. According to the neo-economic growth theory, the economic growth of one region can foster economic growth in their neighborhood. As a consequence, concentration of regional development aid on those growth poles. The neo-economic growth theory predicts the regional clusters in economic growth and also implies the effect of spatial structure on economic and social behaviors.
To capture the main characteristics of local spatial interaction, we make the LISA cluster maps of per capita GDP in 2008 and to outline areas on the map that exhibit significant difference from their surroundings on the basis of economic growth. As illustrated in Figure 3, there are three kinds of clusters including High-High, Low-Low and Low-High. The High-High cluster includes Shanghai, Jiangsu and Hebei provinces. The Low-Low cluster includes Xinjiang, Qinghai, Sichuan, Chongqin, Guizhou and Yunnan provinces. The Low-High cluster includes Henan and Hainan provinces. The other 20 provinces are no significant spatial correlation with their neighboring provinces. The significantly different areas detected by LISA are traditionally termed as hotspots, hotpoints or occasionally hotbeds. The LISA shows that some areas in China are indeed much more prone to economic growth than others and the drivers of economic growth are strange in a few regions. It is therefore with little surprise that Figure 3 shows three well developed significant hotspots but still significant centers.
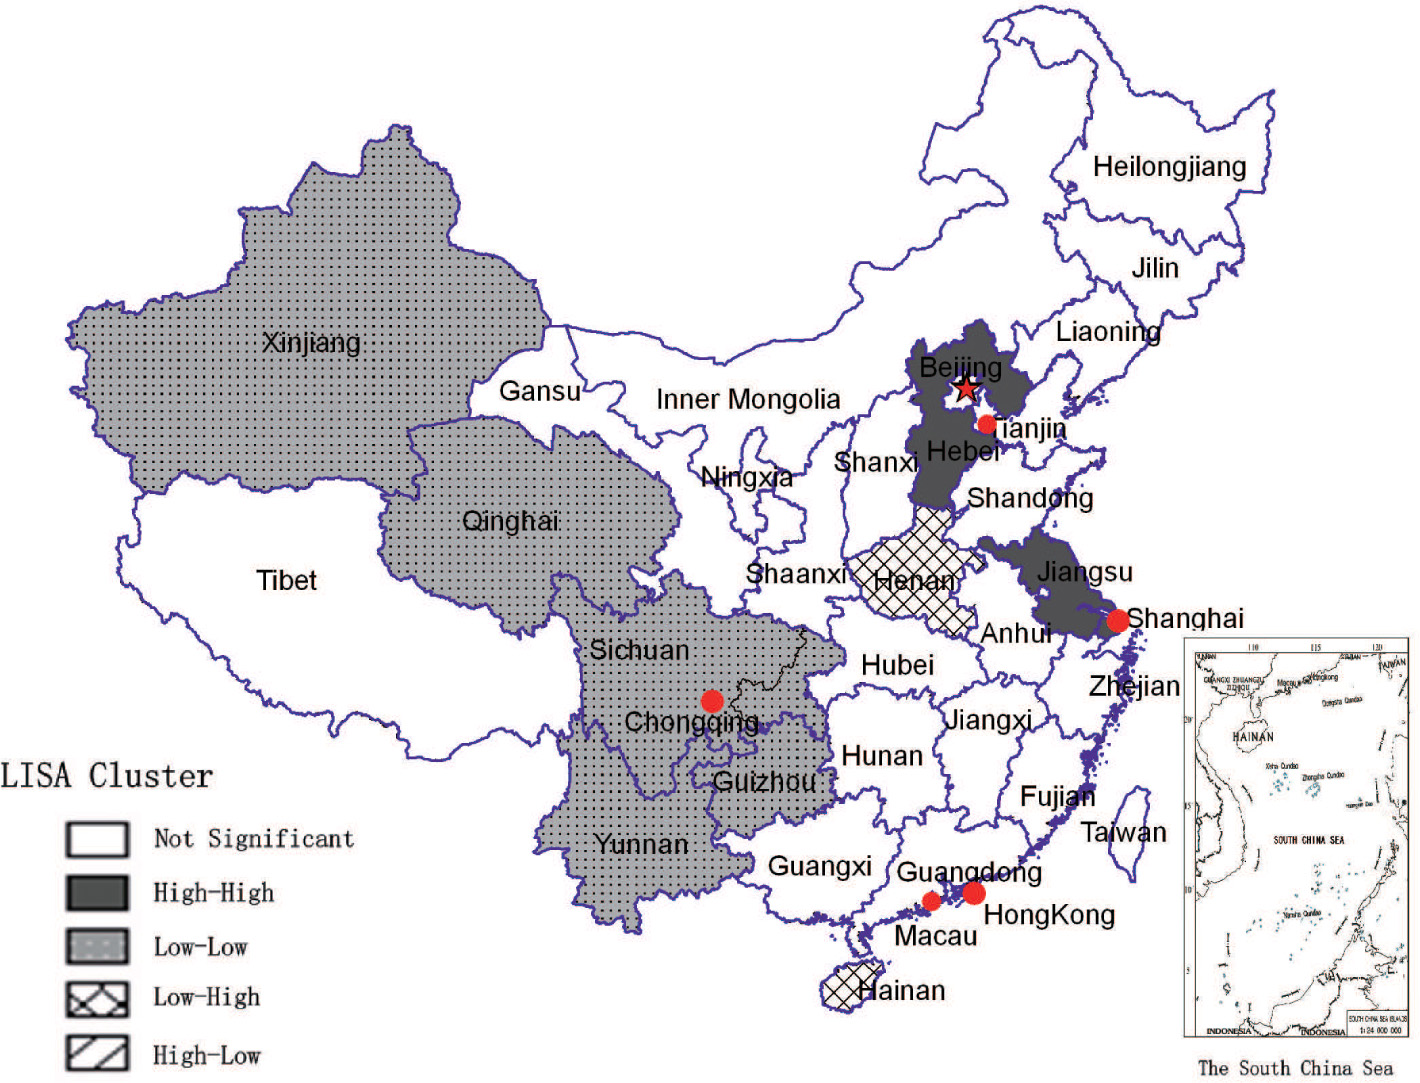
The clusters of regional economic growth
When the hotspots measuring the intensiveness of economic growth in China have been detected, the question remains as to whether there is significant relation between local economic growth and local scale of vocational education system. Is there any pattern between those two variables? To answer those questions, we divide 31 provinces into four types. The three types correspond to those three hotspots detected by LISA, which are labeled as HH, LH and LL, respectively. The remaining 20 provinces are classified as one team labeled as NO. To each type, we compute the average per capita GDP and average vocational education scales in every year from 1995 to 2008, individually and respectively. Then we compute the average value of those two variables during 1995 to 2008 and plot them in Figure 4. To facilitate comparing, we transfer the unit of per capita GDP into hundred RMB yuan.
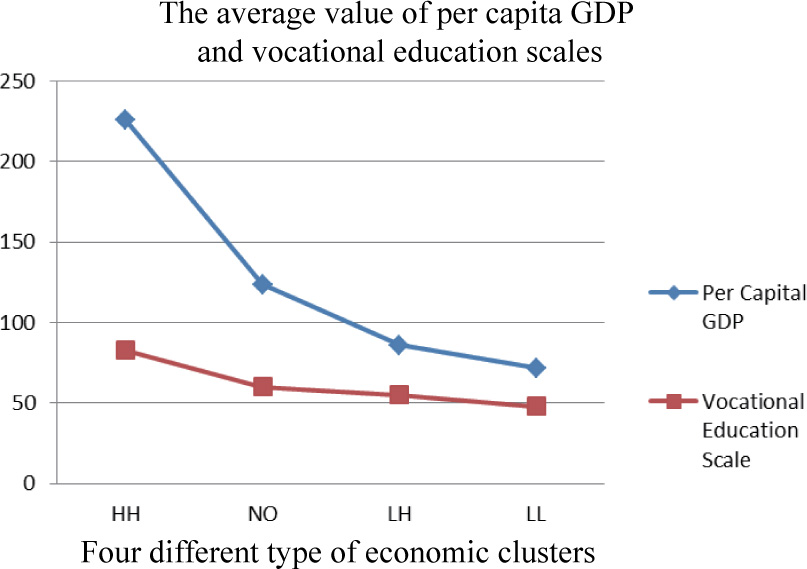
The correlation pattern of economic growth and vocational education
As illustrated in Figure 4, the hotspots of economic growth and the hotspots of vocational education scale coincide dramatically. The bigger of vocational education scale, the higher level of economic growth. The apparent spatial coincidence implies there is endogenic spatial dynamic process between economic growth and vocational education. Such spatial association implies that economic growth is effective in those regions which lie within and close to the centers of vocational education because of the relatively abundant skilled manpower resource compared with other regions.
4.3 Spatial econometrics analysis
To test the direct relationship between economic growth and vocational education, we use the natural logarithm of per capita GDP as the dependent variable and the natural logarithm of the student enrollment of vocational secondary schools per million persons as the independent variable. Table 3 presents OLS regression and spatial error model (SEM) results. The coefficients of ordinary least squares (OLS) regression are also the elasticity of economic growth with respect to vocational education scale. To those two variables, both have significant global and local spatial autocorrelations, so we use spatial error model (SEM) to capture the spatial elasticity of those variables. ‘OLS’ in the first row of in Table 3 means the ordinary least squares regression and ‘SEM’ in the first row of this table means the spatial error model.
The results of regression
| Year | OLS | SEM | ||||
|---|---|---|---|---|---|---|
| Coefficient | t-Statistic | Coefficient | z-value | Lambda | z-value | |
| 1995 | 1.110[***] | 6.553 | 1.615[***] | 12.299 | -1.811[***] | –330.541 |
| 1996 | 1.056[***] | 6.231 | 1.507[***] | 13.136 | -1.668[***] | –52.601 |
| 1997 | 0.970[***] | 5.579 | 1.447[***] | 10.861 | -1.851[***] | –97.069 |
| 1998 | 0.980[***] | 5.772 | 1.343[***] | 10.488 | -1.913[***] | –144.815 |
| 1999 | 1.001[***] | 5.549 | 1.361[***] | 10.237 | -1.892[***] | –86.105 |
| 2 | 1.002[***] | 4.837 | 1.478[***] | 8.581 | -2.040[***] | –127.250 |
| 2001 | 0.950[***] | 4.613 | 1.415[***] | 7.592 | -2.209[***] | –40.115 |
| 2002 | 0.866[***] | 4.120 | 1.393[***] | 6.590 | -2.344[***] | –48.650 |
| 2003 | 0.820[***] | 4.361 | 1.483[***] | 8.889 | -1.880[***] | –77.593 |
| 2004 | 1.002[***] | 5.879 | 1.188[***] | 9.885 | -2.153[***] | –52.395 |
| 2005 | 0.821[***] | 3.967 | 1.095[***] | 8.258 | -2.046[***] | –135.060 |
| 2006 | 0.959[***] | 3.131 | 1.584[***] | 7.791 | -1.891[***] | –84.472 |
| 2007 | 0.861[**] | 2.076 | 2.119[***] | 6.512 | -1.950[***] | –211.624 |
| 2008 | 0.565 | 1.225 | 2.287[***] | 4.364 | -2.374[***] | –61.532 |
Note: * Significant at 10%.
According to Table 3, the OLS regressions show that the coefficients are all significant from 1995 to 2006 (P < 0.01). The coefficient in 2007 is also significant (P < 0.05) while it’s not significant in 2008. The SEM regressions show that all coefficients are significant (P < 0.01) from 1995 to 2008. All those coefficients are positive which implies that the expansion of vocational education has significant positive impact on economic growth. The results confirm the argument that vocational education plays a crucial role in economic growth.
However, by comparing the coefficients of two models, we detect the difference between them. As illustrated in Figure 5, one difference is that the coefficients of SEM are bigger than those of OLS. The average coefficient of SEM is 1.522, while the average coefficient of OLS is 0.926. It implies that the impact of vocational education on economic growth under the circumstance with spatial dynamics incorporated into empirical model is bigger than under the circumstance without spatial dynamics. In other words, we may under estimate the importance of vocational education on economic growth without considering spatial dynamics.
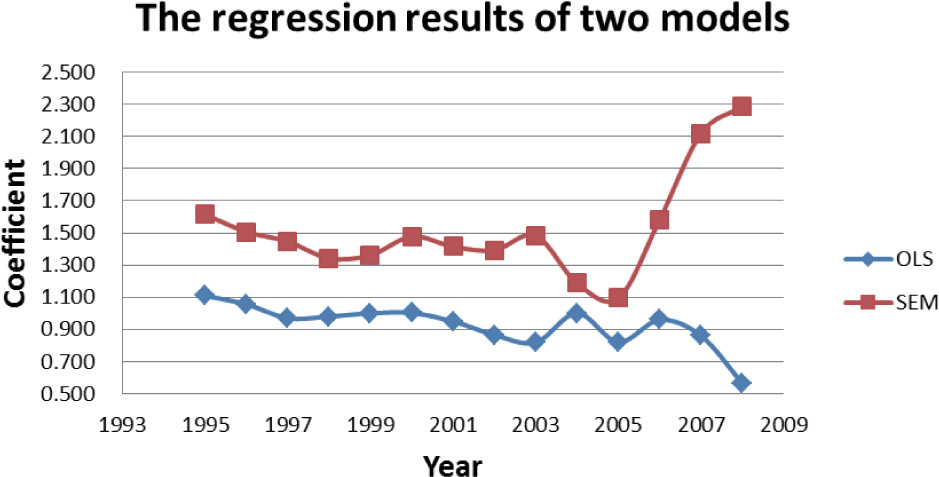
The comparison of two regression models in different years
Another difference is the trend. The curves in Figure 5 show that before 2004, the relation between vocational education and economic growth was stable while it’s changed a lot after 2004. Both curves detect the dramatic expansion of China’s vocational education to deal with the serious shortage of skilled manpower after 2004. The rapid expansion of China’s vocational education also impacted economic growth greatly. For example, both curves show that the importance of vocational education on economic growth increased from 2005 to 2006. After 2006, the curve of SEM shows that the importance is still increasing while the curve of OLS shows that it’s decreasing. We think the former is more reasonable than the latter because China expanded her vocational education after 2004 and only after two or three years such expansion policy can achieve the goal when those students enter the labor market. It means the curve should rise not fall, which implies that the curve of SEM is more convincing than the curve of OLS.
The significance of the Lambda values in spatial error model indicates that there are stronger spatial interactions between those neighboring provinces and such spatial interaction mediated the impact of vocational education on economic growth. It also shows that the OLS model is confronted with the risk of spurious regression without considering spatial dynamics and the SEM is preferred because it’s robust.
5 Discussion and conclusion
Few would deny the impact of vocational education on economic growth and social development, but the degree and mechanism of this contribution has been the subject of heated debate. Traditional wisdom assumes that there is no spatial interaction between regions or provinces in economic growth and vocational education development field. Based on this fundamental assumption, human capital theory and technical-functional theory predict the positive impact of vocational education development on economic growth while those who claim ‘vocational school fallacy’ suspect the stronger economic role of vocational education. In this research, we incorporate inter-province spatial dynamics into the framework and find some interesting results.
First, there is significant spatial autocorrelation in economic growth and vocational education development field between neighboring provinces in China. It implies that there are strategic interactions between neighboring provinces in developing their economies and vocational education systems. It also implies that there are policy transfer mechanism or interprovince policy ‘borrowing’ between provinces in China which is similar to Europe area. The significant inter-province spatial interaction means it’s improper to ignore the effects of spatial dynamics in investigating the economic role of vocational education. If the spatial dynamics is ignored, the estimate is biased and there exists spurious regression.
Second, both of the economic growth and the vocational education development in China exhibit regional clusters which are the results of local spatial autocorrelation. The results also show that the clusters of the two fields coincide to a great extent on space, which sketches the contours of the positive relation between economic growth and vocational education development. Such local spatial association implies that economic growth is effective in those regions which lie within and close to the centers of vocational education because of the relatively abundant skilled manpower resource compared with other regions.
Third, the positive impact of vocational education development on economic growth is confirmed by the OLS regression and by the spatial error model as well. However, the coefficients of SEM are bigger than those of OLS. The average coefficient of SEM is 1.522 while the average coefficient of OLS is 0.926. It shows that the elasticity of economic growth with respect to vocational education scale with spatial dynamics is bigger than the elasticity without spatial dynamics. The former implies the stronger economic role of vocational education while the latter implies the week impact. We may under estimate the importance of vocational education on economic growth without considering spatial dynamics. It also shows that the OLS model is confronted with the risk of spurious regression without considering spatial dynamics and the SEM is preferred because it’s robust.
Given its data and methodological limitations, this study can be improved in several ways. First, in this study, vocational education is used as its dependent variable. It is only one of factors which affect the growth of local economy. If more factors can be included, the prediction capacities can be improved. Second, it’s better to use spatiotemporal analysis to investigate the dynamics which is relative to time and space if the content length allows it. In a subsequent study, we will conduct a separate analysis to break through the limitations. Finally, province is the research level in this research and the sample is only 31. In a future study, we may use prefecture-level city or county level to identify the strategic interaction associations between neighbors. Those are also the future research points.
References
[1] Alam G. The role of technical and vocational education in the national development of Bangladesh. Asia-Pacific Journal of Cooperative Education, 2008, 9(1): 25–44.Suche in Google Scholar
[2] Patiniotis N, Stavroulakis D. The development of vocational education policy in Greece: A critical approach. Training, 2007: 192–202.10.1108/03090599710171503Suche in Google Scholar
[3] Psacharopoulos G, Patrinos H. Returns to investment in education: A further update. Education Economics, 2004, 12(2): 111–134.10.1080/0964529042000239140Suche in Google Scholar
[4] Ziderman A. National programmes in technical and vocational education: Economic and education relationships. Journal of Vocational Education & Training, 1997, 49(3): 351–366.Suche in Google Scholar
[5] Wang Y, Yao Y. Sources of China’s economic growth 1952–1999: Incorporating human capital accumulation. China Economic Review, 2003, 14(1): 32–52.10.1016/S1043-951X(02)00084-6Suche in Google Scholar
[6] Barabascha A, Huangb S, Lawsonb R. Planned policy transfer: The impact of the German model on Chinese vocational education. Compare: A Journal of Comparative and International Education, 2009, 39(1): 5–20.10.1080/03057920802265566Suche in Google Scholar
[7] Terrill R. The new Chinese empire. UNSW Press, 2003.Suche in Google Scholar
[8] Baicker K. The spillover effects of state spending. Journal of Public Economics, 2005, 89(2): 529–544.10.3386/w8383Suche in Google Scholar
[9] Porte C, Pochet P, Room B. Social benchmarking, policy making and new governance in the EU. Journal of European Social Policy, 2001, 11(4): 291–299.10.1177/095892870101100401Suche in Google Scholar
[10] LeSage J, Pace R. Introduction to spatial econometrics. Chapman & Hall/CRC, 2009.10.1201/9781420064254Suche in Google Scholar
[11] Psacharopoulos G, Loxley W. Diversified secondary education and development: Evidence from Colombia and Tanzania. Baltimore: Johns Hopkins University Press, 1985.Suche in Google Scholar
[12] Haq M, Haq K. Human development in South Asia. Oxford University Press, 1998.Suche in Google Scholar
[13] Becker G. Human capital: A theoretical analysis with special reference to education. New York and London: Columbia University Press, 1964.Suche in Google Scholar
[14] Foster P. The vocational school fallacy in development planning[C]// Anderson, Bowman. Education and Economic Development. Chicago: Aldine Press, 1965.Suche in Google Scholar
[15] Blaug M. Education and the employment problem in developing countries. International Labour Office, 1973.Suche in Google Scholar
[16] Tilak J. Vocational education and training in Asia. Journal of Educational Planning and Administration, 2003, 17(1): 279–294.10.1007/978-94-017-3368-7_46Suche in Google Scholar
[17] King K, Martin C. The vocational school fallacy revisited: Education, aspiration and work in Ghana 1959–2000. International Journal of Educational Development, 2002, 22(1): 5–26.10.1016/S0738-0593(00)00083-3Suche in Google Scholar
[18] Dougherty C. Unit costs and economies of scale in vocational and technical education: Evidence from the People’s Republic of China. Economics of Education Review, 1990, 9(4): 389–394.10.1016/0272-7757(90)90020-6Suche in Google Scholar
[19] Tilak J. Vocational education in south Asia: Problems and prospects. International Review of Education, 1988, 34(2): 244–257.10.1007/BF01874549Suche in Google Scholar
[20] Sultana R. Vocational schooling and economic development: A Maltese case study. International Journal of Educational Development, 1994, 14(1): 75–87.10.1016/0738-0593(94)90010-8Suche in Google Scholar
[21] Gu J F. Spatial dynamics and determinants of county-level education expenditure in China. Asia Pacific Education Review, 2012, 13(4): 617–634.10.1007/s12564-012-9224-ySuche in Google Scholar
[22] Gu J F. Price collusion or competition in US higher education. Studies in Higher Education (ahead-of-print), 2013: 1–25.10.1080/03075079.2013.823929Suche in Google Scholar
[23] Gu J F. Spatial dynamics and determinants of county-level education expenditure in China. Asia Pacific Education Review, 2012, 13(4): 617–634.10.1007/s12564-012-9224-ySuche in Google Scholar
[24] Gu J F. Harmonious expansion of China’s higher education: A new growth pattern. Higher Education, 2012, 63(4): 513–528.10.1007/s10734-011-9455-6Suche in Google Scholar
[25] Ghosh S. Strategic interaction among public school districts: Evidence on spatial interdependence in school inputs. Economics of Education Review, 2010, 29: 440–450.10.1016/j.econedurev.2009.10.001Suche in Google Scholar
[26] Greenbaum R. A spatial study of teachers’ salaries in Pennsylvania school districts. Journal of Labor Research, 2002, 23(1): 69–86.10.1007/s12122-002-1019-1Suche in Google Scholar
[27] Rincke J. Competition in the public school sector: Evidence on strategic interaction among US school districts. Journal of Urban Economics, 2006, 59(3): 352–369.10.1016/j.jue.2005.12.003Suche in Google Scholar
[28] Rincke J. Policy diffusion in space and time: The case of charter schools in California school districts. Regional Science and Urban Economics, 2007, 37(5): 526–541.10.1016/j.regsciurbeco.2007.02.001Suche in Google Scholar
[29] McMillen D, Sinell L, Waddell G. Spatial competition and the price of college. Economic Inquiry, 2007, 45(4): 817–831.10.1111/j.1465-7295.2007.00049.xSuche in Google Scholar
[30] Moran P A. Notes on continuous stochastic phenomena. Biometrika, 1950, 37(1–2): 17–23.10.1093/biomet/37.1-2.17Suche in Google Scholar
[31] Bai C E, Ma H, Pan W. Spatial spillover and regional economic growth in China. China Economic Review, 2012, 23(4): 982–990.10.1016/j.chieco.2012.04.016Suche in Google Scholar
[32] Sen A. Large sample size distribution of statistics used in testing for spatial correlation. Geographical Analysis, 1976, 8(2): 175–184.10.1111/j.1538-4632.1976.tb01066.xSuche in Google Scholar
[33] Cliff A D, Ord J K. Spatial processes: Models & applications. London: Pion, 1981.Suche in Google Scholar
[34] Tobler W R. Smooth pycnophylactic interpolation for geographical regions. Journal of the American Statistical Association, 1979, 74(367): 519–530.10.1080/01621459.1979.10481647Suche in Google Scholar PubMed
[35] Vitali S, Napoletano M, Fagiolo G. Spatial localization in manufacturing: A cross-country analysis. Regional Studies, 2013, 47(9): 1534–1554.10.1080/00343404.2011.625006Suche in Google Scholar
[36] Kaylen M T, Pridemore W A. A reassessment of the association between social disorganization and youth violence in rural areas. Social Science Quarterly, 2012, 92(4): 978–1001.10.1111/j.1540-6237.2011.00808.xSuche in Google Scholar
[37] Getis A, Mur J, Zoller H. Spatial econometrics and spatial statistics. Palgrave Macmillan, 2004.Suche in Google Scholar
[38] LeSage J, Pace R. Introduction to spatial econometrics. Chapman & Hall/CRC, 2009.10.1201/9781420064254Suche in Google Scholar
[39] Anselin L, Florax R, Rey S. Advances in spatial econometrics: Methodology, tools and applications. Springer, 2004.10.1007/978-3-662-05617-2Suche in Google Scholar
[40] Egger P, Pfaffermayr M. Spatial convergence. Papers in Regional Science, 2006, 85(2): 199–215.10.1111/j.1435-5957.2006.00084.xSuche in Google Scholar
© 2014 Walter de Gruyter GmbH, Berlin/Boston
Artikel in diesem Heft
- Spatial Dynamics, Vocational Education and Chinese Economic Growth
- The Differential Algorithm for American Put Option with Transaction Costs under CEV Model
- Nonlinear Dynamics of International Gold Prices: Conditional Heteroskedasticity or Chaos?
- Design and Pricing of Chinese Contingent Convertible Bonds
- A Robust Factor Analysis Model for Dichotomous Data
- Non-linear Integer Programming Model and Algorithms for Connected p-facility Location Problem
- Uncertain Comprehensive Evaluation Method Based on Expected Value
- MSVM Recognition Model for Dynamic Process Abnormal Pattern Based on Multi-Kernel Functions