Experimental study on the durability of FRP bars reinforced concrete beams in simulated ocean environment
-
Zhiqiang Dong
 and
Jinlong Lian
and
Jinlong Lian

Abstract
In this paper, the flexural performance of fiber-reinforced polymer (FRP) bars reinforced concrete (RC) beams after conditioning in a simulated seawater wet-dry cycling environment for 6, 9 and 12 months is experimentally investigated. Two types of FRP bars, i.e. basalt FRP (BFRP) bars and steel-FRP composite bars (SFCBs), are adopted. Steel bars are employed for comparison. During the conditioning, a constant load is coupled to the beams. A total of 24 simply supported beams are tested. In addition, microscopic damage to the conditioned BFRP bars is detected by scanning electron microscopy (SEM). The test results indicated that total corrosion was observed at the surface of the bottom longitudinal steel bars after a maximum exposure of 12 months. However, the degradation of the macro-mechanical properties of the steel bars RC beam was not distinct. The ultimate load of the BFRP bars RC beams after 6 months, 9 months and 12 months was reduced by 22%, 33% and 42%, respectively. The yield load and ultimate load of the SFCBs RC beams were reduced by a maximum of 18% and 38%, respectively. The SEM observations revealed that there were distinct damages at the outer layer of the BFRP bars after 12-month conditioning.
1 Introduction
For traditional steel bars reinforced concrete (RC) structures that service in harsh environments (e.g. marine environment and deicing salt environments), the corrosion rate of internal steel bars is accelerated due to excess chloride ions. However, for fiber-reinforced polymer (FRP) bars, the enrichment of chloride ions does not accelerate their performance degradation [1]. Thus, FRP bars are ideal replacements for steel bars in high-chloride environments. Conventional FRP bars include carbon FRP (CFRP) bars, aramid FRP (AFRP) bars, and glass FRP (GFRP) bars. In recent years, additional research has addressed newly developed basalt FRP (BFRP) bars [2], [3], [4]. Researchers have also developed various types of hybrid FRP bars, such as steel-FRP composite bars (SFCBs), B/SFRP bars, and B/CFRP bars, based on different performance requirements [5], [6], [7].
Although FRP bars are known to be resistant to chlorine attack, they are not immune to all engineering environments. Their mechanical properties are also reduced after environmental attacks. Current research is primarily focused on testing the degradation of FRP bars in various simulated corrosive environments, e.g. acid, alkali, salt, aqueous solution, moist concrete environments, ultraviolet (UV) radiation, and freeze-thaw (FT) [8], [9], [10], [11], [12]. Based on the accelerated degradation data obtained in the laboratory, the long-term mechanical properties of the FRP bars in the experiment are predicted by the Arrhenius theory, with the assumption that temperature does not change the corrosion mechanism [13], [14], [15], [16]. For FRP bars that are employed as internal reinforcements, researchers have conducted extensive tests on bond degradation after simulated environment attacks [17], [18], [19], [20], [21], [22], [23].
However, existing research has identified several difficulties. First, the correlation between the data obtained in the laboratory and the data obtained in a real service environment is not easily determined. Chen et al. [13] noted that long-term data, including data from real applications, should be collected to validate accelerated tests and prediction models. For example, Mufti et al. [24] investigated the durability of GFRP bars in concrete in field structures across Canada; no degradation was observed after service for 5–8 years. Second, the coupling effect of sustained stress on the degradation of FRP bars is important but has not been sufficiently investigated [15], [25], [26]. The existence of tensile stresses will promote the opening of micro-cracks in the matrix and provide a larger number of potential channels for the penetration of corrosive ions. Third, bond durability tests are primarily conducted using direct pull-out specimens, which cannot simulate the actual stress state of the FRP bar in a beam [18]. Fourth, investigations on the macro-mechanical properties of FRP bars RC members (e.g. beams, slabs, and columns) after exposure to simulated environments are not sufficient. Sen et al. [27] experimentally investigated the durability of S-2 glass/epoxy strands in pretensioned beams that were subjected to wet-dry cycles to simulate tidal effects. However, a complete loss of the effectiveness of the fiberglass strands after an average of 6 months for the pre-cracked beams and 15 months for the uncracked beams was obtained. Tannous [28] tested 10 beams that were each reinforced with two 10-mm E-glass/polyester or E-glass/vinyl ester FRP bars after they were subjected to deicing salt solutions after 1-year and 2-year periods. Similarly, a significant loss of strength was observed. The GFRP bars in these studies, which exhibit unsatisfactory durability, were early products. With an improvement of material properties, the research by Laoubi et al. [29] indicated that the FT cycles and sustained bending stresses had no significant effect on the behaviors of the concrete beams reinforced with sand-coated glass FRP composite bars. Research on the mechanical behaviors of the prestressed CFRP bars RC structures [30] and GFRP bars reinforced fiber-reinforced-concrete structures [31] after exposure to environmental attacks has also been conducted. However, durability studies on FRP bars have generally focused on the material level (i.e. FRP bars) and the bond level (i.e. bond between FRP bars and concrete), whereas research on the member level (i.e. FRP bars RC structures), especially for the newly developed BFRP bars, is not sufficient. Although the evaluation of the long-term performance of FRP bars and bond performance with concrete is important, research on the long-term performance of FRP bars RC structures is closer to reality and more instructive.
In the study of Dong et al. [32], the mechanical performance of SFCBs/steel bars RC sea sand concrete beams after exposure to a seawater wet-dry cycling environment for a maximum of 3 months was investigated. Some beneficial conclusions were obtained. However, the performance trend for the 3-month period was not stable. For this reason, concrete beams reinforced with BFRP bars, SFCBs, and steel bars, respectively, are conditioned in a simulated seawater wet-dry cycling environment for 6, 9 and 12 months. Their long-term performance is investigated. In addition, the microstructures of the cross-sections of the BFRP bars in the beams with the longest duration are tested by scanning electron microscopy (SEM). In this paper, the coupling effect of various environmental factors is considered, and accelerated tests are performed as close to the service environment as possible. This study accumulated very useful data for the long-term performance of FRP bar-RC beams (especially for BFRP bars and SFCBs).
2 Materials and methods
2.1 Materials
2.1.1 Reinforcing bars
As shown in Figure 1, three types of reinforcements, i.e. steel bar, BFRP bar, and SFCB, were adopted as bottom longitudinal reinforcements. Table 1 shows the tensile properties as measured according to ACI440.3R-12 [33] by the authors. The SFCB was the same as the SFCB employed by Dong et al. [32] with 30 bundles of 2400 tex basalt fiber-reinforced vinyl ester polymer longitudinal wrapped outside and 8.0-mm steel bar inside. The rib depth and nominal diameter of the SFCB were approximately 1.0 mm and 12.5 mm, respectively. The surfaces of the BFRP bars were ribbed with a nylon laminate during pultrusion, and the depth of surface rib was 0.06 d, where d was the nominal diameter. For comparison, traditional steel bars were also adopted. As shown in Table 1, the nominal diameters of the BFRP bars and steel bars were 8.0 mm and 10.0 mm, respectively.
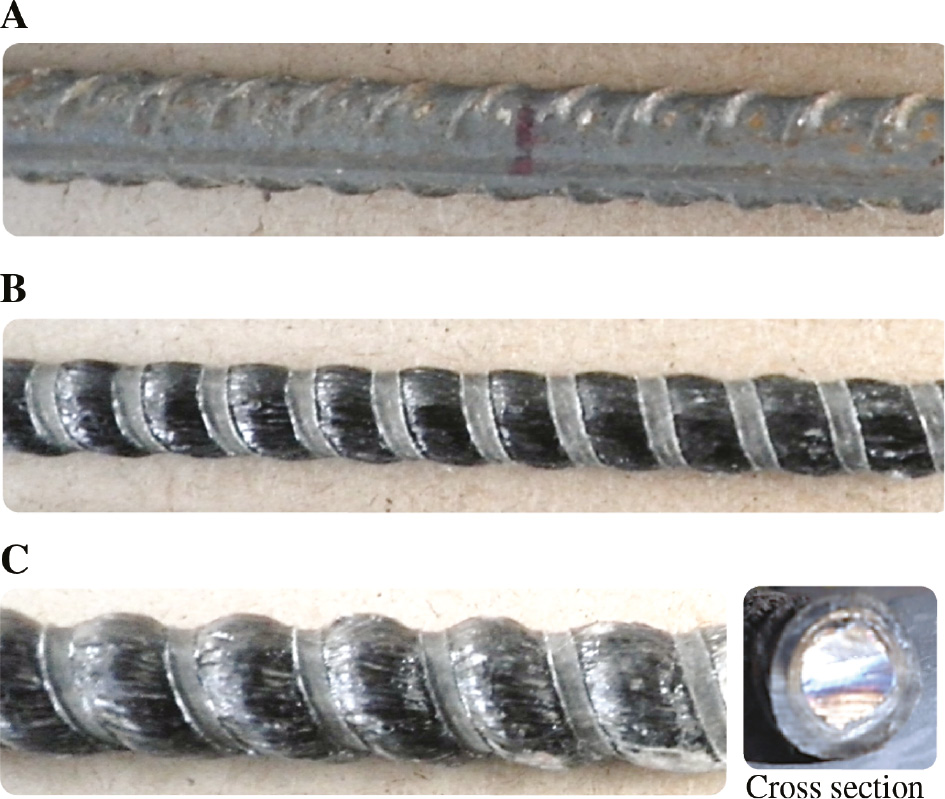
Longitudinal reinforcing bars in this study. (A) Steel bar, (B) BFRP bar and (C) SFCB.
Tested properties of the reinforcing bars.
| No. | Fiber | Resin | Nominal diameter (mm) | Yield strength (MPa) | Ultimate strength (MPa) | Elastic modulus (GPa) | Ultimate strain (%) |
|---|---|---|---|---|---|---|---|
| Steel bar | – | – | 10.0 | 576.6 | 689.2 | 211.4 | 9.1 |
| BFRP bar | Basalt | Vinyl ester | 8.0 | NA | 1400.7 | 60.2 | 2.3 |
| SFCB | Basalt | Vinyl ester | 12.5 | 244.5 | 480.9 | 97.8 | 5.0 |
NA means not available.
2.1.2 Concrete
The concrete was mixed in the laboratory; Table 2 lists the detailed concrete mix design. The water/cement (W/C) ratio was 0.41. The size of the coarse aggregate ranged from 5 to 15 mm. The concrete compressive strengths were determined using 150×150×150-mm cube specimens, and the tested 28-day compressive strengths were 41.7 MPa.
Concrete mix design.
| W/C | Water (kg/m3) | Cement (kg/m3) | Sand (kg/m3) | Coarse aggregate (kg/m3) |
|---|---|---|---|---|
| 0.41 | 192 | 470 | 628 | 1251 |
2.2 Conditioned environment in the laboratory
2.2.1 Coupled sustained load
As shown in Figure 2A, a sustained load was applied to two identical beams to simulate the load in the service condition. Refer to Dong et al.’s study [32] for the detailed process of the application of the sustained load. The sustained loading regime was identical to the loading regime of the following flexural tests. A similar sustained loading device was adopted by many other scholars [17], [34]. Based on the test results of the control beams, the applied sustained load was set to 30 kN for all conditioned beams (i.e. the load on each end steel plate was 15 kN, as shown in Figure 2A), which was slightly higher than the cracking load (about 20 kN). Then, the beam specimens were placed in a homemade wet-dry cycling tank, as shown in Figure 2B.
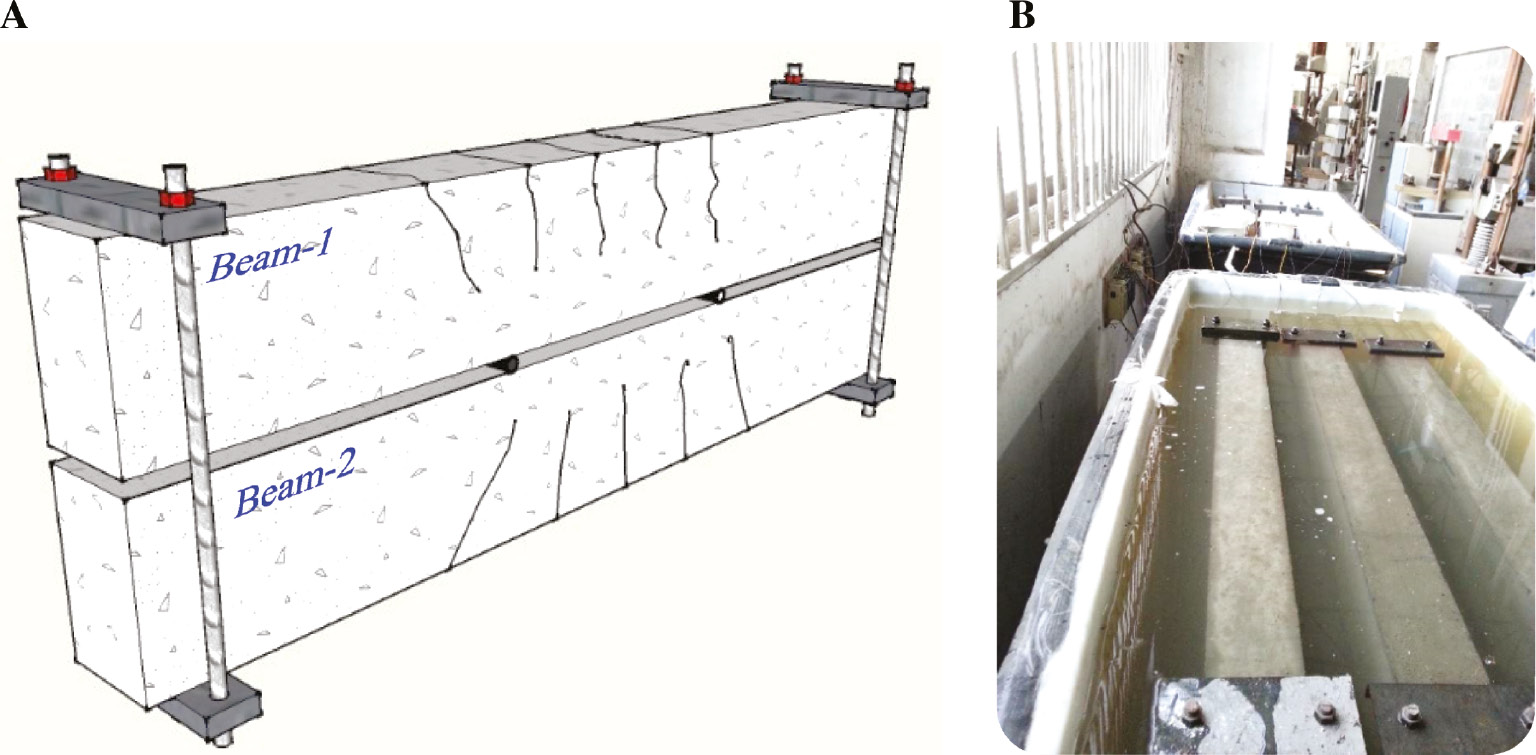
Beam specimens and wet-dry cycling environment. (A) Coupled sustained load and (B) Conditioned in tanks.
2.2.2 Seawater wet-dry cycling tanks
Figure 3A provides an overview of the automatic wet-dry cycling tanks. The inner structure of the tank is illustrated in Figure 3B. The walls and floor of the plastic tank were wrapped with thermal insulation cotton. The top sandwich cover plate was composed of bamboo wood and waterproof board, with thermal insulation cotton embedded in the middle of the plate. The ventilating fan and hole on the cover plate were used to accelerate drying of the specimen. In addition, the tank was equipped with a heating rod to heat the seawater. Due to the limitation of the power of the heating rod and the change in the ambient air temperature during the 1-year period, water temperature was maintained in the range of 20–35°C, with high temperatures in summer and low temperatures in winter. The tank was also equipped with a surfing pump to promote the flow of seawater. Every 12 h, one pump will pump seawater from one side to the other (it takes approximately 10 min). A solution that simulates seawater was created by adding sodium chloride to tap water with a mass fraction of 5%. The concentration was maintained by keeping the water level constant.
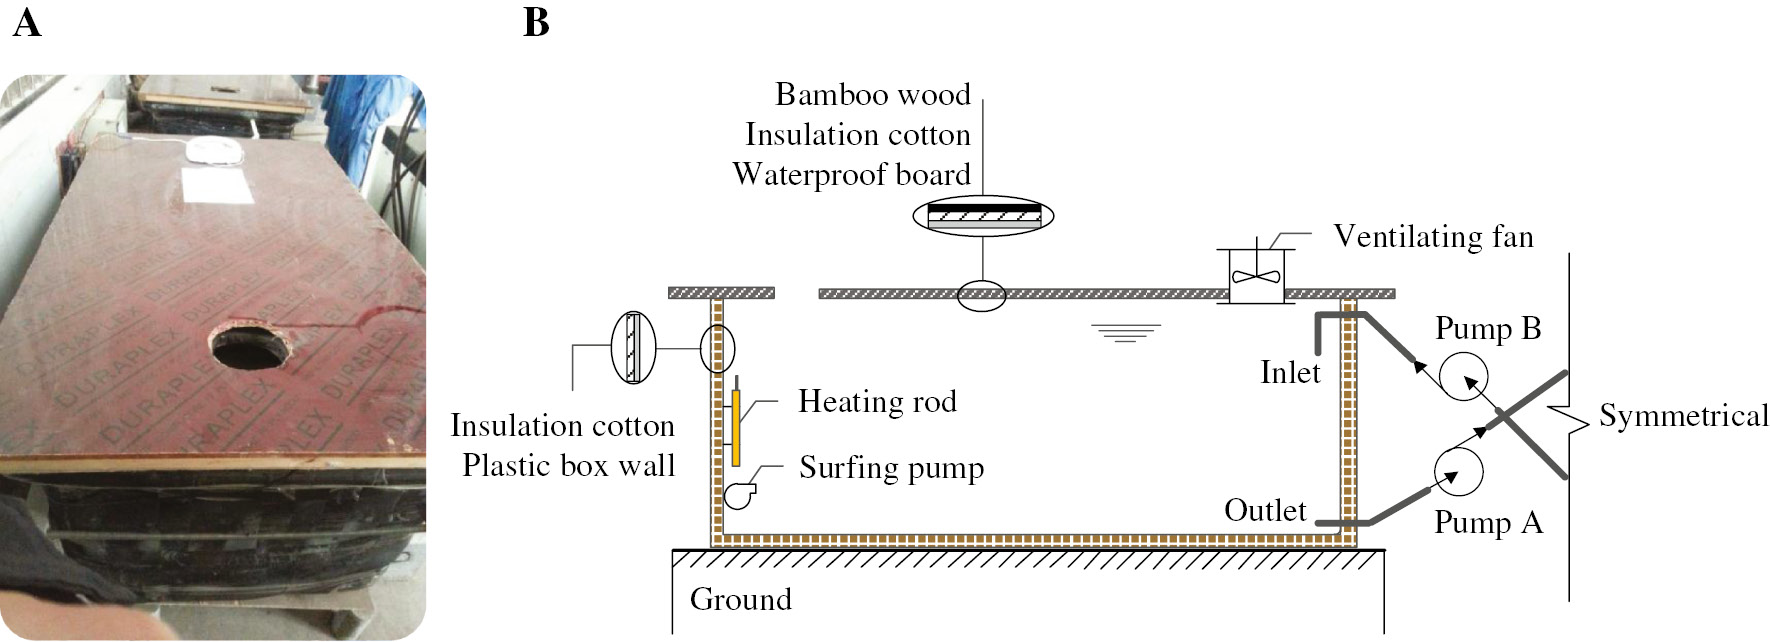
Automatic wet-dry cycling tanks. (A) Overview and (B) Schematic of the inner structure.
2.3 Beam details and test setup
The beam details are shown in Figure 4. The beam’s cross-section and span were 120×200 mm and 1200 mm, respectively. As shown in Figure 4A, the tensile reinforcements of the steel bar-reinforced beams comprised two 10.0-mm steel bars, the tensile reinforcements of the BFRP bar-reinforced beams comprised three 8.0-mm BFRP bars, and the tensile reinforcements of the SFCB-reinforced beams consisted of two 12.5-mm SFCBs. The top bars and stirrups were steel bars with a diameter of 6.0 mm and a yield strength of 240 MPa. The concrete cover was 20 mm. The calculated reinforcement ratios (ρf) and balanced reinforcement ratios (ρfb) of the three types of beams are shown in Table 3. As shown in Table 3, the steel bars RC beams and SFCBs RC beams are under-reinforced, which means the bottom reinforcements will yield before concrete crushing. The reason for this design is to ensure a ductile failure mode. The BFRP bars RC beams are over-reinforced, which means the beams are controlled by concrete crushing. The reason for this design is to avoid low cross-section stiffness and sudden brittle failure mode due to the rupture of BFRP bars.
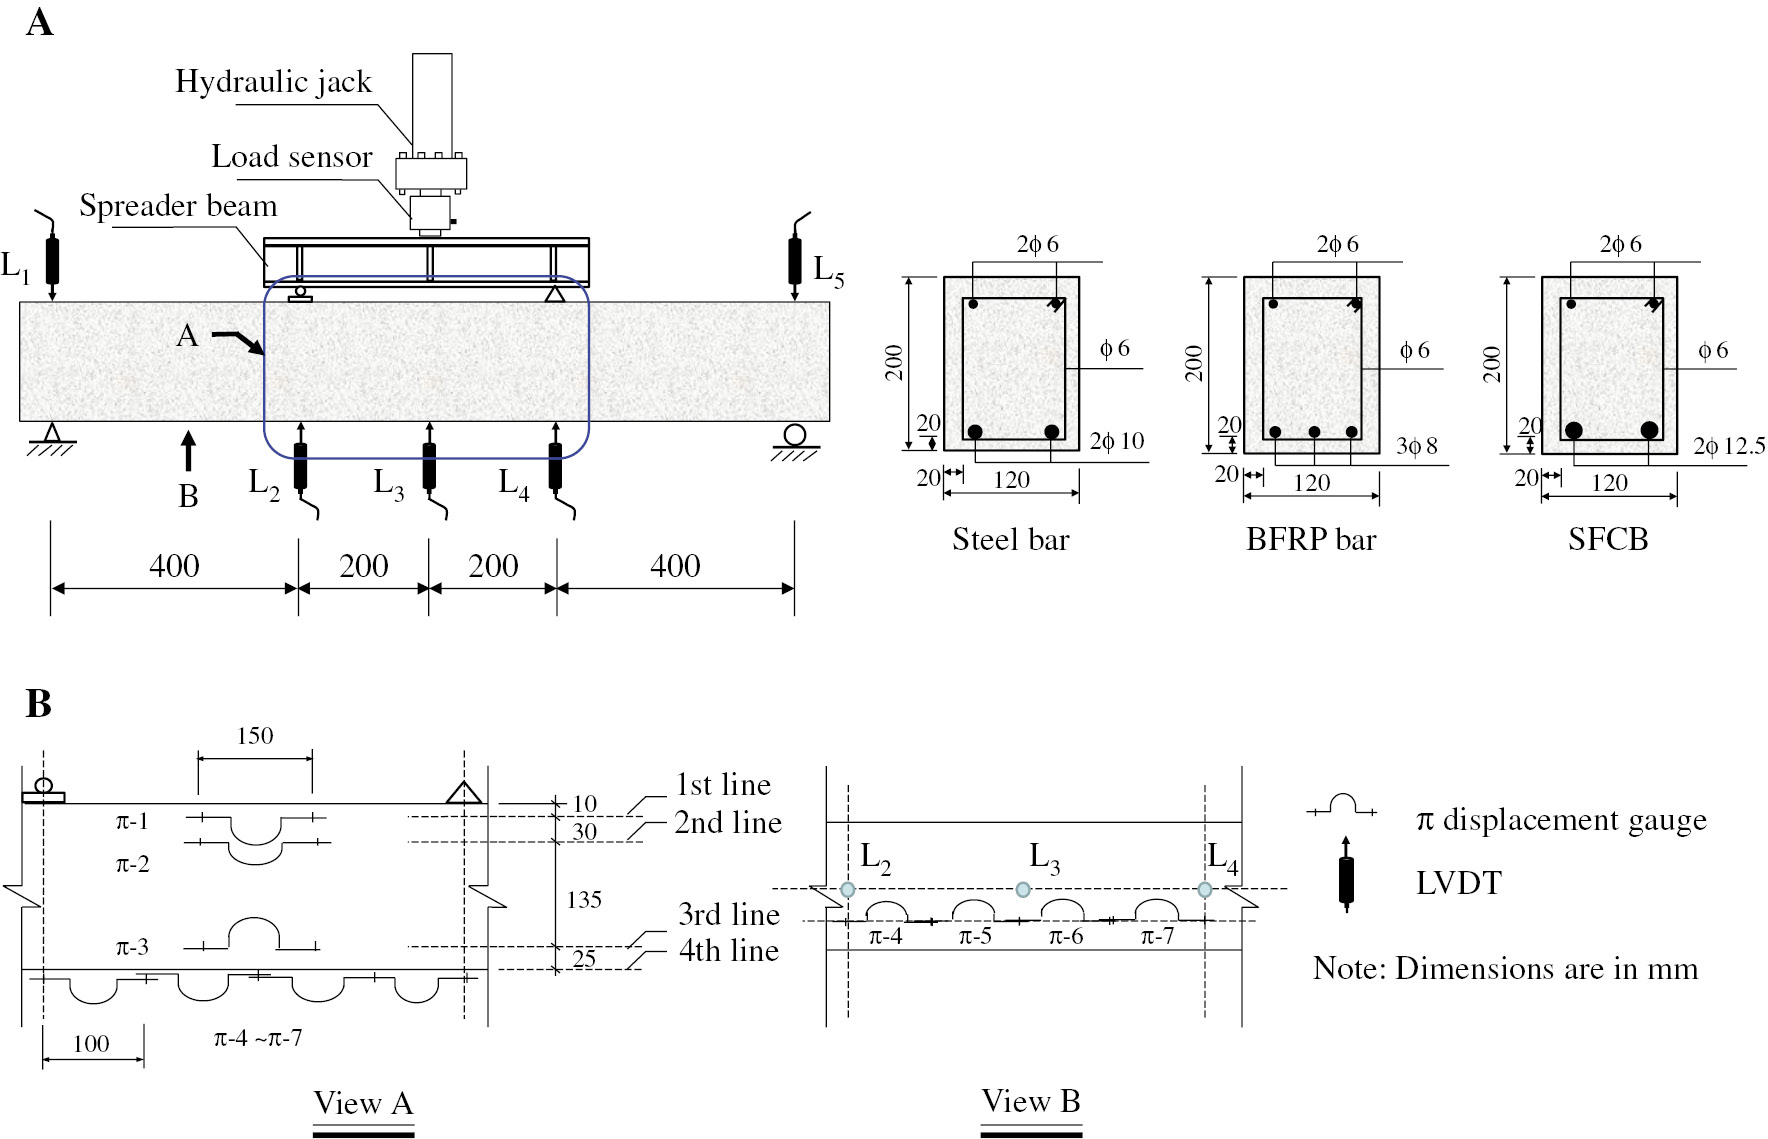
Beam details and test setup. (A) Loading system and beam details and (B) Arrangement of test devices.
The relationship between reinforcement ratios and balanced reinforcement ratios.
| Steel bars RC beam | BFRP bars RC beam | SFCBs RC beam | ||||
|---|---|---|---|---|---|---|
| Control beams | ρf | ρfb | ρf | ρfb | ρf | ρfb |
| 0.00748 | 0.02737 | 0.00714 | 0.00246 | 0.01177 | 0.06721 | |
| ρf <ρfb | ρf >ρfb | ρf <ρfb | ||||
| (under-reinforced) | (over-reinforced) | (under-reinforced) | ||||
The adopted concrete strength is 41.7 MPa for the control group.
As shown in Figure 4A, all beams were tested with four-point bending over a simply supported span of 1.2 m and a shear span of 0.4 m. Considering that the shear span-to-depth ratio was small (equal to 2), stirrups with a spacing of 80 mm were used to avoid shear failure. A steel spreader beam was used to transform the load from the hand-operated hydraulic jack (Jiangsu Yuli Mechanical and Electrical Equipment Group Co., Ltd., Taizhou, China). Prior to beam yielding, the loading was paused every 5 kN to detect the widths of the cracks and paint the cracking pattern. The loading rate was approximately 5 kN/min. After beam yielding, if any, the load was continuously applied at the same rate until beam failure occurred. Three linear variable differential transducers (LVDTs, Tokyo Sokki Kenkyujo Co., Ltd., Tokyo, Japan) were installed under the beams at the midspan and loading points, and two LVDTs were installed on the beam supports to offset their settlement. The appearance and development of cracks were observed by visual inspection, and their widths were measured using a digital crack width viewer (Tianjin Jewel Electronic Instrument Co., Ltd., Tianjin, China). As shown in Figure 4B, π displacement gauges (Tokyo Sokki Kenkyujo Co., Ltd., Tokyo, Japan) were attached to the side and bottom surfaces at the pure bending section to detect the concrete strains. The load sensor was provided by Shanghai Zhen-Dan Sensor Instrument Factory, Shanghai, China.
2.4 Test program
2.4.1 Mechanical property test
A total of 24 beams with two identical beams for each condition were constructed and tested. There were six control beams and 18 conditioned beams. The conditioning ages were 6, 9 and 12 months. The beams’ properties before and after exposure, such as the midspan deflection, the moment-curvature of the pure bending section, the crack distribution, and the crack width, were tested and compared. Note that the SFCBs and BFRP bars RC beams with 12 months of exposure were conditioned in a wet-dry cycling environment for the first 6 months and immersed in one tank for the following 6 months due to the expropriation of the laboratory site occupied by the other tank.
2.4.2 Scanning electron microscopy observation
SEM observations were conducted on the internal BFRP bars after exposure for 12 months. The BFRP samples were taken from the beam specimen after the flexural test. They were cut with a low-speed saw and polished with sandpaper and a fluffy cloth to eliminate damage caused by cutting. SEM observations were conducted on a JSM-6510 type SEM (JEOL Ltd., Japan). These observations primarily focused on the outer parts of the bar samples because they were the main portion subjected to and affected by a concrete environment.
3 Results
3.1 Failure modes and surface conditions of internal reinforcements
Figure 5 shows the typical failure modes of test beams at different ages. The failure modes of the steel bars RC beams before and after conditioning did not change, and all steel bars yielded first and then concrete crushed in the compression zone. For the BFRP bars RC beams and the SFCBs RC beams, the failure modes of the control specimens were concrete crushed, whereas all conditioned beams failed due to rupture of the BFRP bars/SFCBs.
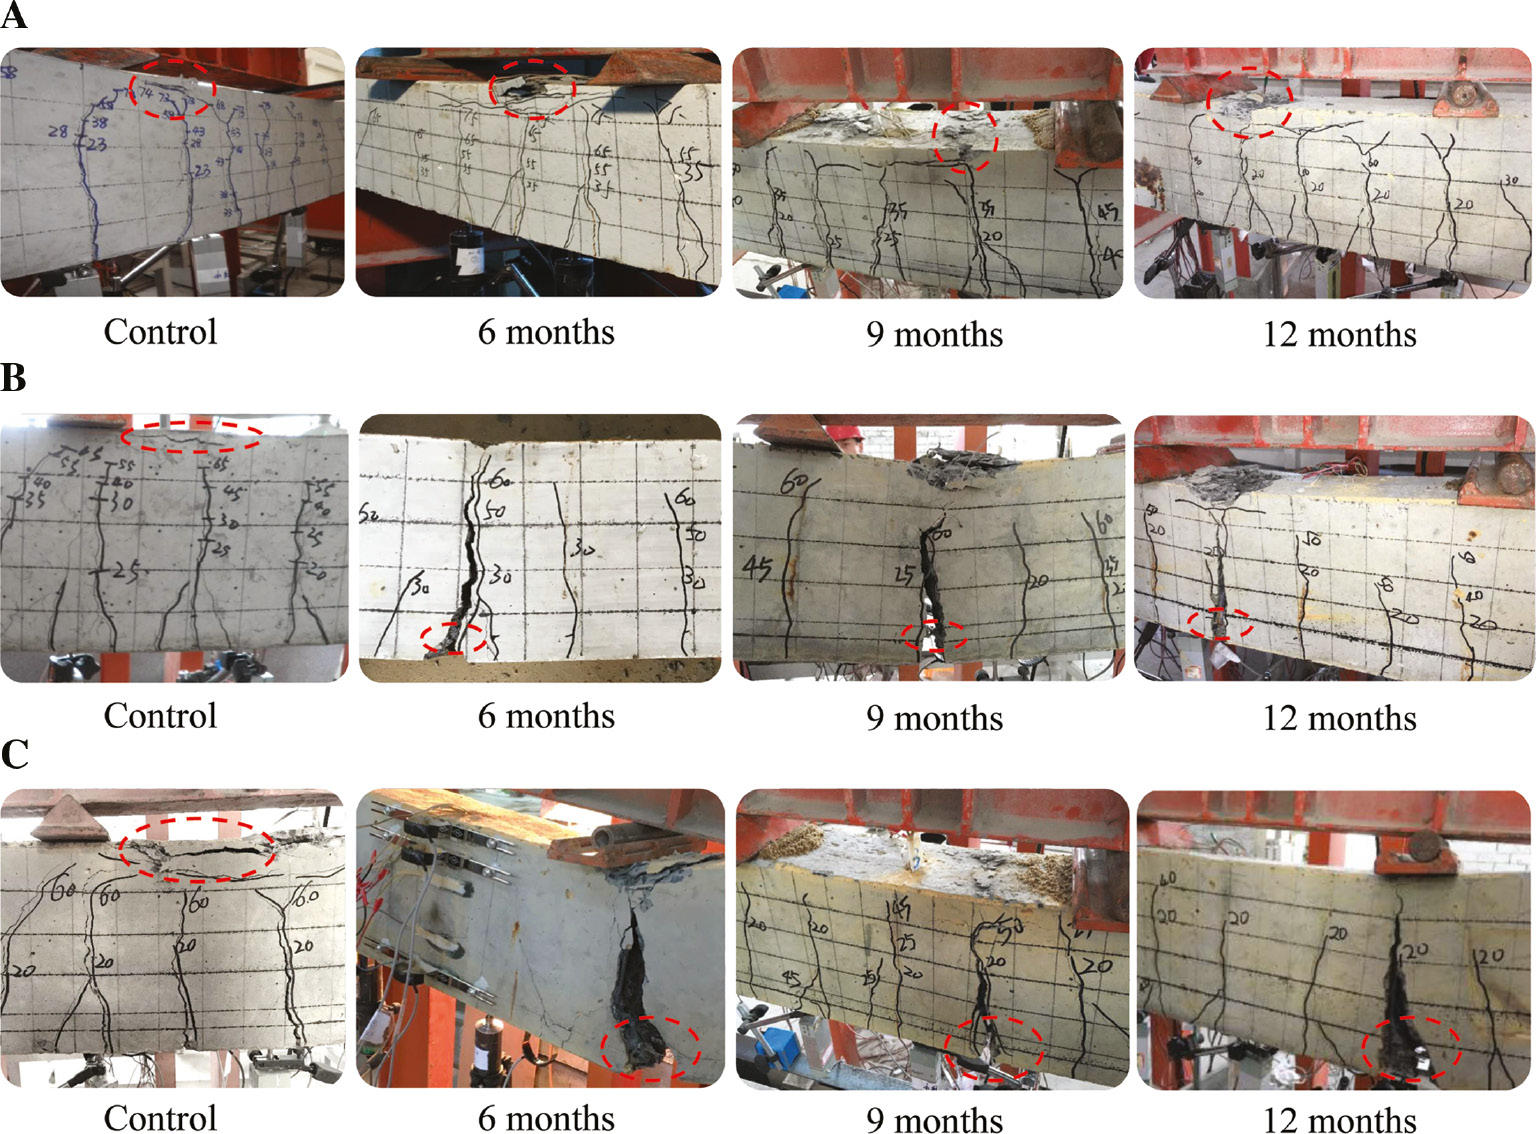
Typical failure modes of beams. (A) Steel bars RC beams, (B) BFRP bars RC beams and (C) SFCBs RC beams.
As shown in Figure 6, the concrete cover was removed to expose the internal reinforcements at the end of the bending test. As shown in Figure 6A, the steel bars were severely rusted along the full length of the beam. The detailed corrosion rate was not tested due to the plastic deformation of the steel bars after the bending test. As shown in Figure 6B, the surface color of the BFRP bars turned to brown and the fracture section of the BFRP bars was smooth. As shown in Figure 6C, in the fracture section of the SFCBs, the surface BFRP layer ruptured and separated from the ruptured inner steel bar. The BFRP bars in the 12-month group were cut and sampled for SEM observation. Because the BFRP layer of the SFCB is the same as the BFRP layer of the BFRP bar, the SFCB was not sampled.
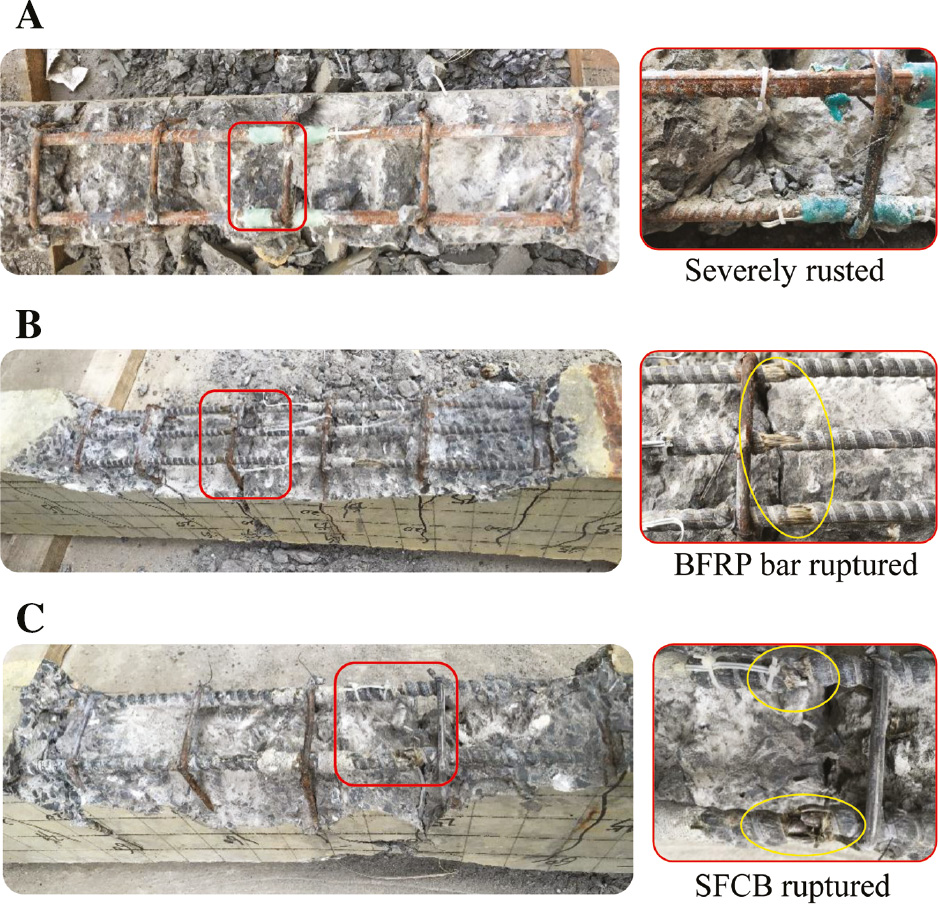
Surface conditions of tension reinforcements of beams after 12 months of exposure. (A) Steel bars RC beam, (B) BFRP bars RC beam and (C) SFCBs RC beam.
3.2 Load-midspan displacement (LD) curves
The obtained typical LD curves of specimens before and after conditioning are shown in Figure 7. The characteristic loads and corresponding displacements are summarized in Table 4, where Pcr is the value of the load when cracks first appeared, Py is the yielding load value determined by the graphing method, and Pmax is the maximum load of the LD curves. αcr, αy, and αmax are the ratios of the cracking load, yield load, and maximum load, respectively, of each conditioned beam compared with the values of the reference beams. Δy is the value of the midspan displacement at Py, and Δmax is the value of the midspan displacement when the beam failed.
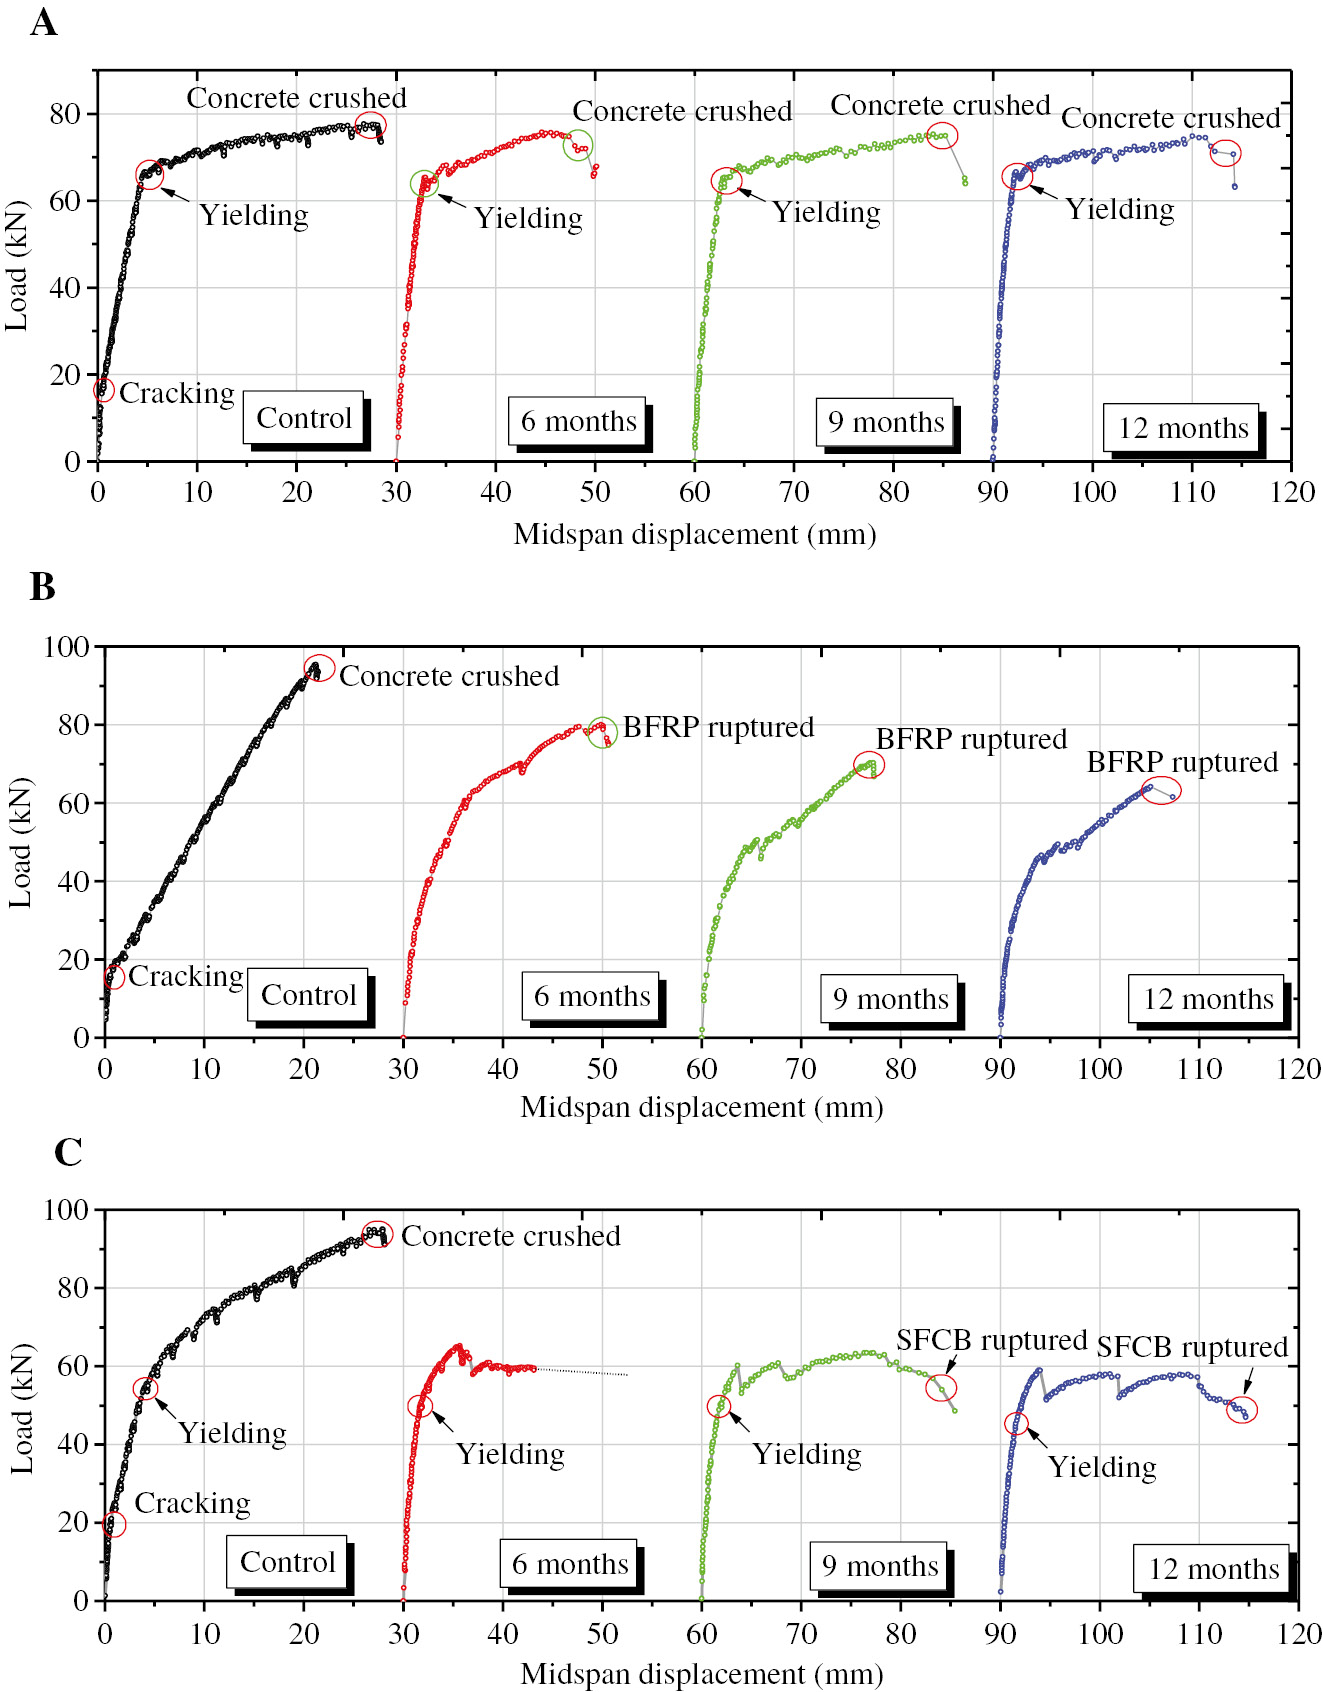
Typical load-midspan displacement curves before and after conditioning. (A) Steel bars RC beams, (B) BFRP bars RC beams and (C) SFCBs RC beams.
Summary of test results.
| Beam no. | Duration (months) | Pcr (kN) | αcr | Py (kN) | αy | Pmax (kN) | αmax | Δy (mm) | Δmax (mm) | Failure modes |
|---|---|---|---|---|---|---|---|---|---|---|
| Steel bars RC beam | Control | 19 | 1.0 | 68.5 | 1.00 | 79.5 | 1.00 | 4.6 | 27.0 | Concrete crushed |
| 6 | / | / | 65.0 | 0.95 | 78.0 | 0.98 | 2.7 | 20.5 | Concrete crushed | |
| 9 | / | / | 65.0 | 0.95 | 76.4 | 0.96 | 2.6 | 24.5 | Concrete crushed | |
| 12 | / | / | 67.0 | 0.98 | 74.6 | 0.94 | 3.4 | 19.5 | Concrete crushed | |
| BFRP bars RC beam | Control | 17 | 1.0 | – | – | 94.8 | 1.00 | – | 20.6 | Concrete crushed |
| 6 | / | / | – | – | 73.6 | 0.78 | – | 19.6 | BFRP bar ruptured | |
| 9 | / | / | – | – | 63.2 | 0.67 | – | 16.3 | BFRP bar ruptured | |
| 12 | / | / | – | – | 55.0 | 0.58 | – | 11.9 | BFRP bar ruptured | |
| SFCBs RC beam | Control | 20 | 1.0 | 55.0 | 1.00 | 95.0 | 1.00 | 5.9 | 29.0 | Concrete crushed |
| 6 | / | / | 50.0 | 0.91 | 63.0 | 0.66 | 1.9 | 13.7a | SFCB ruptured | |
| 9 | / | / | 50.0 | 0.91 | 62.0 | 0.65 | 1.6 | 20.5 | SFCB ruptured | |
| 12 | / | / | 45.0 | 0.82 | 59.0 | 0.62 | 1.6 | 21.4 | SFCB ruptured |
The data in the table are the average of the two beams; /, not available because the conditioned beams were pre-cracked; –, not available for FRP bars RC beams due to lack of yielding stage; abecause the first time this happens, the test was stopped before the inner steel bar ruptured for security reason.
As shown in Figure 7 and Table 4, the yield loads of the steel bars RC beams decreased by 2–5%, and the ultimate loads decreased by 2–6% after conditioning. The total degradation of the macro-mechanical properties was not significant.
Regarding the BFRP bars RC beams as shown in Figure 7B, the failure modes of all conditioned beams were BFRP bars ruptured. The ultimate load retentions were 78%, 67% and 58% after 6 months, 9 months and 12 months of exposure, respectively. This finding indicated that the tensile strengths of the BFRP bars decreased. The residual tensile strengths can be deduced from the obtained failure moments of the conditioned beams based on equations in ACI 440.1R-15 [35], which will be given below.
Regarding the SFCBs RC beams as shown in Figure 7C, similar to the BFRP bars RC beams, all conditioned beams failed due to rupture of the SFCBs. After 6 months, 9 months, and 12 months of exposure, the yield load retentions were 91%, 91% and 82%, respectively; the ultimate load retentions were 66%, 65% and 62%, respectively. In the study by Dong et al. [32], similar SFCBs reinforced sea sand concrete beams with 3 months of exposure were tested. No rupture of SFCBs was observed, which indicated that the SFCBs were more severely damaged when the duration of exposure exceeded 3 months.
Khanfour and El Refai [36] investigated the effect of 200 FT cycles (100 days) on concrete beams reinforced with BFRP bars without coupled sustained loading. Each FT cycle consisted of a freezing phase at −25°C and a thawing phase at 15°C. The humidity of the environmental chamber was maintained at 50% during the FT period. It was observed that for the over-reinforced beam with a shear span-to-depth ratio of 2.5, which was similar to the beams in this paper, the load carrying capacity was reduced by 13.4% compared to their unconditioned counterpart. The reduction was lower than that observed in this paper, which was about 22% for 6 months of exposure. The above phenomenon, on one hand, is caused by the more humid environment in this paper. On the other hand, the coupled constant loading may also accelerate the degradation of the mechanical properties of the BFRP bars.
3.3 Tensile strength retentions of BFRP bars after being conditioned
The ultimate flexural strength of the over-reinforced BFRP bars RC beams in control group with ρf>ρfb can be determined from the following equations based on ACI 440.1R-15 [35]:
The calculated ultimate flexural strength was 18.77 kN m, which was close to the tested 18.96 kN m. Similarly, for the conditioned beams, ρf<ρfb, and the beams that were under-reinforced, their ultimate flexural strengths can be determined from the following equations:
It can be seen from equations (3) and (4) that Mn is a function of ffu when other variables are determined. Thus, the residual tensile strength (ffu) of the BFRP bar can be deduced based on the tested failure moment (Mn). And the results were shown in Table 5. It can be found that the tensile strength retentions of BFRP bars were 44%, 38% and 34% after 6 months, 9 months and 12 months of exposure, respectively.
The ultimate strength of BFRP bars at different ages.
| Ages (months) | Tested failure modes | Relationship between ρf and ρfb | Tested failure moment (kN m) | Residual tensile strength of BFRP bars ffu (MPa) | Tensile strength retention (%) |
|---|---|---|---|---|---|
| 6 | BFRP bar ruptured | ρf<ρfb (under-reinforced) | 14.72 | 614.1 | 44 |
| 9 | BFRP bar ruptured | ρf<ρfb (under-reinforced) | 12.64 | 533.5 | 38 |
| 12 | BFRP bar ruptured | ρf<ρfb (under-reinforced) | 11.00 | 475.5 | 34 |
The adopted concrete strength is 55.2 MPa based on the tested concrete strength after the same environmental condition.
3.4 Moment-curvature diagrams
To eliminate the effect of the deformation of the shear zones on the mid-span displacement, the moment-curvature response of the pure bending section before and after conditioning is also tested in this study. Experimental moment-curvature diagrams of the pure bending zone can be obtained from the concrete surface strains [37]. To measure the concrete surface strains, π displacement gauges (π-1–π-7, as shown in Figure 4B) were employed. The average strains tested by the π displacement gauges were employed to assess the curvature according to the following:
where κ=the obtained curvature; εm and εn=the averaged strains along m lines and n lines (in Figure 4B), respectively; and hmn=the distance between these lines. Due to the limited paper length, only the results of the control specimens and the specimens with 12 months of exposure are displayed.
As shown in Figure 8A, for the control group, the moment-curvature (M-κ) curve of the BFRP bars RC beam was the typical bilinear type with an inflection point at cracking. Both the SFCBs and steel bars RC beams were the typical trilinear type with the first inflection point at cracking and the second inflection point at yielding. The difference was that the SFCBs RC beam had post-yield stiffness in the M-κ curve, whereas the steel bars RC beam did not exhibit post-yield stiffness. The M-κ curves of the three types of beams after 12 months of exposure are shown in Figure 8B. Because all conditioned beams were pre-loaded, no cracking points were observed. The steel bars RC beam still underwent a typical ductile failure mode, whereas a sudden load decrease occurred at the post-yield stage of the SFCBs RC beam, which interrupted the load increase. This result was because the inner steel bar/BFRP interface of the SFCB was damaged by the penetrated corrosive ions (e.g. pore alkaline ions and water molecules). Their co-work ability was reduced, and the bond shear stress could not be effectively transferred to the inner steel bar. The outer BFRP ruptured at the load decrease point, and then the load was carried by the inner steel bar, which has already yielded. The M-κ curve of the BFRP bars RC beam after 12 months of exposure exhibited a curved shape and bent severely due to reduced bond performance and tensile strength.
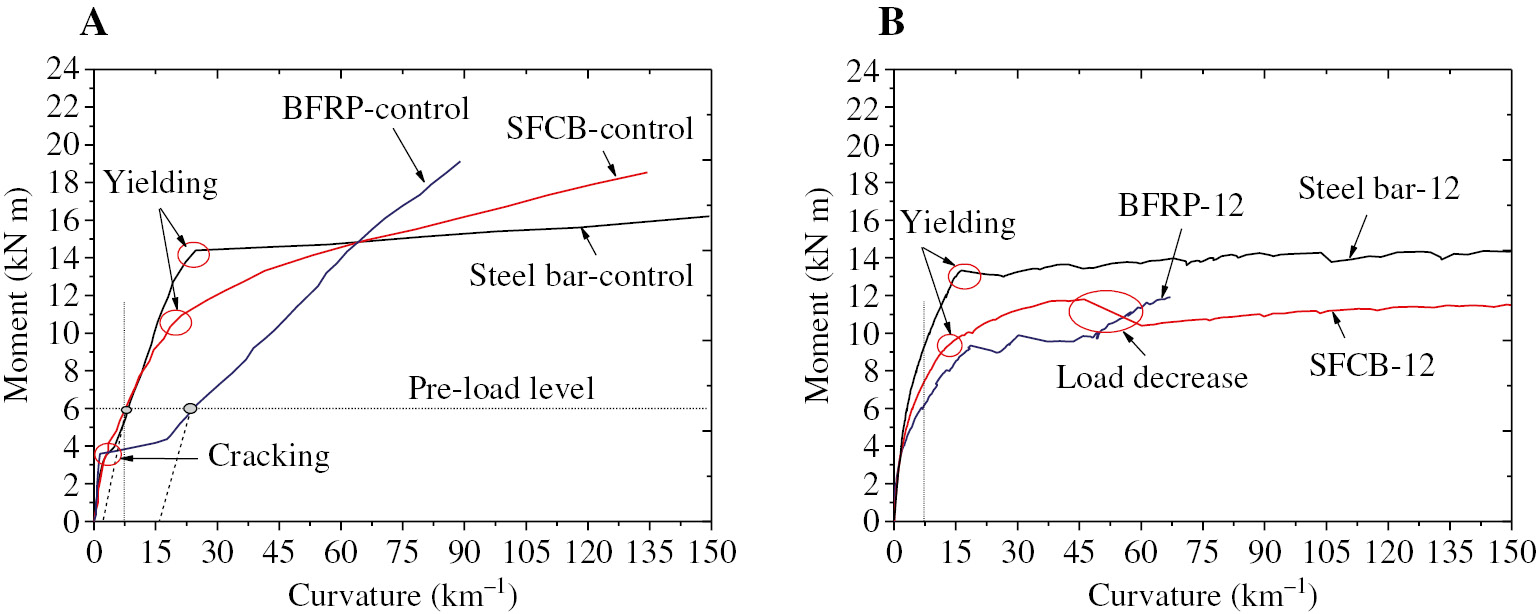
Moment-curvature diagrams at the pure bending section before and after 12 months of exposure. (A) Control specimens and (B) After 12 months of exposure.
Note that the residual deflections after unloading should be considered when comparing the conditioned beams with the control beams. Due to the limitation of the manner in which the sustained load is applied, the residual deflections were not tested. The dashed lines in Figure 8A schematically showed the approximate unload paths. As shown in Figure 8, the secant stiffness of all conditioned beams improved when the residual deflections were not considered, e.g. when the curvature was 7.5 km−1 for the control group, the moments of the steel bars, the SFCBs, and the BFRP bars RC beams were 6.0, 5.5 and 3.8 kN m, respectively. For the 12-month beams, the corresponding moment was 9.3, 7.4 and 6.0 kN m.
3.5 Crack widths and distributions
Figure 9 shows the relationship between the maximum crack widths at the pure bending section and the loads for the control beams and all conditioned beams.
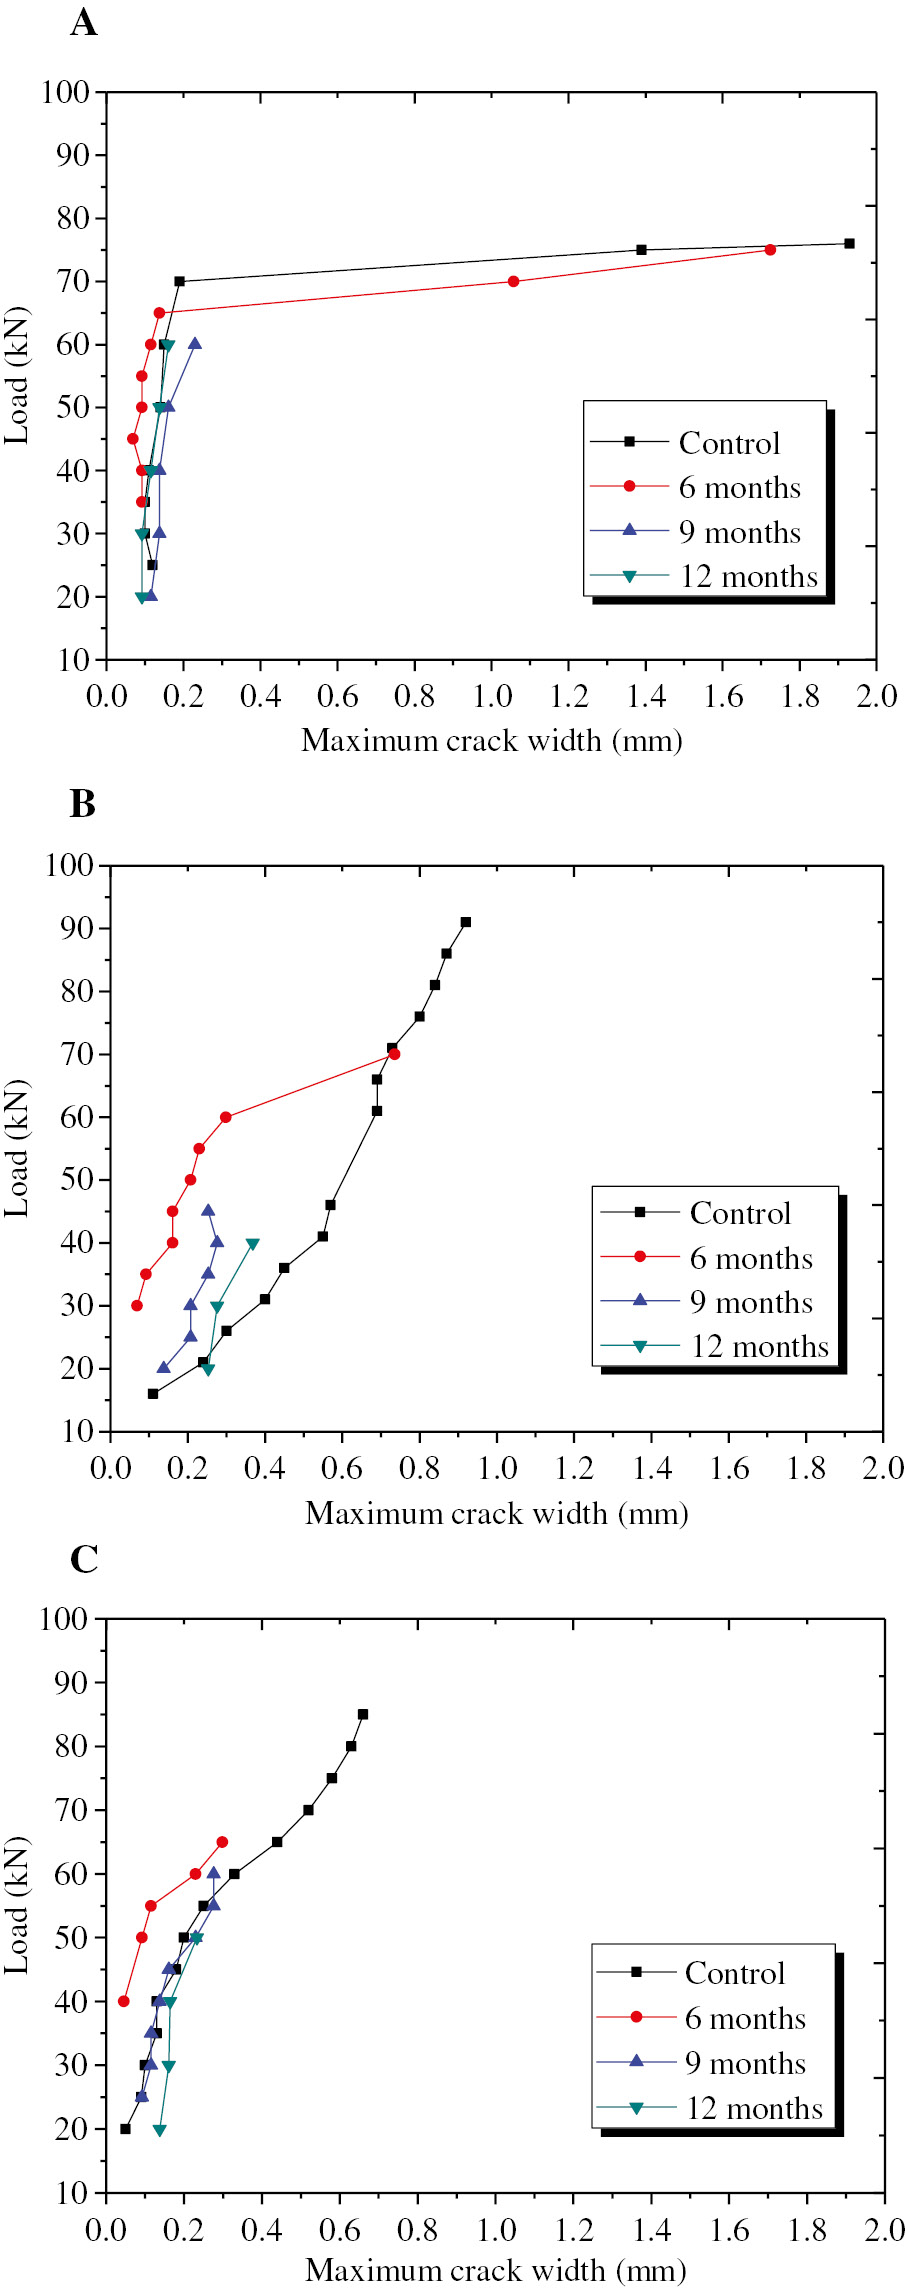
Load versus crack width curves before and after conditioning. (A) Steel bars RC beams, (B) BFRP bars RC beams and (C) SFCBs RC beams.
As shown in Figure 9A, for steel bars RC beams, the change of the maximum crack width before and after corrosion was not distinct generally. The correlation between crack width and age was not distinct due to the randomness of the crack development. As shown in Figure 9B, for BFRP bars RC beams, the crack widths of all conditioned beams were basically smaller than the reference beams at the same load level. As shown in Figure 9C, for SFCBs RC beams, the crack widths of 6-month beams were smaller than the reference beams at the same load level, whereas the crack widths of 9-month beams were basically the same as the reference beams. When the age increased to 12 months, the crack widths of the conditioned beams were larger than the reference beams.
The distributions of cracks in the beams after tests are provided in Figure 10. In addition, the typical failure modes of all beams, which correspond to the results in Table 4, are also clearly illustrated in Figure 10. Compared with the control beams, the cracks of the conditioned beams were insufficiently developed with fewer diagonal cracks at the shear zones.
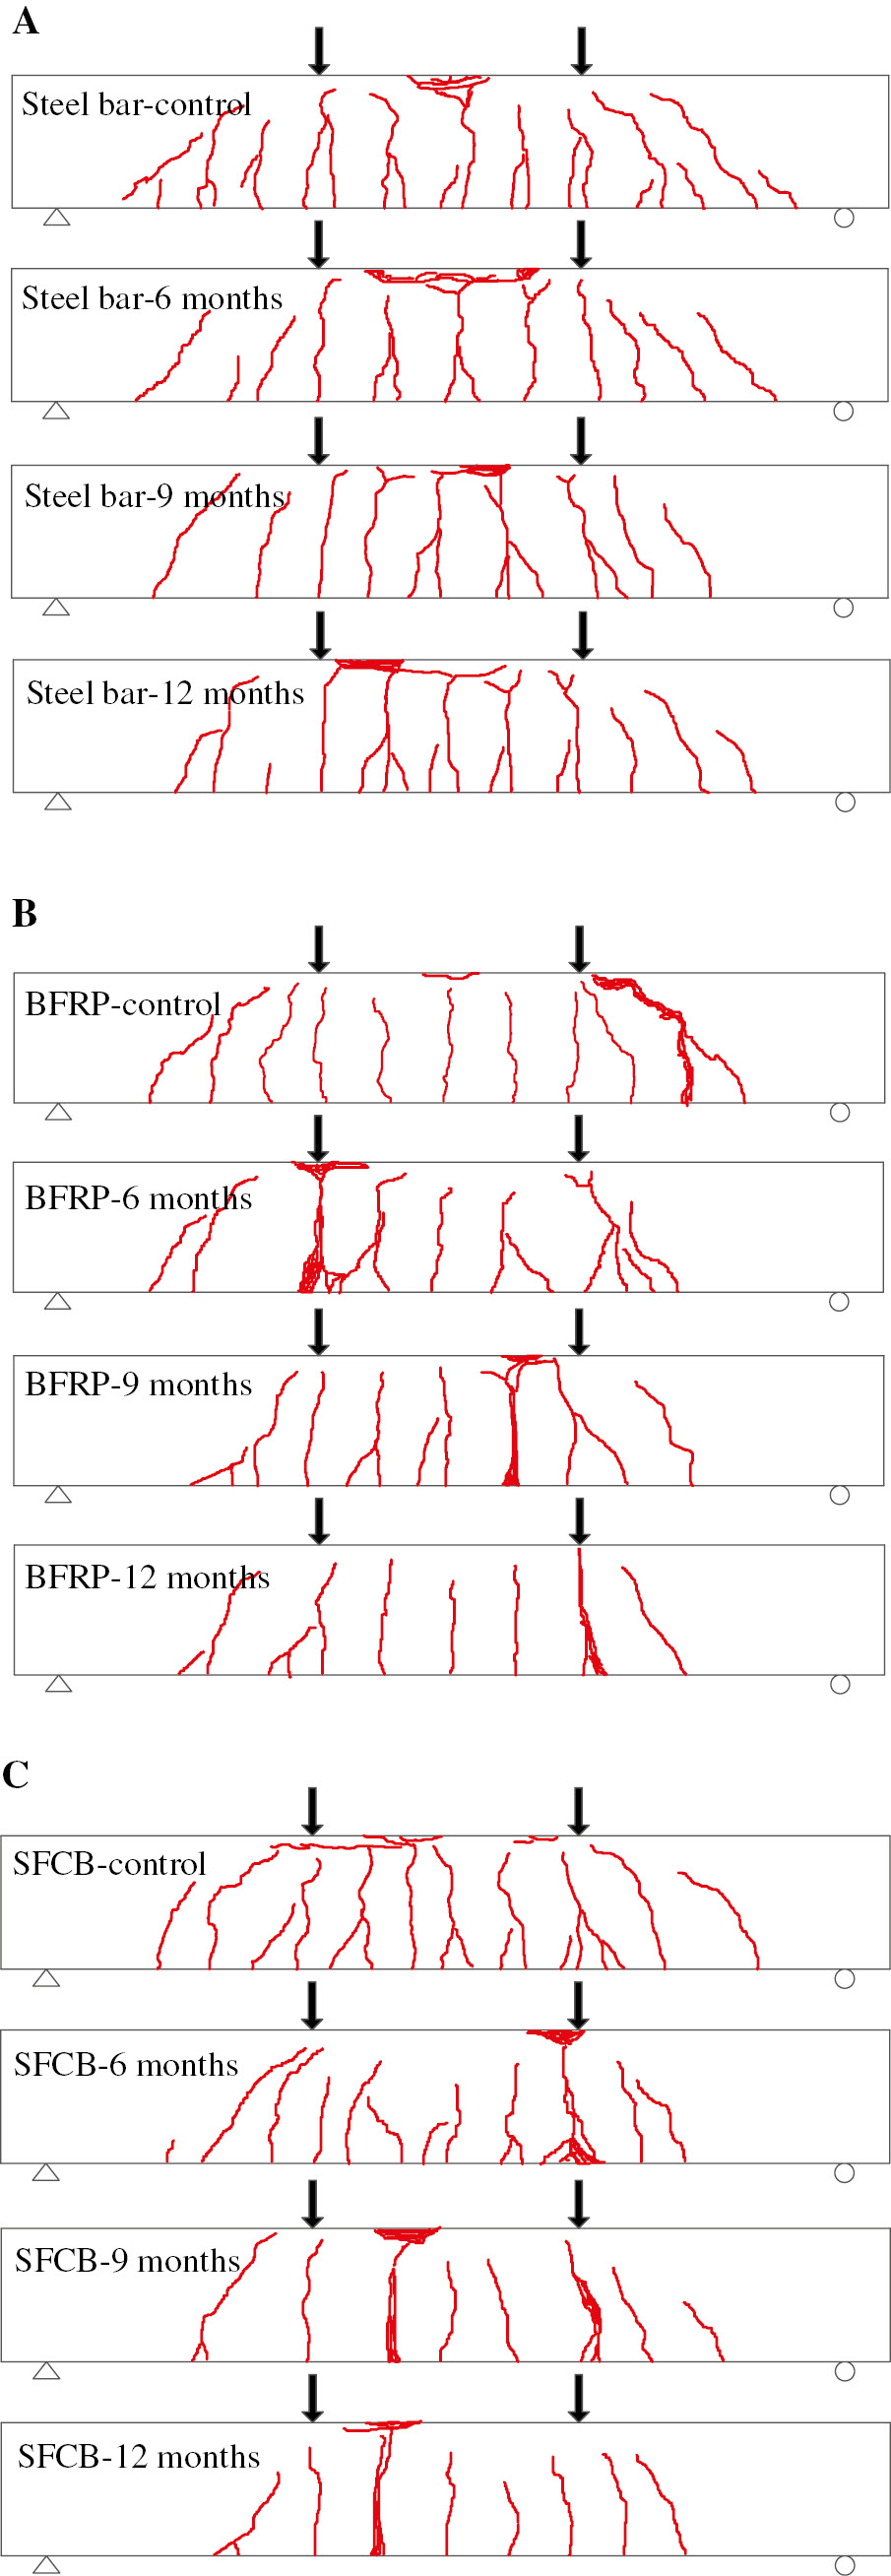
Crack distribution when the beams failed. (A) Steel bars RC beams, (B) BFRP bars RC beams and (C) SFCBs RC beams.
3.6 SEM observation
Figure 11 shows the SEM images of the cross-sections of BFRP bar samples taken from the beams after 12 months of exposure. As shown in Figure 11, a distinct damaged layer, with a thickness of approximately 1 mm and a distinct boundary line, was observed. In addition, fiber/matrix debonding was also observed in the core BFRP within the boundary line.
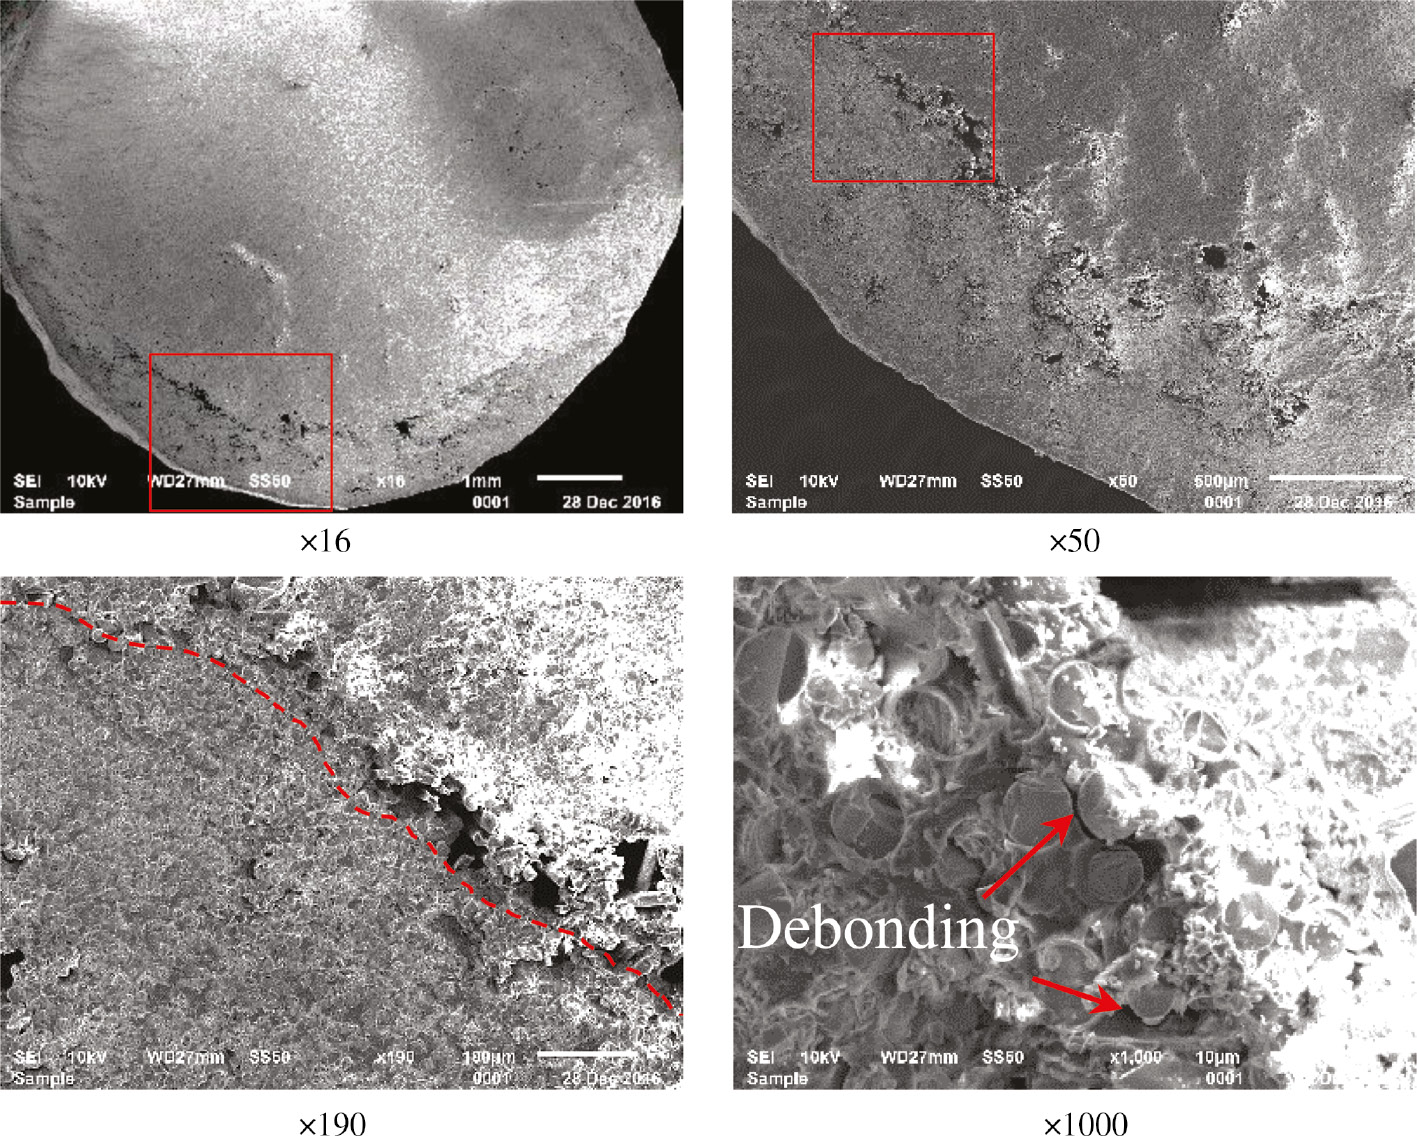
SEM images.
4 Conclusions
This paper discusses a long-term mechanical performance test on three types of RC beams that were subjected to a coupled sustained load and a seawater wet-dry cycling environment for a maximum of 12 months. The following main results are drawn:
For steel bars RC beams in the test period of a maximum duration of 12 months, the inner steel bars were rusted along the full length of the beam. However, the degree of corrosion on the surface of the steel bars did not significantly affect the macro-mechanical properties of the beams.
For the control group, the failure modes of the BFRP bars RC beams were concrete crushed in the compression zone, whereas the failure modes of all conditioned beams were BFRP bars ruptured. The ultimate load retentions were 78%, 67% and 58% after 6 months of exposure, 9 months of exposure and 12 months of exposure, respectively.
For the control group, the failure modes of the SFCBs RC beams were concrete crushed in the compression zone, whereas the failure modes of all conditioned beams were SFCBs ruptured. The yield load retentions were 91%, 91% and 82%, and the ultimate load retentions were 66%, 65% and 62% after 6 months of exposure, 9 months of exposure and 12 months of exposure, respectively.
According to the microstructural observations by SEM, the outer layer of the BFRP bar was damaged by the corrosive pore fluid. The distinct boundary line was observed between the outer damage layer and the inner zone. Fiber/matrix debonding was also observed in the inner zone.
As indicated in the beam test results in this paper, the steel bars RC beams seem to have the best long-term macro-mechanical properties during the 12-month period. However, the results do not conclude that the durability of the steel bars RC concrete beams was acceptable. From a microscopic point of view, the inner steel bars were completely rusted along the length of the beam during the 12-month period. For steel bars wrapped by the concrete cover, the rate of corrosion is very fast. The concrete cover will crack due to the volume expansion effect of rust products, and the inner steel bars will be further exposed to a corrosive environment. Then, the degradation of the macro-mechanical properties will be non-convergent. Inversely, as the degree of alkalinity of the concrete pore solution decreases due to carbonation and seawater flushing, the degradation rate of the FRP bars will gradually decelerate. The degradation of the macro-mechanical properties of the FRP bars RC beams should be convergent over time.
Funding source: National Natural Science Foundation of China
Award Identifier / Grant number: 51525801
Funding statement: The authors would like to acknowledge financial support from the National Key Research and Development Program of China (2016YFC0701400), the Australian Research Council (ARC) through an ARC Discovery Grant (DP160100739), the National Natural Science Foundation of China (Grant no. 51525801), and the Scientific Research Foundation of Graduate School of Southeast University (Grant no. YBPY1607).
References
[1] Robert M, Benmokrane B. Constr. Build. Mater. 2013, 38, 274–284.10.1016/j.conbuildmat.2012.08.021Search in Google Scholar
[2] Serbescu A, Guadagnini M, Pilakoutas K. J. Compos. Constr. 2014, 19, 04014037.10.1061/(ASCE)CC.1943-5614.0000497Search in Google Scholar
[3] Elgabbas F, Ahmed EA, Benmokrane B. Constr. Build. Mater. 2015, 95, 623–635.10.1016/j.conbuildmat.2015.07.036Search in Google Scholar
[4] Quagliarini E, Monni F, Bondioli F, Lenci S. J. Build. Eng. 2016, 5, 142–150.10.1016/j.jobe.2015.12.003Search in Google Scholar
[5] Wu G, Wu ZS, Luo YB, Sun ZY, Hu XQ. J. Mater. Civ. Eng. 2010, 22, 1056–1066.10.1061/(ASCE)MT.1943-5533.0000110Search in Google Scholar
[6] Yang Y, Wu G, Wu ZS, Zhang T, Yang QD. Constr. Build. Mater. 2015, 83, 7–18.10.1016/j.conbuildmat.2015.02.076Search in Google Scholar
[7] Wang X, Wu G, Wu Z, Dong Z, Xie Q. Mater. Des. 2014, 64, 721–728.10.1016/j.matdes.2014.07.064Search in Google Scholar
[8] Micelli F, Nanni A. Constr. Build. Mater. 2004, 18, 491–503.10.1016/j.conbuildmat.2004.04.012Search in Google Scholar
[9] Chen Y, Davalos JF, Ray I, Kim HY. Compos. Struct. 2007, 78, 101–111.10.1016/j.compstruct.2005.08.015Search in Google Scholar
[10] Robert M, Cousin P, Benmokrane B. J. Compos. Constr. 2009, 13, 66–73.10.1061/(ASCE)1090-0268(2009)13:2(66)Search in Google Scholar
[11] Zhou J, Chen X, Chen S. Nucl. Eng. Des. 2011, 241, 4095–4102.10.1016/j.nucengdes.2011.08.038Search in Google Scholar
[12] Benmokrane B, Elgabbas F, Ahmed EA, Cousin P. J. Compos. Constr. 2015, 19, 04015008.10.1061/(ASCE)CC.1943-5614.0000564Search in Google Scholar
[13] Chen Y, Davalos JF, Ray I. J. Compos. Constr. 2006, 10, 279–286.10.1061/(ASCE)1090-0268(2006)10:4(279)Search in Google Scholar
[14] Davalos JF, Chen Y, Ray I. J. Compos. Mater. 2012, 46, 1899–1914.10.1177/0021998311427777Search in Google Scholar
[15] Wu G, Dong ZQ, Wang X, Zhu Y, Wu ZS. J. Compos. Constr. 2014, 19, 04014058.10.1061/(ASCE)CC.1943-5614.0000517Search in Google Scholar
[16] Benmokrane B, Robert M, Mohamed HM, Ali AH, Cousin P. J. Compos. Constr. 2016, 21, 06016002.10.1061/(ASCE)CC.1943-5614.0000775Search in Google Scholar
[17] Bakis CE, Boothby TE, Jia J. J. Compos. Constr. 2007, 11, 269–278.10.1061/(ASCE)1090-0268(2007)11:3(269)Search in Google Scholar
[18] El Refai A, Abed F, Altalmas A. J. Compos. Constr. 2015, 19, 04014078.10.1061/(ASCE)CC.1943-5614.0000544Search in Google Scholar
[19] Altalmas A, El Refai A, Abed F. Constr. Build. Mater. 2015, 81, 162–171.10.1016/j.conbuildmat.2015.02.036Search in Google Scholar
[20] Dong Z, Wu G, Xu B, Wang X, Taerwe L. Mater. Des. 2016, 92, 552–562.10.1016/j.matdes.2015.12.066Search in Google Scholar
[21] Dong Z, Wu G, Xu Y. Constr. Build. Mater. 2016, 115, 277–284.10.1016/j.conbuildmat.2016.04.052Search in Google Scholar
[22] Hassan M, Benmokrane B, El Safty A, Fam A. Compos. Part B 2016, 106, 262–272.10.1016/j.compositesb.2016.09.039Search in Google Scholar
[23] Yan F, Lin Z. Compos. Struct. 2016, 161, 393–406.10.1016/j.compstruct.2016.11.055Search in Google Scholar
[24] Mufti A, Onofrei M, Benmokrane B, Banthia N, Boulfiza M, Newhook J, Bakht B, Tadros G, Brett P. Durability of GFRP reinforced concrete in field structures. In Proceedings of the 7th International Symposium on Fiber Reinforced Polymer Reinforcement for Reinforced Concrete Structures, American Concrete Institute, Detroit, 2005.Search in Google Scholar
[25] Nkurunziza G, Benmokrane B, Debaiky AS, Masmoudi R. ACI Struct. J. 2005, 102, 615–621.Search in Google Scholar
[26] Debaiky A, Nkurunziza G, Benmokrane B, Cousin P. J. Compos. Constr. 2006, 10, 370–380.10.1061/(ASCE)1090-0268(2006)10:5(370)Search in Google Scholar
[27] Sen R, Mariscal D, Shahawy M. Struct. J. 1993, 90, 525–533.Search in Google Scholar
[28] Tannous FE. ACI Mater. J. 1998, 95, 87–100.Search in Google Scholar
[29] Laoubi K, El-Salakawy E, Benmokrane B. Cem. Concr. Compos. 2006, 28, 869–878.10.1016/j.cemconcomp.2006.07.014Search in Google Scholar
[30] Sen R, Shahawy M, Sukumar S, Rosas J. Struct. J. 1999, 96, 450–457.Search in Google Scholar
[31] Wang H, Belarbi A. Constr. Build. Mater. 2013, 44, 541–550.10.1016/j.conbuildmat.2013.02.065Search in Google Scholar
[32] Dong ZQ, Wu G, Xu YQ. J. Compos. Constr. 2016, 21, 04016095.10.1061/(ASCE)CC.1943-5614.0000749Search in Google Scholar
[33] ACI (American Concrete Institute). Guide test methods for fiber reinforced polymer (FRP) composites for reinforcing or strengthening concrete and masonry structures. ACI 440.3R-12, Farmington Hills, MI, 2012.Search in Google Scholar
[34] Yang WR, He XJ, Dai L, Zhao X, Shen F. J. Compos. Constr. 2016, 20, 04016040.10.1061/(ASCE)CC.1943-5614.0000688Search in Google Scholar
[35] ACI (American Concrete Institute). Guide for the design and construction of structural concrete reinforced with Fiber-reinforced polymer (FRP) bars. ACI 440.1R-15, Farmington Hills, MI, 2015.Search in Google Scholar
[36] Khanfour MA, El Refai A. Constr. Build. Mater. 2017, 145, 135–146.10.1016/j.conbuildmat.2017.03.237Search in Google Scholar
[37] Gribniak V, Kaklauskas G, Torres L, Daniunas A, Timinskas E, Gudonis E. Compos. Part B 2013, 50, 158–170.10.1016/j.compositesb.2013.02.003Search in Google Scholar
©2018 Walter de Gruyter GmbH, Berlin/Boston
This article is distributed under the terms of the Creative Commons Attribution Non-Commercial License, which permits unrestricted non-commercial use, distribution, and reproduction in any medium, provided the original work is properly cited.
Articles in the same Issue
- Frontmatter
- Reviews
- Effect of reinforcements on polymer matrix bio-composites – an overview
- A critical review on the development and performance of polymer/graphene nanocomposites
- Original articles
- Structural design and analysis of composite blade for horizontal-axis tidal turbine
- Mechanical alloying of CuFe-alumina nanocomposite: study of microstructure, corrosion, and wear properties
- Analysis of the bending and failure of fiber metal laminates based on glass and carbon fibers
- Thermal insulation of silica aerogel/PMMA composites with amino-capped polydivinylsiloxane phase interfaces
- Degradable Mg alloy composites using fly ash cenospheres
- Experimental study on the durability of FRP bars reinforced concrete beams in simulated ocean environment
- Effect of geometrical parameters on the effective elastic modulus for an X-type lattice truss panel structure
- Thermal cycling of composite laminates made of out-of-autoclave materials
- Optimization of thermal conductivity in composites loaded with the solid-solid phase-change materials
- Developing polymer composite-based leaf spring systems for automotive industry
- Structure-property-processing investigation of electrically conductive polypropylene nanocomposites
- Microstructure evaluation, thermal and mechanical characterization of hybrid metal matrix composite
- Study of one-dimensional cure simulation applicable conditions for thick laminates and its comparison with three-dimensional simulation
- Development of a user-friendly drilling evaluation database system of CFRP
- Incorporating oxygen-free copper to improve the microstructure and mechanical properties of friction-stir-welded joints for aluminum alloys
- Analytical solution on dosage of self-healing capsules in materials with two-dimensional multi-shaped crack patterns