Lightweight design of lattice-embedded brake pedals using artificial intelligence -based optimization
-
Enes Kurt
Enes Kurt is a PhD student at in the Department of Mechanical Engineering, Bursa Uludağ University, Bursa, Turkey. His research interests are the analysis of structural components, lattice structures, lightweight design, additive manufacturing, artificial neural networks and optimization.

 ,
Ali Rıza Yıldız
,
Ali Rıza Yıldız
Dr. Ali Rıza Yıldız is a Professor in the Department of Mechanical Engineering, Bursa Uludağ University, Bursa, Turkey. His research interests are the finite element analysis of structural components, lightweight design, vehicle design, vehicle crashworthiness, shape and topology optimization of vehicle components, meta-heuristic optimization techniques, and additive manufacturing.
Dr. Tülin İnkaya is a Professor in the Department of Industrial Engineering, Bursa Uludağ University, Bursa, Turkey. Her research interests are the artificial Intelligence, computer Learning and pattern Recognition, optimization theory and methods, supply chain and logistics management.
Dr. Ahmet Remzi Özcan is an Assistant professor in the Department of Mechatronics Engineering at Bursa University, Bursa, Turkey. His research interests are the optimization of mechanical and mechatronic systems, meta-heuristic optimization algorithms.
İstemihan Gökdağ is a PhD student at in the Department of Mechanical Engineering, TOBB University of Economics and Technology, Ankara, Turkey. His research interests are the finite element analysis of structural components, lattice structures, lightweight design, additive manufacturing and optimization.

Abstract
The application of lattice structures has become increasingly important in designing complex components due to additive manufacturing (AM) advancements. Various types and design parameters of lattice structures allow weight reduction while maintaining the required strength and improving mechanical properties, with the strength varying based on these parameters. One common approach to calculating this strength is by using software solvers like SimSolid, which employs the meshless analysis solution (MAS). Considering the variety of parameters, the complexity of lattice structures, and the computational difficulties in analysis methods, identifying the optimal lattice structure for a design is highly challenging. To overcome this challenge, artificial neural networks (ANNs) are integrated into the optimization algorithm used in this study. The training data for the ANN are obtained from the analysis results of the designs generated using the design parameters selected by the Latin hypercube sampling (LHS) method. The ANNs integrated non-dominated sorting genetic algorithm II (NSGA-II) optimization algorithm is used to minimize the mass while ensuring the strength of the material by keeping the maximum stress within the permissible limits. The method is applied to the weight reduction of the brake pedal, approximately 26.96 % is achieved while maintaining the required strength under existing conditions.
1 Introduction
In recent years, the additive manufacturing (AM) method has had a profound impact on the manufacturing sector, facilitating the production of intricate designs with greater ease than traditional methods. Furthermore, this method, which adds flexibility to the design, is frequently used in repair and prototype production. Widely adopted in industries such as biomedical, defense, and automotive, AM is based on the principle of building 3D objects layer by layer through 3D printing [1].
The potential for the creation of complex structures through the adaptability of the AM method is exemplified by lattice structures. These structures are three-dimensional and composed of repeating unit cells. Lattice structures offer notable advantages over solid, homogeneous structures, including high energy absorption, effective sound insulation, and efficient heat management. The necessity for lightweighting and durable materials in sectors such as aerospace and automotive has prompted manufacturers to employ lattice structures [2].
The adoption of lattice structures in various engineering applications is becoming increasingly prevalent, and advances in AM technologies have significantly influenced this trend. In particular, within the fields of aerospace and automotive engineering, these lattice structures offer a valuable solution to the critical issue of lightweighting while maintaining their mechanical properties [3]. These properties render lattice structures suitable for use in components such as brake pedals in the automotive industry. Furthermore, it can reduce material and energy consumption during production, thereby facilitating a more sustainable manufacturing process [4]. The versatility of AM technologies has made it possible to produce complex lattice geometries that are either near or impossible to produce with conventional methods, thus enabling engineers to develop new designs [5].
The selection of specific geometries, such as body-centered cubic (BCC) or gyroid lattices in lattice structures formed by the repetition of unit cells, directly influences the mechanical properties of the lattice structure and the component to which it is applied, including strength and weight [6], [7]. For example [8], investigated the mechanical performance of BCC truss structures and discovered that these properties can be optimized to achieve a balance between structural integrity and lightweighting. The capacity to alter the geometric parameters of lattice structures enables engineers to conduct such optimization processes. The design and optimization process for these structures presents a number of challenges, primarily due to their com- plex geometry and the large number of design parameters that can affect their performance. The aforementioned challenges make the creation of efficient lattice structures and the optimization of their design to fit the desired specifications a challenging and time-consuming exercise.
Traditional density-based optimization algorithms, one of the most frequently utilized methods in optimization applications, have yielded successful outcomes in numerous engineering applications. However, challenges emerge when these algorithms are applied to truss structures with periodic and discrete designs. These methods, which are primarily designed for continuous material distributions, have difficulty accurately describing the arrangement and size of unit cells in lattice structures. Consequently, the optimization results in an optimal design that fails to achieve the desired goal while preserving the mechanical advantages [9]. demonstrated the necessity of optimizing the geometric parameters and the type of unit cells in lattice structures in a design using lattices and underscored the shortcomings of traditional density-based methods in this context. In order to overcome this problem, designers have attempted to employ new methods and algorithms in the optimization of lattice structures. For instance [10], employed a genetic algorithm to enhance the topology and dimensions of lattice structures, showcasing the efficacy of sophisticated computational techniques in attaining an optimal design. Additionally [11], posited that topology optimization for heterogeneous lattice structures could be a fruitful approach, potentially enhancing the mechanical attributes and functionality of lattice structures. Ultimately, while traditional density-based topology optimization techniques have been employed in lattice structure design, they are inadequate for achieving more successful and optimal designs. In the optimization of these structures, more advanced optimization algorithms or more innovative methods integrated into these algorithms are required. For instance, the use and development of current computational methods, such as meshless analysis solution (MAS) and artificial neural networks (ANN) techniques integrated with genetic algorithms, can facilitate efficient lattice structure design.
MAS calculation methods allow for the analysis of the mechanical properties of truss structures; however, the analysis times may vary depending on the complexity of the truss structures and the size of the design. In instances where the requisite analysis times are excessively lengthy, machine learning techniques such as ANNs may be employed. ANNs can be trained to predict the mechanical properties of new lattice designs using data from previous analyses, thereby significantly reducing the time required for optimization [12], [13].
In order for an ANN model to be effectively utilized following its creation, it is essential to train the model using relevant data from the specific application for which it will be employed. Obtaining training data through MAS can be a time-consuming process, dependent on the length of the analysis. In such cases, to ensure optimal model performance at a reduced cost, it is essential to ensure an even and appropriate distribution of the training data, with the objective of maximizing the model’s learning potential. A variety of methods exist for the efficient selection and distribution of this data. These include experimental design techniques such as Taguchi methods, response surface methodology, and Plackett–Burman designs [14], as well as sampling strategies such as Monte Carlo sampling, Latin hypercube sampling (LHS), and Quasi-Monte Carlo (QMC) sampling [15].
A number of studies in the literature have concentrated on the objective of optimizing brake pedal designs with a view to achieving a reduction in weight. For instance [16], applied topology optimization to a brake pedal design and successfully reduced its weight by 22 % while maintaining the required strength under existing conditions. Similarly, [17], for the same purpose, used BASF Ultrafuse 316L metal-polymer composite filament and applied topology optimization to the brake pedal produced with FDM technology and achieved a weight reduction of 55 %. The brake pedal produced with the new optimal design obtained in his study was tested with finite element analysis (FEA) and compared with physical prototypes. As a result of the comparison of analysis and test results, a safety difference of 9 % was found. In another study by [18], deterministic and reliability-based design optimization methods were compared and it was shown that reliability-based design is more successful in achieving lightweight and robust brake pedals. However, these studies were carried out by traditional topology optimization methods and did not address the issue of optimizing lattice structures.
In this study, lattice structures with a geometry based on the BBC unit cell are implemented in a specific region of the brake pedal. The region in which the BBC lattice structures are applied represents a strategic area for reducing the overall weight of the brake pedal while maintaining operational functionality within the existing design parameters. In order to achieve the lightweighting process, a number of geometrical parameters of the BCC lattice structure are considered and optimized with various design variables. These include the diameter thickness and the number of cells, among others. The objective of this optimization process is to identify the design parameters that will minimize the total weight, while ensuring that the MVM stress criterion value obtained as a result of MAS of the targeted potential optimum design does not exceed the yield strength of the material used in the brake pedal.
In order to accelerate the optimization process, ANN models must be trained using training data generated through MAS. The selection of appropriate training data can enhance the efficacy of ANN models and minimize the quantity of training data required. Accordingly, the LHS method is used to generate well-distributed input parameters and then training data is collected by obtaining the results of MAS analysis of different designs obtained with these parameters. The ANN models created with the collected training data are trained to predict both the weight and the MVM of the design. The integration of trained ANN models into the optimization algorithm serves to accelerate the optimization process, obviating the necessity for time-consuming MAS in order to identify the optimal brake pedal design parameter.
With these methods, the potential optimum design parameters, the weight and MVM value of the design with these parameters are estimated. To find the error of the optimization using ANN models, the parameters obtained as a result of the optimization are analysed by MAS method and the actual weight and MVM output results are obtained. By comparing the optimization and MAS output results obtained with the same parameters, it is calculated how much error is made as a result of using ANN models. Finally, the potential optimum design is compared with the initial design before optimization to calculate how much lightweighting is achieved.
Overall, the integration of MAS, ANNs and optimization used in this methodology provides a robust framework for design optimization to generate efficient designs. Especially in optimization processes targeting different objectives, such as design lightweighting using complex lattice structures, the development of successful ANN models and the use of this integration can greatly accelerate the process.
2 Materials and methods
2.1 Design
In order to create an optimized brake pedal design for use in FSAE vehicles, the brake pedal design example presented in the study by [19] is reviewed and a solid model with a similar design is created in the Altair Inspire pro- gram. The solid model is divided into three parts to accurately represent the study and is shown in Figure 1.
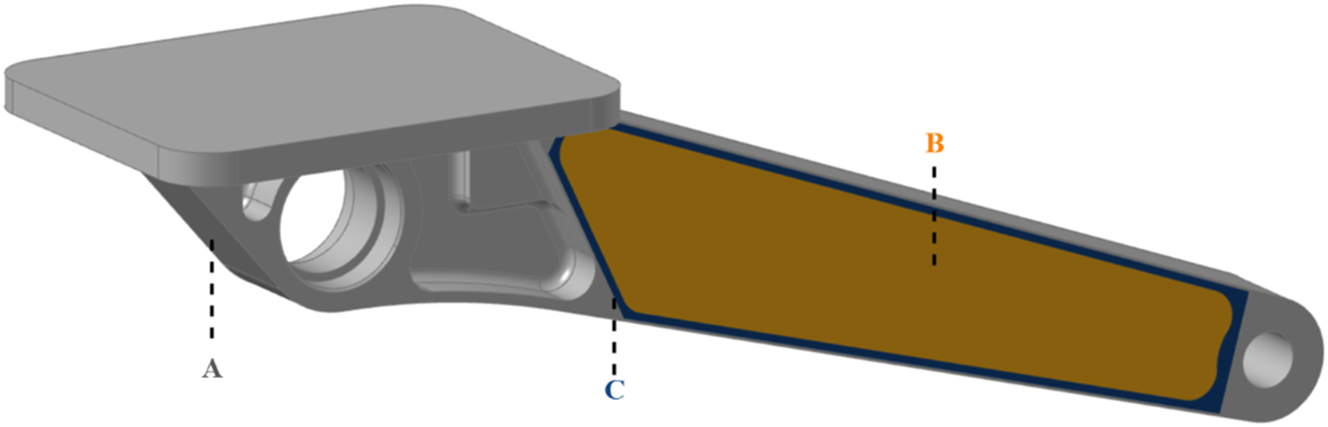
Initial brake pedal design.
Part A, which is the main design; part B, where the lattice structures are applied; and part C, which forms the shell structure of the lattice structure. Part A is the main part of the solid model and remains unmodified. The Inspire program needs a solid model in the area where the lattice structures are created. Part B is the part that is used to create the lattice structures to lighten and optimize the design as well as maintain the strength. The last part, C, forms the shell of the lattice structure to strengthen the connection between B and A, eliminate design defects, and prevent problems when applying the MAS method. This shell is designed to have a thickness of 1 mm and surrounds part B.
2.2 Meshless analysis solution
SimSolid uses the MAS method, which differs from conventional finite element methods (FEM) in that it does not require a structured mesh. The MAS method is particularly advantageous for complex geometries where mesh generation can be cumbersome and time consuming. Another important advantage is its ability to handle large deformations and complex boundary conditions without the problems associated with mesh distortion. MAS methods, including those used by SimSolid, rely on a set of distributed nodes to represent the domain of interest, allowing for greater flexibility and efficiency in computational modelling.
In the literature, these features are emphasised in some studies. For example [20], emphasises in his study that the MAS method can quickly evaluate crack propagation in materials and the efficiency of these methods in dynamic analysis scenarios. In another study [21], shows that the MAS method can reduce the analysis time by up to 92.5 % compared to conventional FEM, making it particularly suitable for fast iterative design processes. This computational efficiency of the MAS method is due to the elimination of the meshing stage, which is often a bottleneck in finite element analysis. The ability to apply boundary conditions directly and to simulate with dispersed nodes further contributes to the speed and accuracy of the results obtained with meshless methods [22].
In order to perform the MAS method, analysis conditions specifying the current conditions of the system to be analysed and a solver are required. SimSolid solution in Altair Inspire software is used as the solver in this study. While determining the analysis conditions, the forces and constraints that the brake pedal in FSAE vehicles is subjected to during braking are examined and the conditions for MAS are determined. The determined analysis conditions are applied to the CAD model and shown in Figure 2.
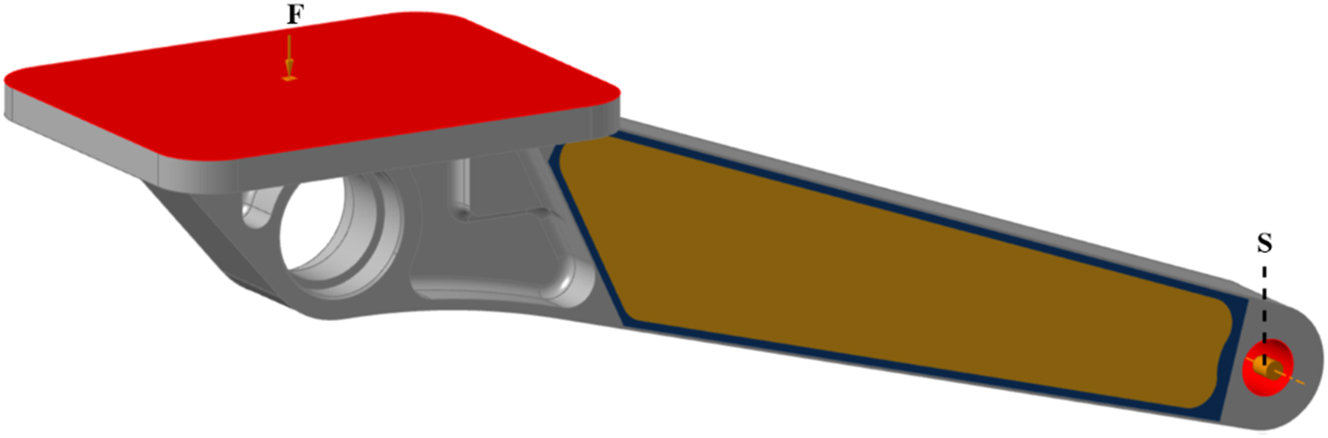
MAS loads.
The force applied surface and the fixed connection S are shown in red in Figure 2. The direction of force is indicated by an orange arrow perpendicular to the surface to which the force is to be applied. According to the [23] rule book, 2000 N, which is the limit force that the designed brake pedal must withstand, is defined as the force value.
Another necessary condition that can be considered as one of the analysis conditions is the material definition. The brake pedal material used in the study is Al 7075 T6, which is preferred in the study by [19] and is suitable for the brake pedal part in FSAE vehicles and AM. The material properties [24] are shown in Table 1.
Mechanical properties of Al 7075 T6 material.
| Modulus of elasticity | Poisson’s ratio | Density | Tensile yield strength |
|---|---|---|---|
| 71.7 × 10³ MPa | 0.33 | 2.81 g cm−3 | 503 MPa |
In this study, the results of MAS analysis are evaluated according to the Von Mises (VM) criterion. The VM criterion is used to measure yield and ultimate strength in ductile materials. In the VM stress, the normal stress and shear stress are averaged, and information about the stress distributions and intensities on the part is obtained [25]. For a ductile material under existing conditions not to undergo plastic deformation and to show the expected strength, the maximum Von Mises (MVM) value obtained as a result of the analysis must be lower than the yield strength of the material.
2.3 Lattice structure
Lattice structures can be categorized into three different categories according to their shape: strut-based lattice structures, ternary periodic minimal surface lattice structures, and shell lattice structures [2]. There are various types of lattice structures under these three main categories, and this diversity brings advantages and disadvantages. Apart from these three shape classifications, the Altair program categorizes lattice types differently. These categories are named surface, strut, and planar [26]. Surface lattice structures are lattices generated from trigonometric equations. Changing the equation controls the shape, size, and density of the three-dimensional structure. The second type of lattice structure, strut lattice structures, consists of rod-like structures joined in different directions and has various unit cells. Finally, planar lattice structures are structures that are formed as a periodic pattern in a two-dimensional plane and extruded in a single direction to form a three-dimensional structure. In addition, the distribution of these lattice structures can be homogeneous and heterogeneous. Heterogeneous lattice structures generally offer more design freedom than homogeneous lattice structures [27]. In this study, the lattice structure with homogeneous distribution is preferred.
For part B shown in Figure 1, the strut lattice structure category and the body-centered cubic (BCC) unit cell in this category are preferred. This preferred BCC lattice structure is shown in Figure 3.
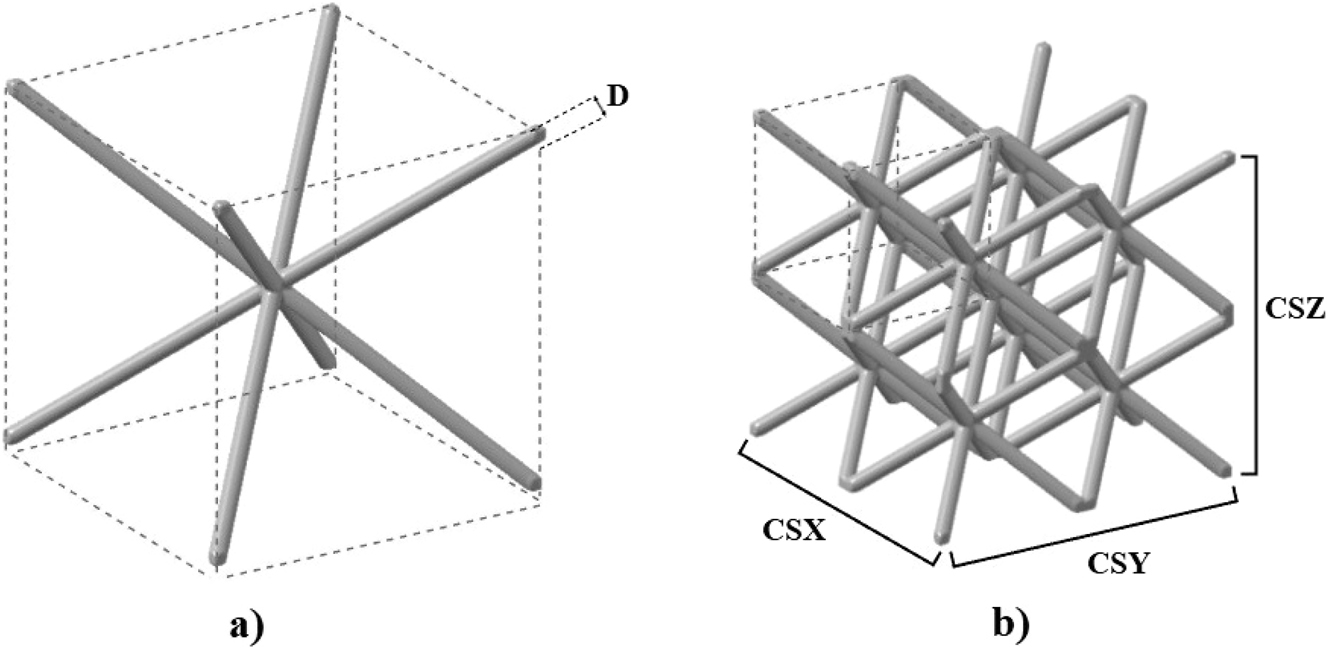
Unit and multiple BBC lattice structure. (a) Unit cell BBC lattice structure represented by strut diameter D, (b) lattice structure consisting of 2 × 2 × 2 = 8 BCC unit cells with CSX = 2, CSY = 2 and CSZ = 2 criteria.
There are different parameters to create the desired structure in the area where the lattice structure is applied. Strut diameter (D) refers to the diameter of a strut in the lattice structure. In addition, since the number of cells is not designed uniformly in this study, a separate variable is assigned to represent the number of cells for each of the three dimensions. These three variables, cell size-X (CSX), cell size-Y (CSY), and cell size-Z (CSZ), represent the number of cells on the x, y, and z axes, and together with D, there are a total of four parameters that affect the design. It is aimed to find the MVM strength and weight of the truss structure by keeping the other settings at the recommended level, except for these four main parameters determined specifically for the design. In line with this goal, the four parameters determined as variables and the other settings to be kept constant are shown in Table 2.
Mechanical properties of Al 7075 T6 material.
| Parameter | Value |
|---|---|
| Cell type | Body-centered cubic |
| Strut diameter (D) | 1 ≤ D ≤ 2 (mm) |
| Cell size-X (CSX) | CSX ∈ {2, 3, 4, 5, 6, 7} |
| Cell size-Y (CSY) | 6 ≤ CSY ≤ 24 |
| Cell size-Z (CSZ) | 3 ≤ CSZ ≤ 10 |
2.4 Meta model
2.4.1 Artificial neural network
ANN models are systems inspired by the way the human brain processes information. They are computer systems that mimic the human brain, can learn from complex data, and can be programmed to perform classification, prediction, and different functions. ANN models, which provide more effective results on more complex data structures than machine learning methods, are considered more appropriate for this study. There are various ANN algorithms such as multi-layer perceptron (MLP), linear regression, gradient boosting regression, decision tree regression, and so on for function estimation [28]. Among these various ANN models, the MLP algorithm, which is frequently used in complex function estimation, is chosen for the realization of the research.
2.4.2 Multi-layer perceptron
As mentioned elsewhere [29], MLP algorithms are models with one or more hidden layers between the input and output layers. Mimicking biological neural networks in the human brain, these MLPs take the sum of the weights of the neurons in each layer and apply an activation function to this sum. In this way, they accurately model complex relationships such as classification, function approximation, and regression analysis through a large number of neurons and hidden layers [30]. Research shows that MLPs are achieving very high performance in various applications with accuracies ranging from 62.89 to 100 % [31].
In many studies and applications, MLPs show better performance than traditional statistical models, especially in complex problems. MLPs are ap- plied to multi-objective optimization algorithms. For example, it is shown in additive manufacturing applications that complex geometries benefit from optimized material distribution to improve mechanical properties and reduce waste [32]. As a different example [33], uses MLPs integrated with optimization techniques for the optimal design of large-scale suspensions and shows that efficient designs are achieved within geometric constraints. In addition, MLPs have hyperparameters such as the number of layers and neurons that can significantly improve prediction accuracy. Techniques such as tuning these hyperparameters and feature selection further improve the power of MLP models [34]. As the field of artificial intelligence continues to evolve and be used in various sectors, MLPs continue to be used as a critical tool. For these reasons, MLP as an ANN model is deemed appropriate for the MVM prediction targeted in this study, as it is a complex data structure and a difficult model to compute.
There are hyperparameters such as the number of layers, learning rate, and number of neurons required to create an MLP model. For the model to give a good result, appropriate hyperparameters need to be found and these hyperparameters are used in model training. To find these suitable hyperparameters, grid search method is used. This method aims to find the optimum among the selected hyperparameters. The hyperparameters tested for the model are shown in Table 3.
Hyperparameters of MLP.
| Hyperparameters | Value |
|---|---|
| Layer size L | 2 ≤ L ≤ 4 |
| Neurons N | N = 2 n and 4 ≤ n ≤ 8 |
| Activation | relu |
| Solver | adam |
| Alpha α | {0.001, 0.01, 0.1} |
| Learning rate η | {0.001, 0.01, 0.1} |
| Max iteration | 10,000 |
| Random state | 42 |
In addition, there are different methods for separating training and vali- dation data in ANN models. Split method, cross-validation (CV), and leave- one-out are among the most well-known methods. In this study, considering the number of data, computer processing power, and working time, it is decided that the most appropriate training method is the k-fold CV method. This method divides the data into k parts and performs a total of k training. During each training, one of the partitions is reserved as validation data, and the other partitions are used for training. In each training, the part that was not previously selected as validation is selected as validation data. In this way, each data point is used for training and validation. The model performance is evaluated by averaging the model results obtained from k training. According to [35], 5 and 10 values are commonly used for k. For this reason, the k value is chosen as 5 for the models that use grid search in the study.
There are different performance criteria for evaluating ANN models. These criteria vary depending on whether the model is a classification or function estimation model. Since the MLP used in this study is a regression model, the performance of the model is evaluated based on four performance measures commonly used in this field. These four performance measures are discussed below [36]:
The R2 measure represents how much of the total variance in the output values is explained by the input variables. The closer the R2 value is to 1, the better the model fits the data.
The RMSE measure represents the average error of the model’s predictions relative to the actual values. This measure is very similar to MAE, but it is more sensitive to large errors, penalizing errors more than MAE. For this reason, RMSE usually takes a higher value than MAE. A smaller value means that the model performs better.
The MAE measure represents the average absolute error of the model’s predictions relative to the true values. MAE is less sensitive to large errors than RMSE. Similar to RMSE, smaller errors indicate better performance of the model.
The MAPE measure is the average of the errors in percentage terms. It indicates how much the model’s predictions deviate from the true values in percentage terms. The smaller this value, the better the model performance.
In the creation of the training, validation, and test data required for the creation of MLP models to be used in optimization, different designs are obtained by creating lattice structures on the B section shown in Figure 1 using the parameters in Table 2 as input, and the MAS method is applied to these designs within the framework of the analysis conditions specified in Figure 2. As a result of the MAS, the weight of the part and the MVM stress value on the part are recorded as output.
While creating the training data, the number of data points is preferred to be 240, considering many factors that increase the complexity of the MLP model, such as the complexity of the structure in the design, the input parameters potentially incomplete in terms of representing the MLP model, and the effect of mesh structures on the model in the MAS part. While determining the parameters of these 240 training data points, the LHS method is preferred. LHS is a sampling method that divides the sample space into equal probability intervals and selects a sample from each interval, thus covering all intervals of the parameters [37]. In this way, it increases the performance of the model by distributing the sample space in the training data in a balanced way.
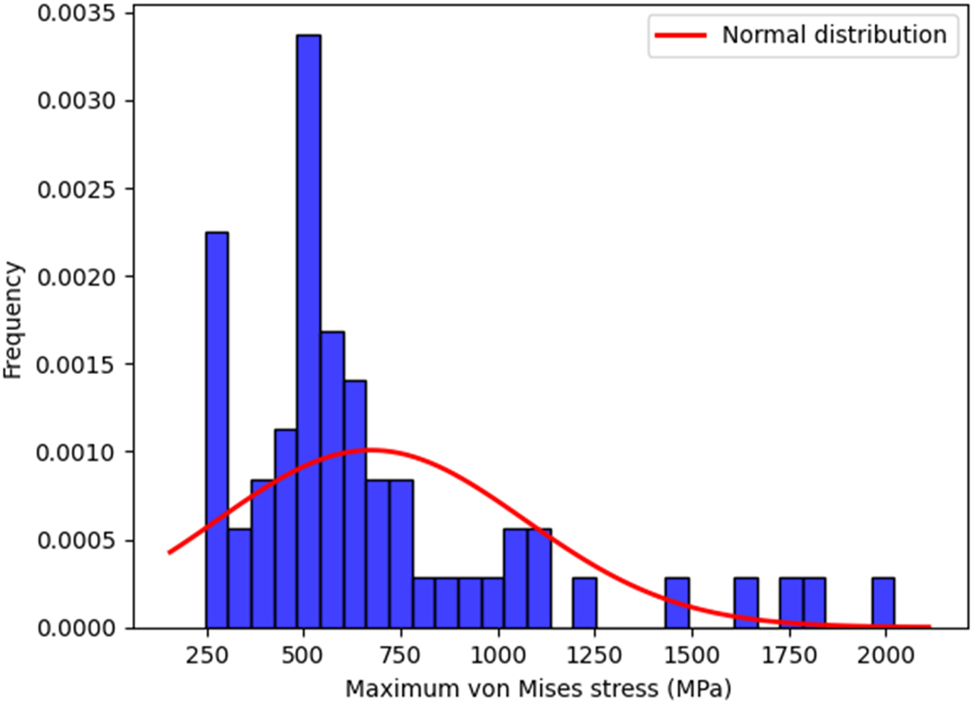
Looking at the histogram graph in Figure 4a of the training data generated with the LHS method, it is observed that the MVM output value is not evenly distributed. The MLP model, Model-Stress, which is used to predict the MVM value in the optimization algorithm, is required to make better predictions around the critical region containing values of 350–650 MPa, which is close to the yield strength value of the material set as a constraint in the optimization algorithm. In line with this request, instead of selecting the validation data to be used by the model during training from the training data, it is necessary to create 40 new data points generated in the critical region and to show a normal distribution. Considering the unbalanced output distribution of the training data generated by the LHS method, it is concluded that a different algorithm should be used to generate these validation data instead of using the LHS method. Based on this information, an ANN model, model-V, with inputs D, CSX, CSY, CSZ, and output MVM, and model-mass with the same inputs but output mass, are created using 240 training data points to generate validation data. While creating these two models, grid search algorithm is used to maximize the R2 value for model-V and minimize the MAPE value for model-mass using the hyperparameters specified in Table 3. Subsequently, an input combination pool containing all combinations of the lattice structure parameters specified in Table 2 is created. All combinations in this pool are estimated with model-V, 40 combinations are selected from the combinations whose MVM values are within the critical region and then analyzed with MAS, and the actual MVM values are obtained. As a result of this method, a validation dataset with 40 data points is created with a normal distribution in the critical region, and the MVM distribution is shown in the histogram graph in Figure 4b.
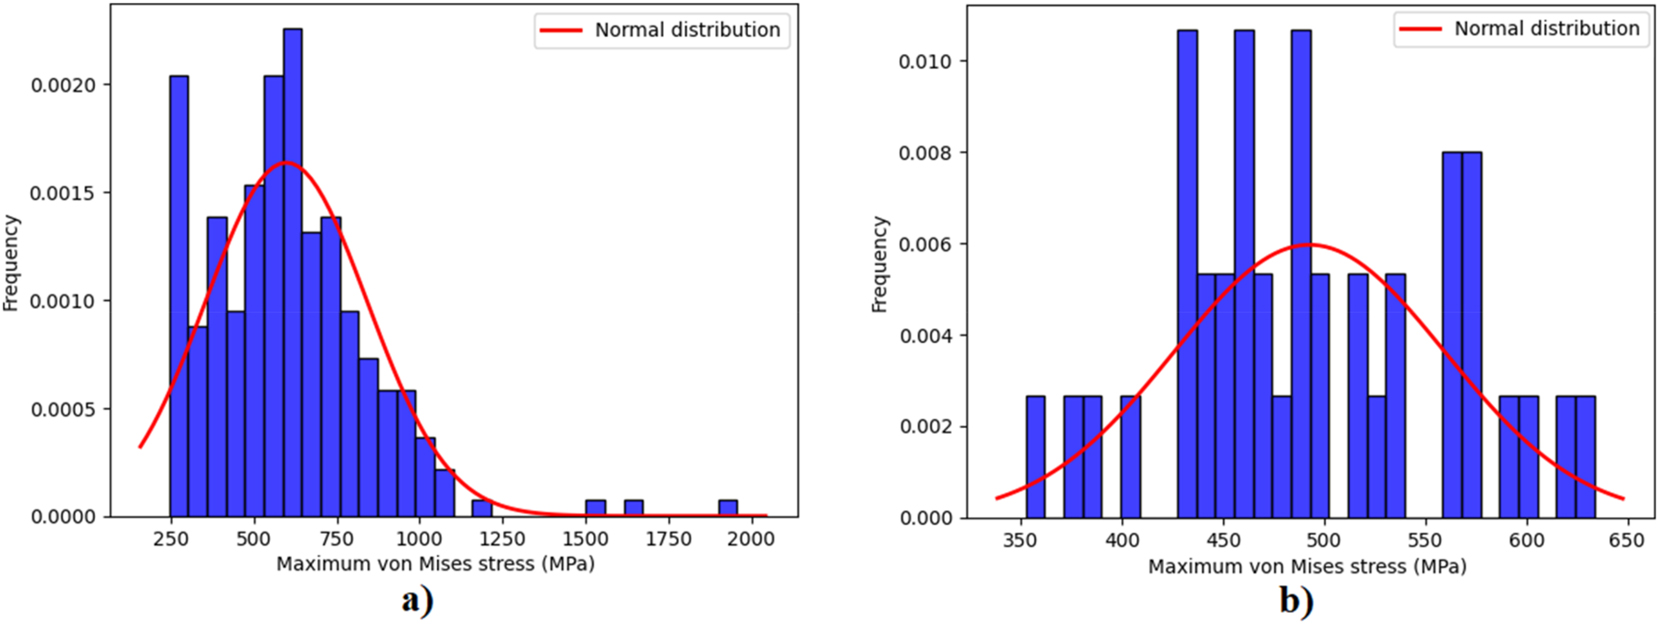
(a) Normal distribution histogram of the training data, (b) normal distribution histogram of the validation data.
Using the split method logic, 240 training data points are retrained with the model hyperparameters specified in Table 3, in a way to minimize the MAPE performance criterion on the validation data. Model-stress is created by selecting the hyperparameters with the best model performance. The models are shown in Table 4 with their methods.
Models.
| Model-V | Model-stress | Model-mass | |
|---|---|---|---|
| Train data | 240 | 240 | 240 |
| Method | CV (k = 5) | Split | CV (k = 5) |
| Validation data | – | 40 | – |
| Strategy | R2 maximize | MAPE minimize | MAPE minimize |
The test data required to test the performance of the generated models is created in the same way as the validation data and in 25 % of the training data, amounting to 60 pieces. Since it is generated similarly to the validation data, a balanced MVM output distribution is achieved, and the performance of the models in the critical region can be better measured. In this way, the number of data points in the critical region in the test data is selected as 30, and the remaining 30 data points are produced with a balanced distribution between the values in the range of 0–349 MPa and 651 MPa and above. Test data MVM distribution is shown in the histogram graph in Figure 5.
Normal distribution histogram of the test data.
In order to optimize the brake pedal, it is required that an optimization algorithm be employed to utilize the models created with the data generated as a result of the various methods employed. There are numerous optimization algorithms currently available [38], [39], [40], [41], [42], [43], [44], [45], [46], [47], [48]. For example, in [38] comprehensive study on the classification, applications, and challenges of meta-heuristic algorithms, he discusses 540 different optimization algorithms. Among these various optimization algorithms, non-dominated sorting genetic algorithm II (NSGA-II) is chosen for this study.
The NSGA-II algorithm is a multi-objective optimization algorithm with strong efficiency and effectiveness in various domains, especially in complex problems. Developed by [39] in 2002, NSGA-II employs a fast non-dominated sorting approach and an elitist strategy to maintain diversity among solutions while converging towards the Pareto-optimal front. This multi-objective algorithm is advantageous in scenarios where multiple objectives must be optimized simultaneously [40]. The ability of NSGA-II to handle large populations and its reduced computational complexity are some of the features that make the algorithm stand out. For these reasons, it is used in many applications [41].
NSGA-II is widely applied in various fields and successfully demonstrates these features. For example [42], study on optimizing the production process of metal mines uses the NSGA-II optimization algorithm to improve solution quality. Another study uses NSGA-II to reduce costs and increase efficiency in the design of solar cells [43]. Overall, NSGA-II proves to be a reliable and successful optimization algorithm for various optimization applications [44], [45].
After the choice of the NSGA-II algorithm, the previously created models are used as constraints and objective functions in the NSGA-II algorithm, and the optimum parameters are reached as a result of the optimization. When using the NSGA-II algorithm, population size 1,000 and number of generations 5,000 are preferred. These values are chosen high because ANN models integrated into the NSGA-II algorithm can make predictions very quickly.
3 Result and discussion
To compare the design obtained as a result of the optimization with the initial design, the mass of the initial design is calculated to be 401.642 g and is analysed by the MAS method and the MVM value is recorded as 245.5 MPa. For a better understanding of the analysis result, the MAS result is shown in Figure 6.
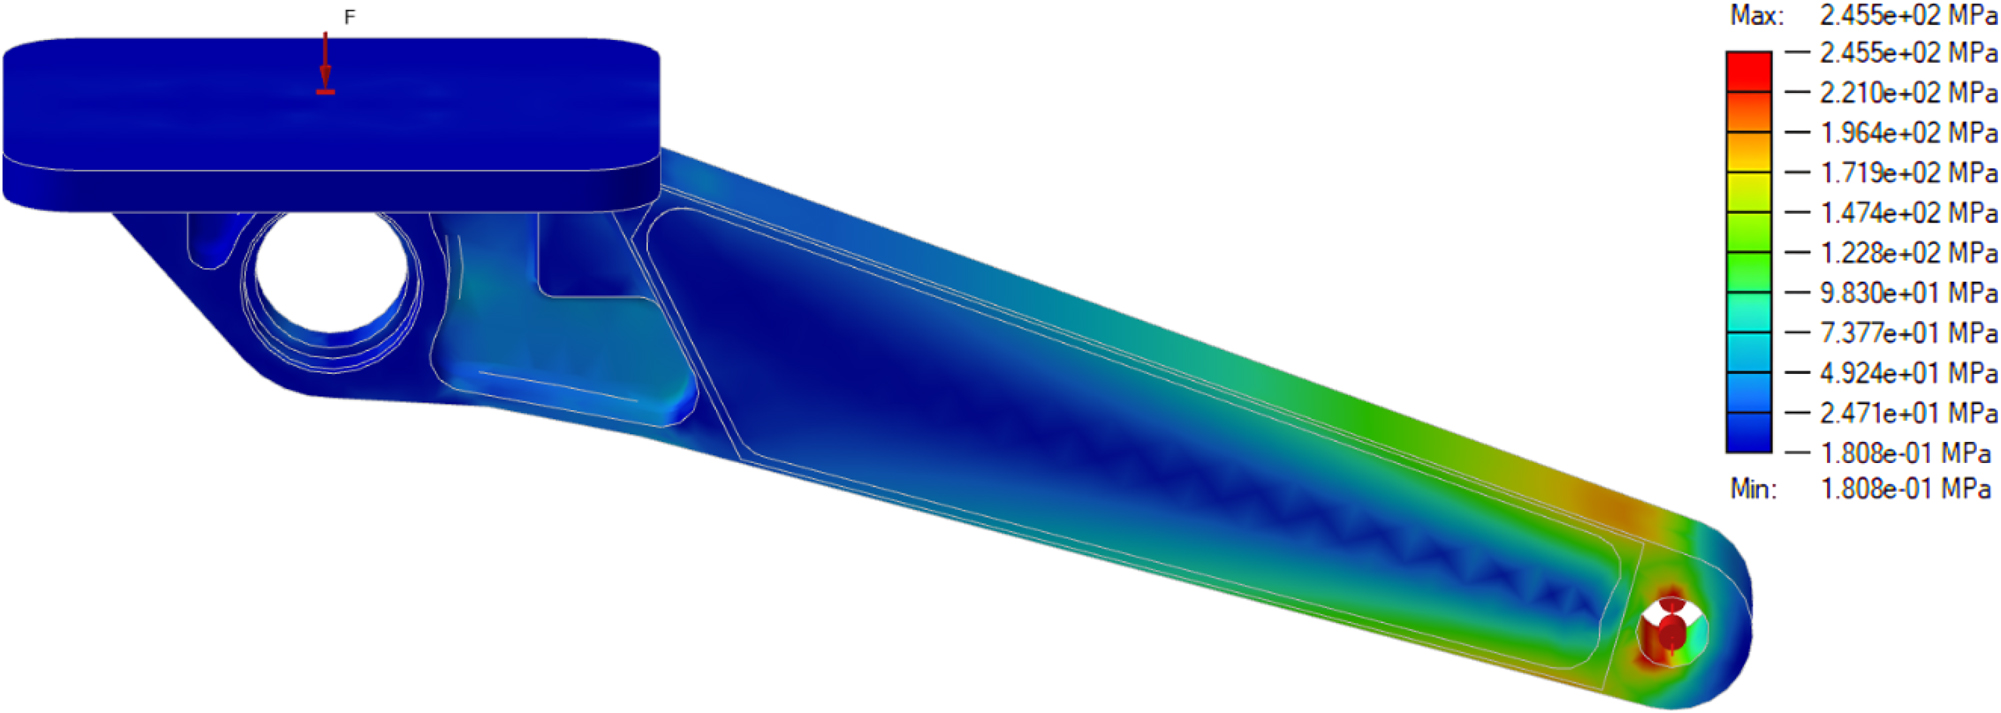
MAS result of initial brake pedal design.
The models shown in Table 4 are created in line with the methods described previously, and the hyperparameters with the best performance of the models are shown in Table 5.
Hyperparameters of models.
| Model | Hidden layer sizes | η | α |
|---|---|---|---|
| Model-V | (64, 64, 16, 256) | 0.1 | 0.01 |
| Model-stress | (256, 32, 16, 128) | 0.01 | 0.01 |
| Model-mass | (128, 256, 32, 64) | 0.01 | 0.1 |
The performance of the obtained optimum models on the test data and their performance in the critical region of the test data are evaluated and shown in Figure 7.
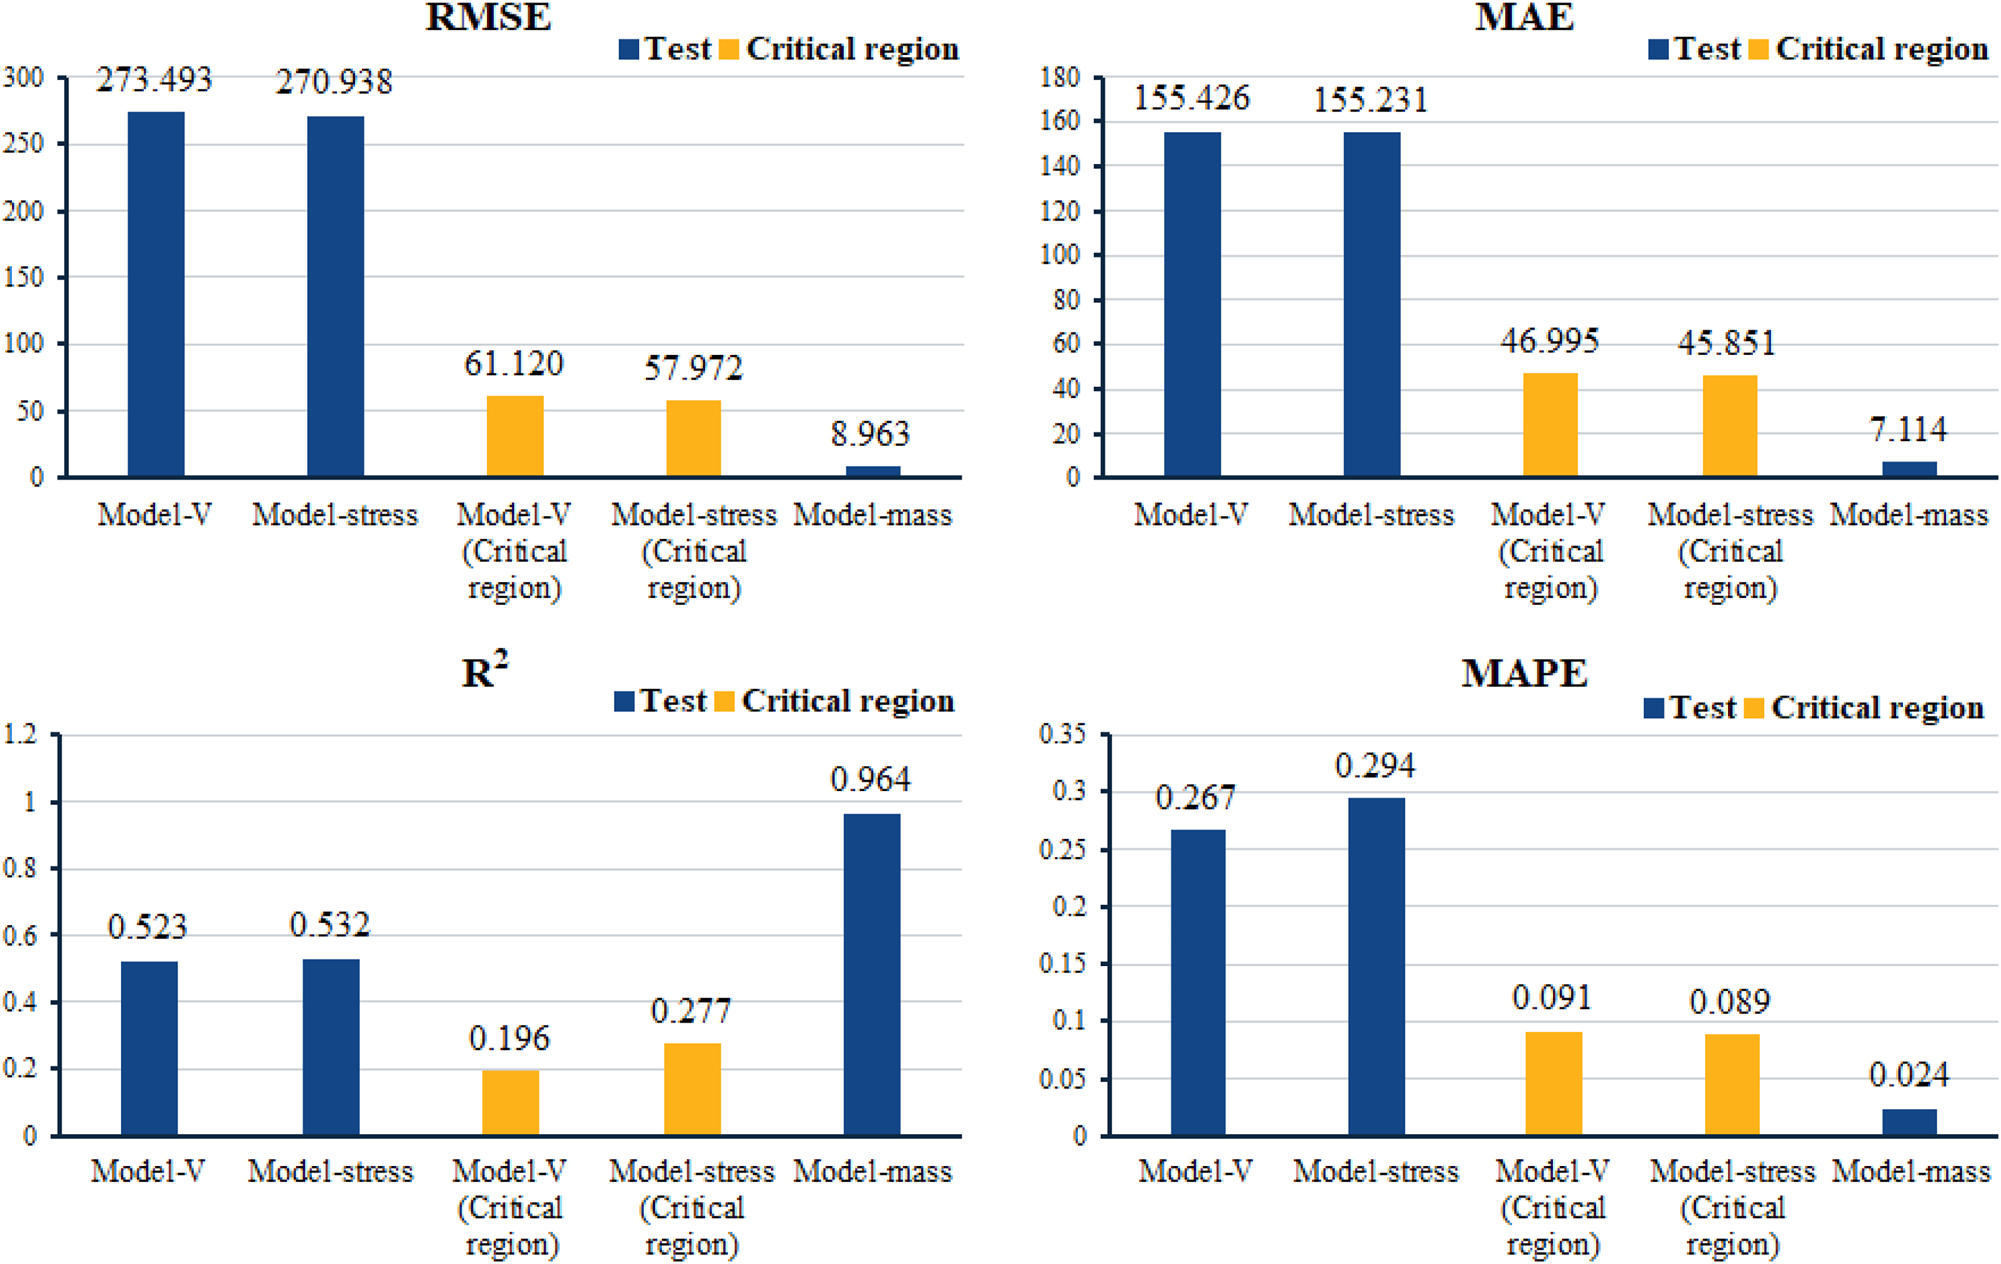
Performances of models.
Figure 7 clearly shows that model-stress outperforms model-V in all performance measures in the critical region. From this point of view, it is concluded that the generation of validation data in the critical region has a positive effect on the predictive power of the model in this region and the method is successful. Overall, model-stress achieves a high MAPE value of 29.4 %. However, this model, which will be used as a constraint function in the optimization algorithm, achieves a low error rate of 8.9 % in the critical region where the optimization algorithm will focus. Model-mass, which will be used as the objective function in the optimization algorithm, gives a very successful result in all performance measures.
Since the models perform well, the potential optimum lattice structure parameters and their outputs, mass and MVM, are quickly estimated using these models integrated into the NSGA-II optimization algorithm without the need for further analysis. A new design is created with these optimally estimated parameters and analysed by MAS method to obtain the actual output values.
Since the models perform well, the potential optimum lattice structure parameters are quickly estimated by using these models in the optimization algorithm NSGA-II without the need for further analysis. To obtain the actual results of these optimally estimated parameters, they are analyzed by the MAS method. The comparison of the prediction results obtained through optimization and the true results obtained as a result of MAS is shown in Table 6.
Comparison of the MAS and optimization results for the NSGA-II.
| Optimization | MAS | Error (%) | |
|---|---|---|---|
| D (mm) | 1.688 | 1.688 | – |
| CSX | 2 | 2 | – |
| CSY | 6.001 | 6.001 | – |
| CSZ | 9.999 | 9.999 | – |
| Mass (g) | 297.017 | 293.345 | 1.252 |
| MVM (MPa) | 502.999 | 499.356 | 0.730 |
When Table 6 is examined, it is observed that the prediction value obtained as a result of the optimization algorithm is very close to the actual value, the 503 MPa constraint value, which is the yield strength of the material, is achieved, and the initial weight of the brake pedal is reduced from 401.642 to 293.345 g, which is approximately 26.96 %. The potential optimum design obtained as a result of the optimization is shown in Figure 8, and the MAS result is shown in Figure 9.
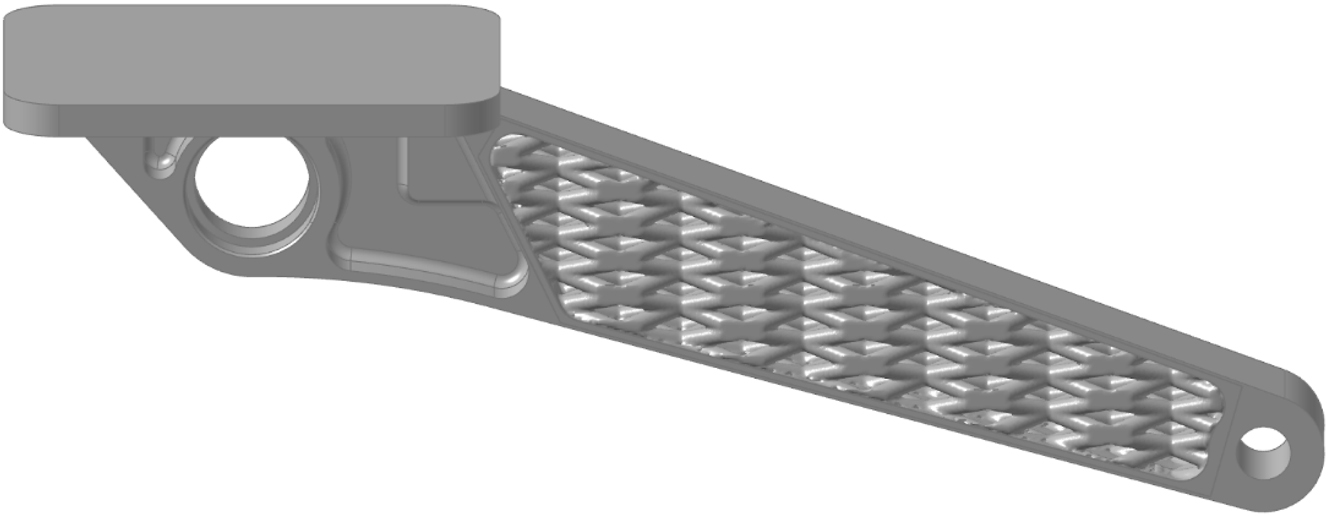
Potential optimum brake pedal design.
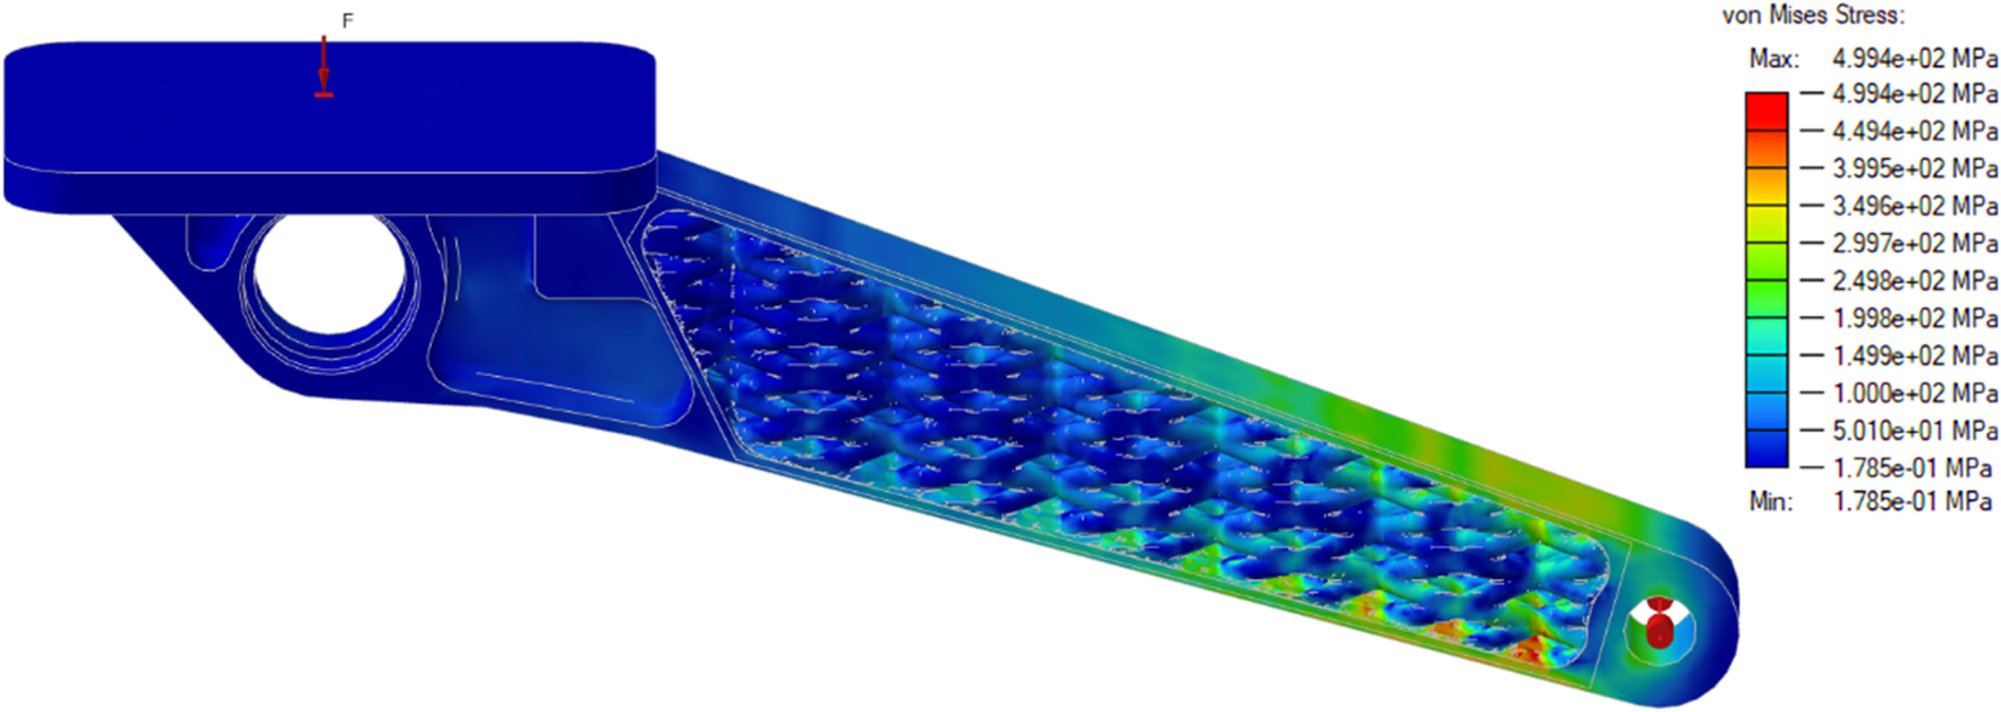
MAS result of potential optimum brake pedal design.
4 Conclusions
The study presents an optimization approach is presented to reduce the weight of the brake pedal by integrating ANN models into the NSGA-II algorithm. The findings of the study show that the design obtained as a result of the optimization is 26.96 % lighter compared to the initial design. This is achieved without exceeding the yield limit of 503 MPa of Al 7075 T6 material. In this way, the brake pedal design is lightened in such a way that it can successfully continue its operation without plastic deformation under current operating conditions.
Throughout the study, the performance of the ANN models is taken into extra consideration in the critical region where the optimization algorithm focuses in the search for the potential optimum design. For this reason, in the Model-Stress model that predicts the MVM stress, the prediction ability of the model in this region is increased with the validation data created specifically for the critical region. As a result of this approach, an MLP model with a low MAPE error value of 8.9 % in the critical region is developed for use in the optimization algorithm.
With the ANN models created with the correct training data and the models developed by employing additional methods to increase the model performance, the optimization algorithm is able to predict the mass and MVM values with a very low error of 1.252 and 0.730 %, respectively, without the need to analyse the new designs containing complex lattice structures. This success demonstrates how effective ANNs can be in the process of optimizing designs with such complex lattice structures. Finally, the methodology applied in this study proves successful. To advance and refine these methodologies, the following strategies can be investigated:
The efficacy of ANN models can be more rigorously assessed by applying them to diverse lattice structures and designs, thereby facilitating a more comprehensive evaluation of their performance across a range of complex geometries.
The employment of various experimental design methodologies and sampling techniques can facilitate the creation of more reliable and diverse training, validation, and test datasets, thereby enhancing the overall robustness of the model.
The efficacy of meta-models developed using different ANN architectures or other machine learning algorithms can be evaluated in order to identify the most effective approach for a given application.
About the authors
Enes Kurt is a PhD student at in the Department of Mechanical Engineering, Bursa Uludağ University, Bursa, Turkey. His research interests are the analysis of structural components, lattice structures, lightweight design, additive manufacturing, artificial neural networks and optimization.
Dr. Ali Rıza Yıldız is a Professor in the Department of Mechanical Engineering, Bursa Uludağ University, Bursa, Turkey. His research interests are the finite element analysis of structural components, lightweight design, vehicle design, vehicle crashworthiness, shape and topology optimization of vehicle components, meta-heuristic optimization techniques, and additive manufacturing.
Dr. Tülin İnkaya is a Professor in the Department of Industrial Engineering, Bursa Uludağ University, Bursa, Turkey. Her research interests are the artificial Intelligence, computer Learning and pattern Recognition, optimization theory and methods, supply chain and logistics management.
Dr. Ahmet Remzi Özcan is an Assistant professor in the Department of Mechatronics Engineering at Bursa University, Bursa, Turkey. His research interests are the optimization of mechanical and mechatronic systems, meta-heuristic optimization algorithms.
İstemihan Gökdağ is a PhD student at in the Department of Mechanical Engineering, TOBB University of Economics and Technology, Ankara, Turkey. His research interests are the finite element analysis of structural components, lattice structures, lightweight design, additive manufacturing and optimization.
-
Research ethics: Not applicable.
-
Informed consent: Not applicable.
-
Author contributions: The authors have accepted responsibility for the entire content of this manuscript and approved its submission. Enes Kurt: Writing – original draft, Software, Methodology, Conceptualization. Ali Rıza Yıldız: Supervision, Project administration, Investigation, Formal analysis, Wiriting. Tülin İnkaya: Validation, Supervision, Data curation. Ahmet Remzi Özcan: Writing – review & editing, Validation, Software. İstemihan Gökdağ: Writing – review & editing, Investigation, Resources.
-
Use of Large Language Models, AI and Machine Learning Tools: None declared.
-
Conflict of interest: The authors state no conflict of interest.
-
Research funding: None declared.
-
Data availability: Not applicable.
References
[1] A. Jaber, A. Singh, D. C. Rodopoulos, and N. Karathanasopoulos, “Inner design and strain-rate effects on the performance of architected materials and interpenetrating phase composites: state-of-the-art analysis and perspectives,” Adv. Eng. Mater., 2025, https://doi.org/10.1002/adem.202500870.Search in Google Scholar
[2] M. E. Korkmaz, M. K. Gupta, G. Robak, K. Moj, G. M. Krolczyk, and M. Kuntoğlu, “Development of lattice structure with selective laser melting process: a state of the art on properties, future trends and challenges,” J. Manuf. Process., vol. 81, pp. 1040–1063, 2022, https://doi.org/10.1016/j.jmapro.2022.07.051.Search in Google Scholar
[3] I. S. Kinstlinger et al.., “Open-source selective laser sintering (opensls) of nylon and biocompatible polycaprolactone,” Plos One, vol. 11, p. e0147399, 2016, https://doi.org/10.1371/journal.pone.0147399.Search in Google Scholar PubMed PubMed Central
[4] F. Tamburrino, S. Graziosi, and M. Bordegoni, “The design process of additively manufactured mesoscale lattice structures: a review,” J. Comput. Inf. Sci. Eng., vol. 18, 2018, https://doi.org/10.1115/1.4040131.Search in Google Scholar
[5] B. Vayre, F. Vignat, and F. Villeneuve, “Metallic additive manufacturing: state-of-the-art review and prospects,” Mech. Amp; Industry, vol. 13, pp. 89–96, 2012, https://doi.org/10.1051/meca/2012003.Search in Google Scholar
[6] Z. Liu, R. Zhao, C. Tao, Y. Wang, and X. Liang, “Mechanical performance of a node-reinforced body-centered cubic lattice structure: an equal-strength concept design,” Aerospace, vol. 11, p. 4, 2023, https://doi.org/10.3390/aerospace11010004.Search in Google Scholar
[7] X. Wang et al.., “Evaluating lattice mechanical properties for lightweight heat-resistant load-bearing structure design,” Materials, vol. 13, p. 4786, 2020, https://doi.org/10.3390/ma13214786.Search in Google Scholar PubMed PubMed Central
[8] A. R. Aziz, J. Zhou, D. Thorne, and W. Cantwell, “Geometrical scaling effects in the mechanical properties of 3d-printed body-centered cubic (bcc) lattice structures,” Polymers, vol. 13, p. 3967, 2021, https://doi.org/10.3390/polym13223967.Search in Google Scholar PubMed PubMed Central
[9] K. Park, K. Min, and Y. Roh, “Design optimization of lattice structures under compression: study of unit cell types and cell arrangements,” Materials, vol. 15, p. 97, 2021, https://doi.org/10.3390/ma15010097.Search in Google Scholar PubMed PubMed Central
[10] S. Rosso, G. Savio, F. Uriati, R. Meneghello, and G. Concheri, “Optimization approaches in design for additive manufacturing,” in Proceedings of the Design Society: International Conference on Engineering Design, vol. 1, 2019, pp. 809–818.10.1017/dsi.2019.85Search in Google Scholar
[11] B. Li and C. Shen, “Solid stress-distribution-oriented design and topology optimization of 3d-printed heterogeneous lattice structures with light weight and high specific rigidity,” Polymers, vol. 14, p. 2807, 2022, https://doi.org/10.3390/polym14142807.Search in Google Scholar PubMed PubMed Central
[12] S. A. Hassanieh, A. Alhantoobi, K. A. Khan, and M. A. Khan, “Mechanical properties and energy absorption characteristics of additively manufactured lightweight novel re-entrant plate-based lattice structures,” Polymers, vol. 13, p. 3882, 2021, https://doi.org/10.3390/polym13223882.Search in Google Scholar PubMed PubMed Central
[13] M. K. Thompson et al.., “Design for additive manufacturing: trends, opportunities, considerations, and constraints,” CIRP Annals, vol. 65, pp. 737–760, 2016, https://doi.org/10.1016/j.cirp.2016.05.004.Search in Google Scholar
[14] B. Lee, M. Mahtab, T. Neo, I. Farooqi, and A. Khursheed, “A comprehensive review of design of experiment (doe) for water and wastewater treatment application - key concepts, methodology and contextualized application,” J. Water Proc. Eng., vol. 47, p. 102673, 2022, https://doi.org/10.1016/j.jwpe.2022.102673.Search in Google Scholar
[15] M. Hadigol and A. Doostan, “Least squares polynomial chaos expansion: a review of sampling strategies,” Comput. Methods Appl. Mech. Eng., vol. 332, pp. 382–407, 2018, https://doi.org/10.1016/j.cma.2017.12.019.Search in Google Scholar
[16] M. Sudin, “Topology optimization in automotive brake pedal redesign,” Int. J. Eng. Sci. Technol. (IJET), vol. 6, pp. 398–402, 2014.Search in Google Scholar
[17] M. Sargini, S. Masood, S. Palanisamy, E. Jayamani, and A. Kapoor, “Additive manufacturing of an automotive brake pedal by metal fused deposition modelling,” Mater. Today: Proc., vol. 45, pp. 4601–4605, 2021, https://doi.org/10.1016/j.matpr.2021.01.010.Search in Google Scholar
[18] J. Romero and N. Queipo, “Reliability-based and deterministic design optimization of a fsae brake pedal: a risk allocation analysis,” Struct. Multidiscip. Optim., vol. 56, pp. 681–695, 2017, https://doi.org/10.1007/s00158-017-1747-8.Search in Google Scholar
[19] E. Gupta, D. K. S. Bora, and R. A, “Design and analysis of brake system for fsae race car,” Eng. Res. Express, vol. 4, no. 2, p. 025039, 2022, https://doi.org/10.1088/2631-8695/ac6ecd.Search in Google Scholar
[20] B. D. D. Castro, F. D. C. Magalhães, and J. C. C. Rubio, “Numerical analysis of damage mechanisms for 3d-printed sandwich structures using a meshless method,” Model. Simulat. Mater. Sci. Eng., vol. 30, p. 055003, 2022, https://doi.org/10.1088/1361-651x/ac6cfc.Search in Google Scholar
[21] C. Zhao, X. Li, Q. Zhang, S. Zhao, and S. Wang, “Application of structural rapid simulation technology in railway wagon equipment,” SHS Web Conf., vol. 166, p. 01067, 2023, https://doi.org/10.1051/shsconf/202316601067.Search in Google Scholar
[22] H. Gao and G. Wei, “A meshless manifold method for solving the inverse heat conduction problems,” Adv. Mater. Res., vol. 749, pp. 131–136, 2013, https://doi.org/10.4028/www.scientific.net/amr.749.131.Search in Google Scholar
[23] SAE International, “Formula SAE rules,” 2024, https://www.fsaeonline.com/cdsweb/gen/DownloadDocument.aspx?DocumentID=369d01c0-589d-4ebe-b8d4-b07544f4a52b [Accessed: September 9, 2024].Search in Google Scholar
[24] ASM International, Metals Handbook, Vol.2 - Properties and Selection: Nonferrous Alloys and Special-Purpose Materials, 10th ed., Materials Park, OH, ASM International, 1990.Search in Google Scholar
[25] Y.-Z. Wang, G.-Q. Li, Y.-B. Wang, and Y.-F. Lyu, “Simplified method to identify full von Mises stress–strain curve of structural metals,” J. Constr. Steel Res., vol. 181, p. 106624, 2021, https://doi.org/10.1016/j.jcsr.2021.106624.Search in Google Scholar
[26] Altair Engineering, “Altair inspire help,” 2024, https://help.altair.com/inspire/en_us/topics/implicit/implicit_c.htm [Accessed: September 9, 2024].Search in Google Scholar
[27] Y. Tang, G. Dong, Q. Zhou, and Y. F. Zhao, “Lattice structure design and optimization with additive manufacturing constraints,” IEEE Trans. Autom. Sci. Eng., vol. 15, no. 4, pp. 1546–1562, 2018, https://doi.org/10.1109/TASE.2017.2685643.Search in Google Scholar
[28] M. Maabreh and G. Almasabha, “Machine learning regression algorithms for shear strength prediction of sfrc-dbs: performance evaluation and comparisons,” Arabian J. Sci. Eng., vol. 49, pp. 4711–4727, 2023, https://doi.org/10.1007/s13369-023-08176-y.Search in Google Scholar
[29] J. Patra and A. Kot, “Nonlinear dynamic system identification using chebyshev functional link artificial neural networks,” IEEE Trans. Syst. Man Cybern. B Cybern., vol. 32, no. 4, pp. 505–511, 2002, https://doi.org/10.1109/TSMCB.2002.1018769.Search in Google Scholar PubMed
[30] H. Zhu, “Multi-layered perceptron and its applications in biotechnology,” Theor. Nat. Sci., 2023, https://doi.org/10.54254/2753-8818/20/20230753.Search in Google Scholar
[31] D. Pardede, B. Hayadi, and I. Iskandar, “Kajian literatur multi layer perceptron seberapa baik performa algoritma ini,” J. Ict Appl. Syst., 2022, https://doi.org/10.56313/jictas.v1i1.127.Search in Google Scholar
[32] Z. Yan et al.. “A multi-energy load prediction of a building using the multi-layer perceptron neural network method with different optimization algorithms,” Energy Explor. Exploit., vol. 41, pp. 273–305, 2022, https://doi.org/10.1177/01445987221112250.Search in Google Scholar
[33] A. Kaveh, M. Rezaei, and M. Shiravand, “Optimal design of nonlinear large-scale suspendome using cascade optimization,” Int. J. Space Struct., vol. 33, pp. 3–18, 2017, https://doi.org/10.1177/0266351117736649.Search in Google Scholar
[34] B. Al-Shargabi, F. Al-Shami, and R. S. Alkhawaldeh, “Enhancing multi-layer perceptron for breast cancer prediction,” Int. J. Adv. Sci. Technol., 2019, https://doi.org/10.33832/ijast.2019.130.02.Search in Google Scholar
[35] G. James, D. Witten, T. Hastie, and R. Tibshirani, An Introduction to Statistical Learning: With Applications in R, Ser. Springer Texts in Statistics, vol. 112, New York, NY, Springer, 2013.10.1007/978-1-4614-7138-7Search in Google Scholar
[36] A. Botchkarev, “A new typology design of performance metrics to measure errors in machine learning regression algorithms,” Interdiscipl. J. Inf. Knowl. Manag., vol. 14, pp. 45–79, 2019, https://doi.org/10.28945/4184.Search in Google Scholar
[37] R. Iman, “Latin hypercube sampling,” Encyclopedia of Quantitative Risk Analysis and Assessment, 1999, https://doi.org/10.1002/9780470061596.risk0299.Search in Google Scholar
[38] K. Rajwar, K. Deep, and S. Das, “An exhaustive review of the metaheuristic algorithms for search and optimization: taxonomy, applications, and open challenges,” Artif. Intell. Rev., vol. 56, pp. 13 187–13 257, 2023, https://doi.org/10.1007/s10462-023-10470-y.Search in Google Scholar PubMed PubMed Central
[39] K. Deb, A. Pratap, S. Agarwal, and T. Meyarivan, “A fast and elitist multiobjective genetic algorithm: NSGA-II,” IEEE Trans. Evol. Comput., vol. 6, no. 2, pp. 182–197, 2002, https://doi.org/10.1109/4235.996017.Search in Google Scholar
[40] R. M. V. Vitorino, H. M. Jorge, and L. Neves, “Multi-objective optimization using NSGA-II for power distribution system reconfiguration,” Int. Trans. Electr. Energy Syst., vol. 25, pp. 38–53, 2013, https://doi.org/10.1002/etep.1819.Search in Google Scholar
[41] C. Ma, W. Wang, Z. Cai, and J. Zhao, “Maintenance optimization of reconfigurable systems based on multi-objective birnbaum importance,” Proc. Inst. Mech. Eng. O J. Risk Reliab., vol. 236, pp. 277–289, 2020, https://doi.org/10.1177/1748006x20901983.Search in Google Scholar
[42] X. Gu, W. Xun-hong, Z. Liu, W. Zha, X. Xu, and M. Zheng, “A multi-objective optimization model using improved NSGA-II for optimizing metal mines production process,” IEEE Access, vol. 8, pp. 28 847–28 858, 2020, https://doi.org/10.1109/access.2020.2972018.Search in Google Scholar
[43] V. K. Ojha, G. Jansen, A. Patané, A. L. Magna, V. Romano, and G. Nicosia, “Design and characterization of effective solar cells,” Energy Syst., vol. 13, pp. 355–382, 2021, https://doi.org/10.1007/s12667-021-00451-x.Search in Google Scholar
[44] Z. Zhang, Z. Huang, X. Liu, and B. Feng, “Research on multiple air-to-air refueling planning based on multi-dimensional improved NSGA-II algorithm,” Electronics, vol. 12, p. 3880, 2023, https://doi.org/10.3390/electronics12183880.Search in Google Scholar
[45] I. Rahimi, A. H. Gandomi, K. Deb, C. Fang, and M. R. Nikoo, “Scheduling by NSGA-II: review and bibliometric analysis,” Processes, vol. 10, p. 98, 2022, https://doi.org/10.3390/pr10010098.Search in Google Scholar
[46] A. R. Özcan, P. Mehta, S. M. Sait, D. Gürses, and A. R. Yildiz, “A new neural network–assisted hybrid chaotic hiking optimization algorithm for optimal design of engineering components,” Mater. Test., vol. 67, no. 6, pp. 1069–1078, 2025, https://doi.org/10.1515/mt-2024-0519.Search in Google Scholar
[47] N. Panagant et al.., “Multi-objective optimization of truss structures using the enhanced lichtenberg algorithm,” Mater. Test., vol. 67, no. 2, pp. 297–312, 2025, https://doi.org/10.1515/mt-2024-0190.Search in Google Scholar
[48] K. Balamurugan, J. V. Elies, P. Sathiya, and A. N. Sait, “Optimization of friction welding parameters of AISI 904L super austenitic stainless steel by evolutionary computational techniques,” Mater. Test., vol. 56, no. 3, pp. 245–250, 2014, https://doi.org/10.3139/120.110550.Search in Google Scholar
© 2025 the author(s), published by De Gruyter, Berlin/Boston
This work is licensed under the Creative Commons Attribution 4.0 International License.