Assessment of thyroid gland vascularity with superb microvascular imaging in healthy children and its relationship with potential factors
-
Mehmet Ozturk

 ,
Mehmet Sedat Durmaz
,
Mehmet Sedat Durmaz

Abstract
Objectives
To define thyroid gland vascularity index (VI) values in healthy children with the superb microvascular imaging (SMI) method and to assess whether or not there is a correlation with potential factors that may affect these values.
Methods
This prospective study included a total of 138 children, their ages varying from 3–17 years. Cases were divided into three subgroups according to age: 3–6, 7–12 and 13–17 years. Gender, age, height, weight, body mass index (BMI), thyroid-stimulating hormone (TSH) and free thyroxine (fT4) values were recorded. Volume and SMI measurements were performed with a 14 L5 mHz linear transducer. VI measurements were performed in the transverse and longitudinal planes and correlation with basic descriptive data was researched.
Results
Mean age was 11.14 ± 3.34 years and BMI was 19.95 ± 4.92. VI values were 4.59 ± 2.34 in the right lobe and 4.23 ± 2.73 for the left lobe, with no significant difference identified. There were no significant differences in mean VI for all parenchyma regarding gender and age groups. While there was no correlation identified with mean VI for all parenchyma with TSH and fT4, there was, however, a negative correlation with BMI.
Conclusions
Reference VI values for normal thyroid glands in healthy children and adolescents were defined with the SMI method. There was no correlation between the VI values and age, gender, volume, TSH and fT4 values, while there was a negative significant correlation with BMI.
Introduction
Ultrasonography (US) is a valuable radiologic method used to identify diffuse and focal diseases of the thyroid gland [1]. US is critically important in assessing thyroid lesions in the childhood period. Showing the dimensions of the thyroid gland and parenchyma echo variations provides very valuable information for the diagnosis and monitoring of thyroid pathologies [2].
Superb microvascular imaging (SMI) is a newly developed perfusion imaging technique that can distinguish perfusion signals at low speed in layered tissue movements and fine low-perfusion components with a high level of detail and resolution. SMI is a method that uses diffused compression to remove perfusion signals from large to small veins. This information may be shown through color-loaded images (color SMI) with high square speeds or as part of a greyscale perfusion map (single-color SMI). SMI is also used to analyze dispersed movements. New adaptable algorithms can identify tissue movement and reveal true blood perfusion. An automatic application allows quantification of signals created by taking the ratios of all pixels in a region of interest (ROI) with the use of color pixels. Quantitative data analysis are performed by using the calculated vascularity index (VI) [3], [4].
SMI has become the adopted method for its ability to differentiate between malignant and benign thyroid nodules in the adult age group [5]. In the pediatric population, there are studies that assess the variations in thyroid vascularity with SMI, especially in Hashimoto’s thyroiditis [6], [7]. To the best of our knowledge, there is no study in the literature reporting the VI values for normal thyroid parenchyma in healthy children.
This study has three different aims. The first is to research the correlation between normal thyroid VI values, determined with SMI in healthy children, and gender, body mass index (BMI), thyroid-stimulating hormone (TSH), free thyroxine (fT4) and thyroid volume. The second is to compare the differences between preschool, school age and adolescent groups. The third aim is to identify the accuracy of VI values using VI measurements on SMI in different planes.
Materials and methods
Study subjects and design
This prospective study assessed 138 pediatric cases (ages 3–17 years, mean 10.35 ± 3.51), which included 48 boys and 80 girls. Permission was granted by the local ethics committee and informed consent was obtained from the parents of all children. Cases included children attending the clinic due to problems unrelated to the thyroid gland. Exclusion criteria were autoimmune, infectious, inflammatory or neoplastic thyroid gland disorders or abnormal grayscale US findings of the thyroid gland. Data related to gender, age, weight and height were recorded for all subjects. BMI was calculated using the following formula: BMI = weight (kg)/height (m)2. All hormone tests were completed in the same laboratory within one week before VI measurements.
US and SMI evaluation
All US and SMI investigations were performed by a pediatric radiologist with 11 years’ experience in the use of US and three years’ experience in SMI. All participants had thyroid gland assessed with B-mode imaging and SMI with a high-frequency (4–14 MHz) linear sequence transducer on a Canon Aplio 500 device (Canon Medical System Corporation, Tokyo, Japan). Investigations began with participants in the supine position, neck slightly extended for standard grayscale US examination. The three dimensions (length [L] × width [W] × height [H]) of both thyroid lobes were measured in millimeters. The thyroid gland volume was separately calculated for the right and left lobes using formula L × W × H × 0.523 automatically with the software included in the US device (Figure 1). The total of the right and left lobe volumes was defined as total thyroid volume, with isthmus volume not included.
![Figure 1: Measurement of the three dimensions and the volume of the right and left thyroid gland lobe on the transverse and longitudinal section. The total thyroid volume (right lobe volume [2.4 cm3] + left lobe volume [1.9 cm3]) measured 3.3 cm3.](/document/doi/10.1515/jpem-2020-0224/asset/graphic/j_jpem-2020-0224_fig_001.jpg)
Measurement of the three dimensions and the volume of the right and left thyroid gland lobe on the transverse and longitudinal section. The total thyroid volume (right lobe volume [2.4 cm3] + left lobe volume [1.9 cm3]) measured 3.3 cm3.
Vascular imaging of the thyroid gland used a pulse repetition frequency set to 150–180 Hz, with the same US device equipped with SMI function. VI measurements were performed on SMI images. Color SMI vascular investigation was performed on images enlarged to their maximum. According to plane, thyroid gland was investigated for 5 s using cSMI to measure VI, with the image then frozen. The VI calculation program was activated. Quantitative VI values were calculated following a manual drawing of the margins of the whole thyroid gland using free ROI. The 5 s image was investigated in reverse, and the highest VI values calculated for this period were noted. Greyscale pixels were eliminated and color pixels were automatically calculated. Quantitative VI values were obtained by calculating the ratio of color pixel numbers to total pixel count within the ROI. VI measurements were performed separately for right and left lobes in the longitudinal plane, then on the transverse plane including both thyroid lobes (Figure 2). The numerical values for VI for the right and left lobes in the longitudinal plane were added and divided by 2 to calculate the mean VI values for the whole thyroid gland in the longitudinal plane (longitudinal plane right mean VI value + longitudinal plane left mean VI value/2). Following this, mean VI in the longitudinal plane was added to the numerical VI value obtained for the whole thyroid gland in the transverse plane. The total value was divided by 2, and the mean VI value for the whole thyroid gland was calculated (thyroid gland mean VI = [mean VI for thyroid gland in longitudinal plane + mean VI for thyroid gland in transverse plane]/2).
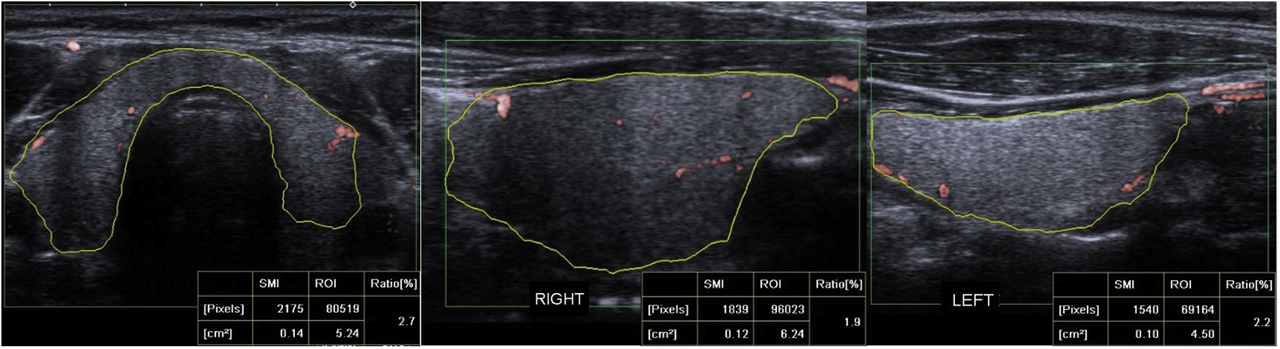
Quantitative SMI VI values were measured by manually drawing the contours of the thyroid gland structure on the cSMI mode, in the longest transverse plane, right lobe, and left lobe longitudinal plane. The quantitative VI values measured 2.7% in transverse plane, 1.9% in right lobe longitudinal plane and 2.2% in left lobe longitudinal plane.
Statistical analysis
Statistical analysis was performed using the Statistical Package for Social Sciences, version 24 (IBM, Armonk, NY) software to evaluate the data. Descriptive statistics are expressed as mean, standard deviation, minimum-maximum values, percentile and frequency. The Kolmogorov–Smirnov test was used to determine the normal distribution of continuous variables. Definitive statistics related to the variables were evaluated. Chi square and one-way analysis of variance (ANOVA) tests were used to evaluate the differences between the two groups. The Pearson correlation analysis was used to evaluate the relationship between the VI values and thyroid hormone levels. The Pearson correlation analysis was used to evaluate the relationship between the thyroid gland volume and thyroglobulin levels. Friedman’s test was used to evaluate the differences between the VI values of different measurement planes and the calculated mean VI values (right lobe VI in longitudinal plane, left lobe VI in longitudinal plane, mean VI in longitudinal plane, VI of thyroid gland in transverse plane and mean VI of thyroid gland).
Results
The mean (SD), minimum and maximum values for age, BMI, TSH, fT4, right lobe volume, left lobe volume, total volume, isthmus thickness, right thyroid lobe mean VI in longitudinal plane, left thyroid lobe mean VI in longitudinal plane, the mean VI of thyroid gland in longitudinal plane (right lobe + left lobe/2), mean VI of thyroid gland in transverse plane and the mean VI of thyroid gland parameters are shown in Table 1. There were statistically significant differences identified between the right and left lobe volumes in the whole group (p = 0.001). When the right lobe VI was compared with the left lobe VI, there was no statistically significant difference identified (p = 0.73).
Characteristics of the patients and VI values of the thyroid.
| Variables (n=138) | Mean (SD) | Minimum | Maximum |
|---|---|---|---|
| Age | 10.35 (3.51) | 3 | 17 |
| BMI | 19.87 (4.47) | 12.10 | 39.9 |
| TSH | 2.79 (1.29) | 0.64 | 6 |
| fT4 | 1.32 (0.16) | 0.97 | 1.73 |
| Right lobe volume | 2.54 (1.54) | 0.24 | 9.87 |
| Left lobe volume | 2.24 (1.34) | 0.36 | 7.57 |
| Total volume | 4.74 (2.83) | 0.57 | 17.38 |
| Isthmus thickness | 2.06 (0.66) | 0.92 | 4.25 |
| Right thyroid lobe mean VI in longitudinal plane | 4.35 (2.21) | 1 | 15.4 |
| Left thyroid lobe mean VI in longitudinal plane | 4.13 (2.61) | 0.60 | 13.3 |
| The mean VI of thyroid gland in longitudinal plane (right long + left Long/2) | 4.24 (2.08) | 1.30 | 11.80 |
| The mean VI of thyroid gland in transverse plane | 4.81 (2.21) | 0.70 | 12.90 |
| The mean VI of thyroid gland | 4.52 (1.8) | 1.03 | 10.75 |
The mean (SD), minimum and maximum values of study parameters by gender are presented in Table 2. There was no statistically significant difference by gender identified for total thyroid volume (p = 0.226). There were no statistically significant differences by gender identified for mean VI for all parenchyma (p = 0.484).
SMI parameters with BMI, TSH, sT4 and volumes were compared sex of the participants.
| Variables (n = 138) | Girls (n = 80) | Boys (n = 48) | ||||
|---|---|---|---|---|---|---|
| Mean (SD) | Min | Max | Mean (SD) | Min | Max | |
| Age | 10.28 (3.38) | 3 | 17 | 10.47 (3.79) | 3 | 17 |
| BMI | 19.85 (4.5) | 12.1 | 39.9 | 19.92 (4.47) | 14.3 | 32.7 |
| TSH | 2.77 (1.26) | 0.83 | 6 | 2.82 (1.36) | 0.64 | 5.51 |
| fT4 | 1.32 (0.16) | 1.02 | 1.73 | 1.31 (0.15) | 0.97 | 1.68 |
| Right lobe volume | 2.59 (1.54) | 0.2 | 7.6 | 2.35 (1.69) | 0.4 | 9.8 |
| Left lobe volume | 2.32 (1.37) | 0.3 | 7 | 2.15 (1.36) | 0.6 | 7.5 |
| Total volume | 4.9 (2.84) | 0.5 | 14.2 | 4.51 (2.98) | 1 | 17.3 |
| Isthmus thickness | 2.07 (0.63) | 1 | 4.2 | 2.04 (0.71) | 0.9 | 4.2 |
| Right thyroid lobe mean VI in longitudinal plane | 4.28 (2.29) | 1.5 | 15.4 | 4.47 (2.09) | 1 | 10.5 |
| Left thyroid lobe mean VI in longitudinal plane | 4.25 (2.74) | 0.6 | 13.3 | 3.9 (2.36) | 0.9 | 11.8 |
| The mean VI of thyroid gland in longitudinal plane (right long + left long/2) | 4.26 (2.14) | 1.3 | 11.8 | 4.19 (2) | 1.3 | 11.15 |
| The mean VI of thyroid gland in transverse plane | 4.99 (2.3) | 0.7 | 12.9 | 4.47 (1.99) | 0.9 | 11.3 |
| The mean VI of thyroid gland | 4.63 (1.94) | 1.03 | 10.75 | 4.33 (1.71) | 1.1 | 9.35 |
TSH, thyroid-stimualting hormone.
The cases were divided into three subgroups of 3–6 years (preschool n = 18), 7–12 years (school age n = 86) and 13–17 years (adolescent n = 34). The mean (SD), minimum and maximum values for study parameters by age group are shown in Table 3. A statistically significant strong positive correlation was found between total volume and age (p = 0.001, Pearson correlation coefficient +0.721). However, there were no statistically significant differences found for mean VI of all parenchyma with age groups (p = 0.852).
SMI parameters with BMI, TSH, sT4 and volumes were compared age group of the participants.
| Age group | 3–6 years (n = 18) | 7–12 years (n = 86) | 13–17 years (n = 34) | ||||||
|---|---|---|---|---|---|---|---|---|---|
| Mean (SD) | Min | Max | Mean (SD) | Min | Max | Mean (SD) | Min | Max | |
| BMI | 18.56 (3.54) | 14.3 | 24.2 | 19.18 (3.99) | 12.1 | 30.8 | 22.32 (5.22) | 14.6 | 39.9 |
| TSH | 3.2 (1.61) | 0.64 | 5.15 | 2.79 (1.32) | 0.83 | 6 | 2.57 (1.01) | 0.99 | 5.51 |
| fT4 | 1.32 (0.12) | 1.1 | 1.51 | 1.3 (0.16) | 1.02 | 1.73 | 1.36 (0.17) | 0.97 | 1.68 |
| Right lobe volume | 0.96 (0.45) | 0.2 | 1.6 | 2.13 (0.92) | 0.60 | 6.2 | 4.27 (1.82) | 1.6 | 9.8 |
| Left lobe volume | 1.01 (0.46) | 0.30 | 1.90 | 1.93 (0.86) | 0.70 | 4.7 | 3.76 (1.5) | 1.9 | 7.5 |
| Total volume | 1.97 (0.88) | 0.50 | 3.4 | 4.06 (1.7) | 1.5 | 10.3 | 8.04 (3.19) | 3.5 | 17.3 |
| Isthmus thickness | 1.3 (0.24) | 0.90 | 2 | 2.01 (0.46) | 1 | 3.2 | 2.56 (0.79) | 1.2 | 4.2 |
| Right thyroid lobe mean VI in longitudinal plane | 3.44 (1.75) | 1 | 7.6 | 4.49 (2.23) | 1 | 15.4 | 4.47 (2.32) | 1.5 | 10.5 |
| Left thyroid lobe mean VI in longitudinal plane | 4.32 (2.55) | 0.60 | 10.6 | 4.14 (2.75) | 0.7 | 13.3 | 3.99 (2.35) | 0.9 | 10.5 |
| The mean VI of thyroid gland in longitudinal plane (right long + left long/2) | 3.88 (1.72) | 1.6 | 7.05 | 4.32 (2.2) | 1.3 | 11.8 | 4.23 (2) | 1.35 | 9.55 |
| The mean VI of thyroid gland in transverse plane | 4.73 (2.38) | 1.3 | 12.9 | 4.88 (2.14) | 0.9 | 11.4 | 4.67 (2.35) | 0.7 | 11.3 |
| The mean VI of thyroid gland | 4.31 (1.71) | 1.55 | 9.5 | 4.6 (1.9) | 1.1 | 10.75 | 4.45 (1.89) | 1.03 | 9.63 |
TSH, thyroid-stimualting hormone.
Correlation analysis was performed between total thyroid volume with BMI, TSH, sT4, mean VI of thyroid gland in transverse plane and the mean VI of thyroid gland, with no statistically significant correlation identified apart from BMI. There was a positive and significant correlation with BMI present (Table 4). Correlation analysis was performed between mean VI for all parenchyma with BMI, TSH and fT4. Apart from BMI, there were no statistically significant correlations identified. There was a negative significant correlation with BMI (Table 4).
Correlation of VI with BMI, TSH and sT4.
| Thyroid volume | The mean VI of thyroid gland | |||
|---|---|---|---|---|
| Pearson correlation coefficient | p-Value | Pearson correlation coefficient | p-Value | |
| BMI | 0.355 | 0.001 | -0.0257 | 0.002 |
| TSH | 0.001 | 0.995 | -0.045 | 0.598 |
| fT4 | 0.124 | 0.148 | 0.032 | 0.711 |
| The mean VI of thyroid gland in transverse plane | 0.023 | 0.790 | ||
| The mean VI of thyroid gland | 0.877 | 0.427 | s | |
TSH, thyroid-stimualting hormone; ft4, free thyroxine
Discussion
Among the most common thyroid pathologies observed in children are simple goiter, autoimmune thyroiditis, hyperthyroidism and nodular diseases of the thyroid. Diagnosis of thyroid diseases is placed with clinical examination, laboratory and imaging findings [8]. Grayscale US is the primary imaging method, with the most significant disadvantage being user dependence. Having grayscale findings that show malignancies such as microcalcifications, thick irregular halo and clear hypoechogenicity may not be sufficient to reach a definite diagnosis. The most commonly observed thyroid disorder in the pediatric population is autoimmune thyroiditis [9]. Thyroid nodules are rare when compared to adults, with incidences of 0.2–5.1%, with 20% of these being malignant [10]. Due to its high prevalence, malignancy should be excluded in this age group. For definite diagnosis, fine needle aspiration biopsy with histopathologic investigation is required. However, these methods are invasive and, unlike in the adult test, sedation is required during the procedure. Identification of variations in vascularity provides beneficial information for diagnosing thyroid pathologies. Conventional color and power Doppler imaging methods are found to not be very sensitive for microvascularity patterns and low blood perfusion rates [11]. Vein extraction methods, like minimal route technique for effective location of mini veins, are limited. This is due to some naturally occurring situations, but like end point, short path and accumulation problems, they may be helpful to extract information related to veins for further diagnosis [12].
With the aim of visualizing low perfusion in microveins, Toshiba (Toshiba Medical Systems, Tokyo, Japan) has developed SMI ultrasound technology performed with an Aplio 500 US device [5]. SMI is a new Doppler method that offers the advantage of comparing color and power Doppler for detailed vein structures [3]. Filtering techniques developed with SMI, using high square speed, removes noise from the background for clearer imaging of small and slow-flow vascular structures. It can be used in two different modes of color and grayscale. Color SMI uses similar coloring to traditional Doppler methods for vascular flow. Monochrome SMI shows white vascular structures on a black background. Power Doppler is based on an integrated Doppler power spectrum linked to lower-angle dependence to identify low-volume and low-flow blood perfusion. When compared to conventional power Doppler for breast masses, SMI displays a high sensitivity and resolution [4]. SMI was shown to be a successful method for assessment of thyroid vascularity. There are many studies reporting significant limitations related to the assessment of vascularity with color Doppler techniques [13]. The available literature reports SMI to be an innovative technology that ensures imaging of tissue veins with no contrast material. This technique reduces movement artifacts, ensuring clear imaging of low-speed blood flow in capillary veins [13].
More recently, new studies have shown the benefits of SMI for various organs in children. A study by Çalışkan et al [14]. assessed the vascularity of the palatine tonsils in healthy children with SMI. The VI of palatine tonsils showed variation according to age and BMI; it did not, however, show any effect by gender. A study comparing SMI with power Doppler for the parotid gland found that SMI provided more detailed information on vascularity compared to the other method and identified no correlation with age, gender and BMI in vascularity values [15]. Similarly, there are studies showing SMI as more effective than traditional Doppler ultrasound techniques for pointing out normal ovarian perfusion [16]. To the best of our knowledge, there is no study reporting normal VI values for the thyroid gland in the childhood period with SMI or the variation in VI according to age, gender, BMI and hormone values. With respect to this point, our study is the first to report standard VI values for the thyroid gland in children.
SMI is not just a diagnostic method for thyroid diseases but also a screening method for asymptomatic or healthy cases. As a result, we think it is necessary to add diagnostic criteria and guidelines if one is to effectively benefit from SMI in screening programs. In our study, it was revealed that VI values in the thyroid gland were not affected to a clear degree by age, gender, thyroid volume, TSH and fT4. These results show SMI to be a reliable standard, due to it being operator independent, functional and able to provide quantitative VI values for assessing thyroid perfusion. However, there was a positive significant correlation with BMI. This was revealed as a link to the structure of thyroid parenchymal tissue and part of the body’s physical development. Additionally, our results illustrate the need for its widespread adoption as a noninvasive diagnostic method due to it providing more detailed information about thyroid vascularity in healthy children than earlier methods. This new method of SMI provides quantitative VI values and may function as an accurate, reliable, practical and useful thyroid diagnostic method in children. To confirm its validity and repeatability and the development of guidelines, it would be necessary to perform studies in different age and disease groups. We hope our data will represent a resource for future studies that have that goal in mind.
Chronic inflammatory processes of the thyroid gland are more common in children, and hyperplasia and malignant diseases are overlooked. Conventional US only provides information about size and parenchyma echogenicity and may be insufficient for diagnosis. In this situation, SMI may be very beneficial for diagnosis due to quantitative reflection of variations in tissue perfusion. Additionally, the mean VI values obtained in our study are in a fixed interval and the similar quantitative and correlation values with both transverse and longitudinal plane measurements are convenient for the differentiation of possible infectious, inflammatory and neoplastic processes. Once this becomes clearer, it may be possible to use this method on different disease groups in the future. Additionally, knowing the normal interval for VI values will be helpful in early identification of autoimmune processes frequently seen in children, especially, and for differentiating them from one another [17]. Future studies will need to look at the correlation between histopathologic changes in thyroid diseases and VI values. Additionally, there are studies on the specificity of thyroid US, which will increase with the use of SMI with elastography methods for benign-malignant differentiation of thyroid nodules [18].
We performed SMI investigation in two different planes to provide easily measurable, quantitative and objective data in the pediatric age group. Routine use of SMI will provide additional information and supplement conventional imaging modalities. This will avoid unnecessary procedures and improve cost-efficiencies. In the present study, selection bias cannot be ruled out due to the clinical setting. Moreover, the study was nonblinded and performed in a single center.
Among the limitations of our study were the low number of patients, lack of homogeneity between case numbers in the age groups, and exclusion of children younger than three years. Additionally, interobserver variability could not be assessed as all investigations were performed by a single user.
Conclusion
This study determined reference VI values for the thyroid gland in pediatric patients. Normal values may be used to distinguish good- and bad-natured lesions and to identify inflammatory-infectious processes. VI values did not show differences according to age, gender, thyroid volume, TSH and fT4. However, VI was affected by BMI. Significant differences were not identified between measurements in different planes. In the pediatric population, we believe knowing the normal VI values for the thyroid gland will assist in the diagnosis and surveillance of thyroid pathologies.
Research funding: None declared.
Author contributions: All authors were involved in the study design, recruitment, data analysis and interpretation. MÖ and MSD wrote the first draft of the manuscript. All authors have approved the final article.
Competing interests: The funding organization(s) played no role in the study design; in the collection, analysis, and interpretation of data; in the writing of the report; or in the decision to submit the report for publication.
Informed consent: Informed consent was obtained from all individuals included in this study.
Ethical approval: This study was approved by the local ethics committee
References
1. Kim, SJ, Kim, EK, Park, CS, Chung, WY, Oh, KK, Yoo, HS. Ultrasound guided fine-needle aspiration biopsy in nonpalpable thyroid nodules: is it useful in infracentimetric nodules?. Yonsei Med J 2003;44:635–40. https://doi.org/10.3349/ymj.2003.44.4.635.Search in Google Scholar
2. Tas, F, Bulut, S, Egilmez, H, Öztoprak, İ, Ergür, AT, Candann, F. Normal thyroid volume by ultrasonography in healthy children. Ann Trop Paediatr 2002;22:375–9. https://doi.org/10.1179/027249302125002047.Search in Google Scholar
3. Machado, P, Segal, S, Lyshchik, A, Forsberg, F. A novel microvascular flow technique: initial results in thyroids. Ultrasound Q 2016;32:67–74. https://doi.org/10.1097/ruq.0000000000000156.Search in Google Scholar
4. Zhan, J, Diao, XH, Jin, JM, Chen, L, Chen, Y. Superb microvascular imaging—a new vascular detecting ultrasonographic technique for avascular breast masses: a preliminary study. Eur J Radiol 2016;85:915–21. https://doi.org/10.1016/j.ejrad.2015.12.011.Search in Google Scholar
5. Lu, R, Meng, Y, Zhang, Y, Zhao, W, Wang, X, Jin, M, et al. Superb microvascular imaging [SMI] compared with conventional ultrasound for evaluating thyroid nodules. BMC Med Imag 2017;17:65. 28. https://doi.org/10.1186/s12880-017-0241-5.Search in Google Scholar
6. Bayramoglu, Z, Kandemirli, SG, Caliskan, E, Yilmaz, R, Kardelen, AD, Poyrazoglu, S, et al. Assessment of paediatric Hashimoto’s thyroiditis using superb microvascular imaging. Clin Radiol 2018;73:1059.e9–15. https://doi.org/10.1016/j.crad.2018.07.099.Search in Google Scholar
7. Durmaz, MS, Akyürek, N, Kara, T, Ateş, F, Özbakir, B, Gökgöz Durmaz, F, et al. Quantitative assessment of thyroid gland vascularization with vascularization index using color superb microvascular imaging in pediatric patients with Hashimoto thyroiditis. Ultrasound Q 2019;35:281–9. https://doi.org/10.1097/ruq.0000000000000430.Search in Google Scholar
8. Corrias, A, Mussa, A, Baronio, F, Arrigo, T, Salerno, M, Segni, M, et al. Diagnostic features of thyroid nodules in pediatrics. Arch Pediatr Adolesc Med 2010;164:714–9. https://doi.org/10.1001/archpediatrics.2010.114.Search in Google Scholar
9. Brown, RS, 2013. Autoimmune thyroiditis in childhood. J Clin Res Pediatr Endocrinol 5 (1 Suppl), 45–9.https://doi.org/10.4274/Jcrpe.855.Search in Google Scholar
10. Hegedüs, L. The thyroid nodule. N Engl J Med 2004;351:1764–71. https://doi.org/10.1056/nejmcp031436.Search in Google Scholar
11. Niu, LJ, Hao, YZ, Zhou, CW. Diagnostic value of ultrasonography in thyroid lesions. Zhonghua er bi yan hou tou jing wai ke za zhi 2006;41:415–8.Search in Google Scholar
12. Chen, Y, Zhang, Y, Yang, J, Cao, Q, Yang, G, Chen, J, et al. Curve-like structure extraction using minimal path propagation with backtracking. IEEE Trans Image Process 2016;25:988–1003. https://doi.org/10.1109/tip.2015.2496279.Search in Google Scholar
13. Durmaz, MS, Sivri, M. Comparison of superb micro-vascular imaging [SMI] and conventional Doppler imaging techniques for evaluating testicular blood flow. J Med Ultrason 2018;45:443–52. https://doi.org/10.1007/s10396-017-0847-9.Search in Google Scholar
14. Caliskan, E, Ozturk, M, Bayramoglu, Z, Adaletli, I. Superb microvascular imaging of palatine tonsils in healthy children: a preliminary study. Ultrasound Q 2018;34:71–6. https://doi.org/10.1097/ruq.0000000000000351.Search in Google Scholar
15. Caliskan, E, Ozturk, M, Bayramoglu, Z, Comert, RG, Adaletli, I. Evaluation of parotid glands in healthy children and adolescents using shear wave elastography and superb microvascular imaging. Radiol Med 2018;123:710–8. https://doi.org/10.1007/s11547-018-0897-0.Search in Google Scholar
16. Ayaz, E, Aslan, A, İnan, İ, Yıkılmaz, A. Evaluation of ovarian vascularity in children by using the “superb microvascular imaging” ultrasound technique in comparison with conventional Doppler ultrasound techniques. J Ultrasound Med 2019;38:2751–60. https://doi.org/10.1002/jum.14983.Search in Google Scholar
17. Bayramoglu, Z, Kandemirli, SG, Akyol Sarı, ZN, Kardelen, AD, Poyrazoglu, S, Bas, F, et al. Superb microvascular imaging in the evaluation of pediatric graves disease and Hashimoto thyroiditis. J Ultrasound Med 2019 Nov 9. https://doi.org/10.1002/jum.15171 [Epub ahead of print].Search in Google Scholar
18. Ahn, HS, Lee, JB, Seo, M, Park, SH, Choi, BI1. Distinguishing benign from malignant thyroid nodules using thyroid ultrasonography: utility of adding superb microvascular imaging and elastography. Radiol Med 2018;123:260–70. https://doi.org/10.1007/s11547-017-0839-2.Search in Google Scholar
© 2020 Mehmet Ozturk et al., published by De Gruyter.
This work is licensed under the Creative Commons Attribution 4.0 International License.
Articles in the same Issue
- Frontmatter
- Original Articles
- Variability of clinical and biochemical phenotype in liver phosphorylase kinase deficiency with variants in the phosphorylase kinase (PHKG2) gene
- Reference intervals for thyroid-stimulating hormone (TSH) and free thyroxine (FT4) in infants’ day 14–30 of life and a comparison with other studies
- Importance of thyroid-stimulating hormone levels in liver disease
- Assessment of thyroid gland vascularity with superb microvascular imaging in healthy children and its relationship with potential factors
- A retrospective analysis of congenital anomalies in congenital hypothyroidism
- Impact of parental origin of X-chromosome on clinical and biochemical profile in Turner syndrome
- Readiness for transition to adult care in adolescents and young adults with Turner syndrome
- A new type of pubertal height reference based on growth aligned for onset of pubertal growth
- Role of urinary NGAL and KIM-1 as biomarkers of early kidney injury in obese prepubertal children
- Self-assessed puberty is reliable in a low-income setting in rural Pakistan
- Timing and regimen of puberty induction in children with hypogonadism: a survey on the practice in Arab countries
- How useful are anthropometric measurements as predictive markers for elevated blood pressure in adolescents in different gender?
- Association between handgrip strength and cardiovascular risk factors among Korean adolescents
- Case Reports
- A novel GNAS mutation inherited from probable maternal mosaicism causes two siblings with pseudohypoparathyroidism type 1A
- Two intronic variants of CYP11B1 and CYP17A1 disrupt mRNA splicing and cause congenital adrenal hyperplasia (CAH)
- Case report: a 10-year-old girl with primary hypoparathyroidism and systemic lupus erythematosus
- Homozygous p.R31H GNRH1 mutation and normosmic congenital hypogonadotropic hypogonadism in a patient and self-limited delayed puberty in his relatives
- Severe diabetic ketoacidosis and coronavirus disease 2019 (COVID-19) infection in a teenage patient with newly diagnosed diabetes