Microwave-assisted preparation of almond shell-based activated carbon for methylene blue adsorption
-
Chunfeng Du
Chunfeng Du is a postgraduate student in the School of Chemistry and Chemical Engineering of Shihezi University. She is mainly engaged in the preparation of biomass-based activated carbon and its adsorption.
Hongbing Yang is a Professor and works as a supervisor of Masters degrees in the School of Chemistry and Chemical Engineering of Shihezi University. She is engaged in the chemistry of natural products.
 ,
Zhansheng Wu
,
Zhansheng Wu
Zhansheng Wu is a Bao Gang Excellent teacher and an Xinjiang Youth Science and Technology Award winner; he is an Associate Professor and doctoral supervisor in the School of Chemistry and Chemical Engineering of Shihezi University. Since 2016 he has been a visiting Professor at the Department of Drug Science and Technology, University of Turin, Italy. He received a PhD degree from Beijing Institute of Technology in 2011. His research activity is documented in about 80 peer-reviewed papers, several book chapters, and 20 patents. His group has been partner of several NNSF of China projects. He is mainly engaged in the material chemical industry and environmental engineering research and teaching works.
,
Xinyu Ge
Xinyu Ge is a postgraduate student in the School of Chemistry and Chemical Engineering of Shihezi University. She is mainly engaged in the preparation of activated carbon and its modification and has studied the adsorption of naphthalene, phenanthrene, and pyrene in water by modified activated carbon.
Giancarlo Cravotto is Full Professor of Organic Chemistry at the University of Turin (Italy) and, since 2007, Director of the Department of Drug Science and Technology. His research activity is documented in about 300 peer-reviewed papers, several book chapters, and patents. His group has been partner of several EU projects. Among them, ARCADE (FP7), MAPSYN “Highly efficient syntheses using alternative energy forms” (FP7-NMP-2012), “ECOEXTRACTION” (Alcotra 2011), and US4GREENCHEM (Horizon 2020). His research activity is focused on enabling technologies for green chemical processes from lab scale to industrial applications. He is the President of the European Society of Sonochemistry.
Bang-Ce Ye is a Chang Jiang Scholar (Ministry of Education of China) in the School of Chemistry and Chemical Engineering, of Shihezi University, and Professor of Biology and Chemistry in the East China University of Science and Technology. He obtained his PhD degree in 1998. His research now focuses on analytical biotechnology and systems biotechnology.
Imdad Kaleem received his PhD in Biochemical Engineering from the School of Life Science, Beijing Institute of Technology, Beijing, China in 2013. He is currently working as an Assistant Professor of Biochemistry in the Department of Bioinformatics and Bioscience, COMSATS Institute of Information Technology (CIIT), Islamabad, Pakistan. His research interests are green process engineering and nanobiotechnology.

Abstract
This study reports the synthesis of a novel adsorbent, hereinafter named almond shell-based activated carbon (ASAC), from waste almond shells (AS) via exposure to microwave radiation and the use of ZnCl2 as a chemical activator. Synthetic conditions were further elaborated using the response surface methodology to optimize the adsorption capacity of ASAC for methylene blue (MB) dye. The optimized ASAC preparation conditions were found to be as follows: a mass (ZnCl2/AS) ratio of 3:1 (w/w) and microwave heating time period of 15 min at 900 W. A maximum ASAC yield of 39.67% and a MB adsorption capacity of 314.20 mg/g were obtained. ASAC was also characterized by N2 adsorption-desorption measurement, scanning electron microscopy (SEM), Fourier-transform infrared spectrometry (FTIR), X-ray photoelectron spectroscopy (XPS), and point of zero charge measurement. Optimized ASAC had a Brunauer-Emmett-Teller surface area of 839.60 m2/g and a total volume of 0.406 cm3/g. FTIR and XPS analysis exhibited a decline in oxygen-containing groups of ASAC as compared with AS. The adsorption behavior of ASAC for MB was fitted well to the pseudo-second-order model and the Langmuir isotherm model. These findings support the ease of preparation and cost effectiveness that make ASAC promising for use in environmental remediation.
1 Introduction
Activated carbon (AC) has been widely employed in the chemical industry because of its textural characteristics, high surface area, and surface adsorption properties. It has a very broad range of industrial applications, which include the separation/purification of liquids and gases, removal of toxic substances, catalysts and catalyst support, super capacitors, electrodes, and gas storage [1]. One of the biggest challenges in commercial manufacturing of AC is finding a novel yet inexpensive precursor that has potential economic benefits and is available in large quantities. A great deal of effort has so far been invested in producing AC from renewable sources and precursors from agricultural wastes such as oil palm shell [2], coconut husk [3], rambutan peel [4], edible fungi residues [5], and acorn shell [6]. Xinjiang, the largest autonomous region in China, produces a large amount of almond shells (AS) annually, its output reached to 60,000 tons in 2014, making this significant agricultural waste. The use of this waste material in the commercial production of AC would facilitate the development of a low-cost precursor.
Heavy industrialization means that pollutants continue to be emitted into the environment. This is particularly true for dyes which cause a serious threat to aquatic life. Methylene blue (MB) (Adamas, China) is the most commonly used substance in the dyeing process, yet it brings with it potential risks for environmental pollution. It was therefore selected as a model adsorbate for the determination of the adsorption efficiency of our novel synthetic adsorbent.
The AC production process generally requires high heat energy which is provided in two different ways: conventional heating and microwave heating [7]. Conventional heating method is usually used in the industrial preparation of AC as this demands higher activation temperature and longer activation time, thereby leading to a considerably lower yield and higher energy cost. Achawa et al. prepared the coconut shell-based AC by a conventional heating method by physical activation for 120 min; the resulting material had a surface area (SBET) of only 524 m2/g [8].
Alternatively, microwaves can supply energy to carbon particles, and this energy is converted into heat within the particles themselves by dipole rotation and ionic conduction [9], and, in fact, microwave heating has been recently employed for the preparation of AC. Junior et al. synthesized a highly porous AC from macadamia nut endocarp by chemical activation with ZnCl2 via microwave radiation [10]. Njoku et al. also introduced a microwave-induced activation process to prepare a high-surface area AC from rambutan peel [4]. Hesas et al. revealed AC production from oil palm shells through microwave-induced ZnCl2 activation [2]. The microwave technique means that it is possible to produce AC easily and quickly, while also providing benefits over conventional heating, such as short treatment time, low energy cost, high heating rate, selective heating, and a controllable heating process [11, 12]. All recent reports have validated the use of a microwave-induced activation process, citing faster activation rate and higher carbon yield. Microwave heating is therefore rightly considered as a viable alternative for conventional heating methods.
Response surface methodology (RSM) has a large impact on the optimization of process conditions, as it analyses the interaction between the effective process parameters and identifies the factor settings that optimize the response [3]. The RSM method has been employed by many researchers to amplify conventional AC production [13]. Hence, RSM has already found applications in the optimized production of ACs. However, to the best of our knowledge, not a single research work has been published on RSM-based optimized synthetic conditions for AS-derived almond shell-based activated carbon (ASAC) production via microwave heating.
The present study was designed to investigate the use of microwave-induced activation procedure to prepare highly porous ASAC from AS. It also investigates the product’s MB adsorption efficiency. The influences of activation time, microwave power, and mass ratio on MB adsorption and ASAC yield have been thoroughly investigated. We used the Box-Behnken design (BBD) to select the effects of the three main variables and RSM to optimize the synthetic conditions. In addition, scanning electron microscopy (SEM), Fourier transform infrared spectrometry (FTIR), X-ray photoelectron spectroscopy (XPS), and other analytical techniques were used to characterize ASAC. Furthermore, the adsorption isotherms and kinetics were also elucidated. The proposed synthetic method for ASAC preparation via microwave heating shows great potential and may lead to the cost-effective production of an excellent adsorbent which has an enormous remedial effect on various industrial wastes, particularly water pollutants.
2 Materials and methods
2.1 Raw material
The AS was purchased from the local market, Shihezi, China, washed with distilled water, and dried in an oven at 100°C for 24 h to remove the moisture content. The dried AS were crushed and sieved to a uniform particle size of 100 meshes. The proximate analyses of AS were ash 1.67%, fixed carbon 29.40%, moisture 5.31%, and volatiles 63.62%. All analyses were performed in three replicates.
2.2 Preparation of ASAC
The microwave-assisted process was performed using a modified microwave oven (MM823LA6-NS, Midea, China) at a frequency of 2.45 GHz. Mixtures (4.0 g) with different mass ratios (X1) of ZnCl2 (Zhiyuan, Tianjin, China) and AS and particle size of 100 mesh were put in a quartz tube reactor placed in a microwave oven. The activation processes were then subjected to various microwave heating times (X2, min) and microwave radiation powers (X3, W) under 100 cm3/min of nitrogen flow. The resulting material was washed repeatedly with hot distilled water until solution pH reached 7.0. The obtained ASAC were dried at 80°C for 24 h and then stored for further analyses.
The percentage of ASAC yield was calculated using the following equation:
where W is the weight of the prepared ASAC after activation and W0 is the weight of the raw materials before activation.
2.3 Experimental design and response surface methodology
RSM was applied to activation process optimization as it is a useful statistical tool for modeling and analysis of multivariables. This method was chosen for fitting a quadratic surface with the fewest number of experiments. In this step, BBD method was applied in three levels in order to design the activation experiments. Table 1 shows the ranges and levels of the experimental parameters: mass ratio (X1), activation time (X2), and microwave power (X3). MB adsorption (Y1) was taken as the process responses.
Factorial design matrix and experimental response values.
| Std | Run | Mass ratio X1(w/w) | Microwave heating time X2 (min) | Microwave power X3 (W) | Y1 (mg/g) | Y2 (%) |
|---|---|---|---|---|---|---|
| 3 | 1 | 1:1 | 20 | 700 | 179.80 | 36.00 |
| 11 | 2 | 2:1 | 10 | 900 | 209.81 | 34.70 |
| 1 | 3 | 1:1 | 10 | 700 | 164.83 | 35.50 |
| 7 | 4 | 1:1 | 15 | 900 | 194.73 | 37.00 |
| 6 | 5 | 3:1 | 15 | 500 | 239.59 | 40.00 |
| 12 | 6 | 2:1 | 20 | 900 | 194.81 | 36.00 |
| 8 | 7 | 3:1 | 15 | 900 | 314.20 | 39.67 |
| 2 | 8 | 3:1 | 10 | 700 | 239.55 | 34.00 |
| 5 | 9 | 1:1 | 15 | 500 | 164.82 | 38.50 |
| 10 | 10 | 2:1 | 20 | 500 | 194.86 | 31.00 |
| 4 | 11 | 3:1 | 20 | 700 | 269.32 | 39.00 |
| 9 | 12 | 2:1 | 10 | 500 | 164.92 | 49.70 |
| 16 | 13 | 2:1 | 15 | 700 | 224.64 | 38.70 |
| 13 | 14 | 2:1 | 15 | 700 | 209.56 | 42.00 |
| 14 | 15 | 2:1 | 15 | 700 | 179.79 | 45.00 |
| 17 | 16 | 2:1 | 15 | 700 | 194.74 | 38.70 |
| 15 | 17 | 2:1 | 15 | 700 | 209.83 | 63.30 |
In order to study the relationship between the response variable (MB number and yield) and independent variables, the experimental data were fitted to a second-order polynomial regression model, expressed by Eq. (2)
where Y is the response variable, χi and χj are the independent variables, β0,βi,βii, and βij are the regression coefficients (β0 is constant term, βi is the linear effect term, βii is quadratic effect term, and βij is the interaction effect term).
Design Expert software (version 8.0.6, Stat-Ease Inc., Minneapolis, MN, USA) was used to elaborate the experimental design, evaluate the model, and estimate the subsequent regression, variance, and response surface analysis.
2.4 Characterization of ASAC
The physical properties, textural morphology, and chemical properties of ASAC were measured using renowned analytical techniques. The surface physical properties of the ASAC were characterized with Quanta Chrome Instruments Quadrasorb SI (USA) and N2 adsorption measurements at 77 K. The SBET was calculated with the Brunauer-Emmett-Teller (BET) equation. The nitrogen volume held at the highest relative pressure (P/P0=0.95) was used to calculate the total ASAC pore volume. The micropores surface area, volume, and external surface area were obtained using the t-plot method.
SEM was also employed to study the textural structure of the raw material and adsorbent after the activation process. The morphology of AS and ASAC were characterized by SEM (JEOL, JSM-6490LV, Japan) with a secondary electron beam and an acceleration voltage of 3 kV. The samples were coated with gold to ensure that the particles have suitable conductivity after having been dried overnight at 80°C under vacuum.
Chemical characterization of surface functional groups was investigated using FTIR (Magna-IR 750, Nicolet, USA) in the scanning range of 4000–400 cm-1; 10 scans were taken at a resolution of 1 cm-1. The samples were mixed with KBr powder, and the mixtures were pressed into a pellet.
Meanwhile, an analysis of the chemical element content at the surface of AS and ASAC was performed using XPS. The XPS analysis was conducted using AMICUS/ESCA 3400 spectrometer (Japan), Mg radiation at 240 W and 12 kV under ultrahigh vacuum. Pass energy was set at 276 and 300 eV for survey and high-resolution spectra, respectively. The XPS spectra were calibrated by taking the graphitic peak as 284.5 eV. The surface atomic concentrations were calculated from the survey spectra after correcting the relative peak areas by sensitivity factors.
The point of zero charge (pHpzc) was determined by adjusting the pH of a 50 ml 0.1 mol/l NaCl (Hengxing, Tian Jin, China) solution (prepared in boiled water to eliminate CO2) to a value between 2 and 12. Approximately 0.15 g of ASAC was added, and the final pH was measured after 48 h under agitation. The pHpzc is the point where pHinitial-pHfinal=0.
2.5 Adsorption capacity
About 0.1 g of ASAC was put into a 150 ml Erlenmeyer flask with stopper containing 50 ml of a 1.5 g/l MB solution at pH=6.16 in order to determine the adsorption capacity of ASAC. The flask was vibrated at 170 rpm in a thermostatic water bath shaker at around 20°C. After adsorption equilibrium time of 30 min, which was obtained by a series of preliminary experiments, samples were separated by filtration; the MB solution concentration was analyzed by absorbance measurements using a double-beam UV-75N (Yuanxi, Shang Hai, China) at a wavelength of 665 nm. The MB uptake of ASAC, q (mg/g), was calculated by Eq. (3):
where C0 (mg/l) and Ce (mg/l) are the initial and equilibrium concentrations of MB, respectively, V (l) is the volume of solution and M (g) is the dry mass of ASAC.
2.6 Adsorption kinetics
The adsorption kinetics procedures were carried out at initial MB concentrations of 300 and 500 mg/l at 20°C. About 0.1 g ASAC was put into 150 ml conical flasks with 50 ml MB solution; the samples were separated by filtering at different contacting time intervals (2, 5, 10, 15, 30, 45, 60, and 120 min). The residual concentrations of MB were measured, and adsorption amounts of ASAC were calculated with the above method.
To understand the adsorption dynamics of MB on ASAC in relation to time, the experimental data were analyzed using pseudo-first-order [14] and pseudo-second-order [15] kinetic models. The expression of the pseudo-first-order kinetic model is given by Eq. (4):
where qe (mg/g) is the amount of MB adsorbed at equilibrium, k1 (min-1) is the pseudo-first-order rate constant, and t (min) is the contact time. The form of the pseudo-second-order kinetic model is given by Eq. (5):
where k2 is the pseudo-second-order rate constant (g/mg min).
2.7 Adsorption isotherms
The Langmuir and Freundlich adsorption models were run as discussed below to analyze the validity of the adsorption data. The adsorption isotherms of MB on AC were investigated by determining the adsorption amounts of MB in different concentrations (50, 200, 300, 550, 850, 910, and 1000 mg/l) at the equilibrium adsorption time of 30 min.
The Langmuir isotherm equation [16], which is the most commonly used for monolayer adsorption on to a surface with a finite number of identical sites, was represented by the following Eq. (6):
where Ce (mg/l) is the equilibrium concentration of the MB dye, qm (mg/g) is the maximum adsorption capacity, and KL (l/mg) is the Langmuir adsorption equilibrium constant, which is related to the affinity of the binding sites.
The Freundlich isotherm equation [17], the most important multilayer adsorption isotherm for heterogeneous surfaces, is described by the following Eq. (7):
where KF [(mg/g)·(l/mg)-1/n] and n are Freundlich parameters related to the adsorption capacity and adsorption intensity, respectively.
3 Results and discussion
3.1 RSM and model fit
BBD was used to elaborate the correlation between the AC preparation variables to the MB adsorption and yield. Seventeen experiments were performed for the RSM optimization of three parameters at three levels. The results of these experiments are presented in Table 1. Runs 13–17 at the center point were used to check the experimental error. The qm values for ASACs, which were prepared according to the experimental conditions mentioned above, ranged from 164.82 to 314.20 mg/g, while the carbon yield ranged from 31.0% to 49.7%. The quadratic model was selected for the response of MB adsorption value, as suggested by the software. The final empirical model in terms of coded factors for MB adsorption value (Y1) is shown in Eq. (8):
Negative signs in front of the terms indicate antagonistic effects, whereas the positive signs indicate synergistic effects. Variance was employed to justify the adequacy of the model. Variance for the quadratic model of MB adsorption is shown in Table 2, where the F value of 9.92 and Pr>F of 0.0032 proved that the model is significant. The value of model terms Pr>F less than 0.05 indicates that the model terms are significant. The results showed that X1, X3, and X12 are all significant model terms. These significant effects signified the importance and effectiveness of the selected independent variables for the experiments. As shown in the variance analysis, the lack-of-fit test was non-significant, indicating that the model can be well fit to the studied data. The 3D response surface (Figure 1) is generally the graphical representation of the regression equation. The effect of heating time on the experimental response of qm values can be seen in Figure 1A and C. The heating time has only a weak effect on MB adsorption capacity. The indistinctive effect of the microwave heating time on adsorption capacity values has also reported by Zhong et al. [18]. Figure 1A and B shows the effect of the mass ratio on the response. The value of qm evidently increased with the increase in mass ratio at high microwave power levels. The use of the activating reagent in the microwave-assisted activation promoted the bond breaking and elimination of some volatile species in the precursors [19]. ASACs with increased surface area and higher adsorption capacity were obtained as a result. Our results on the effect of microwave power (Figure 1B and C) demonstrated that the highest qm values were obtained at microwave powers over 820 W. This trend was attributed to the fact that the high microwave power increases system temperature, reducing the activation energy of the carbon-reagent reaction and promoting the development of pores on the materials [20].
Analysis of variance for response surface quadratic model for adsorption capacity of MB.
| Source | Sum of squares | DF | Mean square | F-Value | Prob.>F |
|---|---|---|---|---|---|
| Model | 23349.22 | 9 | 2594.36 | 9.92 | 0.0032 |
| X1 | 16063.49 | 1 | 16063.49 | 61.41 | 0.0001 |
| X2 | 445.21 | 1 | 445.21 | 1.70 | 0.2333 |
| X3 | 2788.55 | 1 | 2788.55 | 10.66 | 0.0138 |
| X1X2 | 54.76 | 1 | 54.76 | 0.21 | 0.6611 |
| X1X3 | 499.52 | 1 | 499.52 | 1.91 | 0.2095 |
| X2X3 | 504.90 | 1 | 504.90 | 1.93 | 0.2073 |
| X12 | 2315.18 | 1 | 2315.18 | 8.85 | 0.0207 |
| X22 | 800.23 | 1 | 800.23 | 3.06 | 0.1238 |
| X32 | 5.80 | 1 | 5.80 | 0.022 | 0.8858 |
| Residual | 1831.09 | 7 | 261.58 | ||
| Lack-of-fit | 668.72 | 3 | 222.91 | 0.77 | 0.562 |
| Pure error | 1162.37 | 4 | 290.59 | ||
| Cor total | 25180.31 | 16 |
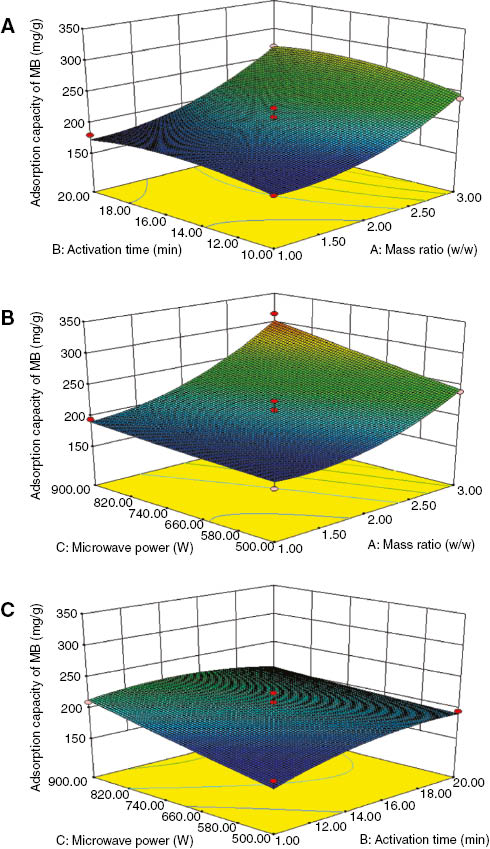
Three-dimensional graphic of response surface for response: mass ratio and activation time (A), mass ratio and microwave power (B), and activation time and microwave power (C).
3.2 Process optimization
Adsorption efficiency toward organic compounds, such as MB dye, is the most important aspect of ASAC economic feasibility and marketing. Design Expert software version 8.0.6 was used to calculate an optimized value by selecting the highest responses from the experimental results. The optimum calculated conditions were a mass ratio of 3:1, an activation time of 15 min, and a microwave power of 900 W. Under optimal conditions, a carbon yield of 41.19% and an MB adsorption capacity of 285.69 mg/g were predicted. Meanwhile, the practical repeat experiments were carried out to check the accuracy of the predicted results which showed the carbon yield of 39.67% and an MB adsorption capacity of 314.20 mg/g. The relative errors between the experimental and predicted values for the carbon yield and MB adsorption capacity are 3.69% and 9.07%, respectively, indicating that the process optimization is sufficiently accurate. The present study shows that ASAC’s adsorption capacity for MB (Table 3) is quite remarkable when compared to previously reported adsorbents [11, 21, 22, 23].
Comparison of adsorption capacities of various adsorbents for MB.
| Precursors of ACs | Mass of AC (g) | Initial concentrations of MB (mg/l) | Volume of MB (ml) | pH | Adsorption capacity of MB (mg/g) | References |
|---|---|---|---|---|---|---|
| Macadamia nut endocarp | 0.025 | 500 | 25 | – | 194.7 | [11] |
| Coffee waste | 0.1 | 1000 | 10 | 5.3 | 188.7 | [22] |
| Cotton stalk | 0.1 | 1500 | 25 | – | 193.5 | [23] |
| Wood sawdust | 0.2 | 500 | 200 | – | 425.3 | [24] |
| Almond shell | 0.1 | 1500 | 50 | 6.16 | 314.2 | This work |
3.3 Characterization of ASAC
3.3.1 Specific surface area and pore structure of ASAC
The N2 adsorption-desorption isotherm at 77 K is shown in Figure 2A. The isotherm resembles a combination of type I and type II isotherms, as defined by the International Union of Pure and Applied Chemistry; this adsorption behavior exhibits characteristics of microporous-mesoporous structures [24]. The pore size distribution of ASAC is shown in Figure 2B. The sharpest peak is observed at a pore diameter between 0.5 and 1.0 nm, with an average pore size of 0.83 nm, which indicated the essentially microporous texture of ASAC. The specific surface area of 839.60 m2/g was calculated using the BET equation. The structural characteristics of ASAC are listed in Table 4. ASAC exhibited a relatively high SBET of 839.60 m2/g and a VT of 0.406 cm3/g.
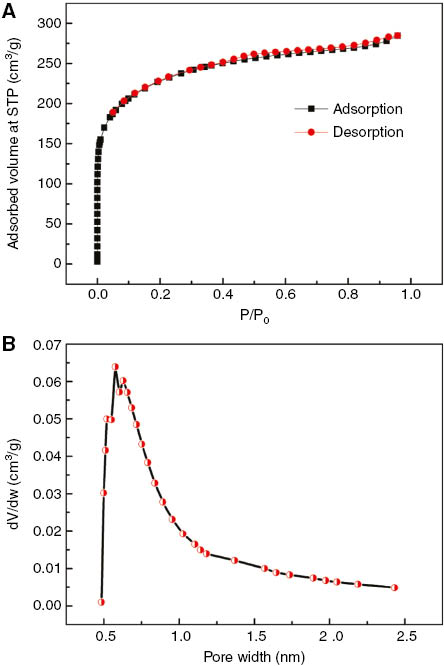
N2 adsorption and desorption isotherms at 77 K (A) and pore size distribution (B) of ASAC.
Surface physical characteristics of the ASAC and other ACs.
| Precursors of ACs | SBET (m2/g) | Micropore area (m2/g) | VT (cm3/g) | Micropore volume (cm3/g) | Average pore width (nm) | References |
|---|---|---|---|---|---|---|
| Almond shell | 839.60 | 383.64 | 0.406 | 0.152 | 0.83 | This work |
| Pistachio shell | 700.53 | – | 0.375 | – | 2.14 | [25] |
| Rice husk | 752 | 346 | 0.64 | 0.26 | 3.41 | [26] |
| Cotton stalk | 794.84 | 156.69 | 0.63 | 0.083 | 3.20 | [23] |
3.3.2 SEM analysis of ASAC
Figure 3 shows SEM images of AS and ASAC prepared under the optimum conditions (i.e. mass ratio of 3:1, activation time of 15 min, and microwave power of 900 W). The AS surface is planar and undulating and mainly consists of macropores. The number of pores of the ASAC significantly increased after the activation process. The ASAC surface exhibited well-organized, pronounced, and uniform porosity (Figure 3B), which significantly increased its surface area and resulted in a higher number of pores available for MB adsorption. This observation was supported by the physical parameters, as summarized in Table 3, which highlighted the pore development during the microwave irradiation period. A similar phenomenon was also observed by Njoku et al., who reported the surface morphology of rambutan peel-based ACs which have a series of uniform cavities around the surface that are caused by KOH activation [4].
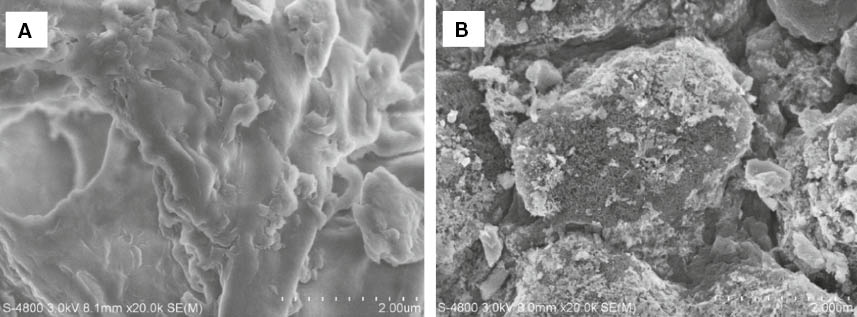
SEM images of AS (A) and ASAC (B).
3.3.3 Functional groups analysis of ASAC
The surface chemistry of AS and ASAC was studied by FTIR spectroscopy in the infrared spectral region of 4000–400 cm-1 (Figure 4). AS contained much more bands than ASAC as well as some major differences. The broad band at approximately 3450 cm-1 was observed for all samples and was attributed to the O–H stretching vibration of the hydroxyl functional groups [13, 27]. The intense band at approximately 2950 cm-1 in AS was assigned to the C–H stretching vibration [28]. This peak disappeared in ASAC, indicating the removal of hydrogen by activation. A band at approximately 2359 cm-1 for AS and ASAC was attributed to C≡C (alkynes), which was also reported by Foo et al. [29]. A series of complex bands, which was significantly reduced after activation, was detected in the range of 800–1630 cm-1 in AS. This phenomenon is possibly due to the breakdown of the chemical bonds in the raw material [30]. The bands located at 1630, 1390, 1255, 1085, and 800 cm-1 in the AS spectra were attributed to O-H bending vibrations, C-O-C (esters or phenol), C-O-C (ether) group, C-O stretching vibration, and C-H blending or benzene. These bands in ASAC were weakened in ASAC [5, 31]. The signal at 550 cm-1 was assigned to the C-O-H bending vibration [32].
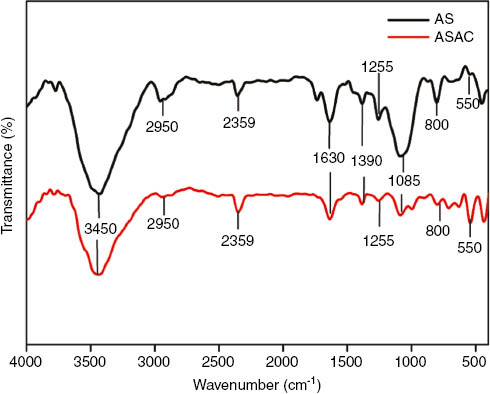
FTIR spectra of AS and ASAC.
The compositional chemistry of the AS and ASAC surfaces was analyzed by XPS, as shown in Figure 5A. The spectra contained distinct peaks for C and O. The relative content of these elements was calculated and listed in Table 5. The percentage amounts of C, O, and S were 72.07%, 26.88%, and 1.05% in AS and 86.57%, 13.43%, and 0.00% in ASAC, respectively, thereby indicating a small increase in the C amount and a decrease in the O amount after activation procedure.
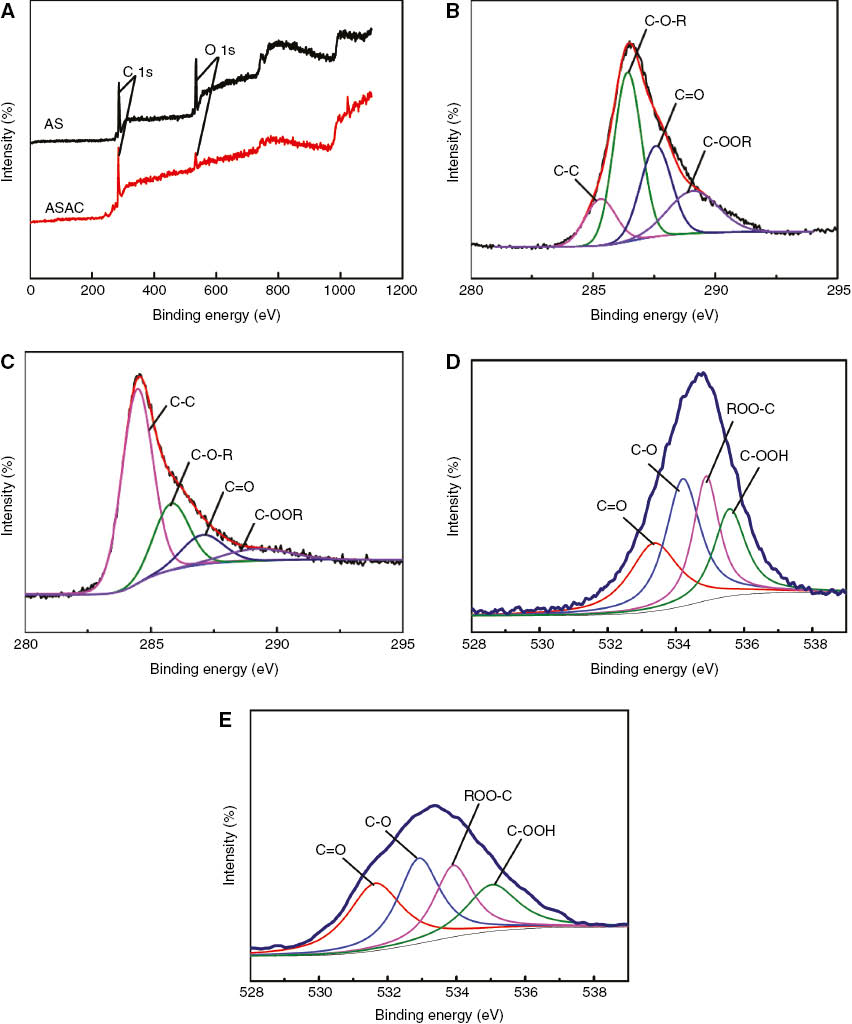
XPS survey spectra and high-resolution spectra of AS and ASAC: (A) survey scans; (B) AS: C 1s; (C) ASAC: C 1s; (D) AS: O 1s; (E) ASAC: O 1s.
Relative contents of various elements and peak parameters of different C 1s and O 1s components of AS and ASAC samples based on the XPS spectra.
| Relative content (%) | Relative content (%) of C 1s | Relative content (%) of O 1s | |||||||||
|---|---|---|---|---|---|---|---|---|---|---|---|
| C | O | S | C-C | C-O-R | C=O | C-OOR | C=O | C-O | C-OOR | C-OOH | |
| AS | 72.07 | 26.88 | 1.0 | 13.15 | 41.97 | 25.59 | 19.29 | 22.55 | 32.73 | 24.05 | 20.67 |
| ASAC | 86.57 | 13.43 | 0.0 | 59.18 | 22.18 | 11.47 | 7.17 | 39.17 | 26.21 | 17.18 | 17.44 |
The high-resolution spectra of C 1s and O 1s were further analyzed using a curve-fitting procedure based on the Gaussian-Lorentzian function after baseline subtraction with Shirley’s method. Four components were considered to comprise the C 1s spectra [33] with chemical shifts: C-C (284.5 eV), C-O-R (285.8 eV), C=O (287.0 eV), and COOR (289.2 eV). The fitting curves of these groups are illustrated in Figure 5B and C; Figure 5D and E shows that the deconvolution of the O 1s spectra for the AS and ASAC produced four peaks at 533.3, 534.2, 535.1, and 535.7 eV; these peaks represented O=C, O-C, R-O-C=O, and C-OOH, respectively. The relative content of each group is listed in Table 5. These results suggest that the C–C group was predominant in ASAC as it made up close to 60% of the carbon species. Moreover, relative oxygen contents showed a significant decrease. The analysis for oxygen species displayed an increase in the C=O group and a decrease in other oxygen groups in ASAC (Figure 5D and E). Liu et al. have reported on a similar reduction of oxygen-containing groups in AC, which is consistent with the FTIR and XPS spectra [34].
3.4 Adsorption studies of MB
3.4.1 Effect of pH on the adsorption of MB onto ASAC
The adsorption behavior of MB onto ASAC at different pH values is shown in Figure 6. The effect of pH was conducted by varying the pH of dye solutions of an initial concentration of 500 mg/l, from 2 to 12. Adsorption capacity increased with increasing pH. Adsorption capacity displayed a particularly significant enhancement at pH of 6–8. This may be related to the protonation of MB in acidic medium, which triggers a competition effect between excessive amounts of H+ and cationic dye on adsorption sites. ASAC may become more negatively charged as the solution pH increases, causing the formation of electric double layers which facilitates a change in the polarity, leading into the enhancement of adsorption capacity. The pH effect can be described in terms of pHpzc. The pHpzc of ASAC was found to be 6.16. When the solution pH<pHpzc, the AC adsorbent will react as a positive surface, but when the solution pH>pHpzc, it will act as a negative surface. At pH values above 6.16, the electric double layer changes its polarity, which causes an increase in the surface charge density and electrostatic force of attraction. This led us to the dual adsorption of MB onto ASAC: physical adsorption and chemical adsorption. The chemical adsorption mechanism includes the reaction between hydroxyl and carbonyl functional groups on the surface of the ASAC and MB. The positive charge on MB and OH- on ASAC react as follows:
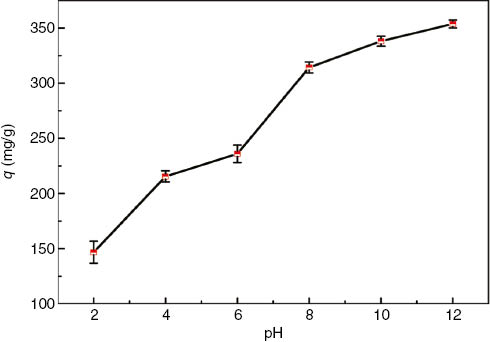
Effect of pH on the adsorption of MB onto ASAC at 20°C (C0=500 mg/l, contact time=30 min, AC mass=0.1 g).
 (9)
(9)
3.4.2 Adsorption kinetics
The experimental data obtained for the AC from the initial MB concentrations (300 and 500 mg/l) were fitted to the pseudo-first-order and pseudo-second-order models (Figure 7). Rapid adsorption occurred in the first 15 min, and equilibrium was reached after 30 min, indicating a favorable interaction between the adsorbent and adsorbate (Table 6). The data show that the adsorption of MB onto ASAC was best described by the pseudo-second-order model, R2=0.999; similar qe values were calculated and experimentally determined. These findings suggest that the MB-ASAC system followed the pseudo-second-order model and that the overall adsorption process rate was controlled by physisorption at the beginning of adsorption and chemisorption thereinafter, which has already been explained by the pH effect on MB adsorption onto ASAC. The same behavior was also observed by Foo et al. [29].
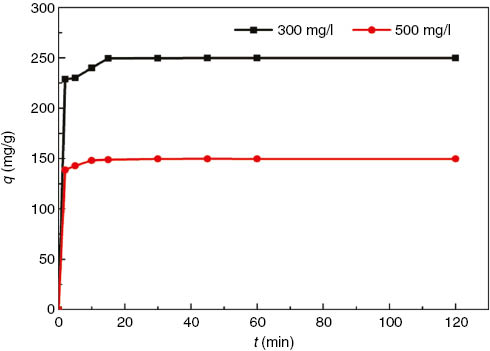
Effect of time on the adsorption of MB onto ASAC at 20°C (pH=6.16, 0.1 g of ASAC).
Pseudo-first-order and pseudo-second-order kinetic rate constants for the adsorption of MB onto ASAC at 20°C.
| C0 (mg/l) | qe,exp (mg/g) | Pseudo-first-order | Pseudo-second-order | ||||
|---|---|---|---|---|---|---|---|
| K1 (min-1) | qe (mg/g) | R2 | K2 (g/mg min) | qe (mg/g) | R2 | ||
| 300 | 148.59 | 0.770 | 148.45 | 0.785 | 0.050 | 149.25 | 0.999 |
| 500 | 249.56 | 0.508 | 248.51 | 0.842 | 0.160 | 250.00 | 0.999 |
3.4.3 Adsorption isotherms
The plots of the nonlinear Langmuir and Freundlich isotherm models for the adsorption of MB onto ASAC at 20°C according to Eqs. (6) and (7) are presented in Figure 8. The isotherm parameters determined from the slopes and the correlation coefficients of the isotherm models are summarized in Table 7. The equilibrium data were valid for the Langmuir isotherm model (Radj2=0.989), demonstrating that the adsorption of MB onto ASAC from aqueous solutions proceeds via monolayer formation. This result was in accordance with the previous nitrogen adsorption-desorption result which authenticates the monolayer adsorption phenomenon. The present results are relatively consistent with previous research into the adsorption of MB onto ACs that had been prepared from pomelo skin and oil palm (Elaeis) empty fruit bunches by microwave-assisted chemical activation [32, 35].
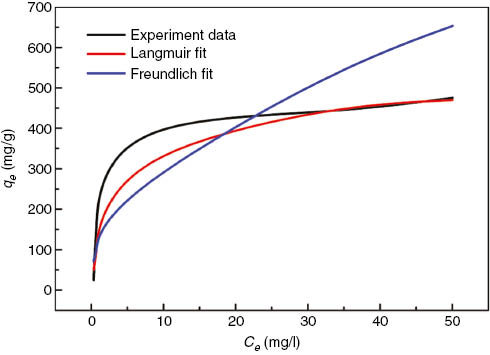
Plots of Langmuir and Freundlich models for adsorption of MB onto ASAC (pH=6.16, contact time=30 min, 0.1 g of ASAC).
Isotherm model parameters for the adsorption of MB onto ASAC at 20°C.
| Isotherms | Langmuir | Freundlich | ||||
|---|---|---|---|---|---|---|
| Constants | qm (mg/g) | KL (l/mg) | R2 | n | KF (mg/g)(l/mg)1/n | R2 |
| 500.00 | 0.307 | 0.989 | 2.22 | 112.449 | 0.717 | |
4 Conclusions
This study proposes a remarkably adsorbent ASAC that has been prepared using a microwave heating method from the agricultural waste of AS. RSM was successfully used to optimize the ASAC preparation conditions. The optimal activation conditions are as follows: a mass ratio (ZnCl2/AS) of 3:1 (w/w), a microwave heating time of 15 min, and a microwave power of 900 W. The resulting BET surface area of ASAC was 839.60 m2/g, and the total pore volume was 0.406 cm3/g. The yield and MB adsorption of ASAC under optimum conditions were 39.67% and 314.20 mg/g, respectively. These results indicated that the mass ratio and microwave power were the most significant factors to affect carbon yield and MB adsorption. All statistical tools proved the excellent operational efficiency of ASAC. The adsorption behavior could be favorably described by the pseudo-second-order models and Langmuir isotherm. The excellent MB adsorption capacity of ASAC validated its supremacy over the absorbents that have been reported so far. Short microwave heating time and process simplicity make microwave-assisted activation a promising method for converting the AS into an excellent adsorbent which could be used in the remediation of the aquatic environment as well as in the chemical industry.
Funding source: National Natural Science Foundation of China
Award Identifier / Grant number: 51262025
Funding statement: This work was financially supported by the National Natural Science Foundation of China (51262025) and the International Scientific and Technological Cooperation Project of Xinjiang Bingtuan (2013BC002)
About the authors

Chunfeng Du is a postgraduate student in the School of Chemistry and Chemical Engineering of Shihezi University. She is mainly engaged in the preparation of biomass-based activated carbon and its adsorption.

Hongbing Yang is a Professor and works as a supervisor of Masters degrees in the School of Chemistry and Chemical Engineering of Shihezi University. She is engaged in the chemistry of natural products.

Zhansheng Wu is a Bao Gang Excellent teacher and an Xinjiang Youth Science and Technology Award winner; he is an Associate Professor and doctoral supervisor in the School of Chemistry and Chemical Engineering of Shihezi University. Since 2016 he has been a visiting Professor at the Department of Drug Science and Technology, University of Turin, Italy. He received a PhD degree from Beijing Institute of Technology in 2011. His research activity is documented in about 80 peer-reviewed papers, several book chapters, and 20 patents. His group has been partner of several NNSF of China projects. He is mainly engaged in the material chemical industry and environmental engineering research and teaching works.

Xinyu Ge is a postgraduate student in the School of Chemistry and Chemical Engineering of Shihezi University. She is mainly engaged in the preparation of activated carbon and its modification and has studied the adsorption of naphthalene, phenanthrene, and pyrene in water by modified activated carbon.
Giancarlo Cravotto is Full Professor of Organic Chemistry at the University of Turin (Italy) and, since 2007, Director of the Department of Drug Science and Technology. His research activity is documented in about 300 peer-reviewed papers, several book chapters, and patents. His group has been partner of several EU projects. Among them, ARCADE (FP7), MAPSYN “Highly efficient syntheses using alternative energy forms” (FP7-NMP-2012), “ECOEXTRACTION” (Alcotra 2011), and US4GREENCHEM (Horizon 2020). His research activity is focused on enabling technologies for green chemical processes from lab scale to industrial applications. He is the President of the European Society of Sonochemistry.

Bang-Ce Ye is a Chang Jiang Scholar (Ministry of Education of China) in the School of Chemistry and Chemical Engineering, of Shihezi University, and Professor of Biology and Chemistry in the East China University of Science and Technology. He obtained his PhD degree in 1998. His research now focuses on analytical biotechnology and systems biotechnology.

Imdad Kaleem received his PhD in Biochemical Engineering from the School of Life Science, Beijing Institute of Technology, Beijing, China in 2013. He is currently working as an Assistant Professor of Biochemistry in the Department of Bioinformatics and Bioscience, COMSATS Institute of Information Technology (CIIT), Islamabad, Pakistan. His research interests are green process engineering and nanobiotechnology.
Acknowledgments
This work was financially supported by the National Natural Science Foundation of China (51262025) and the International Scientific and Technological Cooperation Project of Xinjiang Bingtuan (2013BC002).
References
[1] Walker GM, Weatherley LR. Sep. Sci. Technol. 2000, 35, 1329–1341.10.1081/SS-100100227Search in Google Scholar
[2] Hesas RH, Arami-Niya A, Daud WMAW, Sahu JN. Chem. Eng. Res. Des. 2013, 91, 2447–2456.10.1016/j.cherd.2013.06.004Search in Google Scholar
[3] Tan IAW, Ahmad AL, Hameed BH. Chem. Eng. J. 2008, 137, 462–470.10.1016/j.cej.2007.04.031Search in Google Scholar
[4] Njoku VO, Foo KY, Asif M, Hameed BH. Chem. Eng. J. 2014, 250, 198–204.10.1016/j.cej.2014.03.115Search in Google Scholar
[5] Xiao H, Peng H, Deng SH, Yang XY, Zhang YZ, Li YW. Bioresource Technol. 2012, 111, 127–133.10.1016/j.biortech.2012.02.054Search in Google Scholar PubMed
[6] Saka C. J. Anal. Appl. Pyrol. 2012, 95, 21–24.10.1016/j.jaap.2011.12.020Search in Google Scholar
[7] Wang X, Liang X, Wang Y, Wang X, Liu M, Yin D, Xia S, Zhao J, Zhang Y. Desalination 2011, 278, 231–237.10.1016/j.desal.2011.05.033Search in Google Scholar
[8] Achawa OW, Afraneb G. Micropor. Mesopor. Mat. 2008, 112, 284–290.10.1016/j.micromeso.2007.10.001Search in Google Scholar
[9] Ozhan A, Sahin O, Saka C, Kucuk MM. Cellulose. 2014, 21, 2457–2467.10.1007/s10570-014-0299-ySearch in Google Scholar
[10] Junior OP, Cazetta AL, Gomes RC, Barizao EO, Souza IPAF, Martins AC, Asefa T, Almeida VC. Anal. App. Pyrol. 2014, 105, 166–176.10.1016/j.jaap.2013.10.015Search in Google Scholar
[11] Xiao XM, Tian F, Yan YJ, Wu ZS. J. Shihezi Univ. 2014, 4, 485–490.Search in Google Scholar
[12] Xiao XM, Tian F, Yan YJ, Wu ZS, Wu ZL, Cravotto G. Korean J. Chem. Eng. 2015, 32, 1129–1136.10.1007/s11814-014-0317-7Search in Google Scholar
[13] Sahu JN, Acharya J, Meikap BC. Bioresource Technol. 2010, 101, 1974–1982.10.1016/j.biortech.2009.10.031Search in Google Scholar PubMed
[14] Guses A, Dogar C, Yalcin M, Acikyildiz M, Bayrak R, Karaca S. J. Hazard. Mater. 2006, 131, 217–228.10.1016/j.jhazmat.2005.09.036Search in Google Scholar PubMed
[15] Al-Ghouti MA, Khraisheh MAM, Ahmad MNM, Allen S. J. Hazard. Mater. 2009, 165, 589–598.10.1016/j.jhazmat.2008.10.018Search in Google Scholar PubMed
[16] Ge XY, Tian F, Wu ZL, Yan YJ, Cravotto G, Wu ZS. Chem. Eng. Process. 2015, 91, 67–77.10.1016/j.cep.2015.03.019Search in Google Scholar
[17] Freundlich HZ. J. Phys. Chem. 1906, 57, 384–470.Search in Google Scholar
[18] Zhong ZY, Yang Q, Li XM, Luo K, Liu Y, Zeng GM. Ind. Crop. Prod. 2012, 37, 178–185.10.1016/j.indcrop.2011.12.015Search in Google Scholar
[19] Basta AH, Fierro V, El-Saied H, Celzard A. Bioresource Technol. 2009, 100, 3941–3947.10.1016/j.biortech.2009.02.028Search in Google Scholar PubMed
[20] Duan XH, Srinivasakannan C, Peng JH, Zhang LB, Zhang ZY. Fuel Process Technol. 2011, 92, 394–400.10.1016/j.fuproc.2010.09.033Search in Google Scholar
[21] Brum SS, Bianch ML, Silva VL, Goncalves M, Guerreiro MC, Oliveira LCA. Quim. Nova 2008, 31, 1048–1052.10.1590/S0100-40422008000500019Search in Google Scholar
[22] Deng H, Yang L, Tao GH, Dai JL. J. Hazard. Mater. 2009, 166, 1514–152.10.1016/j.jhazmat.2008.12.080Search in Google Scholar PubMed
[23] Foo KY, Hameed BH. Bioresource Technol. 2012, 111, 425–432.10.1016/j.biortech.2012.01.141Search in Google Scholar
[24] Kruk M, Jaroniec M. Chem. Mater. 2001, 13, 3169–3183.10.1021/cm0101069Search in Google Scholar
[25] Foo KY, Hameed BH. Biomass Bioenerg. 2011, 35, 3257–3261.10.1016/j.biombioe.2011.04.023Search in Google Scholar
[26] Foo KY, Hameed BH. Bioresource Technol. 2011, 102, 9814–9817.10.1016/j.biortech.2011.07.102Search in Google Scholar
[27] Ge XY, Ma XF, Wu ZS, Xiao XM, Yan YJ. Res. Chem. Intermediat. 2015, 41, 7327–7347.10.1007/s11164-014-1815-2Search in Google Scholar
[28] Foo KY, Lee LK, Hameed BH. Chem. Eng. J. 2013, 223, 604–610.10.1016/j.cej.2013.03.009Search in Google Scholar
[29] Foo KY, Hameed BH. Chem. Eng. J. 2012, 180, 66–74.10.1016/j.cej.2011.11.002Search in Google Scholar
[30] Yagmur E. J. Porous Mat. 2012, 19, 995–1002.10.1007/s10934-011-9557-7Search in Google Scholar
[31] Silverstein RM, Webster FX, Kiemle DJ. Spectrometric Identification of Organic Compounds, 7th ed., John Wiley and Sons: New York, 2006.Search in Google Scholar
[32] Foo KY, Hameed BH. Chem. Eng. J. 2011, 173, 385–390.10.1016/j.cej.2011.07.073Search in Google Scholar
[33] Ryu Z, Rong H, Zheng J, Wang M, Zhang B. Carbon 2002, 40, 1131–1150.10.1016/S0008-6223(01)00261-5Search in Google Scholar
[34] Liu QS, Zheng T, Wang P, Guo L. Ind. Crops Prod. 2010, 31, 233–238.10.1016/j.indcrop.2009.10.011Search in Google Scholar
[35] Foo KY, Hameed BH. Desalination 2011, 275, 302–305.10.1016/j.desal.2011.03.024Search in Google Scholar
©2016 Walter de Gruyter GmbH, Berlin/Boston
Articles in the same Issue
- Frontmatter
- In this issue
- Original articles
- Continuous H2O2 direct synthesis process: an analysis of the process conditions that make the difference
- Aqueous-phase oxidation of 5-hydroxymethylfurfural over Pt/ZrO2 catalysts: exploiting the alkalinity of the reaction medium and catalyst basicity
- An efficient multicomponent, one-pot synthesis of Betti bases catalyzed by cerium (IV) ammonium nitrate (CAN) at ambient temperature
- Valorization of rambutan peel for the synthesis of silver-doped titanium dioxide (Ag/TiO2) nanoparticles
- Facile bio-inspired synthesis of zinc sulfide nanoparticles using Chlamydomonas reinhardtii cell free extract: optimization, characterization and optical properties
- Synthesis of In2O3 nanoparticles via a green and solvent-free method
- Microwave-assisted preparation of almond shell-based activated carbon for methylene blue adsorption
- Adsorption of phthalic acid esters (PAEs) on chemically aged biochars
- Synthesis and characterization of polyamide-imides based on the different chain length of amino acids in molten TBAB as a green media
- A novel process for recovery of rare earth and fluorine from bastnaesite concentrates. Part I: calcification roasting decomposition
- Conference announcements
- 6th International Congress of the Flow Chemistry Society (Miami, FL, USA, November 2–3, 2016)
- Conferences 2016–2017