Facile bio-inspired synthesis of zinc sulfide nanoparticles using Chlamydomonas reinhardtii cell free extract: optimization, characterization and optical properties
-
M. Divya Rao
M. Divya Rao completed her Master’s degree in Biotechnology at the University of Madras in 2007. She joined the Centre of Biotechnology as a Junior Research fellow in 2008. Her doctoral studies have focused on the green synthesis of various metal and semiconductor nanoparticles using aquatic microalgae.
 and
Gautam Pennathur
and
Gautam Pennathur
Gautam Pennathur received his PhD in Inorganic and Physical Chemistry from the Indian Institute of Science, India, in 1989. He joined the Centre for Biotechnology Anna University as a visiting faculty in 1993 and is presently a professor at the Centre for Biotechnology, Anna University, Chennai.

Abstract
This study describes an eco-friendly, economical method to synthesize semiconductor zinc sulfide (ZnS) nanoparticles using the cell free extract of Chlamydomonas reinhardtii. Physicochemical parameters like pH, temperature and cell free extract concentration were optimized. Spherical particles measuring 8–12 nm were observed under high-resolution transmission electron microscopy (HRTEM). Elemental analysis proved that the nanoparticles were composed of zinc and sulfur, while powder X-ray diffraction (XRD) demonstrated the pure FCC crystal structure. Examination of the functional groups by Fourier transform infrared (FTIR) spectroscopy showed that algal proteins were involved in the synthesis of the nanoparticles. These nanoparticles demonstrated unique optical properties that were probed with UV-visible and photoluminescence (PL) spectroscopy. A peak at 310 nm was detected that was significantly blue-shifted from the bulk counterpart. Broad emission peaks at 410 nm and 430 nm were seen. The former was due to radiative recombination while the latter was attributed to defect states. In an effort to understand the molecular mechanism, the proteins bound to the nanoparticle surface were studied using sodium dodecyl sulfate polyacrylamide gel electrophoresis (SDS PAGE) and numerous proteins that are part of the cells’ oxidoreductive machinery were identified. These cellular proteins probably play a pivotal role in the synthesis and stabilization of ZnS nanoparticles.
1 Introduction
Zinc sulfide (ZnS) is a semiconductor with a wide band gap of 3.7eV [1]. Due to quantum confinement, nanocrystalline ZnS has novel properties compared to the bulk material. Its unique properties include a large surface to volume ratio, enhanced activity, and distinct optical and electronic properties. It finds extensive application in light emitting diodes [2, 3], as photocatalysts that may be used for environmental remediation [4] and have also been used as effective antimicrobial agents [5]. There is a constant need for new strategies that provide better control over the size and shape of semiconductor nanoparticles, especially since their optoelectronic properties critically depend on these factors [6].
Traditionally, physical and chemical methods such as pulsed laser deposition at 600°C, high energy milling and chemical precipitation have been used to synthesize semiconductor nanoparticles [7]. These methods have been popular because they have a number of advantages, for example, the size and shape control offered by the classical colloidal chemistry approach is hard to beat. However, they come with their own limitations, like the use of expensive equipment, hazardous materials and severe conditions. Moreover, the synthesis of nanostructures with a precise shape usually requires multiple steps and a copious amount of chemicals to create a suitable template. Following synthesis, it is necessary to remove the template and this can prove challenging as it involves a protracted, energy consuming process [8]. Green strategies are based on the use of benign, solvents, nontoxic chemicals and sustainable materials. Recently, there has been a growing interest in the use of biological materials for nanoparticle synthesis, as it is well known that they are capable of producing inorganic materials both intracellularly and extracellularly. Further, there have been reports on the synthesis of unique hierarchical nanostructures with outstanding shape and size control by employing biomolecules [9]. A biomimetic approach would be environmentally benign and more cost effective. In our study we have utilized the cell free extract of Chlamydomonas reinhardtii as the capping material to help synthesize the nanoparticles and the reaction was conducted in an aqueous solution at room temperature.
Diverse organisms or its components have been used in the synthesis of ZnS nanoparticles; for example, the immobilized phototrophic bacterium, Rhodobacter sphaeroides [10], latex of the plant Jatropha curcas and Fusarium oxysporum, a common fungus [11]. Ordered ZnS nanocrystal assemblies have been fabricated using a genetically modified P22 coat protein as a template [9]. To the best of our knowledge, there have been no reports until date regarding the application of algae in the synthesis of ZnS nanoparticles. Chlamydomonas reinhardtii is an alga that is abundant in fresh water. These harmless algae are easy to culture in large quantities as they do not require expensive media or exacting conditions and are safe for handling. The entire process can easily and economically be scaled up to produce up to 5 g/l of photoautotrophic biomass using low cost photobioreactors [12]. Their cost effectiveness and the fact that algal cells are rich in polysaccharides and glycoprotein matrices, composed of numerous functional groups (such as carbonyl, thiol, carboxyl, amidic and amino) which play a significant role in the reduction and stabilization of nanoparticles make them ideal for use in synthesis [13]. Zinc sulfate has been used to synthesize the nanoparticles in this study; it is commonly used as source of zinc in animal feeds and is generally considered safe [14].
One of the challenges in semiconductor nanoparticle synthesis has been the low yield; this is largely due to intracellular synthesis that required cell lysis and further downstream processing for nanoparticle purification [15]. In our study, we employ an extracellular approach that allows us to readily recover the nanoparticles without further downstream processing. The entire process is easily scalable, economical and makes use of environmentally safe materials.
By employing mild conditions in combination with nontoxic materials, we have developed a facile, green synthetic method to produce nanoscale ZnS. The optical properties of these nanoparticles were characterized using UV-visible spectroscopy, photoluminescence (PL) spectroscopy; the size and crystal structure were analyzed using high resolution transmission electron microscopy (HRTEM), high resolution scanning electron microscopy (HR-SEM), dynamic light scattering (DLS) and X-ray diffraction (XRD). Finally, the functional groups involved and the stability of the nanoparticles were determined by Fourier transform infrared (FTIR) spectroscopy and by measuring the zeta potential. We have discussed the plausible mechanism of nanoparticle formation involving proteins belonging to the oxidoreductive apparatus, their role in capping and subsequent stabilization.
2 Materials and methods
2.1 Algal cultures
Chlamydomonas reinhardtii was obtained from the Culture Collection Center, CAS in Botany, University of Madras, India and maintained in Bold’s Basal Medium at 25°C. The microalgae were scaled up from 10 ml to 500 ml for use in further experiments.
2.2 Synthesis of ZnS nanoparticles
Chlamydomonas reinhardtii was cultured in 225 ml of Bold’s Basal Medium in a 1000 ml Erlenmeyer flask at 25°C with a 12 h photoperiod for a week. The cells were pelleted at 12,557 g for 20 min and at 4°C. The cell free extract that was collected was used to synthesize ZnS nanoparticles. Some 25 ml of cell free extract was taken in an Erlenmeyer flask and made up to 100 ml using deionized water; to this, zinc sulfate was added to obtain a final concentration of 1 mm. The reaction was allowed to proceed for 24 h. Following the completion of the reaction, centrifuging it at 8720 g separated the nanoparticles; the pellet was washed repeatedly with deionized water to remove other organic matter that may be bound to the nanoparticles. All the chemicals used in culturing algae and nanoparticle synthesis were of analytical grade and procured from SRL chemicals (India).
2.3 Optimization of physicochemical parameters responsible for nanoparticle synthesis
There are a number of parameters that can be optimized to improve nanoparticle synthesis, their stability and their shape. These include the effect of temperature, pH and algal cell free extract concentration.
2.3.1 Effect of temperature:
Some 75 ml of cell free extract was made up to 300 ml using deionized water, 100 ml of which was aliquoted into 250 ml Erlenmeyer flasks. To this, zinc sulfate was added to get a final concentration of 1 mm. One of the flasks was placed in an incubator set at 37°C, another set to 60°C and finally the third flask was kept in a water bath set at 80°C. The absorbance was measured using a UV-spectrophotometer.
2.3.2 Effect of pH:
Some 100 ml of cell free extract was made up to 400 ml with deionized water and was aliquoted into four different Erlenmeyer flasks. To this, zinc sulfate was added to give a final concentration of 1 mm. The pH of the flasks was adjusted using 0.1 m hydrochloric acid and 0.1 m sodium hydroxide and a pH of 4.5, 6.5, 8.5 and 10.5 was maintained in each flask, respectively. The reactions were conducted over a period of 24 h at 37°C.
2.3.3 Effect algal cell free extract concentration:
The effect of the algal cell free extract was studied by modulating the concentration of the extract (0.5 ml, 1.5 ml and 2.5 ml). The reaction was conducted at room temperature (37°C) at a constant metal ion concentration of 1 mm for 24 h.
2.4 Characterization of ZnS nanoparticles
The bioreduction of zinc sulfate was monitored using a UV-visible spectrophotometer (Perkin Elmer λ 35). HRTEM micrographs of ZnS nanoparticles were obtained using an FEI Tecnai G2, model T-30 S-Twin (USA). The presence of elemental zinc and sulfur was confirmed using energy dispersive X-ray spectroscopy (EDS) and the surface morphology of the nanoparticles was characterized using HR-SEM. The crystalline nature of the nanoparticles was determined using powder XRD on a Rigaku Mini-Flex II diffractometer, with 2θ values ranging from 20° to 90° and Cu Kα (1.5406 Å) source running at 30 kV and 15 mA.
Particle size and stability were studied using DLS and zeta potential, respectively using Malvern Zetasizer Nano ZS system. Prior to analysis, the samples were filtered using a 0.2 μm filter and were analyzed in a range from 0.1 nm to 1000 nm. The functional groups present in the nanoparticles were determined using FTIR spectroscopy on a Bruker RFS-27 stand-alone FT Raman spectrophotometer. The nanoparticles were pelleted and lyophilized, following which, the pellet was mixed with potassium bromide in a 1:100 ratio and a tablet was prepared using a bench press. Scanning was performed with a resolution of 2 cm-1 from 4000 cm-1 to 400 cm-1 in the transmittance mode. The PL spectra were measured using a Jobin Yvon Fluorolog 3-11 spectrophotometer.
2.5 Identification of biomolecules capping the ZnS nanoparticles using sodium dodecyl sulfate polyacrylamide gel electrophoresis
Sodium dodecyl sulfate (SDS) polyacrylamide gel electrophoresis was performed using the discontinuous gel system. The stacking and separating gels were prepared using 4% (w/v) and 12% (w/v) acrylamide, respectively. The ZnS nanoparticles were resuspended in a 1% SDS solution and then boiled in a water bath for 10 min. The sample was centrifuged at 8720 g for 10 min. The supernatant and a marker were loaded onto the gel and run at 60 V until the dye front reached the end of the gel, following which the gel was stained using Coomassie brilliant blue dye (CBB R-250) for about 4 h. It was then destained and protein bands were visualized in a gel imaging system.
3 Results and discussion
ZnS nanoparticles were synthesized by a rapid, green method that employed the cell free extract of the ubiquitous fresh water algae C. reinhardtii. The nanoparticles were easily separated from the algal cell free extract by centrifugation and repeated washing (thrice). They did not require any additional processing and were used in subsequent experiments. Biosynthesis of ZnS nanoparticles was monitored using UV-visible spectroscopy under ambient conditions (room temperature). Over the course of 24 h, there was a change in color from a colorless solution to a pale solution with a whitish precipitate. Periodic sampling taken every 8 h showed the development of a shoulder at 300 nm. Over the course of the reaction, there was increase in absorbance and a mild red shift of approximately 10 nm. Following 24 h, there was no further increase in the absorbance or shift in the peak position indicating the completion of the reaction. The absorption spectra revealed a broad excitonic peak around 310 nm as can be observed in Figure 1; a similar broad excitonic peak has been observed during the synthesis of thioglycolate coated ZnS nanoparticles after 16 h [16]. This peak is significantly blue-shifted compared to the bulk material and could be explained by quantum confinement effects. As the particle size decreases, the wavelength of maximum exciton absorption (λmax) also decreases [17]. Other studies that have made use of biological sources for ZnS nanoparticle synthesis have reported similar results [18, 19]. When the absorption peak is located around 325 nm, particle size could be correlated to 4.5 nm. We observed larger particles of approximately 8 nm in size; this discrepancy could be explained by virtue of the broadness of the peak that indicates some amount of heterogeneity in particle size [20].

UV-visible spectrum of zinc sulfide nanoparticles synthesized using Chlamydomonas reinhardtii cell free extract at room temperature over the course of 24 h.
There are a number of factors that play a key role in the synthesis of nanoparticles; these include temperature and pH whose effects have been studied in detail. The effect of temperature on the synthesis of ZnS nanoparticles was studied by varying the temperature up to 80°C as seen in Figure 2. At higher temperatures of 60°C and 80°C, no characteristic absorption peaks were observed, however broad peaks at 280 nm and 430 nm were observed. These likely correspond to algal proteins and chlorophyll a present in the algal cell extract [21]. At room temperature, a peak at approximately 307 nm was observed, corresponding to the conversion of bulk zinc sulfate to nanoscale ZnS. Approximately 1.5 g/l of ZnS nanoparticles from cell free extract was obtained; there was a lower yield at higher temperatures. It is likely that at higher temperatures, the algal proteins denature and are unable to interact and reduce the zinc sulfate solution, whereas at room temperature the proteins retain their functionality and are able to reduce and stabilize the as-formed nanoparticles.

Effect of temperature on the synthesis of zinc sulfide nanoparticles using Chlamydomonas reinhardtii.
The role of surface charge on the formation of ZnS nanoparticles were studied by varying the pH and observing its effect on the absorption properties. At more alkaline pHs no peaks were seen and this could be attributed to greater solubility of the product preventing the formation of ZnS nanoparticles [22]. There have been a number of reports that have studied the activity of oxidoreductive proteins such as carbonic anhydrase and sedoheptulose 1,7 bisphosphatase under different pH conditions. They have observed an increase in the activity of these proteins under alkaline conditions compared to acidic pHs, thus indicating that these proteins are functionally active even at higher pHs [23, 24]. At a pH of 4.5, a broad peak around 325 nm was observed (Figure 3) indicating the formation of nanoparticles. It is highly probable that these nanoparticles would be larger in size, because at such low pH values, agglomeration is favored over nucleation. At a pH of 6.5, which is the physiological pH of the microalgae, a strong absorption peak around 310 nm was clearly observed. There was a high yield of nanoparticles at this pH; at more acidic pHs insubstantial amounts of nanoparticles were produced. The algal proteins play a critical role in the nucleation-growth processes and at this pH they act as a scaffold and help regulate the size of the nanoparticles.

Effect of pH on the synthesis of zinc sulfide nanoparticles using Chlamydomonas reinhardtii.
The effect of the algal cell free extract in the synthesis of ZnS nanoparticles (Figure 4) was studied by varying the concentration of the extract, meanwhile the other conditions were maintained as follows – zinc sulfate solution (1 mm) with a pH of 6.5 at room temperature. When 0.5 ml of extract was used, no ZnS peak was observed, but a peak around 285 nm was seen and this corresponds to a protein component of the extract. As the concentration of the extract increased there was a slight red shift in the peak to approximately 290 nm; this would be indicative of the nascent formation of ZnS nanoparticles. Finally, when a concentration of 2.5 ml was used, a pronounced peak at 310 nm corresponding to the formation of nano-ZnS was observed; this peak was also significantly blue-shifted from bulk material and this could be ascribed to the quantum confinements.

Effect of Chlamydomonas reinhardtii cell free extract concentration on the synthesis of zinc sulfide nanoparticles.
The fluorescent properties of the nanoparticles were determined using PL spectroscopy and the samples were excited at 325 nm. Two peaks were observed; a broad peak at 410 nm and a shoulder peak at 431 nm as seen in Figure 5. The peak at 410 nm may be attributed to the recombination between the sulfur-vacancy-related donor and the valence band [25], while the peak at 430 nm may be due to defect related emissions, specifically due to zinc related vacancies [17, 26]. This could tie in with the EDS results, which indicated reduced levels of zinc. A moderate blue shift in the emission (30 nm) band relative to that of bulk ZnS is further attestation to the size quantization effects. A previous study observed a similar emission profile with a peak at 420 nm and attributed this to the recombination of electron and holes in the trapped surface states located in the forbidden region of the bandgap [27].

Fluorescence spectrum obtained from aqueous zinc sulfide nanoparticles at room temperature excited at 325 nm.
The HRTEM images as shown in Figure 6 indicate that the particles are spherical in shape. At lower magnification, there are a number of spherical particles clustered together. Analysis at higher magnifications indicated that they are actually a number of smaller particles that have been loosely assembled together. The particles were found to range from 8 nm to 12 nm and the average particle size was around 10 nm. The selected area electron diffraction (SAED) image (6D) showed bright concentric rings instead of sharp, well-defined spots indicating the polycrystalline nature of the nanoparticles that could be indexed with the zinc blende structure. A large number of spherical particles were observed during HRTEM analysis. Some amount of agglomeration of the sample was observed; a possible reason could be due to the association of particles during drying in the HRTEM sample preparation process [17]. ZnS nanoparticles that were synthesized using SDS as a capping agent were found to agglomerate; this was reasoned to be due to the large surface encompassed by the detergent that promoted agglomeration [28]. HR-SEM was used to study the surface morphology of the ZnS nanoparticles; at higher magnifications, large numbers of spherical nanoparticles measuring around 20 nm to 35 nm were observed (Figure 7). However, at lower magnifications, the particles appeared to possess an irregular morphology and were agglomerated. Energy dispersive X-ray spectroscopy (EDX) can be very informative about the structure or the elemental composition of the material that is being investigated. Elemental analysis of ZnS nanoparticles showed the presence of zinc and sulfur confirming that the synthesized nanoparticles were indeed ZnS (Figure 7D). Other peaks that were observed corresponding to carbon, oxygen and nitrogen are most likely due to proteinaceous matter capping the nanoparticles. The crystallographic nature and size of the nanoparticles were analyzed by powder XRD. Figure 8 shows the powder XRD profile of ZnS nanoparticles synthesized using the cell-free extract of C. reinhardtii. The product was found to exhibit the characteristic features attributed to the FCC structure of cubic ZnS. The profiles matched JCPDS powder diffraction file no. 651691. The characteristic peaks at 2θ values of 28.3, 46.9 and 56.1 correspond to (1 1 1), (2 2 0) and (3 1 1) planes for cubic ZnS. The particle size was calculated using Debye-Scherrers formula, which is:

High-resolution transmission electron microscopy (HRTEM) images of zinc sulfide nanoparticles (A–C) from lower to higher magnifications; SAED pattern (D); particle size distribution graphs (E).

High resolution scanning electron microscopy (HR-SEM) images of zinc sulfide nanoparticles at different magnifications (A–C); (D) EDX analysis of zinc sulfide nanoparticles; particle size distribution graphs (E).
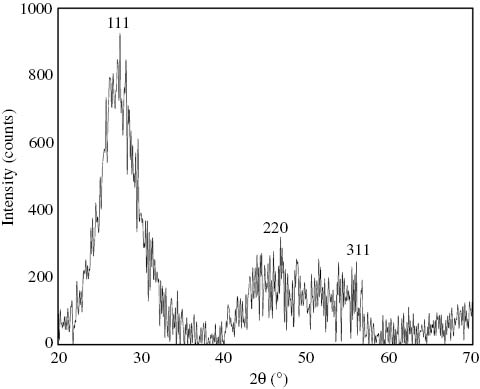
Powder X-ray diffraction (XRD) pattern of zinc sulfide nanoparticles synthesized using the cell free extract of Chlamydomonas reinhardtii.
where D represents mean crystallite size, λ is the wavelength of the copper target that was used, β represents the full width half maximum of the peak and θ is the diffraction angle. The particle size was found to be ~7 nm. The broadness of the peaks indicates the relatively small particle size.
DLS is a technique that depends on the interaction of light with particles [29]. The hydrodynamic size of the particles was determined using DLS and was found to be 68 nm for the aqueous preparation of ZnS nanoparticles (Figure 9A). Zeta potential is an indicator of the stability of the nanoparticle solution. For ZnS nanoparticles, it was measured to be -21.1 mV indicating its relative stability (Figure 9B). The large variation in sizes reported by DLS and HRTEM could be due to the capping agent that surrounds the nanoparticle. Further, HRTEM and XRD measure the inorganic core of the particle, since the organic shell is less electron dense in comparison to the inorganic core and thus transparent in HRTEM and XRD. This may account for the variation in measurements made using these techniques [29]. Zeta potential is indicative of both the surface charge and the local environment surrounding a nanoparticle. The proteins adsorbed on the surface of the nanoparticle may influence its zeta potential. There is a correlation between the amount of protein adsorbed and zeta potential [30]. FTIR analysis of the ZnS pellet revealed strong bands at 1630 cm-1 and 1540 cm-1 corresponding to amide I and amide II vibrational bands (Figure 10). The band at 1102 cm-1 corresponded to the C-N stretch of aliphatic amines. The peak at 617 cm-1 could be assigned to ZnS (i.e. sulfides) [31]. The broad band at 3220 cm-1 could be assigned to O-H stretching. The peaks at 2850 cm-1 and 2917 cm-1 corresponded to C-H stretches in alkyl groups.

Hydrodynamic size distributions of zinc sulfide nanoparticles with an average hydrodynamic radius of 68 nm as measured by dynamic light scattering (DLS) (A); zeta potential of zinc sulfide nanoparticles synthesized using Chlamydomonas reinhardtii cell free extract (B).

Fourier transform infrared (FTIR) spectrum of zinc sulfide nanoparticles synthesized using algal cell free extract.
Earlier reports have observed that the carbonyl groups present in proteins have a strong affinity to metals and may thus mediate capping. Cyclic peptides present in plants have also been shown to be responsible for nanoparticle synthesis and stabilization [19]. Bacteria that synthesized ZnS nanoparticles were found to possess sulfate reduction systems, namely, enzymes like sulfate permease, ATP sulfurylase etc [18].
It is still unclear whether microalgae possess a similar sulfate reduction system, therefore to get an idea about the algal proteins involved in the formation of these nanoparticles, the sample was boiled with 1% SDS solution for 10 min in a water bath, following which it was run in a 12% SDS polyacrylamide gel. SDS is a detergent which helps in linearizing the polypeptides and facilitates their detachment from the surface of the nanoparticle. An intense band at approximately ~30 kDa was observed in Figure 11 and this could likely be oxygen enhancing evolver protein (OEE) 1. A few faint bands below 27 kDa were also observed and it is possible that these could be other oxygen evolving enhancer proteins (proteins 2 and 3) Another study that used the same algae in the synthesis of silver nanoparticles got similar results when they identified the proteins using MALDI MS-MS. These proteins are usually localized in the chloroplast and are frequently produced in response to stress especially from metals. Between 27–59 kDa, three faint bands were observed and these could be ATPases, carbonic anhydrase or sedoheptulose-1,7-bisphosphatase. ATPase or ATP synthase is a membrane bound ion transporter and like oxygen evolving enhancer proteins, is produced in response to metallic stress. Sedoheptulose-1,7-bisphosphatase is capable of capping the nanoparticles with its free -SH group that is produced by thioredoxin-mediated reduction [32]. All of these proteins form a major part of the oxidoreductive machinery in the algal cell and are likely to play a pivotal role in the synthesis and stabilization of the semiconductor nanoparticles. Further analysis would be required to specifically identify the proteins involved in chalcogenide nanosynthesis. However, the use of the same microalgae has been implicated in the synthesis of silver and gold nanoparticles and may play a similar role in this case with these proteins in fact acting as the capping agents.

Sodium dodecyl sulfate polyacrylamide gel electrophoresis (SDS PAGE) analysis of proteins bound to ZnS nanoparticles using 1% SDS solution. Lane 1 corresponds to the molecular weight markers. Lane 2 represents the protein profile of proteins that were bound to zinc sulfide nanoparticles after boiling with 1% SDS solution.
Based on these findings, we propose a mechanism as seen in Figure 12, by which C. reinhardtii is able to synthesize ZnS nanoparticles. Initially, the oxygen evolving enhancer proteins act as a reducing agent; these proteins exhibit thioredoxin activity and their thiol groups are involved in capping the nanoparticles [33]. These proteins possess two cysteine residues; the thiol group of one residue forms a transient heterodisulfide linkage with zinc sulfate, the second cysteine residue then attacks this linkage and releases the reduced ZnS nanoparticles [34]. Sedoheptulose-1,7- bisphosphatase may work in conjunction with these proteins to help in the capping process. The other proteins that are part of the algal redox machinery are likely to play a crucial role in the stabilization of these nanoparticles. The nanoparticle-protein corona is highly dependent on physicochemical features of the nanoparticle as well as the proteins that are bound to it. The binding of proteins on the surface of uncoated nanoparticles was found to considerably increase nanoparticle stability and this has been attributed to the increase in hydrophobic interactions as well as greater entropic gain [35]. Thus, based on these preliminary findings we can recognize the fundamental role of algal proteins in the biosynthesis of ZnS nanoparticles. Further studies into the specific role of these proteins and their interactions would help exercise greater control over the size and functionality of these nanoparticles.

Mechanism describing the synthesis and stabilization of zinc sulfide nanoparticles by algal biomolecules.
4 Conclusion
This is the first report to describe a facile, low cost method to produce a large number of stable ZnS nanoparticles using the green algae C. reinhardtii. A large number of spherical ZnS nanoparticles measuring 8–12 nm were observed using HRTEM. Elemental analysis of the sample indicated that they contained zinc, sulfur and other elements that may be representative of the proteinaceous material capping the nanoparticles. The UV-visible, PL spectra emphasize the unique optical properties of these nanoparticles. Structural analysis by XRD showed the formation of pure ZnS nanoparticles with FCC structure. Analysis of proteins bound to the surface of the nanoparticles hinted at the pivotal role played by the oxidoreductive machinery of the microalgae.
About the authors

M. Divya Rao completed her Master’s degree in Biotechnology at the University of Madras in 2007. She joined the Centre of Biotechnology as a Junior Research fellow in 2008. Her doctoral studies have focused on the green synthesis of various metal and semiconductor nanoparticles using aquatic microalgae.

Gautam Pennathur received his PhD in Inorganic and Physical Chemistry from the Indian Institute of Science, India, in 1989. He joined the Centre for Biotechnology Anna University as a visiting faculty in 1993 and is presently a professor at the Centre for Biotechnology, Anna University, Chennai.
Acknowledgments
The authors would like to thank the Department of Science and Technology for their continued support. DR is grateful for the technical support provided by SAIF, IIT Madras. DR would also like to thank D. Sudha for her support in editing the manuscript.
References
[1] Khiew P, Radiman S, Huang N, Ahmad MS, Nadarajah K. Mater. Lett. 2005, 59, 989–993.10.1016/j.matlet.2004.11.044Search in Google Scholar
[2] Borah JP, Barman J, Sarma K. Chalcogenide Lett. 2008, 5, 201–208.Search in Google Scholar
[3] Liu X, Wan J, Xiong Y, Liang S, Gao Y, Tang Z. J. Nanosci. Nanotechnol. 2015, 15, 5798–5806.10.1166/jnn.2015.9768Search in Google Scholar PubMed
[4] Hu JS, Ren LL, Guo YG, Liang HP, Cao AM, Wan LJ, Bai CL. Angew. Chem. 2005, 117, 1295–1299.10.1002/ange.200462057Search in Google Scholar
[5] Malarkodi C, Rajeshkumar S, Paulkumar K, Vanaja M, Gnanajobitha G, Annadurai G. Bioinorg. Chem. Appl. 2014, 2014, 10.10.1155/2014/581890Search in Google Scholar PubMed PubMed Central
[6] Smith AM, Nie S. Acc. Chem. Res. 2009, 43, 190–200.10.1021/ar9001069Search in Google Scholar PubMed PubMed Central
[7] Moon JW, Ivanov IN, Joshi PC, Armstrong BL, Wang W, Jung H, Rondinone AJ, Jellison GE, Meyer HM, Jang GG, Acta Biomater. 2014, 10, 4474–4483.10.1016/j.actbio.2014.06.005Search in Google Scholar PubMed
[8] Zhou H, Fan T, Zhang D, Guo Q, Ogawa H. Chem. Mater. 2007, 19, 2144–2146.10.1021/cm0629311Search in Google Scholar
[9] Baumann V, Habeeb Muhammed MA, Blanch AJ, Dey P, Rodriguez-Fernández J. Isr. J. Chem. 2015, 56, 1869–5868.10.1002/ijch.201500031Search in Google Scholar
[10] Bai HJ, Zhang ZM, Gong J. Biotechnol. Lett. 2006, 28, 1135–1139.10.1007/s10529-006-9063-1Search in Google Scholar PubMed
[11] Mirzadeh S, Darezereshki E, Bakhtiari F, Fazaelipoor MH, Hosseini MR. Mater. Sci. Semicond. Process. 2013,16, 374–378.10.1016/j.mssp.2012.09.008Search in Google Scholar
[12] Rosenberg JN, Oyler GA, Wilkinson L, Betenbaugh MJ. Curr. Opin. Biotech. 2008, 19, 430–436.10.1016/j.copbio.2008.07.008Search in Google Scholar PubMed
[13] Subramaniyam V, Subashchandrabose SR, Thavamani P, Megharaj M, Chen Z, Naidu R. J. Appl. Phycol. 2015, 27, 1–9.10.1007/s10811-014-0323-5Search in Google Scholar
[14] Kumar N, Verma RP, Singh LP, Varshney VP, Dass RS. Reprod. Nutr. Dev. 2006, 46, 663–675.10.1051/rnd:2006041Search in Google Scholar
[15] Moon JW, Ivanov IN, Duty CE, Love LJ, Rondinone AJ, Wang W, Li YL, Madden AS, Mosher JJ, Hu MZ. J. Ind. Microbiol Biotechnol. 2013, 40, 1263–1271.10.1007/s10295-013-1321-3Search in Google Scholar
[16] Bochev B, Yordanov G. Colloids Surf., A 2014, 441, 84–90.10.1016/j.colsurfa.2013.08.077Search in Google Scholar
[17] Mehta S, Kumar S, Chaudhary S, Bhasin K, Gradzielski M. Nanoscale Res. Lett. 2009, 4, 17–28.10.1007/s11671-008-9196-3Search in Google Scholar
[18] Mala, JGS, Rose C. J. Biotechnol. 2014, 170, 73–78.10.1016/j.jbiotec.2013.11.017Search in Google Scholar
[19] Hudlikar M, Joglekar S, Dhaygude M, Kodam K. J. Nanopart. Res. 2012, 14, 865.10.1007/s11051-012-0865-xSearch in Google Scholar
[20] Liu H, Ni Y, Han M, Liu Q, Xu Z, Hong J, Ma X. Nanotechnology 2005, 16, 2908.10.1088/0957-4484/16/12/030Search in Google Scholar
[21] Berberoglu H, Pilon L, Melis A. Int. J. Hydrogen Energy 2008, 33, 6467–6483.10.1016/j.ijhydene.2008.07.071Search in Google Scholar
[22] Abbas NK, Al-Rasoul KT, Shanan ZJ. Int. J. Electrochem. Sci. 2013, 8, 3049–3056.Search in Google Scholar
[23] Fett JP, Coleman JR. PlantPhysiology, Am. Soc. Plant Biol. 1994, 106, 103–108.10.1104/pp.106.1.103Search in Google Scholar
[24] Woodrow IE, Murphy D, Latzko E. J. Biol. Chem. 1984, 259, 3791–3795.10.1016/S0021-9258(17)43164-4Search in Google Scholar
[25] Peng W, Cong G, Qu S, Wang Z. Opt. Mater. 2006, 29, 313–317.10.1016/j.optmat.2005.10.003Search in Google Scholar
[26] Jang GG, Jacobs CB, Ivanov IN, Joshi PC, Meyer III HM, Kidder M, Armstrong BL, Datskos PG, Graham DE, Moon JW. Nanotechnology 2015, 26, 325602.10.1088/0957-4484/26/32/325602Search in Google Scholar
[27] Dhas NA, Zaban A, Gedanken A. Chem. Mater. 1999, 11, 806–813.10.1021/cm980670sSearch in Google Scholar
[28] Hazra C, Kundu D, Chaudhari A, Jana T. J. Chem. Technol. Biotechnol. 2013, 88, 1039–1048.10.1002/jctb.3934Search in Google Scholar
[29] Dieckmann Y, Colfen H, Hofmann H, Petri-Fink A. Anal. Chem. 2009, 81, 3889–3895.10.1021/ac900043ySearch in Google Scholar
[30] Lynch I, Dawson KA. Nano Today 2008, 3, 40–47.10.1016/S1748-0132(08)70014-8Search in Google Scholar
[31] Yang JX, Wang SM, Zhao XL, Tian YP, Zhang SY, Jin BK, Hao XP, Xu XY, Tao XT, Jiang MH. J. Cryst. Growth 2008, 310, 4358–4361.10.1016/j.jcrysgro.2008.07.026Search in Google Scholar
[32] Barwal I, Ranjan P, Kateriya S, Yadav SC. J. Nanobiotechnol. 2011, 9, 56.10.1186/1477-3155-9-56Search in Google Scholar PubMed PubMed Central
[33] Heide H, Kalisz HM, Follman H. J. Plant. Physiol. 2004, 161, 198–149.10.1078/0176-1617-01033Search in Google Scholar
[34] Lemaire SD, Guillon B, Le Marechal P, Keryer E, Miginac-Maslow M, Decottignies P. PNAS 2004, 101, 7475–7480.10.1073/pnas.0402221101Search in Google Scholar PubMed PubMed Central
[35] Podila R, Chen R, Ke PC, Brown J, Rao AM. Appl. Phys. Lett. 2012, 101, 263701.10.1063/1.4772509Search in Google Scholar PubMed PubMed Central
©2016 Walter de Gruyter GmbH, Berlin/Boston
This article is distributed under the terms of the Creative Commons Attribution Non-Commercial License, which permits unrestricted non-commercial use, distribution, and reproduction in any medium, provided the original work is properly cited.
Articles in the same Issue
- Frontmatter
- In this issue
- Original articles
- Continuous H2O2 direct synthesis process: an analysis of the process conditions that make the difference
- Aqueous-phase oxidation of 5-hydroxymethylfurfural over Pt/ZrO2 catalysts: exploiting the alkalinity of the reaction medium and catalyst basicity
- An efficient multicomponent, one-pot synthesis of Betti bases catalyzed by cerium (IV) ammonium nitrate (CAN) at ambient temperature
- Valorization of rambutan peel for the synthesis of silver-doped titanium dioxide (Ag/TiO2) nanoparticles
- Facile bio-inspired synthesis of zinc sulfide nanoparticles using Chlamydomonas reinhardtii cell free extract: optimization, characterization and optical properties
- Synthesis of In2O3 nanoparticles via a green and solvent-free method
- Microwave-assisted preparation of almond shell-based activated carbon for methylene blue adsorption
- Adsorption of phthalic acid esters (PAEs) on chemically aged biochars
- Synthesis and characterization of polyamide-imides based on the different chain length of amino acids in molten TBAB as a green media
- A novel process for recovery of rare earth and fluorine from bastnaesite concentrates. Part I: calcification roasting decomposition
- Conference announcements
- 6th International Congress of the Flow Chemistry Society (Miami, FL, USA, November 2–3, 2016)
- Conferences 2016–2017