
Study on Cleaner Production Subsidies, Income Distribution Imbalance and Carbon Emissions Permit Reallocation Mechanism
-
Qingquan Fan
 and
Jingda Wang
and
Jingda Wang

Abstract
The allocation mechanism for carbon emissions permit(CEP) is an institutional guarantee for advancing the development of China’s unified carbon trading market. The initial allocation of carbon quotas fails to solve new inequalities stemming from subsidizing cleaner production. This paper constructs a theoretical framework that describes China’s progressive decline in carbon intensity, calculates the equilibrium solution on the neoclassical saddle point path using the shooting method, and studies the income distribution imbalance caused by cleaner production subsidies and the reallocation mechanism of carbon emissions permit The main conclusion is that the incremental cleaner production subsidy policy meets the goal of maximizing welfare on the saddle point path, but it may lead to over-investment in the clean sector, thus causing the income distribution imbalance among entities. Further research suggests that the amount of carbon emissions permit acquired by the clean sector should be higher than the actual emissions in the trading market and that, as the cleaner support increases, the share of carbon emissions permit acquired by the sector should be constantly increased through reallocation mechanism. This helps achieve the Pareto improvement in all parties’ economic benefits.
1 Introduction
China has actively taken its international responsibility for cutting carbon emissions and fulfilled its goal of strictly controlling greenhouse gas emissions. To this end, the Chinese government has been steadily advancing the development of the national carbon emissions trading market and vigorously supported the development of emerging strategic industries. This range of strategic measures has played an important role in cutting the cost of emission reduction and accelerating the upgrading of clean industries (Li et al., 2017). However, as cleaner production subsidies contribute to upgrading the industrial structure, the income distribution gap across all entities is being widened. The resulting new inequalities have not attracted sufficient attention from the society.
Cleaner production subsidies are a major means of the government to support the development of emerging industries, which helps expedite the accumulation of cleaner capital and promote the fast development of emerging industries. They also help empower the clean sector to increase R&D investment and give full play to the spillover effect of cleaner technology advances. In practice, the “incremental pie” produced by the economic externalities of cleaner production subsidies has not resulted in additional benefits for the sector, or even a lower share of economic benefits for the sector. This is because cleaner production subsidies distort the optimal allocation of various production factors in the sector, reducing the disposable income of entities of the sector. Without altering the economic externalities, the key to re-balancing income distribution among various market players is meant to regulate the distribution mechanism for factor remuneration in the clean sector. Under China’s national carbon trading market mechanism, carbon emissions permit, a new production factor, offers a possibility to improve the clean sector’s disposable income.
The market trading mechanism has solved the efficiency problem of carbon emissions but has still not addressed the compensation for the interests of all entities. Under the carbon trading market mechanism, the cost of carbon emissions bearers and factor remuneration recipients can be separated. The production cost of each enterprise is fixed at the market equilibrium. It does not change with the carbon emissions permit allocation scheme, which provides the possibility for us to further study the ownership of carbon emissions permit. This paper uses trading information and the “government’s hand” to design the reallocation scheme of carbon emissions permit and adjust the remuneration attribution of carbon factors in the initial allocation to achieve the Pareto improvement of all entities’ interests. This is a foundation for stimulating the vitality of carbon emission reduction market entities and providing an institutional guarantee for accelerating the development of the national carbon trading market. Also, it is an important way to deal with new inequalities.
The market-based mechanism for resources allocation determines the actual cost of carbon emissions borne by each entity, while the government’s reallocation scheme determines the carbon factor remuneration eventually obtained by each sector. We have adopted a science-based approach to exploring the dynamic trend of cost of carbon emissions and carbon factor remuneration and had a deeper understanding of the entity difference, and the equal total amount of their attributions are the key link in designing the reallocation mechanism for carbon emissions permit. To this end, we have built a theoretical research framework that is consistent with China’s economic development stage and progressive carbon intensity reduction goal, designed a unified national carbon trading market mechanism, and identified the attribution differences in the cost of carbon emissions and carbon factor remuneration. In addition, we have analyzed the income distribution imbalance caused by cleaner production subsidies, explored the carbon emissions permit reallocation mechanism, and provided science-based solutions for new inequalities in supporting cleaner production.
2 Literature Review
The low-carbon economy is an effective way to control the greenhouse effect, while cleaner production subsidies are an important way to boost the development of the low-carbon economy (Li et al., 2017). Cleaner production subsidies help facilitate technological progress to meet the development goals of reducing energy consumption and low carbonizing the economic structure (Acemoglu et al., 2016; Zhang et al., 2016) and boost the high-quality economic development (Ozcelik and Taymaz, 2008; Fischlein and Smith, 2013; Murray et al., 2014). However, there are few studies on the impact of cleaner production subsidies on income distribution among emission reduction entities. In fact, the subsidies will have an impact on the factor allocation in the production. This paper focuses on explaining the reason for the decrease in entities’ disposable income, which is caused by cleaner production subsidies.
Although there is few foreign literature on the allocation of carbon quotas (Kollenberg and Taschini, 2016), there are many studies on the allocation of carbon quotas in China (Pan and Chen, 2009; Fan et al., 2010; the research group of the Development Research Center of China’s State Council, 2011; Li and Liao, 2015; Peng et al., 2015). Under the government’s administrative emission reduction constraints, the previous literature put the burden of solving inequalities on the initial carbon quota allocation. The optimized allocation scheme results in a compromise between efficiency and equity. This research idea is embodied in the two papers by Qian et al. (2019), Wang and Chen (2019). The key to the above problem is that most of these studies have ignored the importance of the carbon trading market mechanism. Under the national unified carbon trading market mechanism, carbon resource factors can freely flow in the market, equalizing entities’ marginal cost of carbon emissions. The marginal cost is only related to the constraints on the total carbon emissions and entities’ production technology endowment. But it is not linked to the initial allocation scheme. This is the reason why the initial allocation of carbon quotas may not affect economic efficiency. In the meantime, the attribution entities of cost of carbon emissions and factor compensation under the carbon trading market mechanism can be separated so that the means to solve the inequality problem is no longer limited to the initial allocation of carbon emissions permit. This is an important focus of this paper.
Peters (2008), Fan et al. (2010) and Peng et al. (2015) considered the international division of labor and the differences in consumption patterns among countries, pointing out that the division of international emission reduction responsibilities based on the consumption side can embody the international equality principle. In fact, the division of countries’ carbon emissions permit based on the consumption side may increase the transmission of emission reduction constraints, resulting in higher global emission reduction costs. Because of the low feasibility of establishing the reallocation scheme among countries, the division of carbon emissions permit based on the consumption side has become a suboptimal option for global governance. However, in allocating carbon emissions permit within a country, all “heavy tasks” should not be placed on the initial allocation of carbon emissions permit. A government’s “reallocation” function should be fully utilized to avoid sub-optimal solutions that lower the emission reduction efficiency because of due consideration to equality. China’s national carbon trading market mechanism can separate each entity’s actual emissions from the given emissions permit. As such, the permit is liquid as a new production factor. It can be used to identify the relationship between the cost of carbon emissions actually borne by each entity and the factor remuneration for carbon emissions permit, which is rarely covered in previous literature. Based on the resources allocation information from the national carbon trading market, it is another focus of this paper on designing the reallocation scheme of carbon emissions permit with the goal of the synchronous improvement of all entities’ disposable income.
The carbon intensity reduction policy is an effective means for China to assume international emission reduction responsibilities consistent with its development stage (Zhou and Zhou, 2016). Meanwhile, the Chinese economy remains in the growth stage. Driven by the economic expansion, the energy consumption may increase in the short term, which is still far from the steady-state equilibrium of macro theory (Li et al., 2012). According to the neoclassical theory, the saddle point path can be used to depict the dynamic capital accumulation from small to large and analyze the relationship between the economic expansion and the dynamic impact of increased energy consumption. However, there is not much literature to study China’s characteristics of carbon intensity reduction based on the theoretical framework of the neoclassical saddle point path. To this end, this paper uses the shooting method to solve the equilibrium solution on the saddle point path (Ljungqvist and Sargent, 2004), designs the dynamic constraint mechanism for progressive carbon intensity reduction, studies the dynamic optimal path of cleaner production subsidy policy, and analyzes the income distribution imbalance caused by cleaner production subsidies to explore a more effective reallocation mechanism for carbon emissions permit.
3 Theoretical Research Framework for Carbon Trading Mechanism and Cleaner Production Subsidies
3.1 Theoretical Model Construction
3.1.1 Production Functions and the Technology Spillover Mechanism for Cleaner Capital
By referring to the research ideas of Acemoglu et al. (2016) and Dissou and Karnizova (2016), it is assumed that there are representative enterprises in the two sectors. Their production functions are as follows:
For convenience, the two formulas are expressed as h = c and d, representing the clean sector and the polluting sector, respectively. Yh,t denotes the total output level of the sector t in the t period, Kh,t is the capital factor of the sector t, Lh,t represents the labor factor of the sector h, and Mh,t is the production factor of non-energy intermediate goods in the sector h. Eh,t is the production factor of energy intermediate inputs in the sector h. α h , γ h, υh and 1−α h −γ h −υ h represent the output elasticity coefficients of capital, non-energy intermediate inputs, energy intermediate inputs and labor factor, respectively. Ad,t denotes the total factor productivity for the polluting sector and Ac,t represents the total factor productivity for the clean sector. Unlike the polluting sector, the total factor productivity of the clean sector continues to increase with its capital accumulation, namely,
3.1.2 Intermediate Goods Production Factors and Production-Side Carbon Emissions
Mh,t and Eh,t represent the non-energy and energy intermediate production factors of the sector h in the period t, respectively. They are obtained by summing the non-energy and energy intermediate inputs of the two sectors, expressed as follows:
where
It is assumed that the energy intermediate inputs produced by the polluting sector are fossil fuels and the energy intermediate inputs produced by the clean sector are non-fossil fuels. Both sectors consume fossil energy and emit carbon dioxide in the production. Their resulting carbon emissions are calculated as production-side emissions (Peng et al., 2015; Qian et al., 2019). Direct carbon emissions from fossil energy consumption in the h sector are calculated based on the production side:
where θd denotes the carbon emission coefficient per unit of fossil energy inputs produced by the polluting sector.
3.1.3 Carbon Trading Market and Cleaner Production Subsidy Mechanism
Under the carbon trading market mechanism, carbon emissions become a new and mobile factor of production. In enterprises’ production, the product of the actual emissions and the carbon trading price can be regarded as the cost of consuming carbon emissions. It is also the factor remuneration obtained by carbon emissions permit holder. To maintain a balanced government budget, we can use a lump sum tax approach to raising funds. For one thing, we may ensure that there is no exogenous economic resource inflow, making various policy scenarios comparable. For another, we may eliminate the interference of tax distortion effects.
The profit formula of representative enterprises in the two sectors is as follows:
where Πh,t represents the profits of the sector h, Ph,t represents product prices in the sector h, rt represents capital rent, wh,t represents labor wages in the sector h, Qt represents the transaction price per unit of carbon emissions, and κt is the subsidy rate of cleaner production implemented by the government.
The value added of output in the h sector during the t period is:
The society-wide carbon intensity constraint target in the t period is:
where intt represents the carbon intensity value that the government has committed to achieve in the t period.
The first-order conditions for maximizing profits in the two sectors are:
Capital factors:
Labor factors:
Non-energy intermediate input factors:
Energy intermediate input factors:
For the convenience of narration, we use the writing style of κh,t and θs, where κc,t = κt, κd,t = 0, θc= 0.
3.1.4 The Final Product and the Factor Market of Capital and Labor
The final consumer goods (Ct) are obtained by summing the consumer goods (Ch,t) supplied by the two sectors respectively. The alternative elastic relationship between the two types of consumer goods satisfies the following CES function:
where ρc,h indicates the weight of consumer goods supplied by the sector h in the total consumer goods, ρc,c + ρc,d =1. σc denotes the alternative elastic coefficient between consumer goods supplied for the two sectors,σc⩾1. The total price level (Pt) of final consumer goods satisfies:
From the perspective of the demand formed by the final consumer goods, the quantity of consumer goods (Ch,t) supplied by the sector h is:
Similarly, the final investment products (It) are obtained by summing the investment products (Ih,t) provided by the two production sectors, respectively. The alternative elasticity between the two types of investment products also meets the CES function:
where ρi,h represents the weight of investment products provided by the sector h in forming total investment products, ρi,c + ρi,d =1. σi denotes the alternative elasticity between investment products in the two sectors, σi⩾1. The total price level (Zt) of final investment products and the demand quantity of investment products (Ih,t) in the sector h respectively meet:
By referring to the depiction of labor heterogeneity characteristics between the two sectors by Dissou and Karnizova (2016), the relationship between the total effective labor time (Lt) and the sector h’s labor time (Lh,t) is expressed as follows:
where ρl,h represents the weight of the sector h’s labor factors in the total effective labor factors, ρl,c + ρl,d =1. σl denotes the elasticity coefficient of cross-sectoral mobility of labor factors, σi⩾0. Without loss of generality, this paper sets the total effective labor time at 1 (Acemoglu et al., 2012), i.e., Lt = 1. The total effective labor wage level (Wt) meets:
From the perspective of the total effective labor supply, the labor time (Lh,t) provided by the sector h meets:
3.1.5 Problems of Maximizing the Utility of Representative Households and Market Clearance Conditions
Assuming the existence of a representative family with the goal of maximizing the lifelong utility, it is expressed as follows:
where β represents the utility discount factor. The budgetary constraint for representative families is as follows:
where Pt represents the price level of household consumer products in the period t, It represents the total investment amount provided by representative households, Zt represents the total price level of final investment products, and Wt represents the total effective labor wage level provided by representative households. For simplicity, we use the same symbols for labor supply and demand. It should be noted that (EMc,t + EMd,t)Qt represents the factor remuneration for carbon emissions and Tt denotes the total tax levied by the government, which is equal to the amount of cleaner production subsidies. To achieve an equilibrium solution, the price level of consumer goods is set at Pt= 1.
The dynamic accumulation equation for capital is shown in equation (24):
where δ represents the capital depreciation rate. Two types of representative enterprises can rent capital in the same factor market, and the rent price (rt) for capital in both sectors is the same. Kt = Kc,t + Kd,t is thus obtained.
Further solution yields the Euler equation for the intertemporal consumption choices of representative households.
The market clearance conditions are as follows:
3.2 Research on the Reallocation Mechanism for Carbon Emissions Permit
3.2.1 Cost of Carbon Emissions
Equation (8) is the constraint equation for the society-wide carbon intensity target, and Qt is the shadow price of the constraint equation. When the constraint equation is a tight constraint, the shadow price is Qt > 0. Accordingly, the social emission cost under carbon constraints is:
where costt represents the total cost of society-wide emission reduction in the period t.
3.2.2 Factor Remuneration of Carbon Emissions Permit
In the allocation, the factor remuneration for production is ultimately allocated to the holder of carbon emissions permit. For simplicity, we divide the sectors of carbon emissions permit holders into the polluting and clean sectors, assuming that their carbon emissions permits are
In fact, the allocation issue of carbon emissions permit is the core of previous studies and a key link in developing China’s national carbon trading market. This paper will use the resource allocation information of carbon market to design the allocation scheme for carbon emissions permit. One of the new insights in this paper is to use the information of the market-based resources allocation to study the equity of allocating carbon emissions permit among entities from the perspective of reallocation after market transactions. To study the reallocation mechanism of carbon emissions permit, we first give two sectoral indicators for disposable income:
where inch,t represents the disposable income of the sector h in the period t and δKh,t Zt denotes the investment amount in expanding the re-production of the sector h. The total income of each sector is the sum of various factor remunerations and enterprises’ profits, from which the investment amount in expanding the re-production is deducted. The rest is the sector’s disposable income. It is important to note that we use a lump sum tax approach to finance cleaner production subsidies to ensure that no exogenous resources flow into the clean sector.
3.3 Determination of Parameter Calibration and Function Form
3.3.1 Factor Elasticity Coefficients of Production Functions for Both Sectors
Purely cleaner production enterprises may be few in real economic activities or have a small share of the total. More generally, there are two different types of enterprises in the same industry. One “experiments” with new energy and shifts to cleaner production, accompanied by certain advances in cleaner technologies, while the other still uses fossil fuels for production and does not shift to cleaner production. For this reason, the clean and polluting sectors are classified as the same industry. Theoretically, the clean sector refers to same-industry enterprises with a preference for cleaner production, which also tend to have higher level production technologies.
Since the two types of representative enterprises are in the same industry, the elasticity coefficients concerning capital output, labor output and output of intermediate inputs should not differ significantly. Without loss of generality, this paper assumes that the parameters of input factor production elasticity, consumer goods substitution elasticity, investment goods substitution elasticity, labor substitution elasticity, and non-energy inputs elasticity coefficient matrix are taken to be the same for both types of enterprises. The output elasticity of each factor is calibrated using the aggregate table data of the 2017 national input output table. For the two types of enterprises, the elasticity coefficient of non-energy intermediate inputs is calculated to be γ = 0.58 , that of energy intermediate inputs is ν = 0.12, that of labor factors is 1−α −γ −ν = 0.12, and that of capital factors is α = 0.18. For two types of representative enterprises, their final products are homogeneous. Therefore, we assume that, regarding the final consumer products, they have the same substitute elasticity coefficient ρc,d = 0.50 and ρc,c = 0.50; their substitute elasticity of final investment products is ρi,d = 0.50 and ρi,c = 0.50; and their substitute elasticity of labor is ρl,d = 0.50 and ρl,c = 0.50 , respectively. Their main difference is that between the energy inputs elasticity coefficient and the cleaner technology progress function. Next, this paper calibrates the non-fossil energy consumption mix and the actual carbon intensity value.
3.3.2 Elasticity Coefficient of Energy Inputs
In this paper, it is assumed that polluting enterprises only consume fossil energy from their own sectors, namely
where
3.3.3 Initial Capital, Unit Carbon Emissions Coefficient and the Technology Spillover Mechanism for Cleaner Capital
By referring to the research of Wang and Fan (2000), we assumed that the capital output ratio of China in 2000 was about 2.0, so we set the initial capital K1 = 0.40 to maintain the capital output ratio in the initial period of theoretical model is basically consistent with that in 2000. According to the World Bank, China’s carbon emissions from fossil energy consumption in 2005 were about 6.1 billion tons and the carbon emissions intensity was about 3.2 t/10000 yuan. Accordingly, we set the unit carbon emissions coefficient for fossil energy inputs in the polluting sector’s production at θd = 4.80. We also set the technology spillover function for cleaner capital as Ac,t = Ac,1 +
3.3.4 Calibration of Other Parameters
By referring to the practice of Fan (2018), this paper selects the annual depreciation rate of capital as δ = 0.096 and the annual utility discount factor as β = 0.98. In addition, the alternative elasticity parameters of consumer products σc, investment products σi, and labor factors σl in both sectors are valued at 1. Both final consumer and investment products are in the form of Cobb-Douglas production function. In this paper, the ratio of non-energy intermediate inputs to the total non-energy intermediate inputs required in the polluting sector is set at χd,d = 0.65 and χc,d = 0.35 , while that in the clean sector is set at χd,c = 0.35 and χc,c = 0.65. Based on the robustness of simulation results, the sensitivity test is conducted on the main parameters, with the main conclusions not changed.
4 Cleaner Production Subsidies and Income Distribution Imbalance on the Emissions Reduction Pathway
4.1 Progressive Carbon Intensity Reduction Constraints and Cleaner Production Subsidy Policy
This paper sets the initial economic period as 2000 and performs a simulation analysis of China’s trend change of carbon emission intensity since 2000. Based on China’s actual reduction in carbon intensity in 2018 and the 2030 carbon intensity reduction target set by the Chinese government, we, on the saddle point path of economic growth, design a carbon intensity constraint curve [1] that decreases periodically, as shown in Figure 1. The curve is an exogenously set trend line of carbon intensity change. It is the carbon emission reduction constraint target of theoretical equation (8). It simply has a quantitative relationship with time. It is regarded as a “rigid constraint” indicator for evaluating the effect of carbon emission reduction policies. We use this curve as an alternative constraint policy for delineating the carbon intensity reduction path.
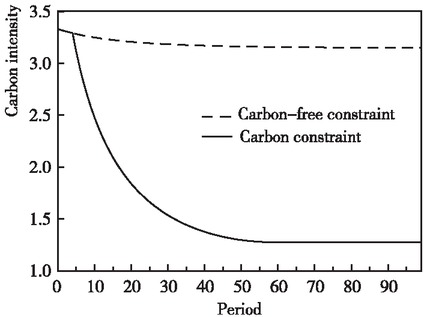
Trend of Carbon Emissions Per Unit of GDP on Saddle Point Path
On the saddle point path of neoclassical growth, clean capital is accumulated from small to large. In the initial stage of economic development, the cleaner capital accumulation is not high. At that time, its technology spillover effect is still small. If the government gives the “optimal subsidy rate in steady state”, there will be the problem of excessive subsidies. It may interfere with the dominant position of the market-based resources allocation and reduce the welfare level on the economic development path. By referring to the ideas of Fan and Zhang (2018) concerning the dynamic policy design on the saddle point path, we design a dynamic curve for subsidy rate. [1] To more intuitively reflect the effectiveness of dynamic subsidy policy, three production subsidy policy scenarios are presented below, namely, dynamic subsidy rate, steady subsidy rate and non-subsidy policy. The steady subsidy rate means the policy of implementing the optimal steady subsidy rate on the saddle point path, as shown in Figure 2.

Cleaner Production Subsidy Policy for Two Scenarios on the Saddle Point Path
4.2 Welfare Effect Analysis of Three Kinds of Cleaner Production Subsidy Policy
Figure 3 shows the impact of three subsidy policies on equilibrium consumption under established carbon constraints. Although the non-implementation of the production subsidy policy can improve the equilibrium consumption in the short term, the equilibrium consumption is the lowest in the steady economic stage. This is because the absence of production subsidy policy will reduce the accumulation of cleaner capital and dampen the technology spillover of cleaner capital, ultimately leading to lower output levels at the steady equilibrium. In addition, the carbon constraint mechanism has led to a decline in the investment at various stages of the saddle point path and a shift to immediate consumption, which is only enhanced in the short term. Due to the longterm shortage of capital accumulation, the equilibrium consumption under this policy scenario is finally the lowest. Compared with the no-subsidy policy, the subsidy policy for cleaner production, although it has reduced the equilibrium consumption to a certain extent in the short term, can ultimately raise the consumption at the steady equilibrium. The dynamic subsidy rate policy takes into account the optimal combination of equilibrium consumption and investment level on the saddle point path. As such, it can not only increase the short-term equilibrium consumption (compared with the steady subsidy rate policy) but also maintain the consumption at the steady equilibrium level. This meets the goal of maximizing the welfare level on the entire saddle point path.
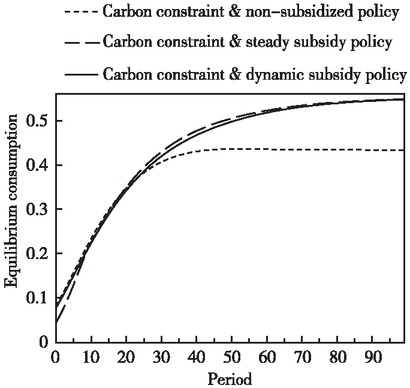
Trends in Equilibrium Consumption Levels on the Saddle Point Path
In this paper, the actual carbon emissions of each entity, after the market transaction, is used as the reallocation baseline scheme. In the scenario without a cleaner production subsidy policy, this scheme meets the efficiency maximization objective and provides a comparative benchmark for studying the new inequity issues raised by cleaner production subsidies. This paper adjusts the difference between the actual carbon emissions of each entity and the initial carbon quota through the reallocation mechanism to ensure that the carbon emissions permit finally obtained by each entity is the actual carbon emissions after the market transaction. To this end, we assume that the actual emission from each sector are used as the baseline scheme for reallocating carbon emissions permit, i.e., EMh,t =
4.3 The Imbalance in Income Distribution Caused by Cleaner Production Subsidies
For simplicity, the economic effects of the steady subsidy rate policy scenario are not analyzed below. Rather, emphasis is placed on comparing the impact of non-subsidy policy with that of dynamic subsidy policy. The trend in disposable income in the two sectors under cleaner production subsidy policy scenarios is shown in Figure 4. It is easy to see that the relative trends in disposable income in the two sectors do not differ under the no-subsidy policy scenario, and that disposable income in the polluting sector is consistently higher than that in the clean sector over the same period. Under the established carbon constraint mechanism, the difference of disposable income between the two sectors is reflected in the remuneration of various factors, which essentially embodies the best allocation of market resources. Under the dynamic subsidy policy scenario, the disposable income in the polluting sector has increased compared with the non-production subsidy policy scenario. However, the disposable income in the clean sector has decreased compared with the non-subsidy policy scenario. This indicates that the technology spillover effect of cleaner capital has not really increased the disposable income in the sector.
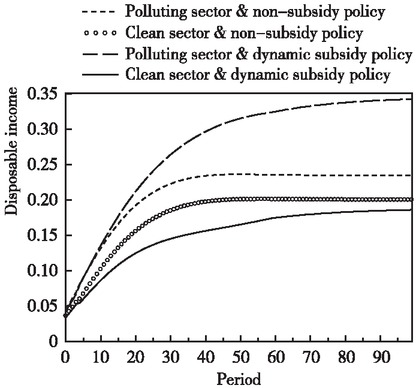
Trends of Disposable Income in the Two Sectors on the Saddle Point Path
5 Study on Production Factors and Reallocation Mechanism of Carbon Emissions Permit
5.1 Carbon Production Factors and Over-Investment in the Clean Sector
Equations (29a) and (29b) in the theoretical analysis part give the composition of factor remuneration of disposable income of each entity. We regard the sum of capital rent, labor remuneration and corporate profits as the traditional factor remuneration obtained by entities across various industries. The allocation of the value of carbon emissions permit based on actual emissions is regarded as the factor remuneration of each entity for obtaining carbon emissions permit.
Figure 5 shows the changes in the remuneration of traditional factors in the two sectors under production subsidy policy. Compared with the no-subsidy policy, cleaner production subsidies have raised the remuneration for the traditional factors of the two sectors on the saddle point path. As production subsidies enhance the technology spillover effect of cleaner capital, expand the output in the cleaner production sector, and increase the market supply of investment products and non-energy intermediate inputs on the saddle point path, the marginal remuneration of labor factors continues to increase, and so does the remuneration of capital and labor factors in the two sectors. Figure 6 indicates the trend in the factor remuneration of carbon production in the two sectors under subsidy policy. Cleaner production subsidies have likewise increased the remuneration of carbon factors in both sectors on the saddle point path, compared with non-subsidy policy. As a result of higher levels of cleaner technology advances, higher output under established carbon intensity constraints has resulted in more carbon quotas (the amount of which is equal to actual carbon emissions from economic activities) for each sector, which in turn has increased the remuneration of carbon production factors. The sum of traditional factor remuneration and carbon production factor remuneration constitutes the total income obtained by entities of various industries on the saddle point path.
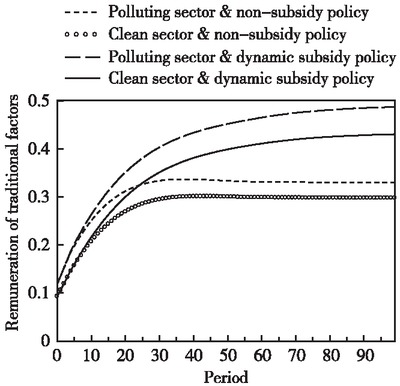
Changes in Remuneration of Traditional Factors in the Two Sectors on the Saddle Point Path
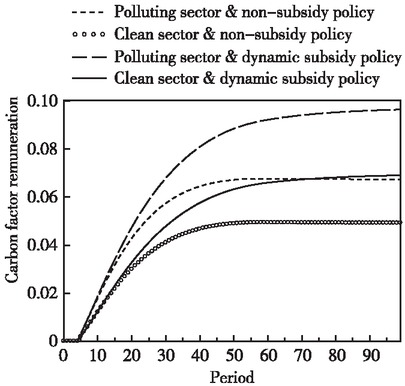
Changs in Remuneration of Carbon Factors in the Two Sectors on the Saddle Point Path
Figure 7 shows the trend of the total income in both sectors on the saddle point path under subsidy policy. It is notable that cleaner production subsidies have increased the total income of both sectors on the saddle point path compared with the no-subsidy policy. There are two directions for the total income of each sector, namely, the purchase of investment products for expansion and reproduction and the purchase of final consumer products based on disposable income (the total income minus expenditures on investment products). Thus, in addition to the total income indicator, the investment of both sectors is an important factor influencing disposable income. Figure 8 indicates the trend of investment in both sectors on the saddle point path under subsidy policy. Cleaner production subsidies have also increased investment in both sectors on the saddle point path compared with the non-subsidy policy. It is noteworthy that investment in the clean sector has grown significantly faster than that in the polluting sector.

Changes in the Total Income Level of the Two Sectors on the Saddle Point Path
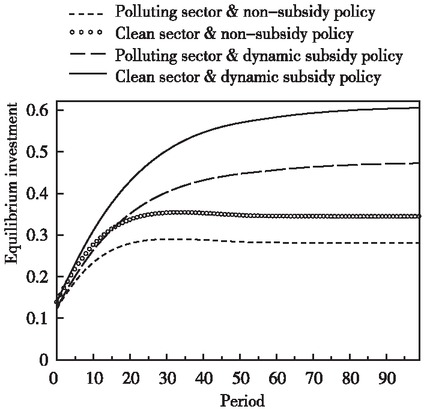
Changes in the Equilibrium Investment of the Two Sectors on the Saddle Point Path
Although the expanded investment behavior can increase the overall equilibrium consumption on the society-wide saddle point path (see Figure 3), the behavior decreases the disposable income of the clean sector (see Figure 4). For the clean sector, such an over-investment has a negative impact on the purchasing power of consumer goods in the sector. How to reverse the negative impact of cleaner production subsidies on the sector’s disposable income is the key to maintaining the enthusiasm of market entities for carbon reduction activities in the long term.
5.2 Improvements in Carbon Emissions Permit Reallocation Mechanism and Income Distribution Pattern
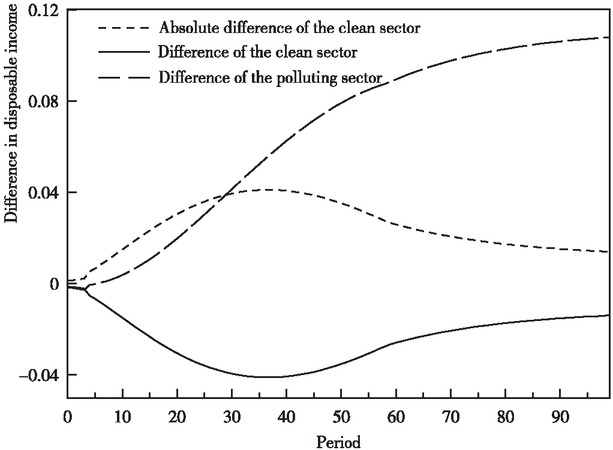
It can be seen from Figure 4 that the impact of the subsidy policy for cleaner production on the disposable income of the two sectors on the saddle point path is significantly different. In Figure 9, we calculate the changes in the disposable income of the two sectors compared with the non-subsidy policy scenario. The difference in the disposable income of the clean sector has always been negative. It has widened rapidly and remains large over the long term. The difference in the disposable income of the polluting sector has only been negative in the initial period, and then rapidly reverses from negative to positive. The difference continues to widen over time. Such efforts facilitate a comparison of the differences in the disposable income of the two sectors.
Changes in Disposable Income of the two sectors under Subsidy Scenario in Comparison to Non-Subsidy Policy Scenario
In the following, the absolute value of the difference is expressed as the decrease in the disposable income of the clean sector, while the corresponding difference in the polluting sector is expressed as the increase in its disposable income. The decrease in the disposable income of the clean sector was greater than the increase in the polluting sector in the initial period (2005–2030), while the former in the long term was less than the latter. The society-wide disposable income declined during the initial period, as production subsidies increased the investment in the clean sector. At this time when technology spillovers remained low, this may lead to a short-term drop in the disposable income. Of course, this is the optimal choice for smoothing the equilibrium consumption in various periods of economic growth and pursuing the goal of maximizing welfare on the entire saddle point path. Compared with the non-subsidy policy, we need to narrow the disposable income gap of entities in the two sectors through the carbon emissions permit reallocation mechanism without reducing their disposable income, so as to realize the Pareto improvement of all parties’ interests.
Under the carbon constraint mechanism, the carbon emissions permit for the two sectors can be seen as the ownership of their respective remuneration for carbon production factors. The greater the allocation of carbon emissions permit in a sector, the more the remuneration for its carbon production factors. This can correspondingly increase disposable income for purchasing more final consumer goods. In the baseline scenario for reallocating carbon emissions permit, we allocate the permit in terms of actual emissions from each sector. Under the cleaner production subsidy policy scenario, the disposable income of the cleaner sector has instead declined. We have increased the sector’s disposable income by increasing its share of carbon emissions permit. To achieve a simultaneous improvement in the interests of all parties, we transfer the increase in disposable income from the polluting sector to the clean sector by increasing the share of carbon emissions permit (which is equal to the income increase of the polluting sector divided by the trading price of carbon emissions permit) in the initial period when the decrease in disposable income of the clean sector is greater than the increase in the polluting sector. The disposable income in the clean sector can be increased without reducing the disposable income in the polluting sector (as opposed to the non-subsidy policy scenario). At a time when the reduction in disposable income of the clean sector is less than the increase in the polluting sector, we have two options for shifting the share of carbon emissions permit, one based on the increase in the polluting sector divided by the carbon trading price and the other based on the reduction in the clean sector divided by the carbon trading price. The incremental share of carbon emissions permit in the clean sector can increase its disposable income (compared with the non-subsidy policy scenario).
From the perspective of the clean sector, the upper boundary of the transfer of carbon emissions permit refers to the maximum transfer obtained by the clean sector while maintaining the same disposable income obtained by the polluting sector (i.e., the income level remains the same before and after the implementation of the subsidy policy). In other words, we convert all the increments of the polluting sector’s disposable income into carbon emissions permit and transfer them to the clean sector. The upper boundary of the transfer of carbon emissions permit in the clean sector (the maximum transfer-in amount) also corresponds to the bottom boundary of carbon emissions permit being transferred out of the polluting sector (the maximum transfer-out amount). The bottom boundary of the transfer of carbon emissions permit in the clean sector refers to the minimum transfer-in amount obtained by the clean sector to cut the reduction in the clean sector’s disposable income before and after the implementation of subsidy policy. Similarly, we translate the loss of disposable income in the clean sector into carbon emissions permit and treat it as a transfer out of the polluting sector (i.e., the minimum transfer-out amount). The bottom boundary (the minimum transfer-in amount) of carbon emissions permit transferred into the clean sector also corresponds to the upper boundary of carbon emissions permit transferred out of the polluting sector.
Figures 10 and 11 show the feasible range of allocating carbon emissions permit to the two sectors under the cleaner production subsidy policy scenario, respectively. In the cleaner sector, for example, we maintained the allocation of actual emissions in both sectors from 2000 to 2006 due to a certain decline in their disposable income. Between 2007 and 2029, we need to continuously increase the carbon emissions permit in the clean sector to reduce the decline in its disposable income. Considering that the disposable income in the polluting sector cannot be reduced, the reduction in disposable income in the clean sector during this period cannot be fully compensated. After 2030, the carbon emissions permit obtained by the clean sector are within the feasible range of two curves. The disposable income in both sectors can be increased simultaneously to achieve the Pareto improvement in all parties’ interests. It is noteworthy that since the decrease in the disposable income of the clean sector is greater than the increase in the polluting sector by 2030, we will have converted all increases in the polluting sector into carbon emissions permit, which will be transferred into the clean sector. The reallocation scheme during this period means a transfer-in (transfer-out) of carbon emissions permit to maximize efforts to reduce revenue losses in the clean sector. The share of carbon emissions permit obtained by the polluting sector can even be zero after 2065. With the full use of the technology spillover effect of cleaner capital accumulation and the continuous addition of carbon intensity reduction targets, the polluting sector should acquire a smaller share of carbon emissions permit under the premise of the continuous improvement in its disposable income.
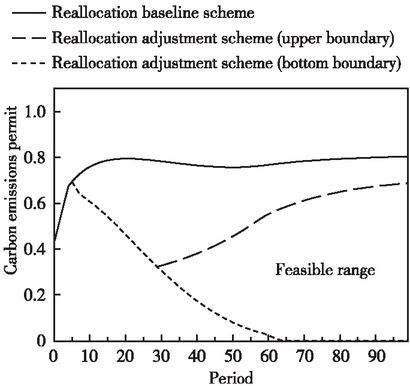
Feasible Range of Transfer of Carbon Emissions Permit in the Polluting Sector on the Saddle Point Path
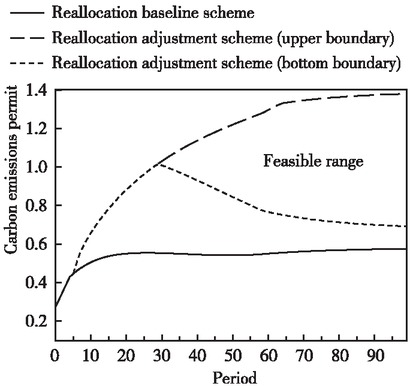
Feasible Range of Transfer of Carbon Emissions Permit in the Clean Sector on the Saddle Point Path
6 Conclusion and Policy Insight
Cleaner production subsidies affect the allocation of factors in the market mechanism, so that the cleaner sector does not share in the incremental “pie”. The income distribution gap between various entities is growing, resulting in new inequities. With the steady progress of the national carbon trading market, carbon emissions permit has become a new and mobile factor of production, offering the possibility to address this inequity. To this end, this paper constructs a theoretical framework that conforms to China’s economic development stage and progressive carbon emission reduction goals on the saddle point path of neoclassical theory, designs a unified national carbon trading market mechanism, and depicts the technology spillover effect of cleaner capital. On this basis, this paper further analyzes the income distribution imbalance caused by cleaner production subsidies and designs the carbon emissions permit reallocation scheme to achieve the Pareto improvement in all parties’ interests.
In this paper, it is found that the incremental cleaner production subsidy policy take into account the optimal combination of consumption and investment to achieve the goal of maximizing the welfare on the saddle point path. While a dynamic policy for cleaner production subsidies is the best option on the saddle point path, it can lead to over-investment in the clean sector and reduce its disposable income. Carbon emissions permit obtained by entities under the carbon trading market mechanism can be separated from the actual carbon emissions. According to the difference in each party’s disposable income, this paper designs a reallocation scheme for carbon emissions permit. Under the premise of meeting the market emission reduction goal, it can, to a large extent, handle new inequities caused by cleaner production subsidies.
According to further studies, as the support for cleaner production increases, the share of carbon emissions permit acquired by cleaner production entities should be gradually increased to mitigate the decline in the sector’s disposable income. In the reallocation scheme for carbon emissions permit, the amount of carbon emissions permit acquired by the clean sector is greater than its actual emissions, while the corresponding amount of carbon emissions permit acquired by the polluting sector is less than its actual emissions. The difference between their acquired amounts and actual emissions should continue to expand.
In the context of the global strategy for temperature control target, China’s carbon emissions space will be narrowed at an accelerated pace. So, it should expedite the development of a national unified carbon trading market, continuously improve the support for cleaner production, and speed up the transformation of energy mix. It is essential to adhere to the principle of “pursuing efficiency before equity” in carbon quota allocation and give full play to the government’s reallocation function. To ease the pressure on the initial allocation of carbon emissions permit, the government should implement the responsibility of carbon quota allocation in the reallocation and improve the equity and accuracy of the allocation scheme. According to the market resource allocation information, the actual emissions in the production of each entity should be taken as a yardstick. The amount of carbon emissions permit of cleaner production enterprises should be continuously increased to simultaneously improve the interests of all parties.
Funding statement: The authors express their gratitude to the Youth Program of National Natural Science Foundation of China (71904131), the 2019 Youth Talent Program for Publicity, Thought and Culture by the Publicity Department of the CPC Central Committee, and the basic research expenses of Beijing municipal universities for the Capital University of Economics and Business for their funds. Their thanks also go to the anonymous reviewers for their constructive comments. The authors take full responsibility for the views expressed herein.
References
Acemoglu, D., Aghion, P., Bursztyn, L., & Hemous, D. (2012). The Environment and Directed Technical Change. American Economic Review 102(1), 131–166.10.1257/aer.102.1.131Search in Google Scholar
Acemoglu, D., Akcigit, U., Hanley, D., & Kerr, W. (2016). Transition to Clean Technology. Journal of Political Economy 124 (1), 52–103.10.1086/684511Search in Google Scholar
Dissou, Y., & Karnizova, L. (2016). Emissions Cap or Emissions Tax? A Multi-Sector Business Cycle Analysis. Journal of Environmental Economics and Management 79, 169–188.10.1016/j.jeem.2016.05.002Search in Google Scholar
Fan, G., Su, M., & Cao, J. (2010). An Economic Analysis of Consumption and Carbon Emission Responsibility. Economic Research Journal (Jingji Yanjiu) 1, 4–14.Search in Google Scholar
Fan, Q., & Zhang, T. (2018). A Study of Environmental Regulations and Pollution Abatement Mechanism on China’s Economic Growth Path. World Economy (Shijie Jingji) 8, 171–192.Search in Google Scholar
Fan, Q. (2018). Environmental Regulation, Income Distribution Imbalance and Government Compensation Mechanisms. Economic Research Journal (Jingji Yanjiu) 5, 14–27.Search in Google Scholar
Fischlein, M., & Smith, T. (2013). Revisiting Renewable Portfolio Standard Effectiveness: Policy Design and Outcome Specification Matter. Policy Sciences 46(3), 277–310.10.1007/s11077-013-9175-0Search in Google Scholar
Kollenberg, S., & Taschini, L. (2016). Emissions Trading Systems with Cap Adjustments. Journal of Environmental Economics & Management 80, 20–36.10.1016/j.jeem.2016.09.003Search in Google Scholar
Li, D., Xu, X., & Jiang, H. (2012). A Welfare Economics Analysis of China’s Economic Growth. Economic Research Journal (Jingji Yanjiu) 9, 46–56.Search in Google Scholar
Li, G., & Liao, J. (2015). A Scheme for Allocating Carbon Emissions Permit on the Basis of Carbon Capital Stocks. Social Sciences in China (Zhongguo Shehui Kexue) 7, 66–81.Search in Google Scholar
Li, Y., Zhu, S., Luo, L., & Yang, D. (2017). Theoretical Exploration of Low-Carbon Development as a Macroeconomic Objective Based on China’s Situation. Management World (Guanli Shijie) 6, 1–8.Search in Google Scholar
Ljungqvist, L., & Sargent, T. (2004). Recursive Macroeconomic Theory. Cambridge, Mass.: MIT Press, 310–312.Search in Google Scholar
Murray, B., Cropper, M., Francisco, C., & Reilly, J. (2014). How Effective are US Renewable Energy Subsidies in Cutting Greenhouse Gases? The American Economic Review 104(5), 569–574.10.1257/aer.104.5.569Search in Google Scholar
Ozcelik, E., & Taymaz, E. (2008). R&D Support Programs in Developing Countries: The Turkish Experience. Research Policy 37(2), 258–275.10.1016/j.respol.2007.11.001Search in Google Scholar
Pan, J., & Chen, Y. (2009). Carbon Budget Proposal: A Framework for an Equitable and Sustainable International Climate Regime. Social Sciences in China (Zhongguo Shehui Kexue) 5, 83–98.Search in Google Scholar
Peng, S., Zhang, W., & Sun, C. (2015). China’s Production-Based and Consumption-Based Carbon Emissions and Their Determinants. Economic Research Journal (Jingji Yanjiu) 1, 168–182.Search in Google Scholar
Peters, G. (2008). From Production-Based to Consumption-Based National Emission Inventories. Ecological Economics 65(1), 13–23.10.1016/j.ecolecon.2007.10.014Search in Google Scholar
Qian, H., Wu, L., & Ren, F. (2019). From “Spurring a Willing Horse” to Efficiency Driven: A Study of China’s Regional CO2 Emissions Permit Allocation. Economic Research Journal (Jingji Yanjiu) 3, 86–102.Search in Google Scholar
Research Group of the Development Research Center of China’s State Council. (2011). Domestic Greenhouse Gas Emission Reduction: Basic Framework Design. Management World (Guanli Shijie) 10, 1–9.Search in Google Scholar
Romer, P. (1990). Endogenous Technological Change. Journal of Political Economy 98(5), 71–102.10.1086/261725Search in Google Scholar
Wang, W., & Chen, Z. (2019). Research on the Initial Carbon Quota Allocation Scheme in China’s Provincial Regions: Based on the Perspective of Responsibilities & Objectives and Equity & Efficiency. Management World (Guanli Shijie) 3, 81–98.Search in Google Scholar
Wang, X., & Fan, G. (2000). Sustainability of China’s Economic Growth: Cross-Century Review and Prospects. Beijing: Economic Science Press.(in chinese)Search in Google Scholar
Zhang, W., Zhu, Q., & Gao, H. (2016). Upgrading of Industrial Structure, Optimizing of Energy Structure, and Low Carbon Development of Industrial System. Economic Research Journal (Jingji Yanjiu) 12, 62–75.Search in Google Scholar
Zhou, X., & Fan, Q. (2016). Mechanism of Carbon Intensity Reduction and Optimization Design of Its Industrial Allocation. World Economy (Shijie Jingji) 7, 168–192.Search in Google Scholar
© 2022 Qingquan Fan, Jingran Liu, Jingda Wang, published by De Gruyter
This work is licensed under the Creative Commons Attribution 4.0 International License.
Articles in the same Issue
- frontmatter
- China’s High-Quality Economic Growth in the Process of Carbon Neutrality
- Coordination of Income Distribution System and Promotion of Common Prosperity Path
- Financial Pressure, Energy Consumption and Carbon Emissions: A Quasi-Natural Experiment Based on the Educational Authority Reform
- Study on Cleaner Production Subsidies, Income Distribution Imbalance and Carbon Emissions Permit Reallocation Mechanism
- Emission Reduction Investment, Technology Choice and Business Environmental Performance: Evidence from China’s Foreign Investment Liberalization Reform
- Fintech, Macroprudential Supervision and Systematic Risk in China’s Banks