
MSVM Recognition Model for Dynamic Process Abnormal Pattern Based on Multi-Kernel Functions
-
Yumin Liu
 and
Haofei Zhou
and
Haofei Zhou

Abstract
Recognition of quality abnormal patterns for a dynamic process has seen increasing demands nowadays in the real-time process fault detection and diagnosis. As the dynamic data from a quality abnormal process is linearly inseparable, the recognition efficiency of a support vector machine (SVM) model mainly depends on the selection of the kernel functions and the optimizing of their parameters. Based on the analysis of the quality abnormal patterns in a dynamic process, this paper presents a recognition framework of quality abnormal patterns by using a multi-SVM (MSVM). For the different quality abnormal patterns, the simulation results indicate that the recognition accuracies of the MSVM classifiers with the selected kernel functions are quite different. A MSVM recognition model for quality abnormal patterns in a dynamic process is proposed by the kernel functions being of high accuracies. It is shown that this MSVM model with suitable kernel functions can increase the recognition accuracy.
1 Introduction
How to recognize the quality abnormal patterns in a dynamic process is essential for the real-time process monitoring and fault diagnosis. With the modern industries and service organizations developed for more large-scale, complex and continual fields, the monitoring and diagnosis for the dynamic process has attracted many scholars’ attention and now it becomes a research hotspot in quality control[1-3]. For a large number of dynamic data from the automatic manufacturing or continual production process, the key problem of quality control is how to monitor and diagnose their fluctuation tendency effectively.
A support vector machine (SVM) performs classification tasks of various quality abnormal data by constructing optimal separating hyperplanes[4], which can be widely used to solve the small sample, nonlinear and high dimensional pattern recognition problem in the manufacturing processes effectively[5]. There are various kinds of fluctuation tendencies for dynamic data, such as trend, shift, and cyclic pattern, which recognition is typical of multi-class classification. However, a SVM only deals with two-class classification problems. A MSVM model should be developed for multi-class classification to identify the dynamic process fluctuation. Nowadays, MSVM is gaining application in the area of control chart pattern recognition and fault diagnosis in industrial processes[6-7]. Selecting the suitable MSVM’s kernel functions is an essential issue for identifying the process fluctuation effectively. Jiang established a MSVM model based on four SVM classifiers with Gaussian kernel functions to diagnose the fault of blast furnace[8]. Vahid presented a MSVM model using the “one-against-all” method to recognize the six quality patterns[9]. Wu introduced a MSVM model with four SVM classifiers to recognize trend, shift, cyclic and their mixed patterns[10]. Xiao proposed a least square MSVM model to recognize three different shift patterns in the TE process[11]. As mentioned above, the reported researches on MSVM models are limited to some special industrial processes. Most of them used one kind of kernel function to diagnose different quality abnormal patterns, which MSVM recognition models are not very effective and efficient for complicated dynamic processes. Dynamic data being of nonlinear, non-normal and multi-interval’s features, there should be large difference among the fluctuation tendencies of quality abnormal patterns. Therefore, it is very important that the different kernel functions in a MSVM recognition model should be selected and their parameters should be optimized for the different quality abnormal patterns in a dynamic process.
Based on the analysis of the quality abnormal patterns in a dynamic process, this paper presents a recognition framework of quality abnormal patterns by using a MSVM. Under this recognition framework, the recognition accuracies of three kinds of kernel functions are compared for the six quality patterns by a simulation experiment, which indicates that the recognition accuracies of the MSVM classifiers with the different kernel functions are different. A MSVM quality abnormal pattern recognition model for a dynamic process is proposed by the kernel functions being of high accuracies. It is shown that this MSVM model with suitable kernel functions can increase the recognition accuracy.
2 MSVM recognition framework for quality abnormal pattern
In this section, in order to set up a MSVM framework for the recognition of dynamic process fluctuation, the six quality patterns should be introduced, which includes a quality normal pattern and five quality abnormal patterns. A MSVM recognition framework will be proposed and the kernel functions in multi-SVM will be selected by means of the principle of SVM.
2.1 Quality abnormal pattern
With the modern industries and service organizations developed, there exist a large number of dynamic data from the automatic manufacturing or continual production process. These data describes the status of quality in a current operating or processing. The study of quality abnormal pattern recognition for dynamic process is almost specific to diagnose several particular industrial processes and recognize control chart abnormal patterns[7-8]. It is believed that the dynamic process fluctuation involves normal and abnormal changes[12]. The normal changes illustrate the process running in its intended mode, while the abnormal changes will lead to the various quality problems of dynamic process. Both of them are called quality patterns, which can exhibit six common types of pattern: normal (NR), cycle (CC), increasing trend (IT), decreasing trend (DT), upward shift (US), and downward shift (DS), as shown in Fig.1.
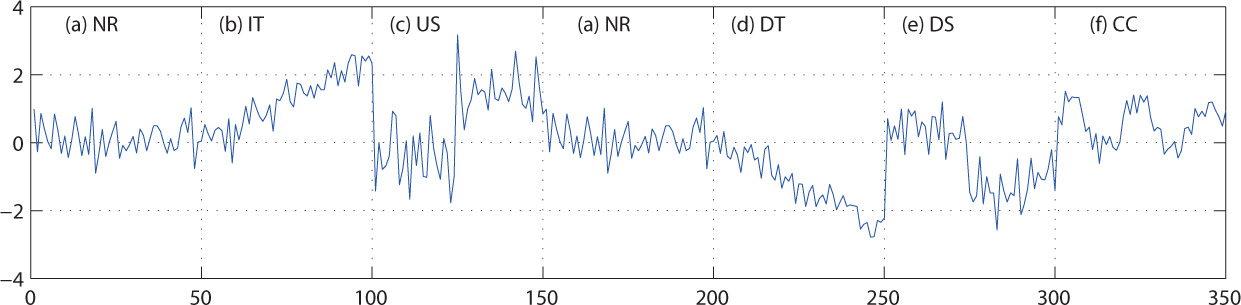
Quality abnormal patterns
When the dynamic data fluctuates around the target value at random, the current process is under a quality normal pattern, which is shown as Figure 1(a). When the dynamic data appear a trend, shift or cycle, the process fault or product quality problem will be occurred, which can be called quality abnormal patterns. The trend includes two types of pattern, such as increasing trend and decreasing trend seen in Fig.1(b) and (d) respectively. The shift pattern contains upward shift shown as Fig.1(c) and downward shift shown as Fig.1(e). Therefore, in order to detect and diagnose the quality problems in productive process, it is necessary to recognize effectively the quality abnormal patterns of dynamic data.
2.2 MSVM recognition framework
A SVM performs two-class classification tasks by constructing optimal separating hyper planes. For six quality patterns, multi-SVM should be introduced to solve the multi-class classification problems. There are two widely used methods to extend binary SVM to multi-class classification. One is called the “one-against-all” method, and another is called “one-against-one” method[13]. Both of them will be used in the following recognition framework so as to achieve the high efficiency.
In order to recognize quality abnormal patterns effectively, a recognition framework based on MSVM will be set up. First, by means of the “one-against-all” method, a SVM4 classifier for normal pattern and SVM1, SVM2, SVM3 classifiers for the trend, shift and cycle three quality abnormal patterns are proposed respectively. Then, the SVM5 and SVM6 classifiers are established respectively to further recognize the increasing trend, decreasing trend, and upward shift, downward shift with “one-against-one” method. A MSVM framework for the recognition of quality abnormal patterns is shown as Figure 2. According to above framework, three steps will be done for the recognition of quality abnormal patterns of dynamic data as the following:
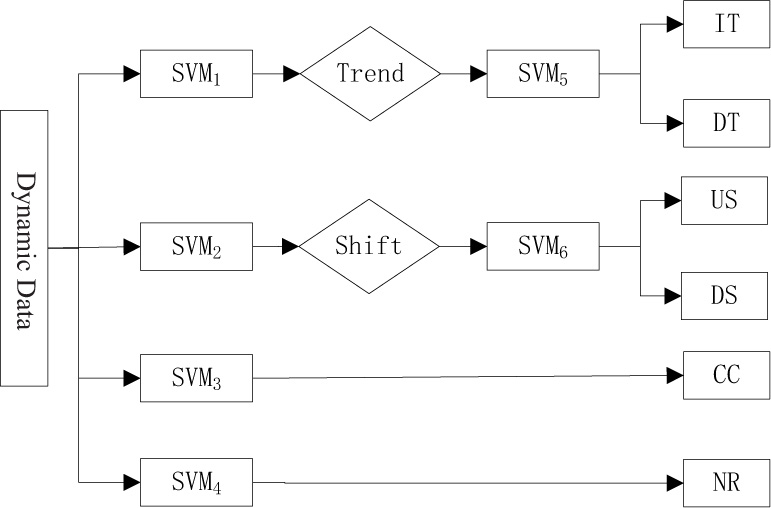
MSVM recognition framework
SVM1, SVM2, SVM3 and SVM4 classifiers are set up respectively to identify the trend, shift, cycle three abnormal patterns and a normal pattern of dynamic data.
After the SVM1 classifier identifies current data as the trend abnormal pattern, a SVM5 classifier will be applied to further distinguish the increasing trend and decreasing trend of dynamic data.
Similarly, a SVM6 classifier will be used to further distinguish the upward shift and downward shift of dynamic data after the SVM2 classifier identifies current data as the shift abnormal pattern.
2.3 Kernel function selection of MSVM
The principle of SVM performs classification tasks by constructing optimal separating hyperplane. In the linearly separable condition, suppose that (xi, yi), i = 1,2,··· , n, x ∈ Rd, is a training sample set of dynamic data, where yi ∈ (1, –1) represented the category of a training sample. The purpose of learning and training for dynamic data sample is to find an optimal hyperplane which can classify the two types of abnormal patterns correctly. Thus, constructing this hyperplane can be represented the following optimization problem:
The above optimal hyperplane problem can be transformed to its dual problem by uses of Lagrnage multipliers. The optimal decision function is given by
where the
where ζi is a slack variable, ζi > 0, and c is a penalty parameter. The greater c is, the heavier punishment for misclassification will be. The classify function of SVM can be obtained by adding the kernel function k(xi, x):
According to the above analysis, it should be chosen different kernel functions for different SVM classifiers. The recognition efficiency of a SVM model mainly depends on the selection of the kernel functions. It is essential to select a suitable kernel function for improving the recognition accuracy of a SVM classifier. Under the above MSVM recognition framework, it is crucial to select the kernel functions of MSVM so as to improve the recognition accuracy of quality abnormal patterns in a dynamic process. At present, the general requirements for selecting the kernel functions have not seen. Usually, the kernel functions should be chosen by the experience and simulation experiments[14]. There are three common kernel functions of SVM as shown as Table 1[15].
Common kernel functions
| Name | Expression |
|---|---|
| Linear | K(x,xi) = (xTxi) |
| Polynomial | K(x, xi) = (1 + xTxi)q,q = 1,2,··· , n |
| RBF | K(x,xi) = exp [ – (x – xi)/2σ2] |
As the sample data from quality abnormal patterns in a dynamic process are linearly inseparable and their fluctuations are different, in order to choose some suitable kernel functions for constructing the MSVM recognition model, in this paper, the recognition efficiency of the above three different kernel functions for different quality patterns are compared by the following simulation experiment.
3 Simulation experiment for recognition accuracies of MSVM
In this section, in order to simulate the dynamic process fluctuations, the sample data of quality abnormal patterns are generated by Monte-Carlo method. The recognition accuracies of the MSVM classifiers with different kernel functions are compared, so that it can produce enough evidences in support of constructing MSVM recognition model of quality abnormal pattern.
3.1 Generation of experiment data
The sample data of simulating dynamic process fluctuations, x(t), are generated by Monte-Carlo method, as shown as the formula (5):
where μ represents the target value of a dynamic process. To simplify the simulation data, suppose μ is zero. r(t) denotes the variations of random factors in a dynamic process, r(t) ∼ N(0,1), which represents the white noises in our experiment, and d(t) shows the abnormal fluctuations. When x(t) = r(t), the simulation data represents the quality normal pattern in a dynamic process. The five quality abnormal patterns including increasing trend, decreasing trend, upward shift, downward shift and cycle can be simulated by the formula (6) ∼ (10). (1) A increasing trend pattern can be simulated by:
(2) A decreasing trend pattern can be denoted by:
where k is the gradient of increasing or decreasing trend, and it’s values are taken from 0.2 to 0.5.
(3) The simulation data of an upward shift pattern are given by:
(4) A downward shift pattern can be described by:
where b is the position of an upward or a downward shift, b = (t – t0), and t0 denotes the time of an upward or a downward shift. Before the shift, b = 0, and after the shift, b = 1. s is the altitude of a shift, which is supposed in the range of 0.8 ∼ 2.
(5) The sample data of cycle pattern can be obtained by:
where T is a cycle period, and suppose it is in the range of 15 ∼ 30. A is a cycle amplitude, which is taken from 0.8 to 2.
By uses of the above formulas, the sample data of a normal pattern and five quality abnormal patterns in a dynamic process at time t, x(t), are generated respectively, which is supposed in the range of 0 ∼ 59. 60 groups of the data for each quality pattern are sampled to compare the recognition accuracies of MSVM with different kernel function. The former 20 groups are taken as training samples, and the other 40 groups as testing samples.
3.2 Analysis of experiment result
In order to compare the recognition accuracies of multi-SVM with different kernel functions in the MSVM framework, the value of a penalty factor should be set. The parameter c is known as the penalty factor of a SVM identifier. In the paper, the value of c is taken as 1.2 for the simulation experiment of SVM with linear and poly kernel functions by means of the Cherkassky’s empirical formula (11). For the SVM with RBF kernel function, the grid search method can be introduced to optimize its parameters.
where x̅ and σx are the mean and standard deviation of the training samples from a dynamic process respectively.
Based on the sample data generated by above Monte Carlo method, the recognition accuracies of SVM identifiers with linear, polynomial and RBF functions are tested by the simulation experiment. For the 60 groups of the data sampled by six quality patterns respectively, 20 groups of data will be merged into 120 groups as the training samples of SVM1, SVM2, SVM3 and SVM4, while 40 groups of the data can be combined as the 240 groups of testing samples of them. Each 20 groups of data from the increasing trend and decreasing trend pattern will be merged into 40 groups as the training samples of SVM5. So do 80 groups as testing samples of SVM5. Similarly, the training and testing samples of SVM6 for shift pattern can be obtained respectively. The recognition accuracies (RA) of six SVMs with different kernel functions are compared by the simulation experiment, as shown as Table 2.
Recognition accuracies of SVM with different kernel functions
| Kernel function | RA% | Parameters and recognition accuracies | |||||
|---|---|---|---|---|---|---|---|
| SVM1 | SVM2 | SVM3 | SVM4 | SVM5 | SVM6 | ||
| Linear | 85.21 | c= 1.2 | |||||
| 64.58% | 66.67% | 96.25% | 83.75% | 100% | 100% | ||
| c= 1.2 | |||||||
| Polynomial | 95.83 | q=2 | q=2 | q=2 | q=2 | q=3 | q=3 |
| 92.08% | 97.92% | 98.33% | 86.67% | 100% | 100% | ||
| c = 1.74 | c = 3.03 | c = 0.189 | c = 3.03 | c = 0.004 | c = 0.004 | ||
| RBF | 98.4 | g = 0.02 | g = 0.02 | g = 0.012 | g = 0.02 | g = 0.004 | g = 0.004 |
| 98.33% | 97.92% | 100% | 94.17% | 100% | 100% | ||
The experiment results indicate that the recognition accuracies of the MSVM classifiers with the different kernel functions are quite different. The RBF function has the higher accuracies for all the quality abnormal patterns than the others, which the average of RA has reached to 98.4%. The recognition accuracies of SVM5 and SVM6 with linear and polynomial functions for trend and shift patterns have achieved the highest accuracies 100%.
4 Recognition model based on multi-kernel functions
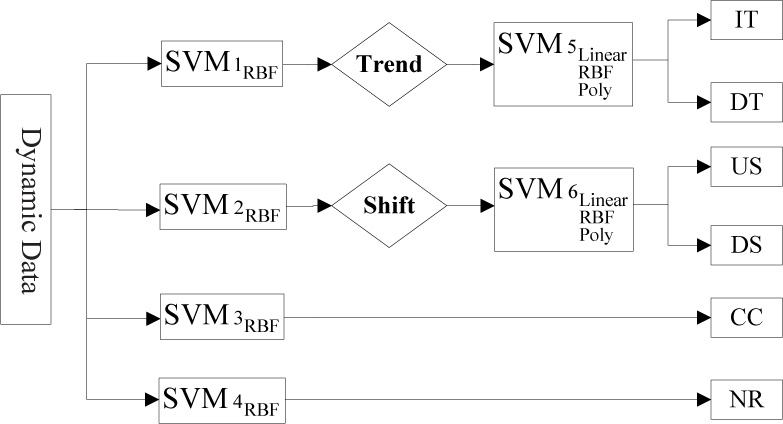
The recognition accuracy of quality abnormal patterns in a dynamic process is essential for efficient model monitoring to maintain high-quality products. Because the recognition for quality abnormal patterns is a multi-class problem, a MSVM recognition model should be established no matter the “one-against-all” or “one-against-one” method are adopted. The recognition efficiency of a MSVM model mainly depends on the selection of the kernel functions and the optimizing their parameters. According to the experiment results, the kernel function being of high accuracy should be selected to increase the recognition accuracy. A MSVM recognition model for quality abnormal patterns in a dynamic process is proposed by the kernel functions being of high accuracies, such as RBF function should be selected for SV M1, SV M2, SV M3 and SV M4 classifiers, and linear, polynomial and RBF functions are all suitable to SV M5 and SV M6. The MSVM models with suitable kernel functions are shown as Table 3.
According to the selection of kernel functions for MSVM classifiers in the Table 3, the MSVM recognition model for quality abnormal patterns in a dynamic process is proposed, as shown as Figure 3.
Selection of kernel function for MSVM
| Classifiers No. | Type of kernel function |
|---|---|
| SVM1 | RBF |
| SVM2 | RBF |
| SVM3 | RBF |
| SVM4 | RBF |
| SVM5 | Linear, RBF, Polynomial |
| SVM6 | Linear, RBF, Polynomial |
MSVM recognition model for quality abnormal patterns
5 Conclusions
In this paper, under the MSVM recognition framework for quality abnormal patterns, the recognition efficiencies of multi-SVM classifiers with different kernel functions are compared by the simulation experiment. The simulation results show that the recognition accuracies of the MSVM classifiers for the different quality abnormal patterns are quite different, which depends on the selection of kernel functions. A MSVM recognition model for quality abnormal patterns in a dynamic process is proposed based on the selection of kernel functions which are of high accuracies. The proposed MSVM model with suitable kernel functions can increase the recognition accuracy for quality abnormal patterns. This paper not only provides a MSVM recognition framework for quality abnormal patterns, but also offers the recognition method, which can be widely applied to various quality monitoring and diagnosis for automatic production process. However, setting the value of c and optimizing parameters of kernel functions should have an influence on the recognition accuracy of MSVM model. Therefore, how to set and optimize c and parameters of kernel function will be investigated in the further researches.
References
[1] Chen N, Zhou S. Delectability study for statistical monitoring of multivariate dynamic processes. IIE Transactions, 2009, 41(7): 593–604.10.1080/07408170802389308Search in Google Scholar
[2] Shi J, Zhou S. Quality control and improvement for multistage systems: A survey. IIE Transactions, 2009, 41(9): 744–753.10.1080/07408170902966344Search in Google Scholar
[3] Li H, Xiao D Y. Survey on data driven fault diagnosis method. Control and Decision, 2011, 26(1): 1-16.Search in Google Scholar
[4] Zheng X X. Support vector machine with gauss kernel classified method and model selection. Computer Engineering and Applications, 2006(1): 76–79.Search in Google Scholar
[5] Yang S Y, Wu D H. Control chart pattern recognition based on PCA and SVM. Journal of System Simulation, 2006, 18(5): 1314–1318.Search in Google Scholar
[6] Liu Q, Chai T Y. Progress of data-driven and knowledge-driven process monitoring and fault diagnosis for industry process. Control and Decision, 2010, 25(6): 801–807.Search in Google Scholar
[7] Ata E, Vahid R. Control chart pattern recognition using an optimized neural network and efficient features. ISA Transactions, 2010, 49(3): 387–393.10.1016/j.isatra.2010.03.007Search in Google Scholar PubMed
[8] Jiang S H, Gui W H. Monitoring model based on kernel principal component analysis and multiple support vector machines and its application. Systems Engineering — Theory & Practice, 2009, 29(9): 153–159.Search in Google Scholar
[9] Vahid R, Ata E, Reza G. Application of the PSO-SVM model for recognition of control chart patterns. ISA Transactions, 2010, 49(4): 577–586.10.1016/j.isatra.2010.06.005Search in Google Scholar PubMed
[10] Wu C K, Zhao L P. The pattern recognition of control chart based on wavelet analysis and SVM. China Mechanical Engineering, 2010, 21(13): 1572–1576.Search in Google Scholar
[11] Xiao Y W. Process monitoring based on wavelet transform kernel principal component analysis and multiple support vector machines. Journal of Chinese Computer Systems, 2011, 32(7): 1348–1353.Search in Google Scholar
[12] Liu Y M, Zhou H F, Zhang S. Quality abnormal pattern recognition of dynamic process based on MSVM. Telkomnika, 2014, 11(2): 285–290.10.11591/telkomnika.v12i4.4919Search in Google Scholar
[13] Burges C. A tutorial on support vector machines for pattern recognition. Data Mining and Knowledge Discovery, 1998, 2(1): 21–67.10.1023/A:1009715923555Search in Google Scholar
[14] Ge X K, Hu J B. Inertial navigation condition data analysis and establishment of diagnostic model based on SVM. Systems Engineering — Theory & Practice, 2012, 32(2): 405–410.Search in Google Scholar
[15] Wang M, Sun S D. A dissimilarity based kernel space for support vector machines. Systems Engineering — Theory & Practice, 2013, 33(6): 1596–1600.Search in Google Scholar
© 2014 Walter de Gruyter GmbH, Berlin/Boston
Articles in the same Issue
- Spatial Dynamics, Vocational Education and Chinese Economic Growth
- The Differential Algorithm for American Put Option with Transaction Costs under CEV Model
- Nonlinear Dynamics of International Gold Prices: Conditional Heteroskedasticity or Chaos?
- Design and Pricing of Chinese Contingent Convertible Bonds
- A Robust Factor Analysis Model for Dichotomous Data
- Non-linear Integer Programming Model and Algorithms for Connected p-facility Location Problem
- Uncertain Comprehensive Evaluation Method Based on Expected Value
- MSVM Recognition Model for Dynamic Process Abnormal Pattern Based on Multi-Kernel Functions