
Washing Characterization of Compression Socks
-
Hafiz Faisal Siddique
 ,
Adnan Ahmed Mazari
,
Adnan Ahmed Mazari

Abstract
Background
Compression socks are highly recommended textile garments for the exertion of compression pressure (kPa) at the ankle. They work on the principle of the highest pressure at the ankle gradually decreasing from the ankle to the calf.
Aim
The aim of the current research is to analyze all of the compression sock samples (Class I, Class II, and Class III) simultaneously at various number of times of washing them.
Method
All of the sock samples were washed in a standard washing machine with standard methods (ISO 6330). For the measurement of the compression pressure, a Salzmann MST MKIV pressure measuring device was used according to the RAL-GZ 387/1 method.
Results
Results included the effect of multiple wearing and washing cycles (up to 20) on compression pressure, the effect of temperature (up to 100°C) on compression pressure (kPa); multiple wearing and washing cycles on the percentage of shrinkage and the effect of marking methodology on compression pressure (Kpa) were observed and are discussed in this article. The results suggest that washing is the most important factor to consider while compression socks are used for compression therapy because they directly influence the efficacy of streamline blood flow across the legs.
1. Introduction
Compression socks are highly acclaimed textile garments for pressure exertion on the lower part of the leg. It is used for the prophylaxis and treatment of venous disorders in the lower extremities. Venous diseases range from minor asymptomatic incompetence of venous valves to chronic venous ulceration. To reduce and eliminate venous hyper pressure, a technique of compression therapy is recommended [1, 2].
1.1. Compression pressure mechanism
The mechanism of action is the lowering of pressure exertion from the ankle to the calf. The value of exertion of pressure should be highest at the ankle and must gradually decrease along the direction of the leg, as shown in Figure 1. This varying degree of compression pressure propagates and regulates blood flow by stopping its reverse flow, as shown in Figure 2, keeps the muscles in-line in the right position to mitigate the risk of injury, gives relief to many of chronic venous disease patients, and is used for therapeutic purposes [3, 4].
![Figure 1. Mechanism of action of compression socks [5]](/document/doi/10.2478/aut-2022-0009/asset/graphic/j_aut-2022-0009_fig_001.jpg)
Mechanism of action of compression socks [5]
![Figure 2. Comparison of reversible and irreversible blood flow [6]](/document/doi/10.2478/aut-2022-0009/asset/graphic/j_aut-2022-0009_fig_002.jpg)
Comparison of reversible and irreversible blood flow [6]
1.2. Standard used for the evaluation of compression socks
There are various standard descriptions of the procedure for evaluating the compression pressure (kPa) of compression socks developed by various authorities and countries. These national standards for compression stocking have been developed mainly as procedural requisites must be fulfilled for the evaluation of compression socks. These standards cover the testing methods, yarn specification, stocking manufacturing methodology, compression gradient, and durability. There are few European national standards for compression hosiery, e.g., the British standard BS 6612:1985 [7], the French standard ASQUAL [8], and the German standard RAL-GZ 387:2000 [9]. RAL-387:2005 is currently being implemented as European standard ENV 12718, and ENV 12719 has been obsolete because consensus could not be reached and the standard was canceled in 2005 and modified to RAL GZ-387:2000. All compression socks are classified on the basis of compression pressure at ankle level (B point; minimum girth circumference). The sock characteristics include fiber content, yarn type, denier, knit type, class of compression level, and size of socks, and all related parameters are evaluated with the RAL-GZ 387/1 method.
This research followed the German classification of compression socks and selected socks of manufacturers who follow the same RAL-GZ:2000 standard shown in Table 2.
1.3. Classification of compression socks
The intensity of compression pressure used for various diseases is categorized as moderate up to (20–30 mmHg) and firm compression (30–40 mmHg). This level of pressure has been decided upon and recommended to treat circulatory and vascular medical conditions as well tired, sore, swollen, or aching legs [10,11,12,13,14], conditions that are given below in Table 1. Table 1 shows that the various countries and regions of the world classify their compression socks in different ranges depending on the intensity of the type of disease.
Pressure ranges according to internationally applicable standards [14]
| Compression Class | USA | UK | French | German | EU |
|---|---|---|---|---|---|
| Testing method | HATRA | IFTH | HOSY | ||
| Testing Standard | BS-6612:1988 | ASQUAL | RAL-GZ:2000 | ||
| A | 10~14 | ||||
| Light | |||||
| I | 15–20 | 14–17 | 10~15 | 18–21 | 15–21 |
| Moderate | Light | Light | Mild | ||
| II | 20–30 | 18–24 | 15–20 | 23–32 | |
| Firm | Medium | Medium | Moderate | ||
| III | 30–40 | 25–35 | 20–36 | 34–46 | 34–46 |
| Extra Firm | Strong | Strong | Strong | ||
| IV | >49 | 40+ | >36 | >49 | |
| Very Strong | very Strong |
1.4. Washing compression socks
On the basis of a review of the scientific literature, we observed that few studies exist in which performance of compression socks had been analyzed after multiple cycles of wearing and machine-washing the socks and their influence on compression pressure (Ps) [9, 22,23,24,25,26,27,28,29]. Performance includes pressure changes and dimensional deterioration of compression socks made up of various combinations of main and inlaid yarns. It is usually recommended that commercial elastic compression socks are routinely washed to eliminate hysteresis and refresh their mechanical performance.
More than 200 of the brands exist around the globe that develop and sell their products and ultimately recommend hand washing of socks at 40°C rather than machine washing them. Drying is done by placing these sock samples between two layers of towels avoiding any of external force that could lead to deterioration of the compression. A few brand manuals are mentioned here for reference purposes [15,16,17,18,19,20,21].
The RAL-GZ 387/1 standard quality evaluation protocol of compression socks recommends that prior to testing, compression socks should be washed once according to DIN EN 26 330/6 A. The test samples must be spun dry for two minutes and dried flat according to DIN EN 26 330, method C; after the socks are washed, the sock samples should be conditioned by spreading them out after drying them for minimum of 12 hours in a standard atmosphere according to DIN EN 20139 at room temperature [9].
According to guidelines for the use and prescribing of compression hosiery recommended by NHS subjected to care of compression socks. Most manufacturers have instructed users to follow the proper washing procedure to prolong working performance for three to six months. According to the manual, compression socks should be hand-washed at 40ºC, but some garments may be suitable for gentle machine washing with mild detergent. Compression socks should not be wrung out, twisted, or tumble dried. They should be dried flat (not hung from a washing line) away from direct heat and when dry should not be ironed [22].
R. Liu, T. T. Lao, T. J. Little, X. Wu, and X. Ke have developed heterogeneous hybrid knitted structures to enhance the stability of knitted panels by increasing the stiffness value. Thermoplastic polymer threads were plated with ground threads, which was then heated at 40ºC and reset to cool. Ke has also recommended routinely washing commercial elastic compression socks to eliminate hysteresis and refresh their mechanical performance. In the end, he concluded that such heterogeneous fabrics can be washed 50 times with controlled tension loss of less than 6% and exhibit relatively balanced elasticity and shape retention in cycles of stretch loading at 70% of tensile strain [23].
H. Maleki, M. Aghajani, A.H. Sadeghi, A. Asghar, and A. Jeddi have investigated the pressure change effect due to repeated washing of different knitted fabrics. For this purpose, two kinds of knitted fabric were tested for pressure measurements after repeated washing and repeated usage. Finally, the experimental pressure values were compared with the theoretical results obtained with Laplace's law. As the results of statistical analysis indicate, the repeated washing and repeated usage have a significant effect on interfacial pressure and pressure reduction of both fabrics [24].
R. Harpa, C. Piroi, and C. D. Radu (2010) introduced a new approach to determine the capacity of medical compression hosiery to retain its designated gradual compression after repeated wearing–washing cycles. For his research, two pairs of sock samples were used for evaluation for 15 and 30 days. All the sock samples were tested before washing and after 15 and 30 cycles of wearing and washing. It was concluded that after repeated washing there is a decrease in compression pressure due to different levels of wearing and washing [25].
Recently, H. F. Siddique, A. A. Mazari, A. Havelka and Z. Kus (2019) have investigated the performance of compression socks. He washed the same sock sample first at 30°C and then 50°C and last at 75°C as a small part of his scientific research work. He has concluded from his research that as the temperature level of washing increases, there is a significant increase in compression pressure due to a gradual increase in the percentage of shrinkage of compression socks made up of nylon/Lycra compositions [26].
L. Macintyre, H. Stewart, and M. Rae (2016) mentioned that washing samples delivered a significant improvement in the pressure by allowing the samples by simple dry relaxing. Furthermore, machine washing samples at 60°C resulted in marginally higher pressures exerted compared with reconditioning. Machine washing socks at 60°C restored one brand to „like new“ pressure, and enabled the other brand of socks to exert higher pressures after wear and wash than they did when new. This marginal increase in pressure could compensate slightly for the pressure lost during wear. Thus washing anti-embolism socks between periods of wear (at least daily) should be recommended [27].
L. Macintyre, H. Stewart, and M. Rae (2016) mentioned in their work various manufacturers recommend washing the compression socks from 40°C to 75°C. They studied anti-embolism socks at 40°C and 60°C of wear and washing cycles and concluded that compression socks retain their ability to exert compression pressure when washed at 40°C while if the same sock samples are machine washed at 60°C, their intensity of compression pressure is significantly improved more than the new compression socks because when the socks are washed at a high temperature, the fiber relaxes, ultimately causing shrinkage and a decrease in the circumferential decrement, causing an increase in pressure [28].
S. Ghosh, A. Mukhopadhyay, M. Sikka, and K. S. Nagla (2008) studied the effect of washing on warp-knitted compression bandages on compression pressure. This study claimed that after use a garment has a drop in the pressure value at all the three critical positions (ankle, calf, and thigh). This indicates that contrary to the common claim, washing does not improve the performance of the garments. Actually improvement from washing takes place only with respect to the value of the pressure that is generated after second or third wearing of the garment before it is washed. This range of pressure may not be the desired pressure range for the treatment of the disease [29].
The scientific literature described above indicates the shortcomings of the washing process on compresison pressure and other related parameters. The effect of multiple (up to 20) wearing and machine washing cycles at a moderate temperature (40°C) on compression pressure (Ps) is usually recommended by various manufacturers, but there is much less literature in which the influence of 20 washing and drying cycles on compression pressure (Ps) has ever been evaluated. Also, few studies still exist in which the effect of different levels of temperatures (°C) on compression pressure (Ps) is studied, but collectively commercial brands have never been evaluated in this way, at different intensities of temperature levels (40°C–60°C–80°C–100°C), because they all recommend washing socks up to a maximum of 40°C. But in view of the skin fat, oils, dust, dirt, body residuals and foreign extracts may affect the performance of compression socks, and their long-run pressure efficacy may deteriorate, so it was decided to wash them at different temperatures. At different levels of washing (up to 20), the influence of temperature on shrinkage percentages (%) has also been evaluated for all levels of compression classes (Class I, Class II, and Class III) along the course direction. The influence of marking and unmarking methodology on compression pressure after handwashing (kPa) has also been analyzed, and the results have been statistically verified.
The main purpose of current research is to investigate the influence of different washing parameters and methodologies on compression pressure (kPa) and the percentage of shrinkage of compression socks at the ankle. It includes the influence of frequent wearing and machine washes and their effect on compression pressure (Ps). The main objectives of the current research are as follows:
To find the effect of multiple wearing-washes (up to 20) on compression pressure (classes I, II, and III)
To find the effect of temperature (up to 100°C) on compression pressure (classes I, II, and III)
To find the effect of multiple wearing-washes on shrinkage percentage
To find the effect of marking methodology on compression pressure (Ps)
2. Materials and methods
2.1. Preliminary testing of fabrics to obtain preliminary data of fabrics
2.1.1. Procurement of compression socks
A total of 13 sock samples were purchased from three different countries (Czechia, Turkey, and Switzerland) exhibiting different compression levels (class I, 2.40–2.80 kPa; class II, 3.06–4.27 kPa; and class III, 4.53–6.13 kPa where (1 kPa = 7,500 mmHg).
All of these compression sock samples were analyzed with great precision and accuracy under standard atmospheric conditions following the testing protocol of RAL-GZ-387/1 for preliminary characterization of compression socks at the ankle. The samples were conditioned for 24 hours in the desecrator before testing to keep them free from moisture.
2.1.1.1. Preliminary data of compression socks under study
Preliminary data of all of the 13 sock samples were evaluated at the ankle, including the threads counts, fabric weight, fabric thickness, Lycra content, type of yarn transformed to knitted base, stitch density, and circumference of the compression socks at ankle portion etc.
2.1.1.2. Determination of fiber content of the fabric
To confirm content of Lycra in all of the 13 compression sock (nylon/Lycra) samples at the ankle, a square of 5 × 5 cm2 was marked on the both sides of the compression socks as shown in Figure 4, and they were cut them with scissors to 26 pieces of 5 × 5 cm2. All 13 sock samples were unknit/unravelled one by one across the width and cut strip to find the type of the yarn used, the knit type (arrangement of the loops) and to find out how much Lycra is present in each sock sample. To determine the percentage of Lycra in the fabrics, all these thread samples were weighed before and then treated with an solution of 85% formic acid to dissolve the nylon filaments following the complete procedure mentioned in the AATCC-20A method (quantitative analysis of fiber composition). Weights of the undissolved Lycra samples were noted after treating unravelled threads. To find the percentage of Lycra through the solubility test shown in Table 1, the following was used:
2.1.1.3. Determination of thread count of fabrics
The number of wales and courses per centimeter and stitch density per square centimeter was measured using the pick glass (Figure 5) from five different places. An average of five readings for all of the sock samples was taken for the density of the wales (number of wales per cm), course density (number of courses per cm), and stitch density (stitches per centimetre square) are given in Table 2, respectively.
Classification of Compression Socks according to RAL-GZ 387/1 [9]
| Compression Class | Compression Intensity | Compression in kPa |
|---|---|---|
| I | Low | 2.4–2.8 |
| II | Moderate | 3.1–4.3 |
| III | High | 4.5–6.1 |
| IV | very High | 6.5 and Above |
2.1.1.4. Determination of thickness of the fabrics
A digital thickness tester of model M034A, SDL (Atlas) device, was used to determine the thickness of the material according to standard test method ISO 5084:1996. The material is measured as the perpendicular distance between the base plate on which the fabric sample is positioned, and a circular pressing disc that develops on the surface of the fabric. The measurement progress is recorded by a computer program. The area of pressing leg was 20 cm2 while a load of 200 g was applied. The thickness testing results of all of the 13 sock samples are shown in Table 2.
Determination of weight per unit area of fabrics
The weight of the cut-strips of dimension 5 × 5 cm2 was obtained from two pieces from each sock sample were relaxed for 24 hours under controlled standard atmospheric conditions. The samples were weighed individually with an electronic weighing balance given below in Table 2. The weight per square meter of area of all of the socks’ cut-strips was calculated using the formula below:
2.2. Knitting type used for compression socks
The knitting construction became renowned after the invention of the compression garments. There are two main types of knitting: warp knitting and weft knitting. For weft knitting, the flat knitting machine and the circular knitting machine consist of a single jersey, interlock, a double jersey, and rib machines, which are always used. In terms of warp knitting, Tricot, Raschel, and double-needle-bar Raschel machines are used.
All of the compression socks were visually analyzed are comprised of two type of designs named as 1 × 1 laid-in knit-miss stitches as well as 1 × 1 laid-in mesh-knit stitches as shown in Figure 3.
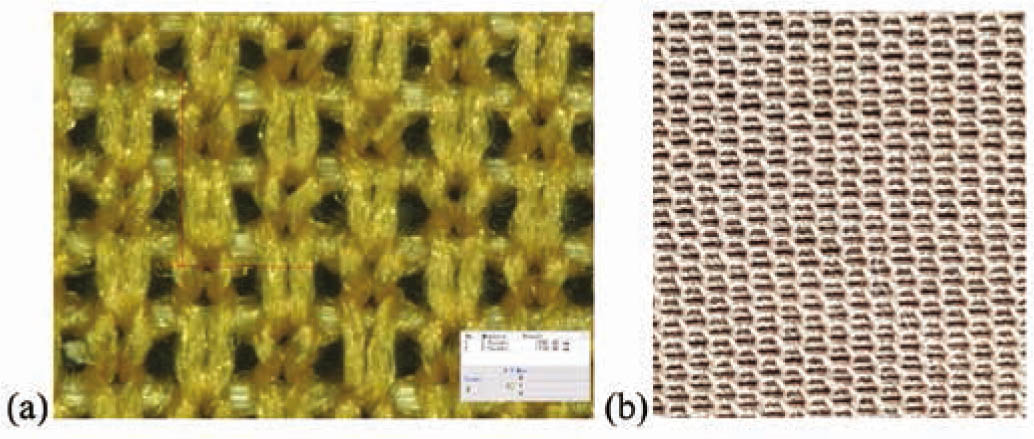
Microscopic knit-type of compression socks used (a) 1×1 laid-in knit-miss (b) 1×1 laid-in Mesh-knit
A total of 13 sock samples were purchased from three different countries (Czechia, Turkey, and Switzerland) exhibiting different compression levels (class I, 2.399–2.799 kPa; class II, 3.06–4.266 kPa and class III, 4.532–6.132 kPa) where 1 kPa =7,500 mmHg). While selecting the sock samples it was ensured that the type of knit/structure should be same (plain/single jersey, 1 × 1 laid-in, knit-miss and 1 × 1 laid-in mesh-knit. All sock samples were selected for a fixed-sized standard wooden leg (240 mm circumference at the ankle) exhibiting three compression levels and a circumference range between (14.5–21.4 cm) at a lower part of the leg (the ankle). Selected sock samples were made up only of Polyamide and Polyurethane contents.
Sock samples were evaluated for their built-in physical and technical specifications as shown in Table 1 and Table 2 with great precision and accuracy under standard atmospheric conditions RH, 65 ± 5%, temperature, 20 ± 2°C) according to standard testing protocol provided by RAL-GZ 387/1 (medical compression hosiery quality assurance) and CEN 15831:2009.
Table 3 shows the results of quantitative analysis of the compression socks as well the categorization of the different classes of compression socks on the basis of their intensity of compression pressure at the ankle. Per the scientific literature, classification of the compression socks is based on the range of compression pressure at the ankle because of the contour surfaces and most of the bone of the leg being such a complex part of the leg.
Physical specifications of compression socks
| Sr.# | Brand | Sample code | Circumference at ankle [cm] | Fiber analysis [%] Polyurethane/Polyamide | Category |
|---|---|---|---|---|---|
| 1 | Maxis | A1 | 19.0 | 30/70 | CCLI (2.40–2.80 kPa) |
| 2 | Aries | A2 | 18.6 | 31/69 | |
| 3 | Variteks | A3 | 14.4 | 28/72 | |
| 4 | Variteks | B1 | 15.6 | 33/67 | CCLII (3.06–4.27 kPa) |
| 5 | Variteks | B2 | 17.8 | 30/70 | |
| 6 | Variteks | B3 | 16.4 | 25/75 | |
| 7 | Sigvaris | C1 | 16.2 | 50/50 | CCLIII (4.53–6.13 kPa) |
| 8 | Sigvaris | C2 | 15.6 | 45/55 | |
| 9 | Maxis | C3 | 14.6 | 38/62 | |
| 10 | Variteks | C4 | 17.8 | 28/72 | |
| 11 | Aries | C5 | 15.6 | 40/60 | |
| 12 | Maxis | C6 | 14.6 | 32/68 | |
| 13 | Aries | C7 | 16.2 | 45/55 |
- *
CCL= Compression class level
Fiber analysis of the compression socks at the ankle portion was evaluated using the standard procedure mentioned in AATCC-20A-2013 by dissolving the nylon in formic acid and finally measuring the weight of the Lycra under standard atmospheric conditions.
The classification of the compression socks in classes I, II, and III was finalized on the basis of the German quality assurance method for the evaluation of the compression socks (RAL GZ-387/1) with more precision and accuracy.
Table 8 shows the technical specifications of compression socks measured at the ankle, which includes the weight of the fabric at the ankle, also called the “gram per meter square,” abbreviated as GSM, the unit of the measurement of the weight of the fabric used here is gram per meter square (g/m2). The weight of compression socks at ankle portion was measured by cutting two square cut strips, each 5 cm2, and averaging their weight as given below in Table 4. The wales and course density were measured with the pick glass method as mentioned in the RAL GZ-387/1 standard of the quality assurance for the evaluation of the compression socks; the stitch density was measured by multiplying the course density, also known as the number of the courses in the wale direction, measured in “number of loops” in the vertical direction along the length of the socks by 1 cm while the “course density” was measured along the width of the socks at the ankle, also known as the number of the horizontal lines passing across the width of the compression socks at the ankle by 1 cm. The course density was measured by multiplying the wale density and course density in units of stitches per cm2. All of the 13 sock sample cut strips were unraveled by detaching the inlaid yarn from the complex structure and untwisting them to analyze the type of yarns used. Most of the sock samples were made up of double-covered yarn instead of single-covered yarns as inlaid yarn while the main yarn was air-covered multifilament nylon and a combination of these threads depending on the requisite compression pressure (kPa).
Technical specifications of compression socks
| Code | Thickness [mm] | Fabric GSM [g/m2] | Course density [per cm] | Wales density [per cm] | Stitch density [stitches/cm2] | Main yarn | Inlaid yarn |
|---|---|---|---|---|---|---|---|
| Type | Type | ||||||
| A1 | 0.40 | 139.44 | 22.4 | 19.21 | 430.43 | MF* | DCV* |
| A2 | 0.46 | 134.00 | 24.6 | 16.20 | 398.52 | ACV* | DCV* |
| A3 | 0.54 | 149.28 | 18.20 | 20.00 | 360.00 | MF* | DCV* |
| B1 | 0.90 | 291.60 | 22.00 | 18.00 | 396.00 | ACV* | SCV* |
| B2 | 0.75 | 298.00 | 22.60 | 18.27 | 412.90 | MF+ACV* | DCV* |
| B3 | 0.64 | 306.08 | 23.20 | 22.06 | 511.79 | MF+ACV* | DCV* |
| C1 | 0.69 | 281.60 | 20.80 | 22.41 | 466.12 | MF+ACV* | SCV* |
| C2 | 0.68 | 265.20 | 21.80 | 20.34 | 443.41 | MF+ACV* | SCV* |
| C3 | 0.65 | 296.00 | 21.00 | 23.44 | 492.24 | MF+ACV* | DCV* |
| C4 | 0.86 | 360.56 | 19.20 | 19.00 | 364.80 | MF+ACV* | DCV* |
| C5 | 0.70 | 298.44 | 24.00 | 22.00 | 528.00 | MF+ACV* | DCV* |
| C6 | 0.87 | 312.80 | 16.80 | 24.48 | 411.26 | MF+ACV* | DCV* |
| C7 | 0.72 | 384.88 | 22.60 | 26.00 | 587.60 | MF+ACV* | DCV* |
*MF=Multi-filament yarn, *ACV=Air covered yarn, *SCV=Single covered yarn, *DCV= Double covered yarn
Handwashing parameters.
| Parameters | Dipping time | Water temperature | Samples weight | Water quantity |
|---|---|---|---|---|
| Hand washed | 10–15 minutes | 37 ± 3 °C | 250 g | 5 liter |
Another purpose of unraveling was to know type of knit which was mainly found to be (plain/single jersey, 1 × 1 laid-in knit-miss and 1 × 1 laid-in Mesh-knit as shown in Figure 3.
2.3. Washing evaluation of compression socks
All of the 13 sock samples were evaluated for the compression pressure using a Salzmann compression pressure measuring device, and then all of the sock samples were hand-washed at a normal temperature and then dried by placing the set of sock samples between towels for 24 hours under standard environmental conditions (RH%, 65 ± 5%, temperature, 20 ± 2°C), after all of the sock samples were machine-washed and then dried up to 20 times. The compression pressure of the machine-washed sock samples was measured after every 5 cycles of washing and drying them for four times after completing the of total 20 cycles of dry-machine-washes. Another set of the compression socks were also machine washed but in this set of the socks samples were washed at successively high temperatures ranging from (30°C, 50°C, 70°C, and 100°C). At each temperature, the sock samples were later dried for 24 hours under standard atmospheric conditions and continued the same up to 100 °C. For washing all of the sock samples, the combined concept of the manufacturers RAL-387/1 and ISO 6330 was followed.
Here are the details of the handwashing and machine washing methodology used for the compression stockings.
2.3.1. Hand washing
Handwashing and rinsing of samples were performed under slightly hot water at a temperature of about 37 ± 3°C per the detailed specifications given below in Table 4.
All the sock samples were dipped in a bucket for 10–15 minutes after that socks were dehydrated (by hydro-extraction) by placing them flat between two layers of towels for 24 hours under standard atmospheric condition (RH%, 65 ± 5%, temperature, 20 ± 2°C) for full drying purposes.
2.3.2. Machine washing (20 wearing-washing cycles)
All hand-washed compression socks after pressure measurement, were machine washed as shown in Figure 4(a) as per ISO 6330 standard method recommended by RAL-GZ 387/1 and CEN 15831 compression socks testing manuals. At first, we selected the most delicate washing procedure of the type B washing machines to launder the socks samples for 5, 10, 15, and 20 machine washes on a daily basis according to aforementioned standard method. All the individual sock samples were weighed and measured the ballast amount of type II (Polyester 100%) to complete the total wash load of 2 kg. The specimen and ballast were mixed thoroughly before putting them into the machine.
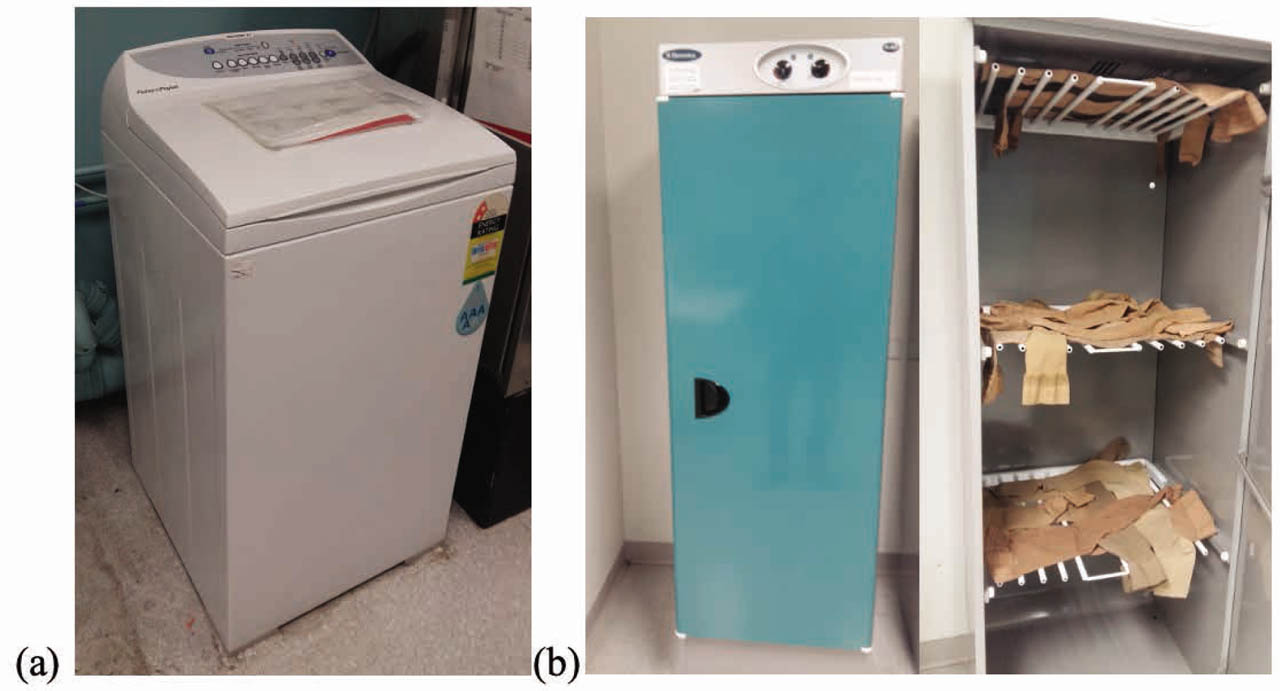
(a) Washing machine (b) Flat cabinet dryer
In a type B washing machine, as shown in Figure 3(a), hot water at a temperature 37 ± 3°C had 10 g of reference detergent of type 3 added directly into the dispenser. Reference detergent 3 is a nonphosphate powder detergent without an optical brightener and without enzymes. Another designation of reference detergent 3 is ECE 98. The main specifications of the machine washing procedure are given in Table 3.
The reference washing machine type B selected was a vertical axis, top loading agitator-adjusted machine per the ISO 6330 standard test method. Drum speed was selected to slow spin ranges from 6–7 revolutions per second while the stroke rate was selected as a gentle one, two strokes per second. Total wash time was 8 minutes, rinse time was 3 minutes, and spin time was 4 minutes.
After the rinsing, the hydro-extraction cycle was completed and all of the sock samples were taken out for flat drying. There are various procedures for drying, but the most prompt method selected was flat cabinet drying, usually recommended for drying. In this method, socks were removed from the machines and spread out in a flat dryer ensuring no wrinkles and no stretching. We allowed the sock samples to dry for 24 hours in still air in ambient conditions as shown in Figure 4(b).
2.4. Strip slicing and pressure measurement from the ankle
Strip slicing is very important for evaluating the compression pressure at the ankle after each time donning the socks, relaxing, and then donning them accurately. After each turn, the arrangement of each inlaid yarn at the same grooved line of the wooden leg at the ankle was aligned to measure the compression pressure. There were two methods: method 1 (without marking) and method 2 (with marking) were performed to get accurate results with minimal errors. Both of the methods’ standard deviations were compared and fixed; method 2 was evaluated for compression pressure.
2.4.1. Method 1 (without marking)
Initially, the dried sock samples, after hand-washing, were put onto wooden legs ensuring no stretch in the wale direction (longitudinal direction) or creases on the face of the fabric. Five readings of each sock sample for compression pressure (kPa) after frequent donning and removal were taken using MST MK IV compression pressure measuring device, as shown in Figure 3. After that, the measurement of the compression pressure of all of the thirteen sock samples was offloaded and relaxed for a few hours. The compression pressure results and standard deviation of all of the socks samples is given in Table 7.
Machine washing methodology
| Machine type | Cycle time | Socks weight | Wash load | Drying type | Detergent quantity | Water level | Washing cycle | Washing temperature |
|---|---|---|---|---|---|---|---|---|
| B | 15 minutes | 275 g | 2 kg | Flat dryer | 10 g | Low | Delicate | 37±3°C |
Marking and non marking effect on standard deviation
| Compression Class I | Compression Class I | Compression Class II | Compression Class III | |||||||||||
|---|---|---|---|---|---|---|---|---|---|---|---|---|---|---|
| Socks samples | A1 | A2 | A3 | B1 | B2 | B3 | C1 | C2 | C3 | C4 | C5 | C6 | C7 | |
| Method 1 | SD1 | 2.21 | 2.25 | 2.1 | 2.44 | 2.2 | 2.4 | 2.1 | 2.17 | 2.16 | 2.1 | 2.06 | 2.29 | 2.12 |
| Method 2 | SD2 | 1.3 | 1.56 | 0.99 | 0.98 | 1.56 | 1.66 | 1.67 | 1.4 | 1.65 | 1.2 | 1.4 | 1.1 | 1.2 |
2.4.2. Method 2 (Square marking)
Initially, all of the dried sock samples were put onto a wooden leg in such a way that the samples were not fully stretched in the wales direction (the longitudinal direction), with no creases on the surface/face of the fabric having a mark of a mean-dashed-line (−) corresponding to the main grooved line engraved on the face of the wooden leg, as shown in Figure 1(1). After we marked the mean dashed line (−), all of the sock samples were taken off and allowed to be relaxed for 24 hours. After 24 hours, a square line of 50 × 50 mm was marked at the ankle on the face of the relaxed fabric with the mean dashed line being a mean line square-marked on the face of the fabric. This was done to overcome variation due to repeated measurement of compression pressure and physical handling. Putting on and taking off all the hand-washed socks was done five times while keeping the mean marked square at the main grooved line around the leg, and compression pressure was measured with the MST Salzmann pressure measuring device (MKIV). Such a method is proposed to avoid the variability and repeatability of compression pressure values. The compression pressure along with the standard deviation results within each samples measured using both of the methods: method 1 (without marking) and method 2 (with marking) of all of the compression sock samples are given in Table 7.
2.5. Slicing of compression socks at ankle
Slicing of the cut strips for tensile analysis was done after marking a square of 50 mm2 on the face of the compression socks, and pressure measurement ensured the main groove line (−) on the groove made on the face of the wooden leg at the ankle, as shown in Figure 5(e). Circular strips having widths of almost 50 mm were sliced to loop strips as shown in Figure 5(d). The slicing can be made at any position of the leg up to the thighs and arms in unstretched form. The sliced loop strips of all 13 sock samples were donned to measure the deformed width (wf), as shown in Figure 5(d) and were measured and used for theoretical modeling.
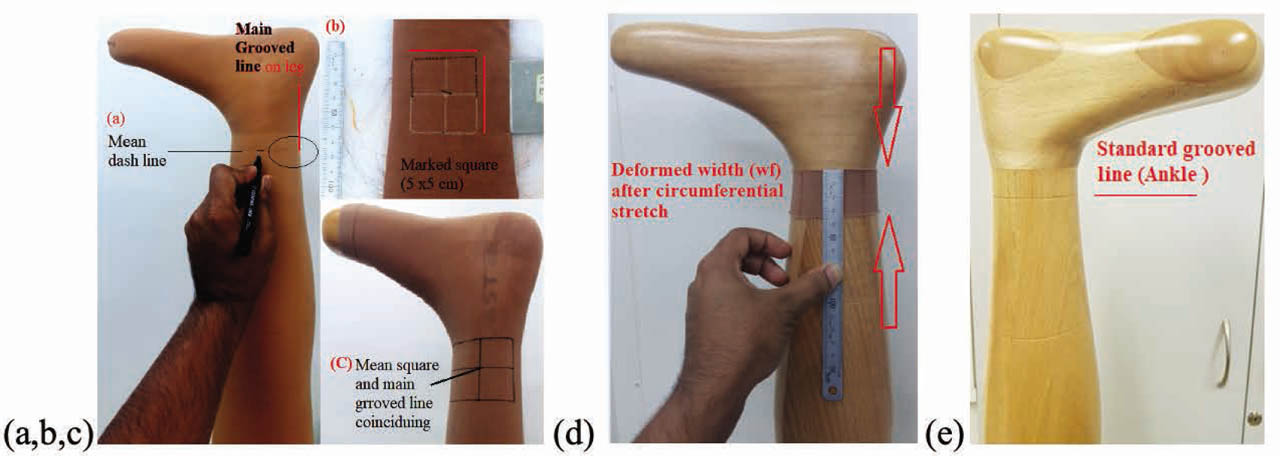
Marking (a) Locating exact grooved line on leg on face of socks (b) Square marking 5×5 cm (c) Coinciding mean line and main line over the sensor at ankle on leg surface (d) Deformed width after wearing loop strip (e) grooved line (ankle portion)
2.6. Wooden leg model
2.6.1. Specification of the wooden leg
Pressure measurement of each socks sample was performed on a standard sized wooden leg. This leg exhibits the specifications mentioned in Table 8 and was arranged from Swisslastic standard leg producing company, Switzerland. The standard test method for the evaluation of compression pressure was developed by the German Institute of Quality Assurance and Identification (RAL-GZ 387/1) and CEN 15831, as shown in Figure 6.
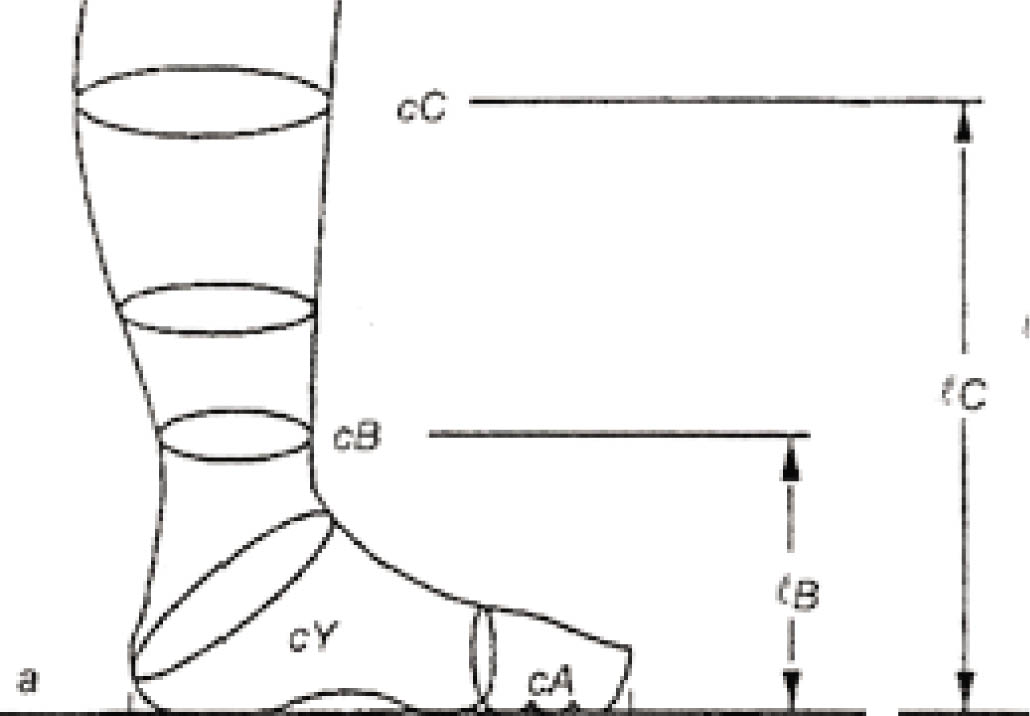
Standard wooden leg model
Standard wooden leg specifications (RAL-GZ 387/1)
| Sr.# | Parameters | symbols | Wooden Leg |
|---|---|---|---|
| Size | 9 | ||
| 1 | b level girth circumference | cb | 240 mm |
| 2 | c level girth Circumference | cc | 375 mm |
| 1 | b level height from floor | lb | 120 mm |
| 2 | c level height from the floor | lc | 300 mm |
cb-circumference at ankle(b), cc-circumference at calf(c), lb-length from sole of foot to ankle (b) and lc-length from sole of foot to calf (c)
2.7. Measurement of compression pressure
There are various devices used for the experimental measurement of compression pressure (Ps). Three types of compression measuring devices developed and used by different researchers in their publications include MST MKII, MKIII, and MKIV Salzmann (Salzmann AG, St Gallen, Switzerland); Talley Digital Skin Evaluator (Talley Group Ltd, Romsey, England), which has become obsolete nowadays; and Kikuhime (TT Medi Trade, Soro, Denmark).
The main technical characteristics of the three measuring devices provided by the manufacturers are listed below in Table 9.
Technical characteristic of compression measuring devices
| Devices | Salzmann MST MKIV | Talley Digital Skin Evaluator | Kikuhime |
|---|---|---|---|
| Pressure Range (mm Hg) | 0–99 | 0–199.9 | 0–300 |
| Resolution | 1 | 0.1 | 1 |
| Sensors Dimension | 34×4cm,0.5mm thickness | 2.8cm dia. , 0.5 mm thickness | 4×3 cm ,3 mm thickness |
The basic working principle of all devices is pneumatic, but the most popular and frequently used device for the analysis and measurement of the compression device is the Salzmann MST MKIV device. All devices other than Salzamn MST MKIV consist of a probe having variable shape and dimensions depending on the device, connected to a pressure sensor device by a stretchy tubular string impossible to deform. These probes are positioned between the backing and the compressive device. Then the probes are filled with air to transmit the pressure through the tubular strings to the pressure sensor. These measuring devices do not require any type of calibration of the measurements. All of them display the pressure in mmHg (1 mmHg = 133 Pa), which is the most commonly used unit in the medical world. Comparative studies of the performance of the three sensors mentioned above show that they have different advantages and limitations. Of the three sensors tested, the Salzmann gave the lowest systematic error in the model leg, and it is also reproducible. It allows the measurement of four points; its limitation is that it requires a regularly increasing pressure from the thigh to the ankle (or at least an equal pressure). The Talley system recorded performance similar to the Salzmann system but is sensitive to probe curvature [1].
With all of the above benefits of compression pressure measuring devices and their availability, it was great breakthrough in the history of the development of the compression pressure measuring devices when Salzmann invented and patented their equipment, with names such as MST professional 2. This has very recently been invented and is the latest equipment used for both the static and the dynamic measuring of compression pressure. For our research we have used this device for the measurement of static compression pressure (kPa) at the defined dimensions of the wooden leg.
2.8. Calculation of pressure measurement
2.8.1. Experimental measurement of compression
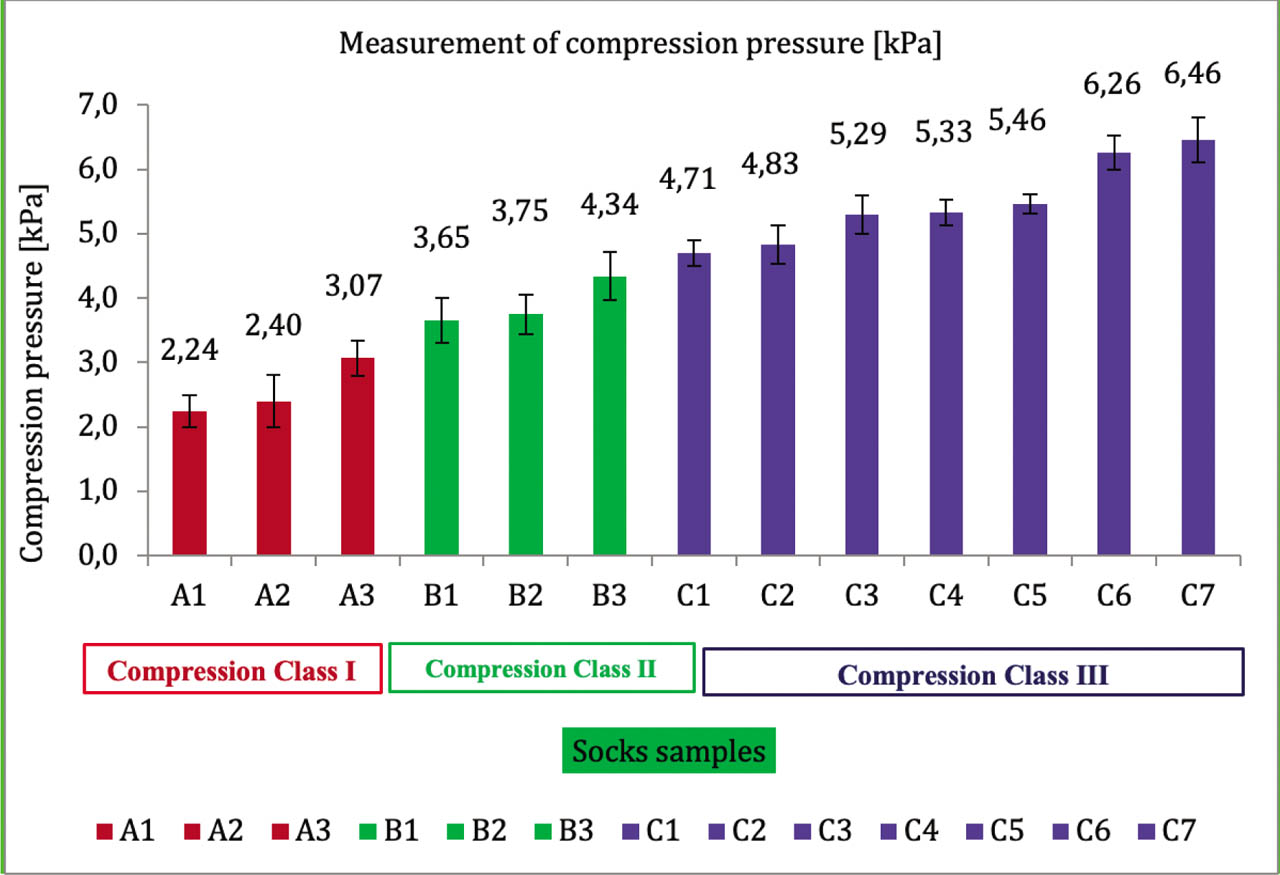
To measure the compression pressure of all of the thirteen sock samples of varying circumferences, we put the sock samples on a wooden leg with the MST Salzmann sensor's sleeve between the wooden leg and the sock samples. We ran the machine and measured the readings of the compression pressure values when the data were relatively stable. In this research, we noted five readings of compression pressure taken from the device at the ankle and averaged the data recorded as the final pressure as shown in Table 10.
Measurement of compression pressure
| Sample code | Pressure [kPa] | Standard deviation |
|---|---|---|
| A1 | 2.24 | 0.25 |
| A2 | 2.40 | 0.40 |
| A3 | 3.07 | 0.27 |
| B1 | 3.65 | 0.35 |
| B2 | 3.75 | 0.31 |
| B3 | 4.34 | 0.37 |
| C1 | 4.71 | 0.10 |
| C2 | 4.83 | 0.30 |
| C3 | 5.29 | 0.30 |
| C4 | 5.33 | 0.20 |
| C5 | 5.46 | 0.15 |
| C6 | 6.26 | 0.27 |
| C7 | 6.46 | 0.35 |
The graphical representation of the measurement of the compression pressure values is given in Figure 7.
Measurement of compression pressure
3. Results
3.1.1. Washing of compression socks
3.1.2. Multiple washes’ effects on compression pressure (CCLI, CCLII, and CCLIII)
Figure 8 and Figure 9 represent the effects of multiple machine washes on compression pressure values (kPa) at the ankle of the compression socks in Class I and Class II, as well as Class III, after each five wearing and machine washing cycles up to 20 times.
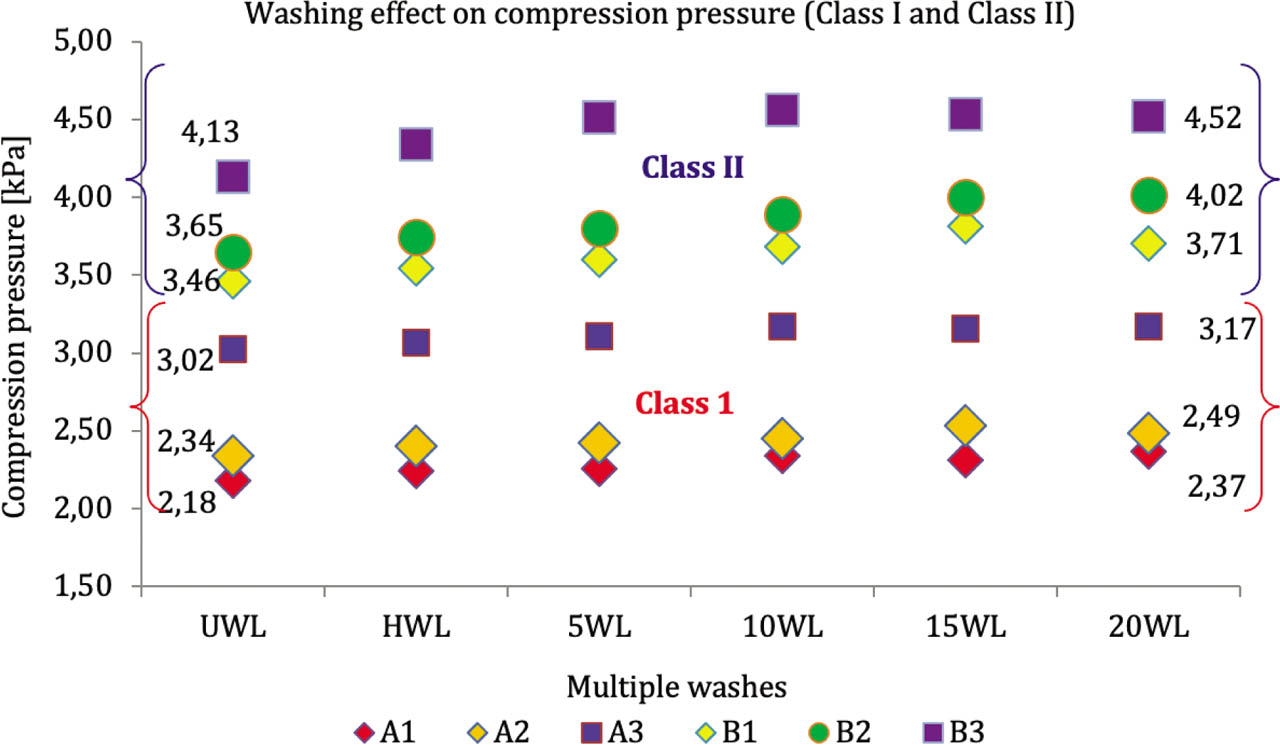
20 wearing washes effect on compression pressure (Compression class I and II)
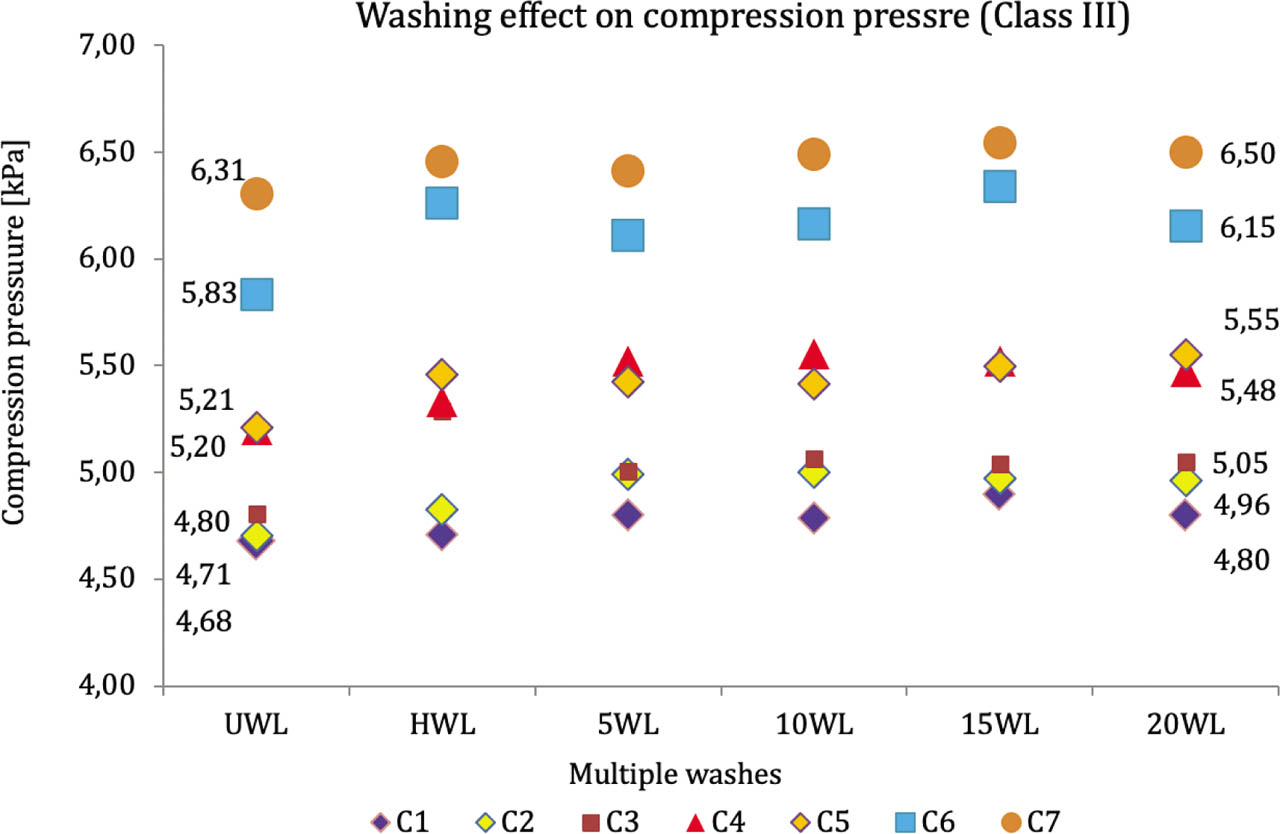
20 wearing washes effect on compression pressure (Compression class III)
Class I and Class II compression pressures (kPa) for 20 wearing and washing cycles are shown below in Figure 8.
Class III compression pressure (kPa) for 20 wearing and washing cycles is shown below in Figure 9:
3.1.3. Effect of different levels of temperature on compression pressure [kPa]
In this research, all of the 13 sock samples were machine-washed at four different temperatures (30°C, 50°C, 70°C, and 100°C) simultaneously. All of the sock samples were first machine-washed at 30°C and then dried by placing all of them between two layers of towels to dry them under standard atmospheric conditions. After we dried them, all of the sock samples were put on the wooden leg for measurement of the compression pressure with the Salzmann MST MKIV pressure measuring device. This cycle for washing was at the temperatures 50°C, 70°C, and 100°C for all sock samples, which were then dried, relaxed, and loaded onto wooden legs for the measurement of the compression pressure (kPa) and taking note of the level of compression pressure, as shown in Table 11. Per a literature review, the compression socks were evaluated for the impact of the rise in temperature up to a maximum of 60°C, but there are studies in which the effects of temperature up to 100°C are evaluated. So in this research the impact of temperatures up to 100°C is evaluated. What we found is that if a significant increase in compression pressure is observed, it means the temperature of washing up to 100°C can renew the sock samples as per new device to impart the compression pressure which is significantly increases within the limits of range for each class (with Class I, Class II, and Class III pressure measuring devices) as shown in Table 11. The results show that all of the sock samples were evaluated for compression pressure three times and the standard deviation was calculated for values mentioned in Table 11 and graphed to check the visual trend, as shown in Figure 10 below.
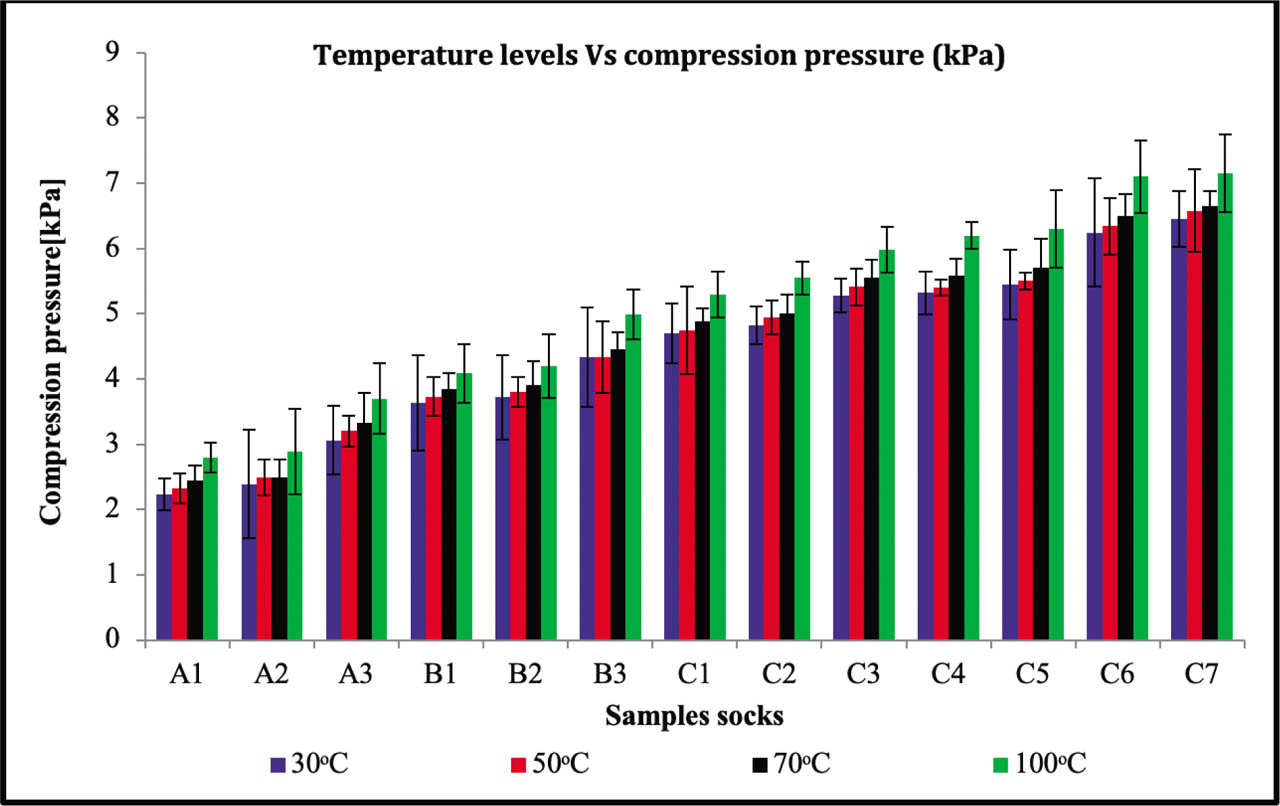
Effect of temperature on compression pressure
Temperature effect on compression pressure (kPa)
| Sample Code | Experimental Pressure [kPa] | Pressure [kPa] at 30°C | Pressure [kPa] at 50°C | Pressure [kPa] at 70°C | Pressure [kPa] at 100°C |
|---|---|---|---|---|---|
| A1 | 2.24 | 2.26 | 2.33 | 2.45 | 2.8 |
| SD | 0.24 | 0.23 | 0.23 | 0.23 | |
| A2 | 2.4 | 2.39 | 2.49 | 2.49 | 2.89 |
| SD | 0.83 | 0.27 | 0.27 | 0.65 | |
| A3 | 3.07 | 3.06 | 3.2 | 3.33 | 3.7 |
| SD | 0.53 | 0.23 | 0.45 | 0.54 | |
| B1 | 3.65 | 3.63 | 3.73 | 3.85 | 4.09 |
| SD | 0.73 | 0.30 | 0.236 | 0.45 | |
| B2 | 3.75 | 3.72 | 3.8 | 3.91 | 4.2 |
| SD | 0.65 | 0.23 | 0.37 | 0.49 | |
| B3 | 4.34 | 4.33 | 4.33 | 4.45 | 4.99 |
| SD | 0.76 | 0.55 | 0.26 | 0.38 | |
| C1 | 4.71 | 4.7 | 4.75 | 4.88 | 5.3 |
| SD | 0.45 | 0.67 | 0.20 | 0.35 | |
| C2 | 4.83 | 4.82 | 4.95 | 5 | 5.55 |
| SD | 0.29 | 0.26 | 0.29 | 0.25 | |
| C3 | 5.29 | 5.28 | 5.41 | 5.55 | 5.98 |
| SD | 0.26 | 0.28 | 0.28 | 0.35 | |
| C4 | 5.33 | 5.32 | 5.4 | 5.58 | 6.2 |
| SD | 0.33 | 0.12 | 0.26 | 0.21 | |
| C5 | 5.46 | 5.45 | 5.5 | 5.7 | 6.3 |
| SD | 0.53 | 0.13 | 0.45 | ±1.6 | |
| C6 | 6.26 | 6.24 | 6.34 | 6.5 | 7.1 |
| SD | 0.83 | 0.43 | 0.34 | 0.56 | |
| C7 | 6.46 | 6.45 | 6.58 | 6.65 | 7.15 |
| SD | 0.43 | 0.63 | 0.23 | 0.59 |
3.1.4. Effects of number of washes on transversal dimension and percentage of shrinkage at the ankle
All of the sock samples were washed at various temperatures up to 20 times, and their influence on the percentage of transversal shrinkage at the ankle was observed and analyzed. Compression socks of class I, class II, and class III were evaluated and graphically analyzed to measure the percentage of shrinkage and dimensional decrement at every five levels of washing and drying including unwashed levels, after 5 times, 15 times, and 20 times of successive washing and drying. The class wise influence of washing on the percentage of shrinkage and dimensional decrement at the ankle for each compression class is given below in Figure 11; per a literature review and previous studies the impact of washing on shrinkage was also checked, but there are few studies in which this characteristic is evaluated up to 15 times of washing. Nonetheless, the additional thing done in this research is to evaluate the sock samples up to 20 times additionally by wearing and washing of them and researchers have found a significant increase in the percentage of shrinkage for up to 15 times wearing and washing, but at the 20th cycle shrinkage will decrease due to the maximum relaxation of the sock samples. They have no further capacity to return to their original shape, but overall, the pressure lies within the range of the limits prescribed by RAL-387/1 standard quality assurance manual.
The washing effect on the percentage of transversal shrinkage and dimension (Class I) are shown in Figure 11.
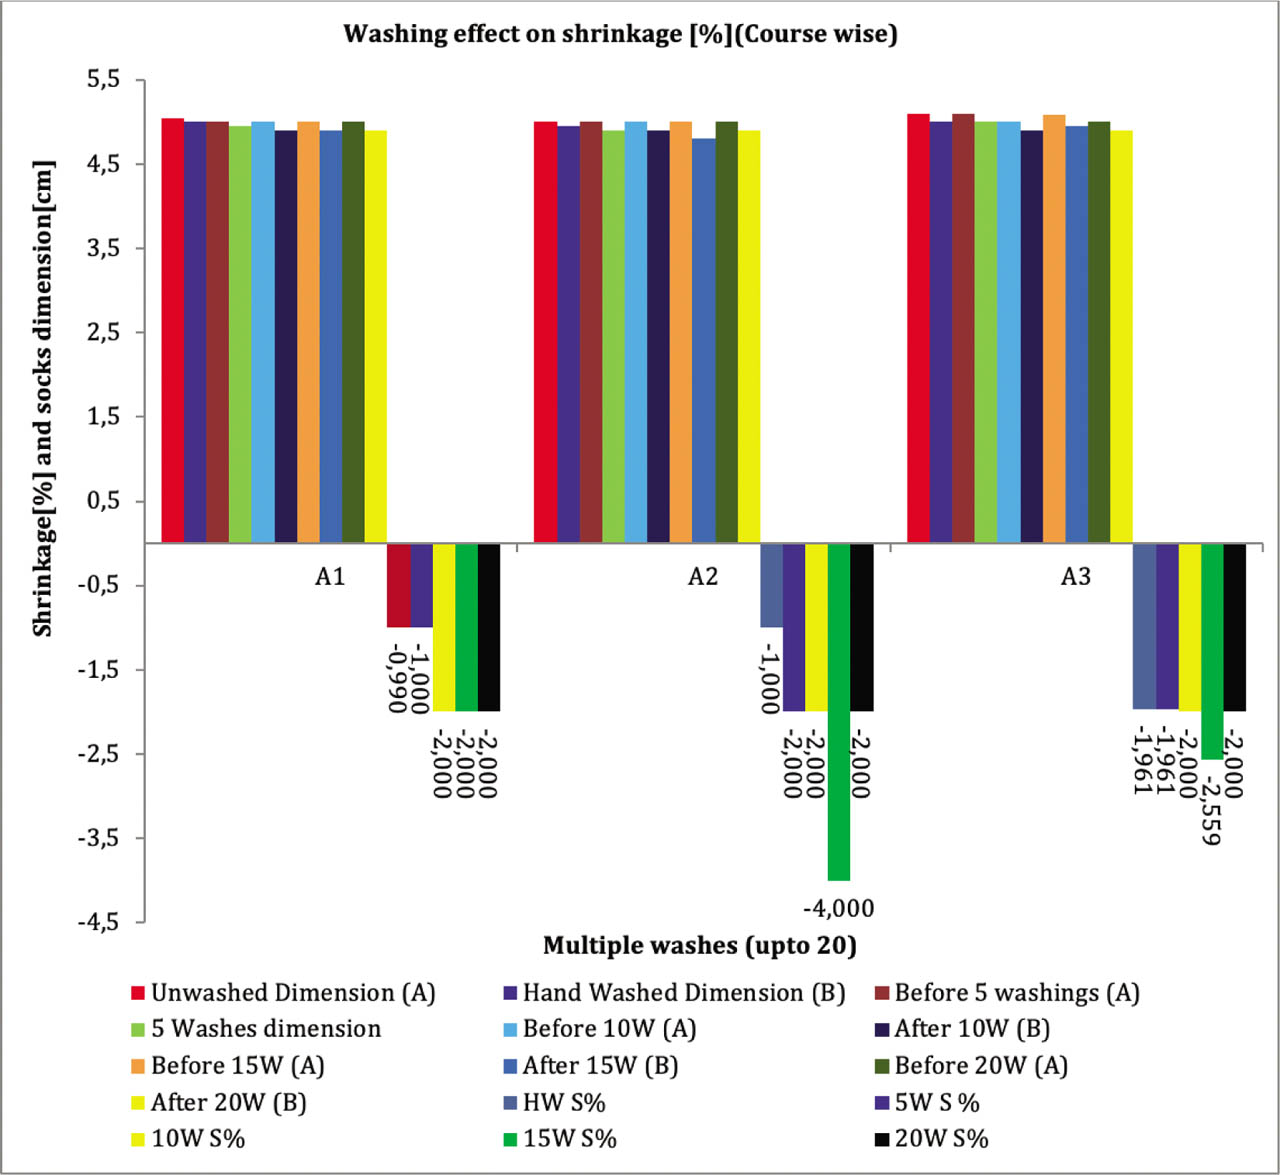
Multiple washing affect on transversal dimension at ankle (class I)
The washing effect on the percentage of transversal shrinkage and dimension (Class II) are shown in Figure 12.
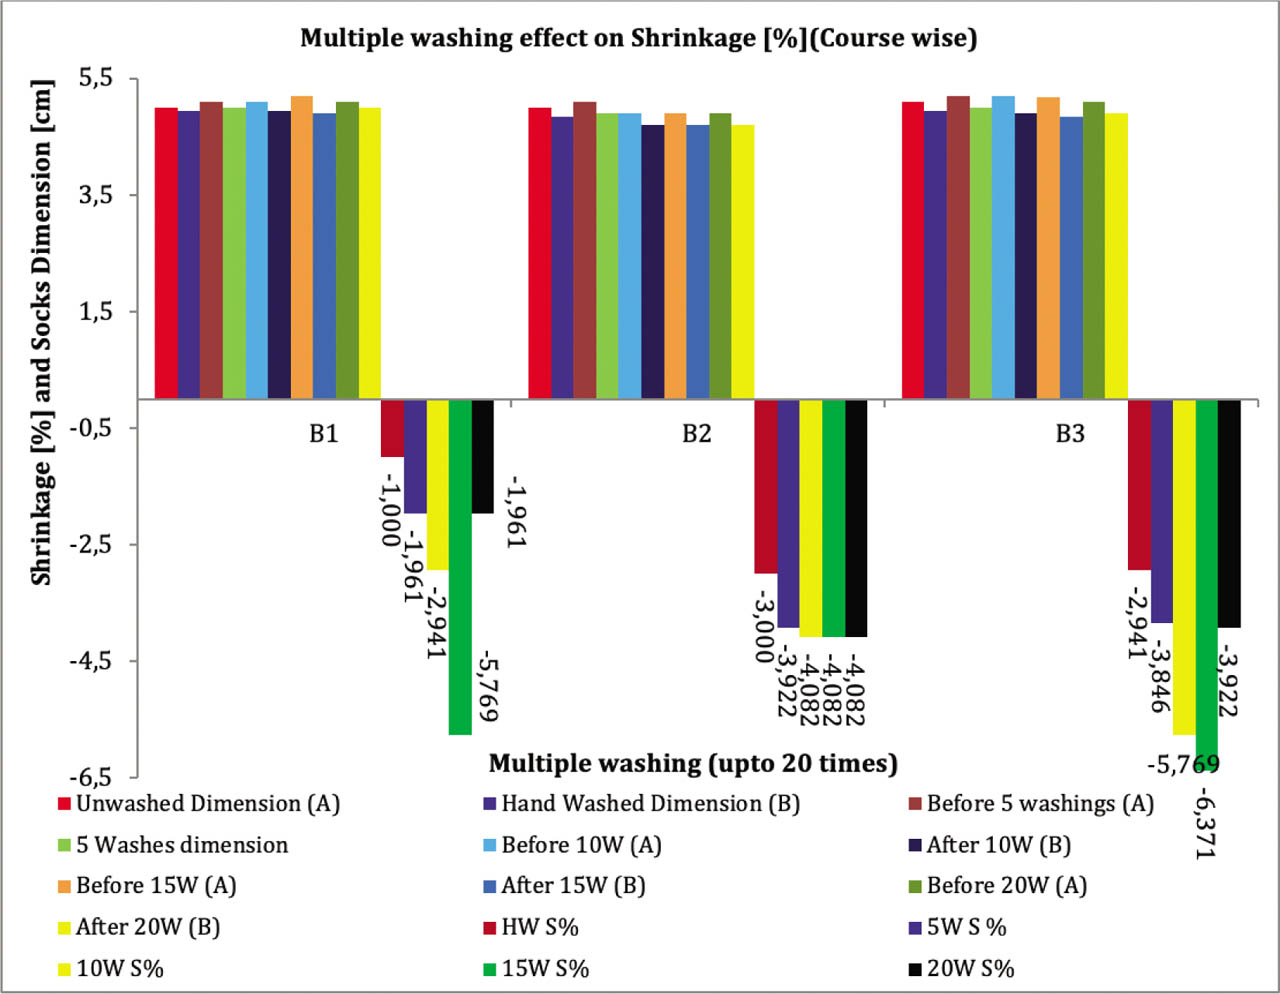
Multiple washing affect on transversal dimension and shrinkage (%) at ankle (class II)
The washing effect on the percentage of transversal shrinkage and dimension (Class III) are shown in Figure 13.
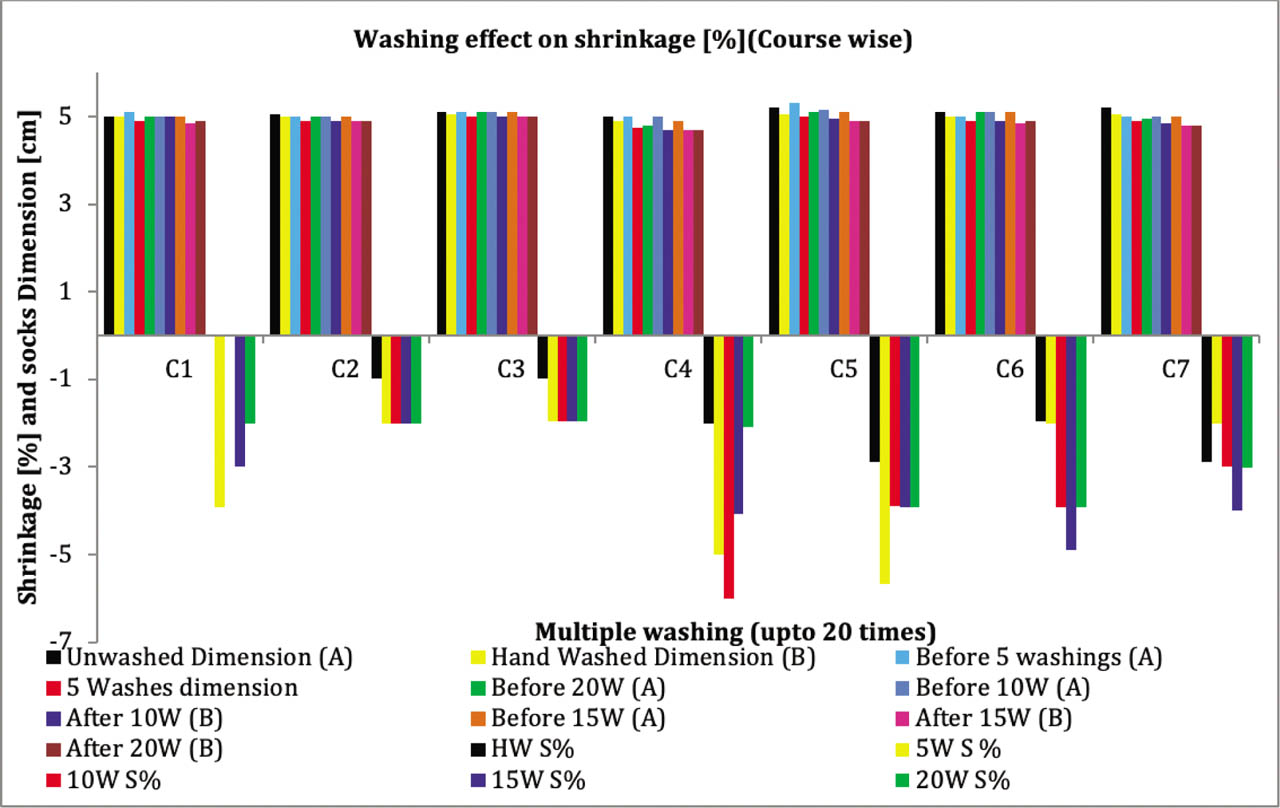
Multiple washing affect on transversal dimension at ankle (class III)
3.1.5. Marking influence on compression pressure (kPa)
Figure 14 and Table 8 show the influence of square marking on the face of sock samples, as shown in Figure 5(c) at the ankle to measure the compression pressure (kPa) using the mean square variance. The compression pressure for ll of the 13 sock samples was measured and compared with the standard deviation values (mean square variance) with marking and without marking as shown in Figure 5(a). The comparison of the samples with marking and without marking the square on the face of the fabric and its influence on the variation of compression pressure (kPa) using the mean square variance was statistically analyzed, as shown in Figure 14.
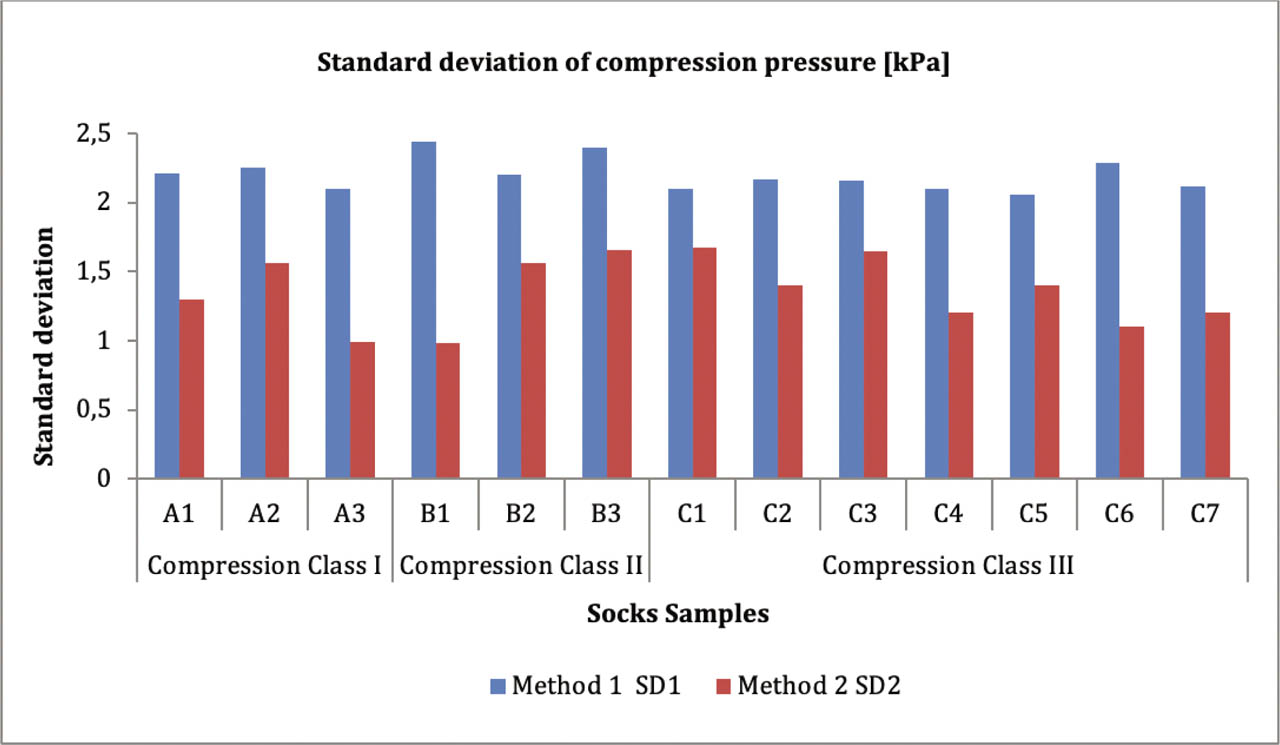
Marking and without marking effect on standard deviation of compression pressure
4. Discussion
Figure 8 shows that the intensity of compression pressure (kPa) exerted by the compression socks of class I and class II at the ankle portion at all six levels, including the unwashed level (UWL), the hand-washed level (HWL), 5WL, 10WL, 15WL, and 20WL. Here the comparison between UWL and 20 WL of each class I and class II is analyzed to see their significant influence on compression pressure (kPa).
Class 1 sock samples at the unwashed level (UWL) exerted the compression pressure, A1 (2.18kPa); A2 (2.34kPa); A3 (3.02kPa), while at the 20th wash (20WL), it was increased; A1(2.37 kPa); A2(2.49 kPa); and A3(3.17 kPa). Similarly, the comparison for class II sock samples at the unwashed level (UWL) and the twenty washes level (20WL) shows the same trend of gradual increase. Class II compression pressure at UWL is B1 (3.46kPa); B2 (3.65kPa); and B3(4.13kPa), while after 20 machine washes the pressure values were B1 (3.71kPa); B2 (4.02kPa); B3 (4.52kPa).
Figure 9 also shows that the pressure exerted by the unwashed level of compression socks (UWL) of class III; C1 (4.68kPa); C2 (4.71kPa); C3(4.80kPa); C4 (5.20kPa); C5 (5.21kPa); C6 (5.83kPa); and C6 (6.30kPa) after 20 machine washes has pressure values at C1 (4.80kPa); C2 (4.96 kPa); C3, (5.05 kPa); C4, (5.48 kPa); C5, (5.55 kPa); C6, (6.15 kPa); C7, (6.50 kPa).
All of the three compression class samples’ (13 samples) results at the unwashed level (UWL) and the 20WL levels were compared, and a similar trend was found to be a significant increase in the compression, for class I; A1(8%), A2 (6%), A3 (4.73%), for class II ;B1 (6.73%), B2 (9.20%), B3 (8.62%), for class III; and C1 (2.5%), C2 (5.04%), C3 (4.95%), C4 (5.10%), C5 (6.12%), C6 (5.20%), and C7 (3.07%). The results show that there is a slight increase in compression pressure values after 20 wearing and machinewashes that lies within the range of the prescribed compression pressure approximately. It is also a valuable sign that machine washes of the sock samples cause a slight increase in compression pressure rather than a decrease, which is valuable for patients with venous ulcerations. Per the literature review and previous research e.g., R. Harpa, C. Piroi, and C. D. Radu (2010), H. Maleki, M. Aghajani, A. H. Sadeghi, A. Asghar, and A. Jeddi, R. Liu, T. T. Lao, T. J. Little, X. Wu, and X. Ke) and others, conducted on the effect of a repeated number of washes on compression pressure with varying methodology, the conclusion was that repeated washing leads to a decrease or deterioration of the compression pressure exerted by the socks. But our research concluded that there was no deterioration of pressure; rather, the pressure slightly increases after machine washing, and it can be recommended to machine wash the sock samples under given specifications as patients frequently require higher and consistent pressure. The reason for a successive slight increase in compression pressure is due to successive shrinkage after each set of five wearing and machine wash cycles. Also, the reason that our results conflict with current and previous studies is that the methodology adopted by various researchers included multiple hand-washes, multiple machine-washes, and combinations thereof. But the difference between current research and previous research is because of multiple wearing and machine washing cycles.
Here Figure 10 shows that as the temperature of the machine washes increases, the intensity of the compression pressure increases, and it has been observed that at the maximum temperature of 100°C a maximum increase in compression pressure take place as compared with the pressure changes at temperatures 30°C, 50°C, and 70°C. In previous studies, e.g., H. F. Siddique, A. A. Mazari, A. Havelka and Z. Kus (2019); L. Macintyre, H. Stewart and M. Rae (2016); and L. Macintyre, H. Stewart and M. Rae (2016), a maximum temperature of up to of 75°C was used, and researchers concluded that a significant change in the compression pressure had taken place. It can also be concluded that washes at high temperature can make the socks as a new socks context to intensity of compression pressure.
All of the three sock samples in compression class II were machine-washed and then dried at various levels of washing up to 20 times as mentioned in detail in the section on washing compression socks. The value of the dimensional changes as well as the shrinkage percentage was noted after every five times washing and drying the socks, including hand-washed socks, and socks washed 5, 10, 15, and 20 times. Then those changes were graphed to analyze their mutual influence, as shown in Figure 12.
Figure 11 shows the effect of multiple washes, at the unwashed level, 5 times washing, 10 times, 15 times, and 20 times on the percentage of shrinkage of class I compression socks as well as in the dimensions at the ankle. This graph also shows that all of the three sock samples of class I exhibit a consecutive increase in percentage of shrinkage with an increasing number of times washing them up to 15. Compression sock samples A1 undergo a slightly higher percentage of shrinkage from being unwashed (0.990%) to 5 times washing (1.00%) and remain the same (2.000%) at consecutive 10, 15, and 20 times washing them. Similarly, the A2 and A3 compression sock samples exhibit the highest percentages of shrinkage at every 15 times washing them. However, the percentage of shrinkage at the 20th time of washing the socks was decreased. The reason for the increase in the percentage of shrinkage with increasing times washing the socks, up to 15 times, is the presence of nylon filament yarn, which has a higher regain value. The higher moisture regain of nylon (4.5%), the consecutive dryness of nylon, and the regain shrink the sock samples and ultimately incfurease the level of compression pressure (kPa). Second, after up to 15 times of consecutive washing and drying, the capacity to retain more moisture is decreased due to close packaging of nylon monomer chains. Another reason for the highest percentage of shrinkage at 15 times washing the socks is due to its minimum fabric density (fabric weight), i.e., 134g/m2 for the A2 compression sock sample.
Figure 12 shows that the percentage of shrinkage of compression socks from samples B1 and B3 consecutively increases at every 5 times washing them, up to the 20th time washing them, at which it decreased. However, the percentage of shrinkage of compression sock samples B increased from simple hand washes to 10 times washing the socks and remains the same up to 20 times.
Figure 13 shows that the effect of multiple times washing the socks on shrinkage and dimensional changes at the ankle. The percentage of shrinkage of compression class III sock samples at the ankle is inconsistent, and washing them could not consistently equally affect the dimensional difference of the sock samples after washing.
Table 8 and Figure 14 show the results of compression pressure (kPa) with marking and without marking in the form of differences in the standard deviation. Figure 16 also shows that adopting method 2 for measuring the compression pressure (kPa) results in a smaller variation in the measurement of compression pressure values than in unmarked compression pressure values. In the literature, as well as practical industrial experience, no study was found in which the marking effect on the variation of compression pressure while measuring it more than three times had ever been studied or pointed out in the research. This gap in this area of research confused the researcher trying to decide the limits of class I, class II, and class III compression socks because there was more variation. The sock samples sometimes exert pressure between class I and class II after various times washing them, so that the percentage of shrinkage and dimensional deterioration have consistent decremental as well as incremental change. Within a given class, it was challenging to mark the dashed line, and then the squaring on the sock samples helped us to keep the class I, class II, and class III socks samples within their prescribed pressure levels according to the RAl-387/1 standard method.
5. Conclusion
Washing is a very important factor for compression socks that defines the performance, efficacy, and prolongation of the pressure intensity as new compression socks. In the results reported here, it was conscluded that with an increasing level of washing up to 20 times, the compression pressure inconsistently increases or decreases although increasing the temperatures from 30°C degree to 100°C resulted in a consistent increase in compression pressure. The influence of multiple wearing and machine wash cycles affect dimensional variation, and the percentage of shrinkage was also observed, which mostly shows that after the socks are washed up to 15 times, the shrinkage of compression pressure decreases. All of the sock samples were also measured for the compression pressure with and without the marking effect, and it was found that the marked sock samples show the minimum standard deviation values and remain consistent and stable in the exertion of compression pressure.
Acknowledgments
This work was supported by the Ministry of Education, Youth and Sports of the Czech Republic and the European Union – European structural and investment funds in the frames of operational programme research, development and education – project hybrid materials for hierarchical structures (HyHi, reg. no. CZ.02.1.01/0.0/16_019/0000843).
References
[1] H.C, Meghan, C. Kwon, W. Oxenham, E. Grant and L. Reid Jr. J. Text. Inst., 106, 7, 757–767 (2015).10.1080/00405000.2014.941535Suche in Google Scholar
[2] NJM. London and R. Br. Med. J. 320(7246), 1391–1394 (2000).10.1136/bmj.320.7246.1391Suche in Google Scholar PubMed PubMed Central
[3] R. Harpa, C. Piroi, and C. Doru Radu, Text. Res. J., 80, 683 (2010).Suche in Google Scholar
[4] M. W. L Smith and J. C. Dalbey, US Patent, 7,895,863 B2 (2011).Suche in Google Scholar
[5] https://www.theveincentre.co.nz/vein-treatment/compression-stockings-varicose-veins-dvt/.Suche in Google Scholar
[6] https://www.sfveincenter.com/venous-insufficiency/.Suche in Google Scholar
[7] BS 6612:1985, “British Standard Specification for Graduated Compression Hosiery”, British Standards Institution, London, 1985.Suche in Google Scholar
[8] Certificat de qualite-produits. Referentiel technique prescrit pour les ortheses elastiques de contention des membres. Paris: ASQUAL, 1999.Suche in Google Scholar
[9] RAL Deutsches Institut fur Gutesicherung und Kennzeichnung e.V.: Medical compression hosiery—Quality assurance RAL-GZ 387/1, 2008.Suche in Google Scholar
[10] Y. Wang, P. Zhangn, and Y. Zhang, Text. Res. J., 84, 572 (2014).10.1177/0040517513503726Suche in Google Scholar
[11] N. Sau-fun, H. Chi-leung, and W. Lai-fan, Textile Progress, 43, 37 (2011).10.1080/00405167.2011.573240Suche in Google Scholar
[12] L. Macintyre, M. Baird, and P. Weedall, Int. J. Clothing Sci. Technol., 16, 173 (2004).10.1108/09556220410520450Suche in Google Scholar
[13] C. L. Hui and S. F. Ng, Text. Res. J., 71, 683 (2001).10.1177/004051750107100806Suche in Google Scholar
[14] M. Clark and G. Krimmel. MEP Ltd, 2–4, (2006).Suche in Google Scholar
[15] https://www.ameswalker.com/blogs/news/wear-with-care-three-ways-to-keep-your-compression-socks-as-good-as-new/.Suche in Google Scholar
[16] https://www.discountsurgical.com/content.asp?contentid=77/.Suche in Google Scholar
[17] http://www.jobst-usa.com/our-products/wear-care/.Suche in Google Scholar
[18] https://www.thespruce.com/how-to-care-for-compression-garments-2145792/.Suche in Google Scholar
[19] https://occfitsolutions.com/faqs/how-do-i-properly-care-for-my-compression-socks-stockings/.Suche in Google Scholar
[20] http://www.orthohealth.ca/compression-therapy/use-and-care-of-medical-compression-stockings/.Suche in Google Scholar
[21] http://www.derbyshiremedicinesmanagement.nhs.uk/assets/japc/JAPC/JAPC_ToR.pdf/.Suche in Google Scholar
[22] https://eastkentformulary.nhs.uk/media/1216/compression-hosiery-guidance-v3-ekpg-march-2016.pdf/.Suche in Google Scholar
[23] R. Liu, T.T. Lao, T.J. Little, X. Wu and X. Ke. Tex. Res. Journal, 88(17), 1915–1930 (2018).10.1177/0040517518779254Suche in Google Scholar
[24] H. Maleki, M. Aghajani, A.H. Sadeghi, A. Asghar and A. Jeddi. J. Eng. Fibers Fabr., 6(2), 30–39 (2011).10.1177/155892501100600204Suche in Google Scholar
[25] R. Harpa, C. Piroi and C. D. Radu. Tex. Res. J. 80(8), 683–695, (2010).10.1177/0040517509343781Suche in Google Scholar
[26] H.F. Siddique, A.A. Mazari, A. Havelka, and Z. Kus. Fibers Polym. 20(5), 1092–1107, (2019).10.1007/s12221-019-8965-1Suche in Google Scholar
[27] L. Macintyre, H. Stewart and M. Rae. Int. J. Nurs. Stud, 64, 19–24 (2016).10.1016/j.ijnurstu.2016.09.004Suche in Google Scholar PubMed
[28] L. Macintyre, H. Stewart and M. Rae. Phlebology, 6(1), 9–14 (2016).Suche in Google Scholar
[29] S. Ghosh, A. Mukhopadhyay, M. Sikka, and K. S. Nagla. J. Tissue Viability. 17(3), 82–94 (2008).10.1016/j.jtv.2007.09.013Suche in Google Scholar PubMed
© 2022 Hafiz Faisal Siddique et al., published by De Gruyter
This work is licensed under the Creative Commons Attribution 4.0 International License.
Artikel in diesem Heft
- The Effects of Sensory Marketing on Clothing-Buying Behavior
- Washing Characterization of Compression Socks
- Polyaniline Electrospun Composite Nanofibers Reinforced with Carbon Nanotubes
- Review on 3D Fabrication at Nanoscale
- Investigation of the Performance of Cotton/Polyester Blend in Different Yarn Structures
- Transport of Moisture in Car Seat Covers
- Investigating the Effect of Recycled Cotton Included Fabrics on the Thermal Behaviour by Using a Female Thermal Manikin
- Application of Spectral Analysis in Spinning Measurements
- Wearable Design for Occupational Safety of Pb2+ Water Pollution Monitoring Based on Fluorescent CDs
- Investigation of Surface Geometry of Seersucker Woven Fabrics
- Current Development and Future Prospects of Designing Sustainable Fashion
- Design of Clothing with Encrypted Information of Lost Children Information Based on Chaotic System and DNA Theory
- Thermal Resistance of Gray Modal and Micromodal Socks
- Study on Process Optimization and Wetting Performance of Ultrasonic-Oxidized Wool Fiber
- Liquid Moisture Transport in Stretched Knitted Fabrics