Comparison between liquid chromatography-tandem mass spectrometry and immunoassay methods for measurement of plasma 25 (OH) vitamin D
-
Saadet Kader

 ,
Turan Akdağ
,
Büşra Ecer
,
Sedat Abuşoğlu
und
Ali Unlu
,
Turan Akdağ
,
Büşra Ecer
,
Sedat Abuşoğlu
und
Ali Unlu

Abstract
Objectives
Vitamin D is one of the major hormones involved in the metabolism of calcium (Ca) and phosphorus (P). In the present study, we aimed to determine the analytical performance of the immunoassay method used for determining plasma 25-hydroxyvitamin D [25(OH)D] levels in routine clinical practice in laboratories.
Methods
Venous blood samples were collected from 156 patients for the comparisons and were analyzed with Siemens ADVIA Centaur XPT, the Roche Cobas 6,000’s module e601, Abbott Architect i2000, and the liquid chromatography with tandem mass spectrometry (LC-MS/MS).
Results
The four methods were analyzed and compared through the Passing-Bablok regression for 25(OH)D, and the highest correlation was found at LC-MS/MS and Cobas 6,000’s module e601 (r=0.799), LC-MS/MS/Abbott Architect i2000, and LC-MS/MS/Siemens ADVIA Centaur XPT as r=0.736, 0.721, respectively. The correlation coefficient was found between Abbott Architect i2000 with Roche Cobas e601 and Siemens ADVIA Centaur XPT as r=0.934 and r=0.907, respectively. Also, the correlation coefficient was found between Roche Cobas e601 and Siemens ADVIA Centaur XPT as r=0.906.
Conclusions
The Roche Cobas assay showed better performance, compared with the other assays. Based on our findings, the chemiluminescence methods in automated systems seem to be expedient.
Introduction
As one of the major hormones, vitamin D has a secosteroid structure and is involved in the metabolism of phosphorus (P) and calcium (Ca). While their chemical structure is similar to steroid hormones, the active form of vitamin D plays a role in the arrangement of Ca and P metabolism and genomic functions [1]. The cholecalciferol is synthesized from 7-dehydrocholesterol by the effect of ultraviolet rays of 290–310 nm wavelength (λ) in the skin, and this endogenous production is the primary source of vitamin D in the human body [2, 3]. From the knowledges, the effect of vitamin D2 is less than approximately 1/3 of the effect of vitamin D3, and the effect time of vitamin D2 is shorter than vitamin D3 [4]. Formed in the liver, vitamin D arrives at the kidneys by binding to vitamin D binding protein (DBP) and turns into 1.25-hydroxyvitamin D [1.25(OH)2D] (calcitriol) by being hydroxylated for the second time through the 1-α hydroxylase enzyme. As clinical, plasma or serum vitamin D levels should be checked to obtain information about vitamin D levels of the individuals. Due to the major circulatory form with a half-life of two to three weeks, vitamin D shows both the intake and endogenous production [5].
The biologically active form of 1.25(OH)D is not appropriate for determining body vitamin D levels because its half-life is as short as four to 6 h; additionally, the circulatory levels of 1.25(OH)D are 1,000 times lower than vitamin D [6]. The status of vitamin D is most reliably determined by assay of serum 25-hydroxyvitamin D (25(OH)D). The serum levels of 25(OH)D are commonly described as deficient below 25 nmol/L, adequate between 25 and 75 nmol/L, and optimal value as >75 nmol/L [7].
In many studies, it has been concluded that a low level of vitamin D may be associated with such many diseases as osteoporosis, osteomalacia rickets, heart failure, multiple sclerosis, and some cancers. Therefore, the accurate measurement of vitamin D has become very important in recent years [8]. Quaggiotto et al. [9] declared that the number of requests of 25(OH)D was increased about 7 fold between 2001 and 2010. Similarly, another study also demonstrated that the demands for 25(OH)D were elevated about twenty times further between 2006 and 2009 [10].
LC-MS/MS is a quantitative method used to determine the amount of vitamin D2 and D3 separately, and so giving far more accurate and precise results in the patients requiring vitamin levels to be measured clinically [11]. While the LC-MS/MS method may predict the amounts of vitamin D2 and vitamin D3 separately, it can measure the vitamin concentration much more accurately [12]. In the study, therefore, we aimed to evaluate the analytical performances of immunoassay methods used to determine 25(OH)D in the plasma and to compare these methods with LC-MS/MS.
Materials and methods
One hundred and fifty-six patients admitted to the Hospital of the Faculty of Medicine in Selcuk University for the measurements of vitamin D between December 2020 and February 2021 were enrolled in the study. The blood samples were drawn from those patients, and the samples were analyzed with the immunoassay method through the 25(OH)D Roche Cobas e601 (Roche Diagnostics, Mannheim, Germany) and Abbott Architect, Siemens ADVIA Centaur XPT ADVIA Centaur XP (Siemens Diagnostics, Tarrytown, NY, USA) devices; however, the measurements of LC-MS/MS were analyzed by the chromatographic separation-based mass spectrometry in the ABSCIEX API3200 device (AB Sciex, Foster City, CA, USA) under the specified method. Written consents were obtained from all participants before the study, and the study was approved by the non-interventional clinical trials ethics committee of the Selcuklu Faculty of Medicine in Selcuk University (approval no: 2019/162). The four systems used to analyze the plasma 25(OH)D to compare with LCMS/MS were as follows: The measurement of 25(OH)D with Roche Cobas e 601 was performed through the Cobas Vitamin D total kit and Cobas e 601 devices (Roche Diagnostics, Mannheim, Germany) using the ECLIA method. The measurement of 25(OH)D with Abbott Architect was performed through the Architect 25OH vitamin D total kit and Architect i2000 device (Abbott Diagnostics, Illinois/ABD) using chemiluminescence microparticle immunoassay (CMIA) method. The measurement of 25(OH)D with Siemens ADVIA Centaur XPT was performed through Advia Centaur XPT 25OH vitamin D total kit and Advia Centaur XPT device (Siemens Healthcare Diagnostics Inc, Tarrytown, NY, USA) using the ECLIA method.
The API 3200 mass spectrophotometer LC-MS/MS is based on the quantitative determination of plasma or serum 25(OH)D and its metabolites after the extraction. In the study, while the AB SCIEX API 3200 LC-MS/MS was operated at 300 °C, and the ionization source was used to operate with the atmospheric pressure chemical ionization source (APCI) method, the multiple reaction monitoring (MRM) modes were used for the detection of the analytes. One MRM passage and internal standard were followed for each analyte. m/z 383.4/211.1 for 25 (OH)D3 and m/z 389.4/211.193 for (2H6)-25(OH)D (internal standard) were used as MRM mode. The Shimadzu Prominence LC unit and Phenomenex Luna C8 reverse phase column (2.1 and 50 mm/5 µm) were used for the separation procedure.
Two different solvents were used for the mobile phase. However, while water was used as mobile phase-A, acetonitrile with 0.1% formic acid was used as mobile phase-B. The flow rate was arranged as 1 m/min, and a sample volume of 50 µL was injected for each sample. To elute the analytes from the column, an acetonitrile gradient was used. In the first 3 min, 70% of the mobile phase was set to be taken from A and 30% from B. This procedure was carried out to keep the 25-hydroxy metabolites in the column. After 3 min, the concentration of eluent A was elevated to 100%, and this concentration was held constant for 1 min. During the next 1 min, it was adjusted so that 70% of the mobile phase was taken from A and 30% from B. Each sample was studied totally in 5 min.
To prepare the samples, 250 µL of plasma (control, calibrator, and plasma) and 100 µL of the internal standard were first put into the glass test tubes; 1,000 µL of acetonitrile (ACN) was added on the titers, and then the specimens were vortexed as 30 s and left to incubate at 40 °C for 10 min. The tubes were centrifuged at 13,000 rpm for 5 min after the incubation. The supernatant remains on the tubes were transported to the borosilicate tubes and evaporated with nitrogen. Then, the specimens were dissolved with 250 µL of 50% ACN, and the samples were vortexed for 15 s. All of the samples in the tube were transferred to the inserts. And the inserts were placed in vials and given to the device for injections.
Analysis of parathormone
The measurement of PTH levels with Roche Cobas e 601 and Siemens ADVIA Centaur were performed with the ECLIA, and Abbott Architect were performed with the CMIA method.
Analysis of calcium
Total calcium (Ca) levels wich measured through the Abbott Architect C16000 and Roche Cobas e 601 autoanalyzer were performed with Arsenazo-III. In the analysis of Ca via the Siemens ADVIA Centaur XPT autoanalyzer, the o-cresolphthalein complexone (OPC) method was utilized.
Analysis of phosphorus
The measurements of inorganic phosphate with using Abbott Architect C16000, Roche Cobas e 601 and Siemens ADVIA Centaur XPT autoanalyzer were performed with classical phosphomolybdate method [9, 10].
The linearity of LC-MS/MS was measured as 100% for 240 μg/L and 94% for 7.5 μg/L. While the intraday assay precision was 5%, the interday assay precision was measured as 6.7%, and the obtained substance concentration in μg/L was also around 94–98%. Additionally, the recovery rates were between 94 and 105%. The accuracy was defined as bias % and calculated as 5.6%. The limits of quantitation and detection were 4 μg/L and 1 μg/L, respectively.
Statistical analysis
The distributions of Ca, PTH, P, and vitamin D in the plasma of patients were investigated. The distribution of parameters and differences between the groups were analyzed statistically. The MedCalc 11.3.3.0 (MedCalc Software bbva, Acacialaan22, Ostend, Belgium) (http://www.medcalc.be) and the Statistical Package for Social Sciences for Windows 25.0 programs (SPSS Inc., Chicago, IL, USA) were used for the evaluation of the data. Pearson correlation coefficient was used when the parametric test provided the assumptions, and the Spearman correlation coefficient was used when it did not. The result does not depend on the assignment of the methods (or instruments) to X and Y. The slope B and intercept A are calculated with their 95% confidence interval.
Results
The analyzes of Ca and P in 156 patients were studied with the Roche Cobas e 601, Abbott with Architect i2000, and Siemens ADVIA Centaur XPT auto analyzers. With a similar number of patients (n=156), vitamin D and PTH levels were measured in the Roche Cobas e 601, Abbott Architect i2000, Siemens ADVIA Centaur XPT immunoassay analyzers, and LC-MS/MS device. The results of 25(OH)D measurements obtained via four methods were statistically evaluated, and the regression analysis was performed to examine the association between the groups. The associations were expressed as the correlation coefficient, and the obtained values from the four measurement systems were evaluated by the Pearson correlation analysis; a significant correlation was found between the methods (p<0.05). The Passing-Bablok regression analysis was performed to evaluate the relationship between both the measured parameters [25 (OH)D, Ca, P, and PTH], and the results of the LC-MS/MS method. The Passing-Bablok regression analysis is shown in Table 1.
Analysis of Passing-Bablok regression.
| Statistical analysis | n | Regression equation | Spearman’s correlation coefficient rs | Linear model validity |
|---|---|---|---|---|
| Cusum test for linearity | ||||
| LC-MS/MS (variable x) | 156 | y=−0.656+1.002x | 0.736 | p<0.0001 |
| Architect i2000 (variable y) (ng/dL) 25(OH)D | ||||
| LC-MS/MS (variable x) | 156 | y=−1.611+0.928x | 0.799 | p<0.0001 |
| Cobas e601 (variable y) (ng/dL) 25(OH)D | ||||
| LC-MS/MS (variable x) | 156 | y=2.665+0.666x | 0.721 | p<0.0001 |
| Siemens ADVIA centaur XPT (variable y) (ng/dL) 25(OH)D | ||||
| Architect i2000 (variable y), cobas e601 (variable x) (ng/dL) 25(OH)D | 156 | y=1.43+1.064x | 0.934 | p<0.0001 |
| Architect i2000 (variable y) | 156 | y=−3.504+1.464x | 0.907 | p<0.0001 |
| Siemens ADVIA centaur XPT (variable x) (ng/dL) 25(OH)D | ||||
| Cobas e601 (variable y) | 156 | y=−4.860+1.342x | 0.906 | p<0.0001 |
| Siemens ADVIA centaur XPT (variable x) (ng/dL) 25(OH)D | ||||
| Cobas e601 (variable x) | 156 | y=−3.367+1.333x | 0.636 | p<0.0001 |
| Architect i2000 (variable y) (mg/dL) (Ca) | ||||
| Architect i2000 (variable y) | 156 | y=−0.100+1.000x | 0.585 | p<0.0001 |
| (nmol/L), siemens ADVIA centaur XPT (variable x) (mg/dL) (Ca) | ||||
| Cobas e601 (variable y) | 156 | y=3.879+0.604x | 0.586 | p<0.0001 |
| Siemens ADVIA centaur XPT (variable x) (mg/dL) (Ca) | ||||
| Architect i2000 (variable y), cobas e601 (variable x) (mg/dL) (P) | 156 | y=0.000+1.000x | 0.805 | p<0.0001 |
| Architect i2000 (variable y) | 156 | y=−0.570+1.261x | 0.750 | p<0.0001 |
| (nmol/L), siemens ADVIA centaur XPT (variable x) (mg/dL) (P) | ||||
| Cobas e601 (variable y) | 156 | y=−0.500+1.250x | 0.818 | p<0.0001 |
| Siemens ADVIA centaur XPT (variable x) (mg/dL) (P) | ||||
| Cobas e601 (variable x) | 156 | y=−7.825+1.165x | 0.968 | p<0.0001 |
| Architect i2000 (variable y) (pg/mL) (PTH) | ||||
| Architect i2000 (variable y) | 156 | y=−7.825+0.851x | 0.873 | p<0.0001 |
| (nmol/L), siemens ADVIA centaur XPT (variable x) (pg/mL) (PTH) | ||||
| Cobas e601 (variable y) | 156 | y=−4.418+0.741x | 0.876 | p<0.0001 |
| Siemens ADVIA centaur XPT (variable x) (pg/mL) (PTH) |
-
Ca, calcium; P, phosphorous; PTH, parathyroid hormone.
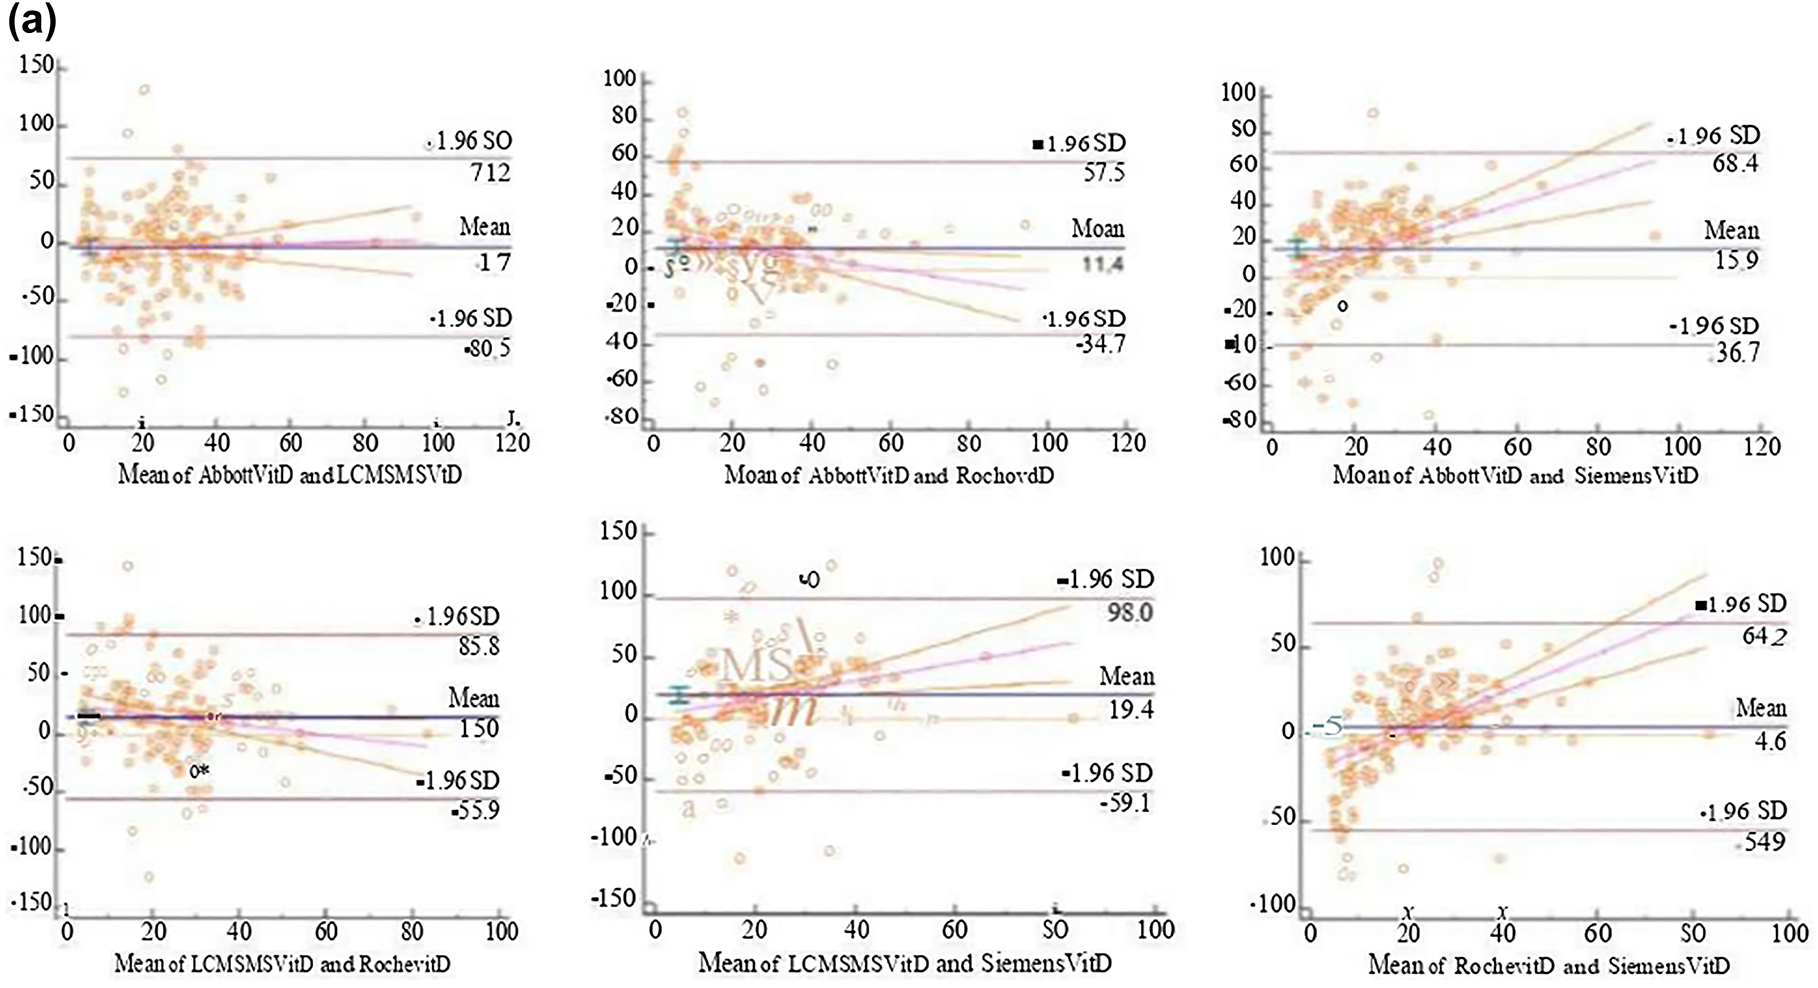
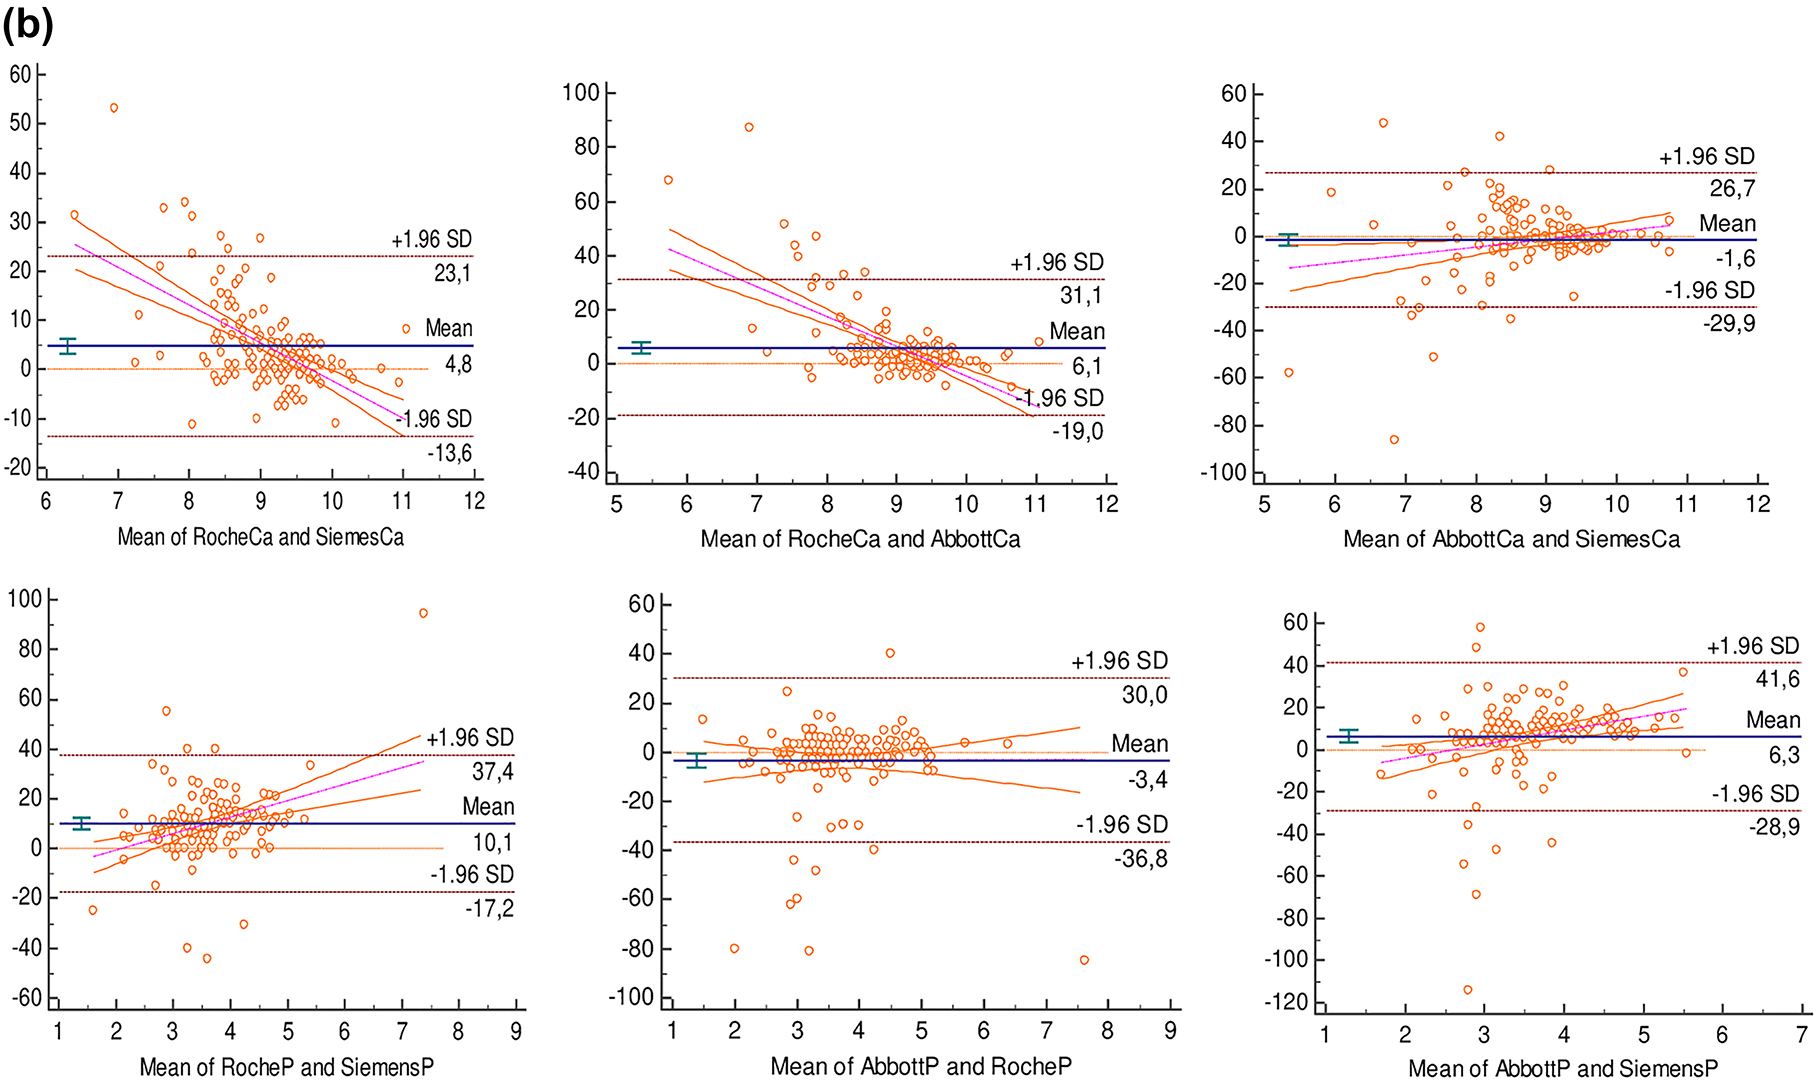
The deviations and differences between the methods were evaluated using the Bland-Altman plot (Figures 1 and 2). The confidence intervals (CI) of the slope and intercept values and correlation values in the lineer regression analysis are presented in Table 2.
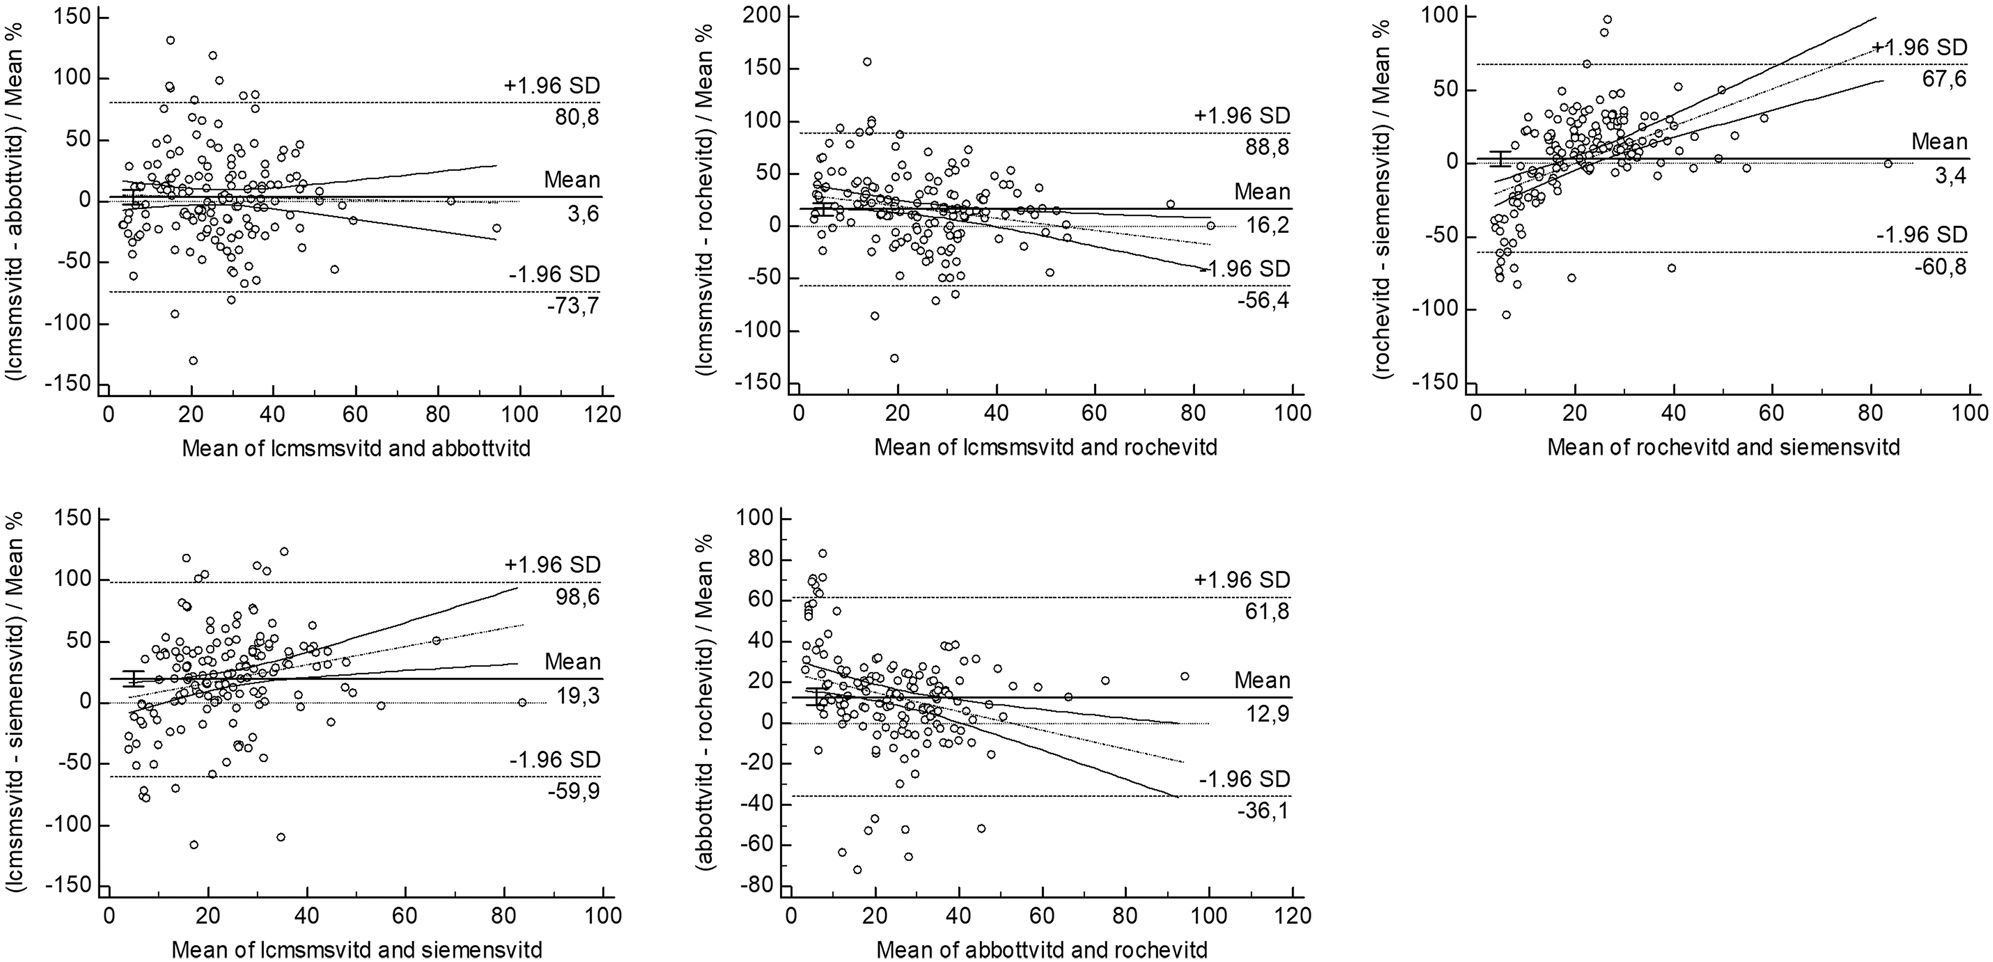
Bland Altman plots between LCMS/MS and immunoassay methods with the mean% of vitamin D results.
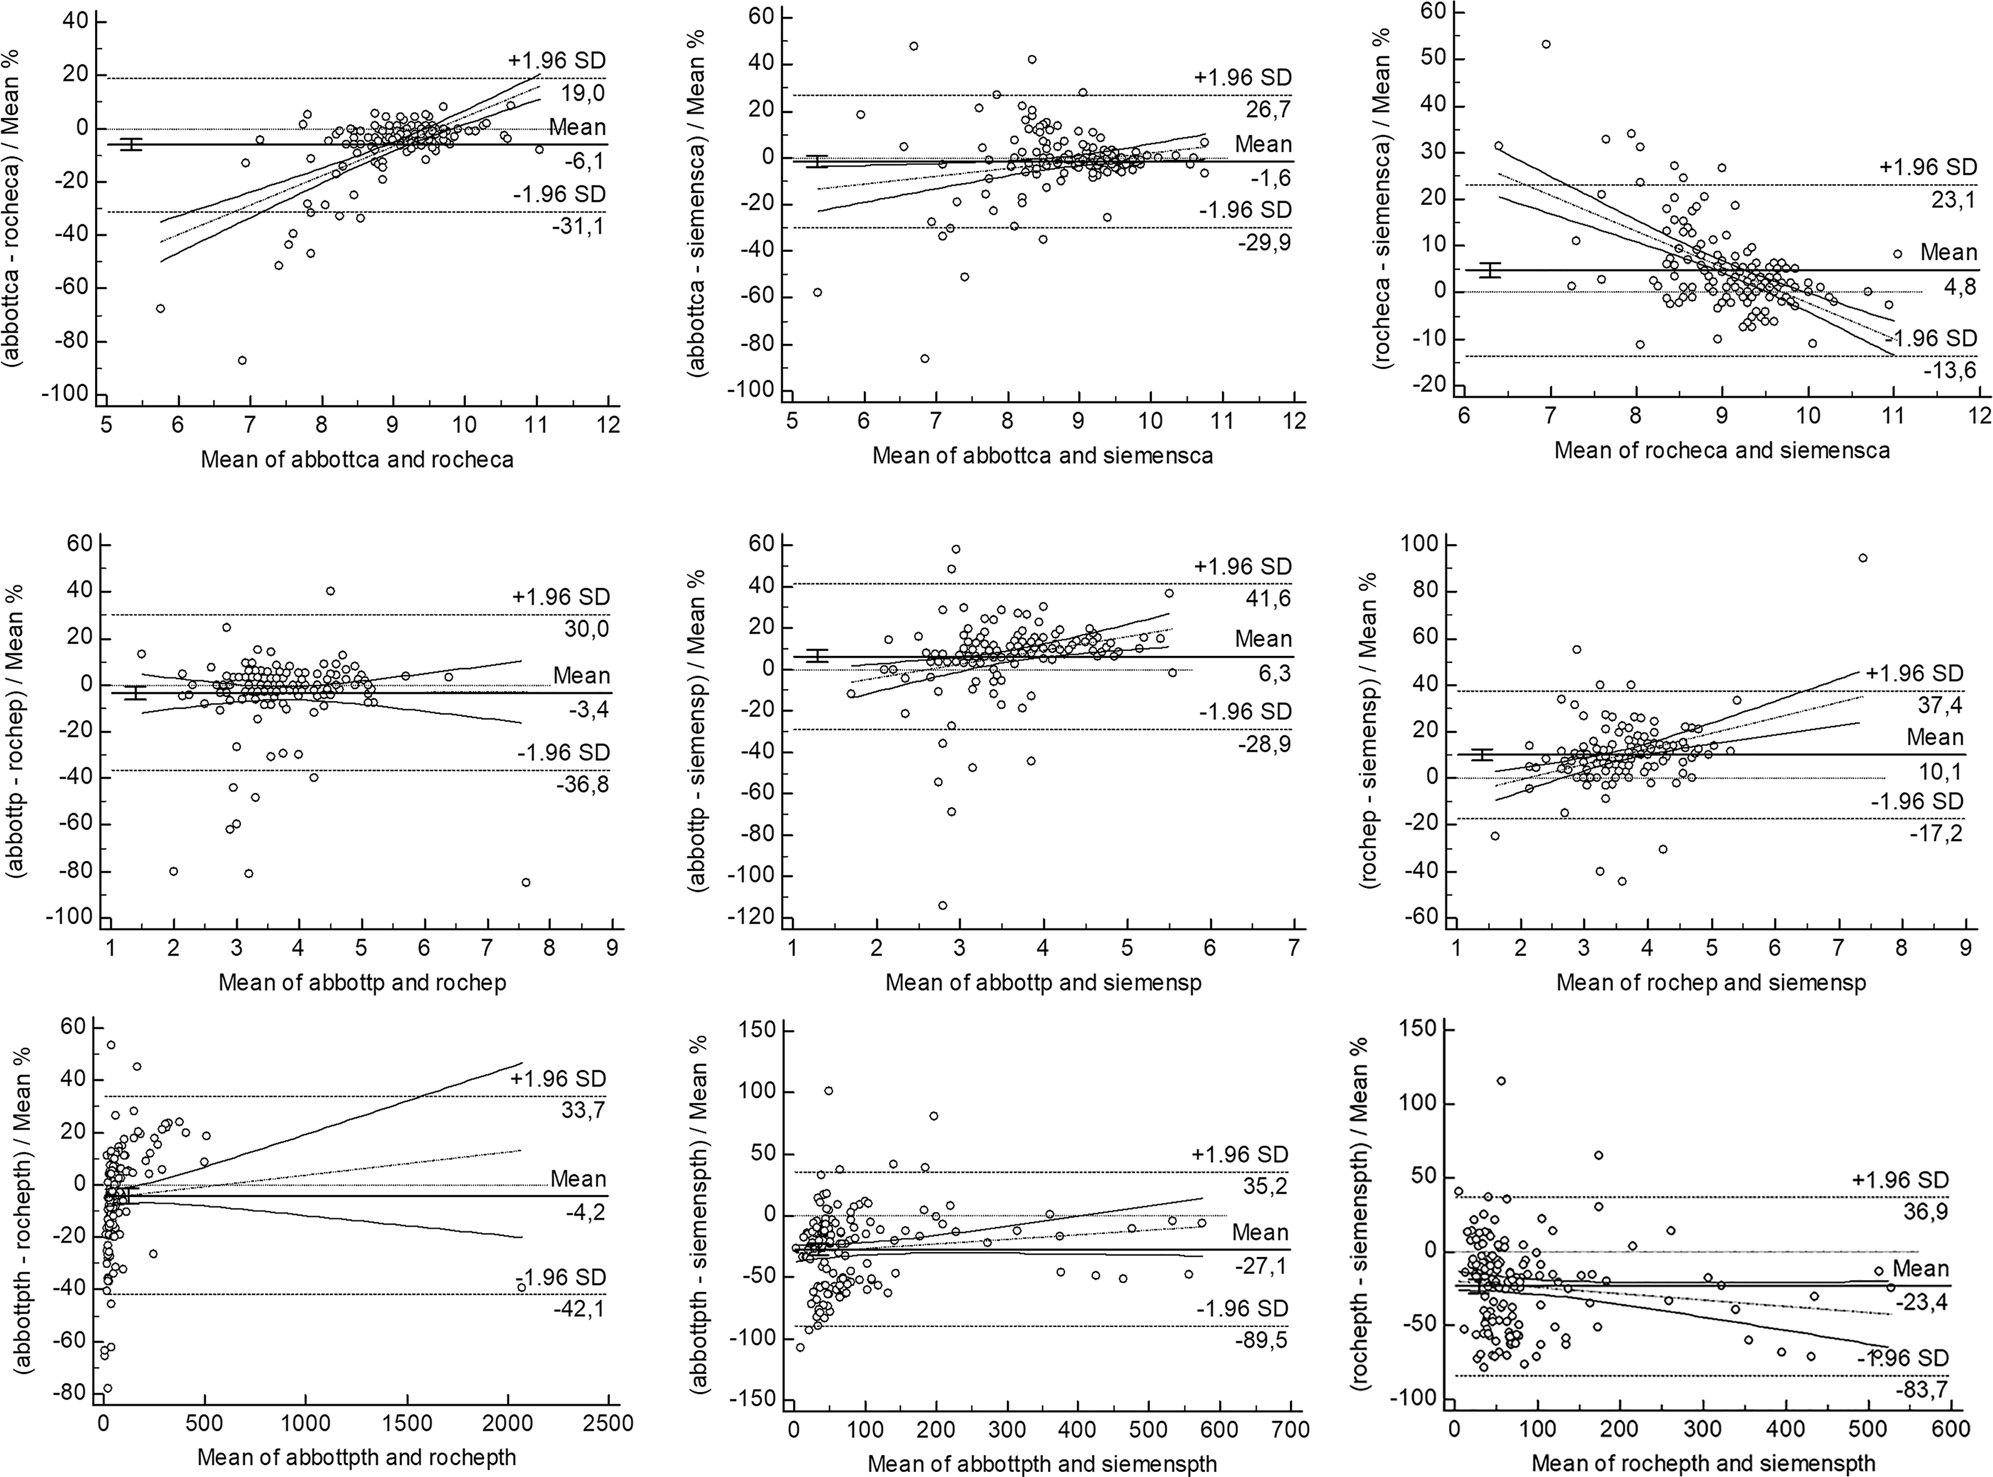
Bland Altman plots between the immunoassay methods with the mean% results (1–3 as Ca, 4–6 as P and 7–9 as PTH).
Confidence intervals of slope and intercept values and correlation values in lineer regression analysis.
| Intercept A | 95% CI | Slope B | 95% CI | Correlation coefficient | |
|---|---|---|---|---|---|
| Roche Ca and Abbott Ca | −3.3667 | −4.925 to (−1.400) | 1.3333 | 1.125–1.500 | 0.636 |
| Siemes Ca and Abbott Ca | −0.1000 | −1.050–1.473 | 1.0000 | 0.826–1.100 | 0.585 |
| Siemes Ca and Roche Ca | 3.8791 | 2.550–4.800 | 0.6036 | 0.500–0.750 | 0.586 |
| Roche P and Abbott P | 0.0000 | −0.276–8.881 | 1.0000 | 1.000–1.076 | 0.805 |
| Siemens P and Abbott P | −0.5696 | −0.800 to (−0.360) | 1.2609 | 1.200–1.333 | 0.750 |
| Siemens P and Roche P | −0.5000 | −0.766 to (−0.184) | 1.2500 | 1.153–1.333 | 0.818 |
| Roche PTH and Abbott PTH | −7.8248 | −10.308 to (−5.779) | 1.1654 | 1.116–1.216 | 0.968 |
| Siemens PTH and Abbott PTH | −2.1613 | −5.718–1.165 | 0.8510 | 0.781–0.909 | 0.873 |
| Siemens PTH and Roche PTH | 4.4177 | 1.621–7.664 | 0.7405 | 0.673–0.793 | 0.876 |
| LCMSMS 25(OH)D and Abbott 25(OH)D | −0.7938 | −2.921–1.118 | 1.0070 | 0.904–1.123 | 0.735 |
| Roche 25(OH)D and Abbott 25(OH)D | 0.9640 | 0.066–1.628 | 1.0773 | 1.024–1.134 | 0.933 |
| Siemens 25(OH)D and Abbott 25(OH)D | −3.5043 | −5,364 to (−2.395) | 1.4645 | 1.378–1.551 | 0.907 |
| Roche 25(OH)D and LCMSMS 25(OH)D | 1.5660 | −0.177–3.130 | 1.0868 | 0.994–1.173 | 0.800 |
| Siemens 25(OH)D and LCMSMS 25(OH)D | −3.8980 | −6.550 to (−1.302) | 1.4962 | 1.331–1.667 | 0.719 |
| Siemens 25(OH)D and Roche 25(OH)D | −4.6281 | −5.703 to (−3.468) | 1.3295 | 1.257–1.418 | 0.907 |
-
Ca, calcium; CI, confidence interval; LCMSMS, liquid chromatography–mass spectrometry; P, phosphorous; PTH, parathyroid hormone; Vit D, vitamin D.
Discussion
As observed in the procedures, 25(OH)D seems not to be an easy analyte measured in laboratories due to its hydrophobic nature and high-affinity binding to DBP [13]. The absence of standardization of the 25(OH)D test via different methods makes it difficult for clinicians to evaluate the test results. The first method used to measure 25(OH)D was performed in 1971 and is the competitive protein binding method where DBP is used [14]. As an advantage of this method, DBP equally recognizes 25(OH)D2 and 25(OH)D3. The disadvantage of the method includes other polar vitamin D metabolites as 24,25(OH)2D, 25,26 (OH)2D, and 23 lactone in the measurement process, and has a long incubation period of 10 days [14], [15], [16]. As another measurement method, HPLC was developed in 1977, and in the method, the measurement can be performed through the absorption of ultraviolet (UV) rays. The most important advantages of HPLC are described as the ability to measure 25(OH)D2 and 25(OH)D3 separately and to discard the interfering substances, lipids, and vitamin D metabolites. However, the most important limitation of the method is the need for an experienced user good at the hardware [14], [15], [16]. While the test of vitamin D has drawn attention in recent years, clinical biochemistry laboratories have begun to prefer automated measurement systems to reduce the workload. The radioimmunoassay (RIA) (Diasorin) method was first developed in 1985, and the method is 100% specific for 25(OH)D3 and 75% for 25(OH)D2. The advantages of the method are described as follows: The method needs no purification of the samples, is easy to use, and has convenient results compatible with HPLC measurement. As in the competitive protein binding method, RIA recognizes equally 25(OH)D2 and 25(OH)D3 metabolites and includes other polar vitamin D metabolites. For this reason, a total of 25(OH)D measurements are increased at a rate of 10–20% [14, 16, 17]. For measuring 25(OH) vitamins, the CMIA method and the ECLIA method were approved and launched by the Food and Drug Administration (FDA) in 2011 and 2012, respectively [18, 19]. Although equally specific for 25(OH)D2 and 25(OH)D3, the ECLIA method is not as cost-effective as the others [14].
There appears to be an ongoing debate about the available methods for measuring the 25(OH)D. Most of the discrepancies associated with the measurements of the reference range for 25(OH)D arise from the flaws healthcare professionals do not follow the recommendations by the International Federation of Clinical Chemistry (IFCC), and the main reason is also that 25(OH)D levels show seasonal changes. Moreover, large differences stemming from the procedures between the methods and laboratories have increased the importance of the accurate measurement of vitamin D levels [20]. In recent years, the measurement of 25(OH)D metabolites has become so important in the evaluation of the homeostasis of Ca, P, and PTH. More recently, the measurement of vitamin D metabolites has been used to define some non-endocrine functions. Therefore, it is necessary to measure both endogenous and exogenous vitamin D metabolites equally in determining vitamin D status [21].
The LC-MS/MS method measures quantitatively 25(OH)D2 and 25(OH)D3; the method uses no radioactive materials and has real outcomes. Nowadays, the mass spectrometry (MS) method is mostly used for research purposes and is not a widely used method in routine clinical settings. Another form of MS is gas chromatography-mass spectroscopy (GC-MS). GC/MS is also used for research purposes in the analysis of vitamin D metabolites and metabolic diseases although the complexity of the method has limited the use of the method in routine laboratory practice [22]. In recent studies investigating LC-MS/MS, the LC-MS/MS method has been proposed as an alternative technique to immunoassay methods, and LC-MS/MS has also been stated to be sensitive and specific for many analytes. Therefore, the LC-MS/MS method is accepted as a reference method in the measuring of 25(OH)D [23].
In a method validation study performed by Sahillioglu et al. the LC-MS/MS method was accepted as the gold standard and the most compatible results with HPLC [11]. In another study where Leino et al. compared the performances of ECLIA with RIA, HPLC, and LC-MS/MS in the measurement of 25(OH)D, the researchers found that the 25(OH)D results were compatible with those of RIA and LC-MS/MS [22].
In the study in which Bauesela et al. analyzed and compared the LC-MS/MS results with those of CMIA and ECLIA in 150 patients, it was detected that the results of both methods were compatible with those of LC-MS/MS in terms of the correlation and coefficient of agreement [23]. In another study, Vogrinc et al. compared the HPLC and ECLIA methods in terms of the measurement of vitamin D and found that the ECLIA method showed a better correlation and compatibility with HPLC [24]. However, in the study by Wyness et al., six automated 25(OH)D immunometers were compared with the LC-MS/MS method, and the researchers reported that only two immune-measuring devices met the recommended bias criteria (<5%) [25]. In our study, a significant correlation was found between the results of the measurements of 25(OH)D obtained by four methods (p<0.05). We consider that the differences between the four methods may be due to the matrix effect (protein in the plasma sample, pH, ionic concentration, or denaturing agents used in immunoassays) or the differences in cross-reactions with vitamin D metabolites. In various studies, the researchers stated that the automated immunoassays are susceptible to being affected by the matrix and may be the cause of unexpected high results [14], [15], [16].
In a study by Kocak et al. a statistical difference was found between the Abbott Architect and LCMS/MS measurements at high concentrations. Moreover, Kocak et al. showed that the Roche device had a better performance than the Abbott device [26]. In another study carried out by Farrell et al., an average deviation was demonstrated between the Abbott Architect and LC-MS/MS methods as 40.9% in all study samples with the concentration ranging from 5.0 to 151.0 nmol/L, and also an average deviation of 104.5% for the samples with concentrations below 20.0 nmol/L [27]. In the study by Denimal et al. a positive bias was determined between the Abbott Architect and LC-MS/MS (n=200). The same study also compared the Siemens Diasorin and LC-MS/MS methods and found that there is a significant deviation in 1.25(OH)2D concentrations and 1.25(OH)2D measurements, so it can be inferred that the method used to measure vitamin D be further standardized [28].
The information obtained from the linear regression equations shows the following differences between the results of LCMS/MS and immunoassay methods: R2 of a random error between the methods and differences in gradient suggest a proportional error between the methods, and significant intersections may be attributed to the fixed error. To obtain an ideally perfect harmony, the R2 for the two methods should be 1.0, and the gradient and intersections should be 1.0 and 0.0, respectively. We consider that the acceptable method performance should be as the R2 term of 0.95 and higher, a gradient of 1.0 ± 0.05, and the intercept of ± 5 nmol/L (ng/mL). The methodological principles and chromatography analysis used for the immunoassays are different, and the sources and types of error also depend on the analytical measurement methods [29].
In our study, the correlation coefficients were found as LC-MS/MS via Siemens ADVIA Centaur XPT (R2=0.721), LC-MS/MS via Roche Cobas e601 (R2=0.799), and LC-MS/MS via Abbott Architect (R2=0.799). Our results revealed an unacceptable method performance between LC-MS/MS and immunoassays (Table 1). In immunoassays, antibody binding caused a random error due to the interference from small changes in the protein concentration, pH, and ionic charge of the matrix, in which the analyte was measured. All of the immunoassay challenges arose from the presence of interfering compounds and matrix problems. Interfering substances are common in immunoassay methods, and those compounds generally have a chemical structure similar to the analyte being measured, and so they are the compounds binding to the antibody. Moreover, proteins or antibodies in a particular patient sample can change antibody binding, thus affecting the analytical value for a particular sample. These proteins or antibodies are not present in all of the patients’ samples; however, when found in the sample, 25(OH)D results of the patients may be changed. Such errors are generally specific to the sample and not observed to the same extent in every sample. Therefore, the interference with immunoassays may be a random event [30].
Other findings of our study arising from the comparisons of the immune measurement methods among themselves were detected as Roche Cobas e601-Siemens ADVIA Centaur XPT (R2=0.906), Siemens ADVIA Centaur XPT-Abbott Architect (R2=0.907), and Abbott Architect-Roche Cobas e601 (R2=0.934). Based on our findings, a high positive correlation and coefficient of concordance were determined between the immune measurements. As another finding, we determined that the correlation coefficient was significantly higher and close to that among all auto analyzers, compared with that of LC-MS/MS. Theoretically, there may have been various reasons for random errors and systematic differences between the findings of auto analyzers and LCMS/MS. The LC-MS/MS method may have ignored the exact measurement of 1.25(OH)2D2 concentration. It should be also noted that 1.25(OH)2D2 levels in all samples were below the detection limit of the LC-MS/MS method as 12 pg/mL. Besides, a study reported that even in individuals not taking vitamin D supplements, food-based 25(OH)D2 levels were averaged as 1.4 ng/mL [31]. While the small amounts of 1.25 (OH)2D were found in the circulation in most individuals, these levels may have been below the detection limit of the LC-MS/MS method. Since autoanalysers measure both 1.25 (OH)2D2 and 1.25 (OH) 2D3, this may explain why the total 1.25(OH) 2D level was higher than an average of 3 pg/mL than the LC-MS/MS method. However, the sample extraction for the LC-MS/MS method may have removed the interfering substances, and the residual effects leading to ion suppression should not be precisely ignored. As a percentage, such a situation may explain why the LC-MS/MS method shows a large downward bias for some samples at different concentrations. Finally, the unknown cross-reactants may have caused an increase of 1.25(OH)2D measured in the autoanalyzer. As regarding the exact 25(OH)D measurement, it appears that verification and standardization are necessary to obtain comparable and reliable results. In a study where La’ulu et al. investigated the performance characteristics of six intact PTH assays, the total coefficients of variation were found as 10.9%, the maximum deviation from the target recovery for linearity was ranged between 5.0 and 82.2% [30], which those findings were similar with our study results. In another study, a significant inverse association was found between iPTH and 25(OH)D, and the study suggested that the inflection point of serum 25(OH)D level for maximal suppression of PTH was at 30 ng/mL [31]. In another recent study, it has also been reported that upper reference limits (URL) for PTH in vitamin D sufficiency/insufficiency were similar to and lower than the current values. In the study, the elevations in PTH were observed in vitamin D deficiency, and it was proposed that the revised reference ranges with a higher URL could be appropriate [32].
From the present study, we consider that the correlation between the measurements through LC-MS/MS and auto analyzers is acceptable, at least in routine clinical settings. The measurement of 25(OH)D by immunoassay methods is preferred due to such reasons as speed, convenience, turnaround time, and cost-effectiveness. Immunoassays require less sample volume and less experience, compared to the LC-MS/MS method. Moreover, these methods require no pretreatment modalities, and it is possible to process more samples with less labor force. So, we consider that further standardization studies are required to increase the reliability and comparability of 25(OH)D testing procedures.
Limitations
The study population included no sera from the patients with vitamin D poisoning, hypercalcemia, or other causes, which is an important reason to measure 25(OH)D. In the study, the plasma samples of the patients were evaluated, and no serum samples were taken into consideration. The Roche Cobas assay showed a better performance than other assays. From the results, chemiluminescence methods in automated systems seem to be expedient.
Funding source: Research Fund of the Selcuk University
Award Identifier / Grant number: Project number: 19401119
Acknowledgments
The authors thank the laboratory employees of Karapınar State Hospital for performing all analyses and Numan Duran for language editing.
-
Research funding: The research was supported by the Research Fund of Selcuk University (project no: 19401119) in Konya, Turkey. The funders had no role in study design, data collection, and analysis, decision to publish, or preparation of the manuscript.
-
Author contributions: All authors have accepted responsibility for the entire content of this manuscript and approved its submission and contributed to the study at an equal rate.
-
Competing interests: The authors declare not conflict of interest.
-
Ethical approval: The work described in the article has been carried out under The Code of Ethics of the World Medical Association and the Declaration of Helsinki for the experiments involving humans, the Uniform Requirements for the manuscripts submitted to Biomedical Journals. The study was approved by the non-interventional clinical trials ethics committee of the Selcuklu Faculty of Medicine in Selcuk University (approval no: 2019/162).
References
1. Holick, MF. Sunlight and vitamin D for bone health and prevention of autoimmune diseases, cancers, and cardiovascular disease. Am J Clin Nutr 2004;80:1678–88. https://doi.org/10.1093/ajcn/80.6.1678s.Suche in Google Scholar PubMed
2. Dusso, AS, Brown, AJ, Slatopolsky, E. Vitamin D. Am J Physiol Ren Physiol 2005;289:8–28. https://doi.org/10.1152/ajprenal.00336.2004.Suche in Google Scholar PubMed
3. MacDonald, MH, Seshia, MMK, Mullet, MD, editors. Avery’s neonatology pathophysiology & management of the newborn, 6th ed. Philadelphia: Lippincott W&W; 2005:847–75 pp.Suche in Google Scholar
4. Chapuy, MC, Arlot, ME, DuBoeuf, F, Brun, J, Crouzet, B, Arnaud, S, et al.. Vitamin D3 and calcium to prevent hip fractures in elderly women. N Engl J Med 1992;327:1637–42. https://doi.org/10.1056/nejm199212033272305.Suche in Google Scholar
5. Holick, MF. Vitamin D deficiency. N Engl J Med 2007;357:266–81. https://doi.org/10.1056/nejmra070553.Suche in Google Scholar PubMed
6. Bouillon, R. Vitamin D: from photosynthesis, metabolism, and action to clinical applications. In: DeGroot, LJ, Jameson, JL, editors. Endocrinology. Philadelphia: W.B. Saunders; 2001:1009–28 pp.Suche in Google Scholar
7. Pearce, SH, Cheetham, TD. Diagnosis and management of vitamin D deficiency. BMJ 2010;340:142–7. https://doi.org/10.1136/bmj.b5664.Suche in Google Scholar PubMed
8. Ross, AC, Manson, JE, Abrams, SA, Aloia, JF, Brannon, PM, Clinton, SK, et al.. The 2011 report on dietary reference intakes for calcium and vitamin D from the institute of medicine: what clinicians need to know. J Clin Endocrinol Metab 2011;96:53–8. https://doi.org/10.1210/jc.2010-2704.Suche in Google Scholar PubMed PubMed Central
9. Quaggiotto, P, Tran, H, Bhanugopan, M. Vitamin D deficiency remains prevalent despite increased laboratory testing in New South Wales, Australia. Singap Med J 2014;55:271–80. https://doi.org/10.11622/smedj.2014071.Suche in Google Scholar PubMed PubMed Central
10. French, D, Gorgi, AW, Ihenetu, KU, Weeks, MA, Lynch, KL, Wu, AH. Vitamin D status of county hospital patients assessed by the DiaSorin LIAISON® 25-hydroxyvitamin D assay. Clin Chim Acta 2011;412:258–62. https://doi.org/10.1016/j.cca.2010.10.013.Suche in Google Scholar PubMed
11. Sahillioğlu, B, Muhittin, A, Serdar, AM, Erkal, N, Erden, G, Bakır, F, et al.. Özuğuz U Method validation of tandem mass spectrometry for 25-Hydroxyvitamin D3 and comparison of this method with other methods. Turk J Biochem 2011;36:73–9.Suche in Google Scholar
12. Chen, Y, Kinney, L, Bozovic, A, Smith, H, Tarr, H, Diamandis, EP, et al.. Performance evaluation of Siemens ADVIA Centaur and Roche modular analytics E170 total 25-OH vitamin D assays. Clin Biochem 2012;45:1485–90. https://doi.org/10.1016/j.clinbiochem.2012.06.002.Suche in Google Scholar PubMed PubMed Central
13. Zerwekh, JE. The measurement of vitamin D: analytical aspects. Ann Clin Biochem 2004;41:272–81. https://doi.org/10.1258/0004563041201464.Suche in Google Scholar PubMed
14. Holick, MF. Vitamin D status: measurement, interpretation and clinical application. Ann Epidemiol 2009;19:73–8. https://doi.org/10.1016/j.annepidem.2007.12.001.Suche in Google Scholar PubMed PubMed Central
15. Horst, RL, Hollis, BW. Vitamin D assays and their clinical utility. In: Holick, MF, editor. Physiology, molecular biology, and clinical applications. Totowa, NJ: Humana Press Inc; 1999:239–71 pp.Suche in Google Scholar
16. Hollis, B. The determination of circulating 25-hydroxyvitamin D: no easy task. J Clin Endocrinol Metab 2004;89:3149–51. https://doi.org/10.1210/jc.2004-0682.Suche in Google Scholar PubMed
17. Wendy, LA, Dean, LA, Pharm, D. Current methods for routine clinical laboratory testing of vitamin D levels. Lab Med 2013;44:e38–42. https://doi.org/10.1309/lmonqzq27tin7xfs.Suche in Google Scholar
18. Heaney, RP, Dowell, MS, Hale, CA, Bendich, A. Calcium absorption varies within the reference range for serum 25-hydroxyvitamin D. J Am Coll Nutr 2003;22:142–6. https://doi.org/10.1080/07315724.2003.10719287.Suche in Google Scholar PubMed
19. Holick, MF. Vitamin D. Importance in the prevention of cancers, type 1 diabetes, heart disease, and osteoporosis. Am J Clin Nutr 2004;79:362–71. https://doi.org/10.1093/ajcn/79.3.362.Suche in Google Scholar PubMed
20. Coldwell, RD, Trafford, DJ, Varley, MJ, Kirk, DN, Makin, HL. Measurement of 25-hydroxyvitamin D2, 25-hydroxyvitamin D3, 24, 25-dihydroxyvitamin D2, and 25, 26-dihydroxyvitamin D3 in a single plasma sample by mass fragmentography. Clin Chim Acta 1989;180:157–68. https://doi.org/10.1016/0009-8981(89)90347-1.Suche in Google Scholar PubMed
21. Vogeser, M, Kyriatsoulis, A, Huber, E, Kobold, U. Candidate reference method for the quantification of circulating 25-hydroxyvitamin D3 by liquid chromatography-tandem mass spectrometry. Clin Chem 2004;50:1415–7. https://doi.org/10.1373/clinchem.2004.031831.Suche in Google Scholar PubMed
22. Leino, A, Turpeinen, U, Koskinen, P. Automated measurement of 25-OH vitamin D3 on the Roche modular E170 analyzer. Clin Chem 2008;54:2059–62. https://doi.org/10.1373/clinchem.2008.111732.Suche in Google Scholar PubMed
23. Bausela, C, Gavina, B, Ortega, I, Torrejon, M, Arroyo, M. Comparison of total 25-OH vitamin D automated immunoassays versus LC-MS/MS. Biochem Med 2012;22:A198.Suche in Google Scholar
24. Vogrinc, Z, Lovric, M, Sertic, J. Evaluation of an automated method for measurement of serum 25-hydroxyvitamin D. Biochem Med 2012;22:A199.Suche in Google Scholar
25. Wyness, SP, Straseski, JA. Performance characteristics of six automated 25-hydroxyvitamin D assays: mind your 3s and 2s. Clin Biochem 2015;48:1089–96. https://doi.org/10.1016/j.clinbiochem.2015.08.005.Suche in Google Scholar PubMed
26. Kocak, F, Ozturk, B, Isiklar, OO, Unlu, A, Altuntas, II. A comparison between two different automated total 25-hydroxyvitamin D immunoassay methods using liquid chromatography-tandem mass spectrometry. Biochem Med 2015;25:430–8. https://doi.org/10.11613/bm.2015.044.Suche in Google Scholar PubMed PubMed Central
27. Farrell, CJ, Martin, S, McWhinney, B, Straub, I, Williams, P, Herrmann, M. State-of-the-art vitamin D assays: a comparison of automated immunoassays with liquid chromatography-tandem mass spectrometry methods. Clin Chem 2012;58:531–42.10.1373/clinchem.2011.172155Suche in Google Scholar PubMed
28. Denimal, D, Ducros, V, Dupré, T, Dousset, B, Meunier, C, Aho, S, et al.. Agreement of seven 25-hydroxy vitamin D3 immunoassays, and three high-performance liquid chromatography methods with liquid chromatography-tandem mass spectrometry. Clin Chem Lab Med 2014;52:511–20.10.1515/cclm-2013-0434Suche in Google Scholar PubMed
29. Cashman, KD, Kinsella, M, McNulty, BA, Walton, J, Gibney, MJ, Flynn, A, et al.. Dietary vitamin D2-a potentially underestimated contributor to vitamin D nutritional status of adults. Br J Nutr 2014;112:193–202. https://doi.org/10.1017/s0007114514000725.Suche in Google Scholar PubMed
30. La’ulu, SL, Roberts, WL. Performance characteristics of six intact parathyroid hormone assays. Am J Clin Pathol 2010;134:930–8. https://doi.org/10.1309/ajcplgczr7ipvha7.Suche in Google Scholar PubMed
31. Sahin, ON, Serdar, M, Serteser, M, Unsal, I, Ozpinar, A. Vitamin D levels and parathyroid hormone variations of children living in a subtropical climate: a data mining study. Ital J Pediatr 2018;44:40. https://doi.org/10.1186/s13052-018-0479-8.Suche in Google Scholar PubMed PubMed Central
32. Yalla, N, Bobba, G, Guo, G, Stankiewicz, A, Ostlund, R. Parathyroid hormone reference ranges in healthy individuals classified by vitamin D status. J Endocrinol Invest 2019;42:1353–60. https://doi.org/10.1007/s40618-019-01075-w.Suche in Google Scholar PubMed PubMed Central
Supplementary Material
The online version of this article offers supplementary material (https://doi.org/10.1515/tjb-2021-0105).
© 2022 the author(s), published by De Gruyter, Berlin/Boston
This work is licensed under the Creative Commons Attribution 4.0 International License.
Artikel in diesem Heft
- Frontmatter
- Review Article
- The implication of molecular markers in the early stage diagnosis of colorectal cancers and precancerous lesions
- Research Articles
- What are the predominant parameters for Down syndrome risk estimation in first-trimester screening: a data mining study
- Comparison between liquid chromatography-tandem mass spectrometry and immunoassay methods for measurement of plasma 25 (OH) vitamin D
- Comparison of Barricor tube and serum separator tube in outpatients
- Effect of hemoglobin, triglyceride, and urea in different concentrations on compatibility between methods used in HbA1c measurement
- Evaluation of hemolysis interference and possible protective effect of N-phenyl maleimide on the measurement of small peptides
- Neuroprotective and metabotropic effect of aerobic exercise training in female patients with type 2 diabetes mellitus
- Serum asprosin levels in patients with retinopathy of prematurity
- Neutrophil/lymphocyte and platelet/lymphocyte ratios as a biomarker in postoperative wound infections
- Relationship between dental caries and saliva’s visfatin levels, total antioxidant capacity (TAC) and total oxidant status (TOS)
- Might periostin serve as a marker of bone marrow involvement in patients with diffuse large B-cell lymphoma?
- A new approach for the pleiotropic effect of metformin use in type 2 diabetes mellitus
- IGFBP7 is a predictor of diuretic-induced acute kidney injury in the patients with acute decompensated heart failure
- Serum vitamin D receptor and fibroblast growth factor-23 levels in postmenopausal primary knee osteoarthritis patients
- Antioxidant activity of ethanol extract and fractions of Piper crocatum with Rancimat and cuprac methods
- Lycorine impedes 7,12-dimethylbenz(a)anthracene exposed hamster oral carcinogenesis through P13K/Akt and NF-κB inhibition
- Sublethal effects of acrylamide on thyroid hormones, complete blood count and micronucleus frequency of vertebrate model organism (Cyprinus carpio)
- Acknowledgment
- Acknowledgment