An efficient nanofiltration system containing mixture of rice husk ash and Fe/CeO2–SiO2 nanocomposite for the removal of azo dye and pesticide
-
Zubaida Khalil


Abstract
Fe/CeO2–SiO2 nanocomposite was synthesized by using zwitterionic surfactant 3-(N,N-dimethyloctadecylammonio) propane sulfonate (SB3-18) by sol–gel and hydrothermal methods. The nanocomposite was well characterized before its use. X-ray diffraction (XRD) results confirmed the synthesis of the Fe/CeO2–SiO2 nanocomposite. Crystallite size calculated by using Scherrer equation was 5.33 nm while it was found 5.26 nm by Williamson–Hall equation. Bandgap of Fe/CeO2–SiO2 nanocomposite shows redshift after the doping of Fe. Degradation studies of methylene blue (MB) and chlorpyrifos (CP) were investigated by nanofiltration (NF) column under visible light irradiation. Degradation and adsorption of MB was investigated by three different types of columns under visible light irradiation. It was observed to achieve 100 % removal of MB and 91 % of CP through column in which rice husk ash (RHA) slurry was mixed with the nanocomposite.
Introduction
Water pollution in Pakistan is increasing day by day due to the excessive usage of pollutants like pesticides [1], dyes [2] used in agriculture and textile, cosmetic and paper industries [3] which are polluting the surface and groundwater rapidly. In Pakistan major sources of sewage water are the municipal and industrial effluents. The total wastewater discharged by the industries is 75 771 million gallons/year. But unfortunately, only 3 % of wastewater is treated while the remaining water is directly drained into the freshwater bodies without any treatment [4]. More than 145 commercially available active substances of pesticides are registered in Pakistan [5]. Major uses of pesticides in Pakistan for cotton (61.92 %) [6], fruits and vegetables (12 %) [7], and rice (11.8 %) [8]. It is reported that only 0.1 % of the pesticide reached on its target while the remaining seeps into the soil and leach into the groundwater [9]. In Pakistan, different types of pesticides were detected in groundwater samples like dichlorodiphenyltrichloroethane (DDT) [10], [11] cyhalothrin, monocrotophos, and endrine however DDT concentration (1.06 mg/mL) was found 10 times more than the concentration set by the European Community [10].
Dyes have carcinogenic effects on humans [12] while pesticides cause hormonal dysfunctions and cancer in humans [13]. Besides this they also become a major threat to freshwater and marine life [14]. The conventional methods such as bio-filtration, carbon adsorption, and coagulation are not effective for the complex aromatic structures removal [15]. Nowadays advanced filtration techniques are more efficient than conventional methods such as microfiltration (MF), ultrafiltration (UF), reverse osmosis (RO), and nanofiltration (NF) which are used for the removal and degradation of dye. However, NF is more efficient technique than MF, UF, RO. MF unable to remove viruses and dissolved substances, UF may remove viruses but unable to remove dissolved substances, RO removes all dissolved substances, viruses and also monovalent ions so it desalinates the water and also a significant amount of pressure is also required to force filtration, while NF is the most feasible techniques because it removes all bacteria, viruses, and range of salts thus it softens the hard water [16]. Nanostructured semiconductors cerium oxide (CeO2), silicon dioxide (SiO2) [17], and iron (Feo) [18] are the promising materials for the complete adsorption and degradation of agriculture and industrial effluents due to high surface area and high stability in water without any production of waste products [19]. One more reason for efficient degradation of organic pollutant is due to the formation of oxygen vacancy in cubic fluorite crystal structure of CeO2 [20] in order to increase the catalytic activity of CeO2 it combines with another metal oxide to form the nanocomposite and doped by any transition metal of variable valency like Ag, Ni, and Fe [21] results in lowers the energy formation of the oxygen vacancy thus confirmed their usage for the degradation of organic pollutants [22]. Fe is considered to be the most promising metal for doping because it can easily substitute into the interstices of the crystal lattice [23] thus leading to the formation of acceptor or donor bands between the valence and conduction band [24]. The combination of CeO2 with SiO2 doped by Fe lead to high thermal stability [18] increase the surface area with the decrease in particle size and increase in oxygen vacancy concentration which lead to an increase in photocatalytic activity of the nanocomposite.
Nature of the surfactant played an important role to control the size, shape and morphology of the nanocomposite. The particles are well dispersed at critical micelle concentration (CMC) because they act as framing agent at their CMC values. Small particle size was observed at their CMC values [25]. The advantage of using zwitterionic surfactant on anionic and cationic surfactant is that it contains both negative and positive charges in their head group so it binds with both positive charges (metal precursor) and negative charges (hydroxyl group) results in the cease of nucleation at initial stage results in small particle size obtained as compared to cationic and anionic surfactant [26].
The present work is aimed to achieve a highly efficient and effective NF column packed by Fe/CeO2–SiO2 nanocomposite and rice husk ash (RHA) as low-cost adsorbent for the adsorption and degradation of methylene blue (MB), and chlorpyrifos (CP) from wastewater. Plant waste material (rice husk) and nanocomposite facilitate the removal of pollutants. The CeO2–SiO2 nanocomposite was prepared by sol–gel and then Fe was doped by hydrothermal method.
Materials and methods
Chemicals and reagents
Chemical used were Hydrochloric acid HCl (Analytical grade), Sodium hydroxide (NaOH), Cerium (III) chloride heptahydrate CeCl3·7H2O (Sigma Aldrich), Iron (III) chloride hexahydrate (FeCl3·6H2O), 3-(N,N-Dimethyloctadecylammonio) propane sulfonate: SB3-18 (Sigma Aldrich), MB (Sigma Aldrich), CP (Sigma Aldrich). All chemicals were used without any further purification. Rice husk was taken from Al-Hameed Mills, Gujranwala, Pakistan.
Synthesis of Fe/CeO2–SiO2 nanocomposite
Fe/CeO2–SiO2 nanocomposite was synthesized in three steps by sol–gel method followed by hydrothermal method. In first step SiO2 was synthesized, in second step CeO2–SiO2 nanocomposite was synthesized than in third step Fe/CeO2–SiO2 nanocomposite was synthesized.
Synthesis of SiO2 nanoparticles
Seventeen grams of Rice husk was taken and washed it with tape water thrice and then with distilled water to remove dust particles, contaminations, and water-soluble impurities then dried under shade at room temperature after that it was placed in an oven at 80 °C for 1 h. The dried material was refluxed in 250 mL of 10 % HCl solution for 2 h. It was washed with distilled water until pH 7 was obtained. Then it was air-dried and placed in the oven at 80 °C for 1 h. The dried rice husk calcined at 700 °C for 2 h to remove all hydrocarbons. After calcination, white crystals were obtained. These white crystals are called as RHA.
Two gram white crystals (RHA) were refluxed in 30 mL 10 % HCl solution for 2 h then centrifuged and washed with distilled water until pH 7 and dried in the oven at 80 °C for 18 h. Silica white ash was obtained.
About 0.5 g of silica ash was taken and refluxed for 2 h with 15 mL of 1 M NaOH solution to dissolve silica ash. A clear solution of sodium silicate (Na2SiO3) was obtained which then centrifuged at 8000 rpm for 1 min to remove non-reactive impurities. A clear solution of sodium silicate was obtained which is then neutralized with 1 N HCl solution added drop-wise until the gel was formed at pH 7. The gel was aged for 24 h allowing the silica to precipitate then 25 mL of distilled water was added to make the slurry. The slurry was centrifuged at 8000 rpm for 2 min then washed several time with distilled water, followed by drying at 80 °C for 22 h to remove the solvent. The obtained pellet was crushed; white powder of SiO2 xerogel was obtained with a 95 % yield.
Synthesis of CeO2–SiO2 nanocomposite
About 0.06 mM of SB3-18 surfactant was taken in 5 mL of distilled water and sonicated for 30 min. Twenty millimolar of SiO2 nanoparticles and 20 mM of CeCl3·7H2O was taken in 5 mL distilled water and was placed on stirring on a hotplate. After 30 min the surfactant solution was charged into the salt solution and stirred for 30 min. Forty millimolar NaOH solution was made in distilled water and added into the salt solution at a feed rate of 0.5 mL/5 min until pH 9 was obtained. It was then centrifuged at 12 000 rpm for 2 min and washed with several times with distilled water and then dried at 50 °C for 16 h. The color of obtained pellet was yellowish. The pellet was crushed into powder and then calcined at 600 °C for 4 h. The obtained powder was CeO2–SiO2 nanocomposite.
Synthesis of Fe/CeO2–SiO2 nanocomposite
Twenty-four millimolar of CeO2–SiO2 nanocomposite was stirred for 30 min. After that solution of 4 mM of FeCl3·6H2O was added into the nanocomposite solution and stirred for 30 min. The solution was then transferred into the Teflon-lined autoclave and placed in an oven at 180 °C for 3 h. Then the product was centrifuged at 13 000 rpm for 4 min and washed several times with distilled water until pH 7, dried at 80 °C for 16 h. The obtained pellet was crushed and calcined at 700 °C for 3 h. The calcined product was Fe/CeO2–SiO2 nanocomposite.
Removal of methylene blue (MB) with nanofiltration columns
Preparation of slurry
Fifteen grams of rice husk was washed several times with distilled water to remove dust particles and other impurities. Then it was calcined at 700 °C for 2 h, 2 g of brownish-white needles obtained. These needles were ground in mortar and pestle and then distilled water was added in it to make the slurry. The NF column was packed in three different ways (Fig. 1).
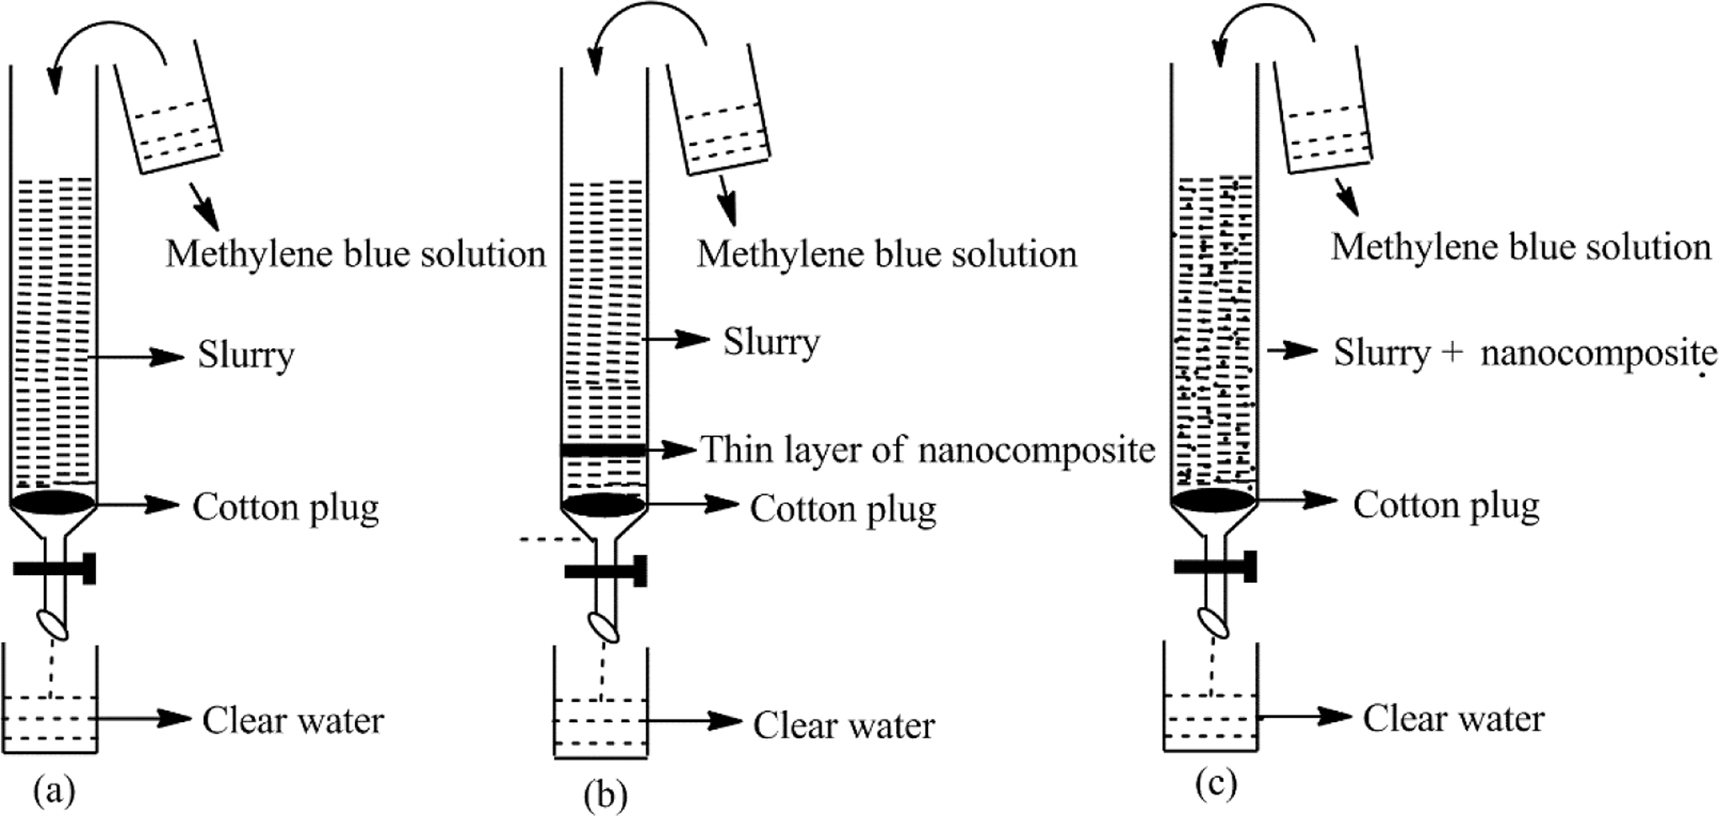
Packing of column (a) with RHA slurry (b) with nanocomposite with two layers of RHA slurry (c) with nanocomposite mixed with RHA slurry.
Column with RHA slurry
In column, Fig. 1(a) firstly set a small ball of cotton at the bottom and then poured the mass of 1 g of ground RHA slurry into the column with a height of 3 cm.
Column with nanocomposite with two layers of RHA slurry
In column (b), firstly set a small ball of cotton at the bottom of the glass column. The slurry of a mass of 1 g of ground RHA was prepared. A solution of 10 mg of Fe/CeO2–SiO2 nanocomposite was made in 10 mL distilled water. Poured 0.1 g of the RHA slurry then 10 mg of Fe/CeO2–SiO2 nanocomposite and then the remaining 0.9 g of RHA slurry as shown in Fig. 1(b) into the column to make the bands at a height of up to 3 cm. Fe/CeO2–SiO2 nanocomposite makes a thin sandwich layer between two layers of RHA slurry.
Column with nanocomposite mixed with RHA slurry
In column (c), firstly set a small ball of cotton at the bottom of the glass column. In this method, the column was packed by mixing 10 mg of Fe/CeO2–SiO2 nanocomposite with the RHA slurry of 1 g of ground RHA and then poured the mixture of slurry and nanocomposite into the column up to 3 cm as shown in Fig. 1(c).
All the columns were rinsed thoroughly with distilled water to remove the dissolved materials and colored impurities if any. The absorbance of the eluates was taken at λmax 665 nm after a specific time of intervals by Agilent Cary-60 UV–visible spectrophotometer. The temperature of 25 °C was maintained by passing water in a double jacket cooling array attached to the spectrophotometer. The percentage of degradation of MB was examined by eq. 1 [27].
where At is the concentration of MB at specific time interval (t) and Ao is the initial concentration of MB.
Removal of chlorpyrifos with nanofiltration column
Removal of CP pesticide was studied by Fe/CeO2–SiO2 nanocomposite in the NF column. For degradation, a stock solution of 5 ppm of CP was prepared in methanol and water with a ratio of 1:3. The prepared solution was passed through the same column (Fig. 1). The absorbance of the eluates was taken at λmax 290 nm after a specific time of intervals. The percentage of degradation of CP was examined by using eq. 1.
Characterization
The functional groups analysis of synthesized Fe/CeO2–SiO2 nanocomposite was done by fourier transform infrared spectroscopy (FTIR) (model V MIDAC 2000) with KBr powder. The crystalline determination was done by using powder X-ray diffractometer (Xpert Pro Panalytical) at 2θ range 20–80° with 4°/min scan speed by using CuKα (0.154 nm) radiation reflection mood. The morphology and composition of nanocomposite was determined by FEI quanta 200 F scanning electron microscope (SEM-EDX). Optical properties of nanocomposite were determined by UV–visible spectrophotometer (model Agilent Cary-60). Thermogravimetric analysis (TGA) was determined at a temperature range of 0–1200 °C by TA instrument (TA instrument, SDT Q600).
Results and discussion
Powder X-ray diffraction (XRD)
X-ray diffraction (XRD) pattern of Fe/CeO2–SiO2 nanocomposite in Fig. 2 showed that CeO2 is present in cubic flourite crystal structure. The diffraction peaks located at 2θ = 28.7°, 32.6°, 47.4°, 56.5°, 69.4° and 76.7° with hkl value (111), (200), (220), (331), (400) and (331) corresponds to CeO2, all peaks are perfectly indexed with JCPDS card no. 03-065-5923 [27]. Peak at 2θ = 78.090 attributed to (110) corresponds to cubic structure of Fe [28] matched with JCPDS card no. 00-006-0696. No other potential phase of impurity such as FeCeO3, Fe2O3 was observed which is confirmed by the absence of peak at 24.2° and 35.3° [29]. Diffraction peak at 2θ = 58.4° with hkl of (110) with quartz structure of SiO2. The crystal system of SiO2 is hexagonal which is perfectly matched with JCPDS card no. 01-081-0066 [28].
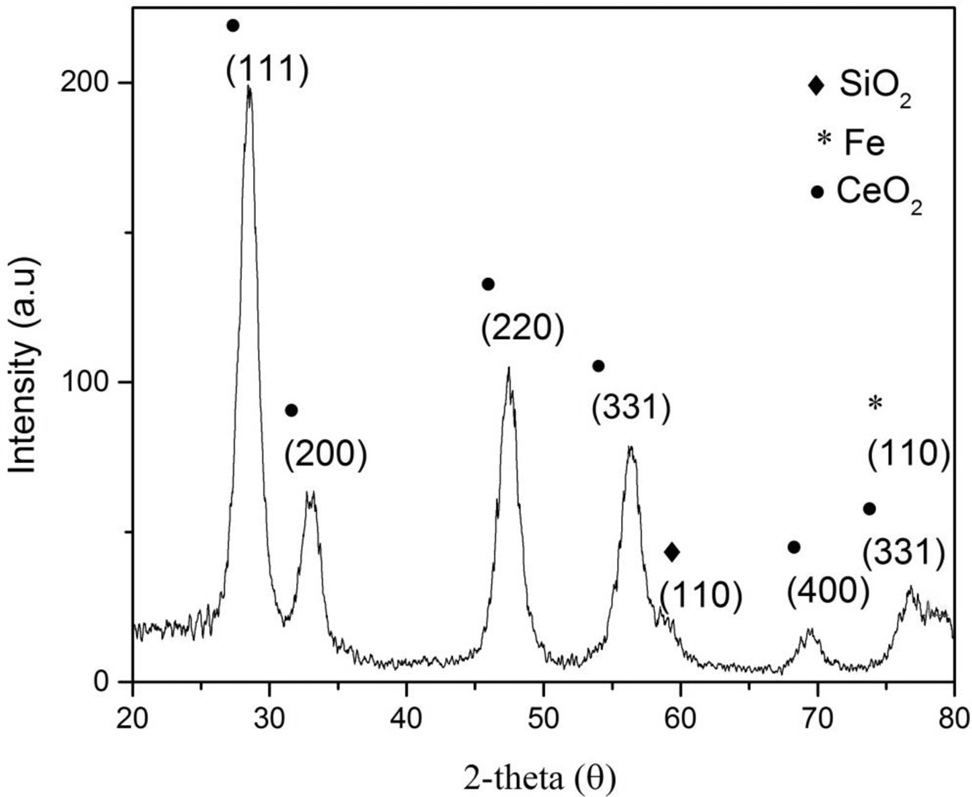
XRD pattern of Fe/CeO2–SiO2 nanocomposite.
Lattice parameters and d spacing
For cubic crystal, d spacing values between adjacent planes in Miller indices (hkl) was calculated by Bragg eq. 2.
After rearranging eq. 2 becomes
Wurtzite lattice parameters a = b = c of cubic crystal was calculated by the following eq. 4.
as the CeO2 and Fe are present in cubic crystallite form so it’s all parameters have the same value. For hexagonal crystal system wurtzite lattice parameters a = b and c calculated by the following eqs. 5 and 6.
The d spacing value was calculated by the following eq. 7
Volume of the unit cell was calculated from lattice geometry eq. 8
Value of angel
All calculations are displayed in (Table 1).
Structural parameters of Fe/CeO2-Si2O nanocomposite.
| 2θ | hkl | d spacing (nm) | Lattice parameters cubic a = b = c | Parameters hexagonal a = b ≠ c | V (nm)3 | cos φ |
|---|---|---|---|---|---|---|
| 28.7 | 110 | 0.34 | 0.59 | – | 0.17 | 0.86 |
| 32.6 | 200 | 0.26 | 0.59 | – | 0.17 | 1.06 |
| 47.4 | 220 | 0.19 | 0.59 | – | 0.17 | 0.82 |
| 56.5 | 331 | 0.16 | 0.78 | – | 0.41 | 0.98 |
| 58.4 | 110 | 0.092 | – | 0.18, 0.3 | 0.088 | 0.86 |
| 69.4 | 400 | 0.13 | 0.59 | – | 0.17 | 0.85 |
| 76.7 | 311 | 0.12 | 0.58 | – | 0.16 | 0.98 |
| 78.0 | 110 | 0.12 | 0.17 | – | 0.004 | 0.33 |
Determination of crystallite size and strain
Crystallite size of nanocomposite was calculated from XRD by using Debye-Scherrer and Williamson-Hall equations. The crystallite size of the synthesized and calcined nanocomposite was calculated from highly intense peak by Debye-Scherrer eq. 10.
where D is the average grain size, K is a shape factor with a value of 0.9, λ is the wavelength of X-rays with a value of 1.54 Å, β is the full width at half maximum, and θ is the diffraction angel (in degree). Crystallite size calculated as 5.33 nm from most intense peak (111) by Scherrer’s equation.
Average crystallite size and strain can be calculated by Williamson-Hall equation. The induced strain in nanocomposite due to crystal imperfections and lattice distortions in lattice can be calculated by the following eq. 11.
The calculated strain in nanocomposite was 1.34.
By combining eqs. 10 and 11 we get
Multiplying the above equation with cos θ, we get [26]
where ɛ is the induced strain in the crystal, D is the crystallite size which will be determined from the Williamson-Hall plot by comparing it with the straight line equation (Y = mx + c), where m is the slop and c is the intercept. The average crystallite size calculated by intercept of plot between β cos θ/λ on Y-axis and 4 sin θ/λ on X-axis so we obtained crystallite size from slop and strain from the intercept as shown in Fig. 3. The average size calculated from intercept is 5.26 nm and induced strain was 0.0091. λ is the wavelength of X-rays with a value of 0.154 nm, β is the full width at half maximum and θ is the diffraction angel (in degree).
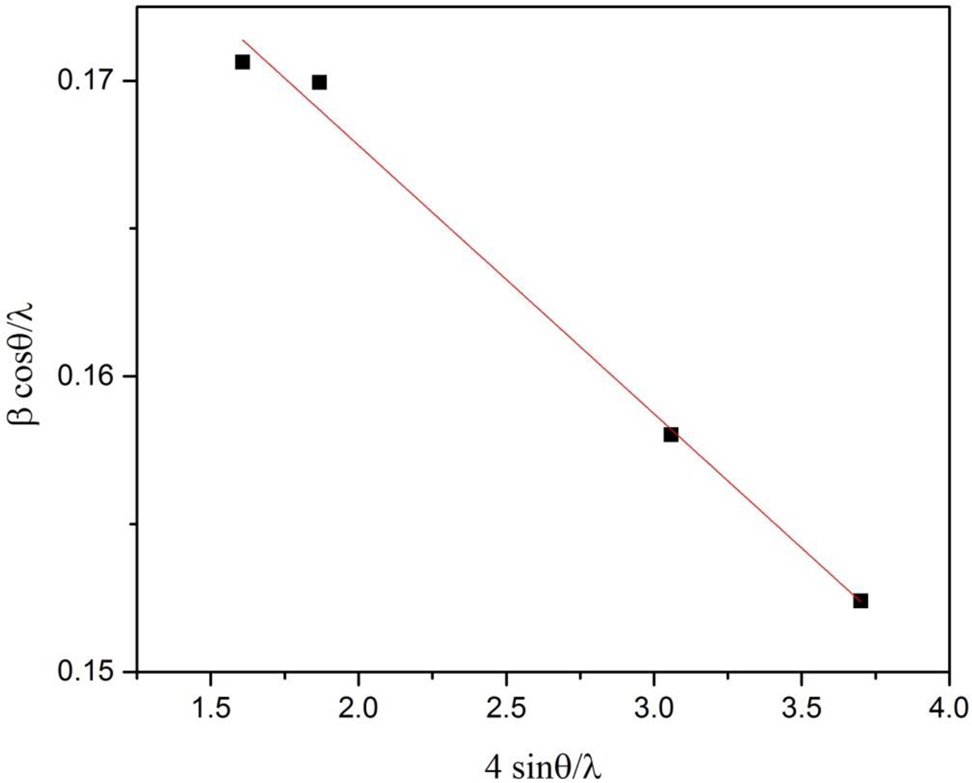
Williamson-Hall plot of Fe/CeO2–SiO2.
Determination of dislocation density (δ)
Dislocation density is defined as the extent of defects present as per unit volume of the crystal which is in direct relation with the hardness of the crystal so, as the decrease in crystallite size, dislocation density increases results in strain increases. Dislocation density is calculated by eq. 14 [31].
where, D is the crystallite size while δ is the dislocation density. The dislocation density of Fe/CeO2–SiO2 nanocomposite was 3.528 × 10⁻² (nm)−2.
Specific surface area (SSA)
Specific surface area (SSA) is the area per gram of sample. SSA is used for determination of the type and properties of the material. SSA is calculated by eq. 15 [32].
where D is the crystallite size (nm) and ρ is the density. The SSA depends on the size of the nanocomposite, as the size smaller the SSA is larger. The SSA of Fe/CeO2–SiO2 nanocomposite is 645.54 m2 g−1.
Determination of bond lengths
Bond length of Ce–O and Si–O bond is calculated by eq. 16 [31].
where μ is the positional parameter, a and c are the lattice constants which is calculated by eq. 17.
The calculated bond length of Ce–O is 0.30 nm while the reported bond length of CeO2 in literature is 0.23 nm [33]. Bond length of Si–O bond is 0.46 nm.
Optical bandgap investigation through solid phase spectroscopy
Optical properties of Fe/CeO2–SiO2 nanocomposite were determined by UV–vis absorption measurements. The sample was prepared by mixing 8 mg of the Fe/CeO2–SiO2 nanocomposite powder with two drops of aceton on the glass slide to make a thin film and then immediately covered with a cover slip and then with another glass slide and subjected for assessment of optical properties. UV–vis absorption spectra was obtained by extrapolating a straight line between (αhv)2 vs. hv showed in Fig. 4 using Wood and Tauc eq. 18 for allowed direct transition [34].
where α is the absorption coefficient, hv is photon energy, Eg is the band gap energy and n is ½ for direct band gap in semiconductors. Optical absorption coefficient α can be calculated by eq. 19.
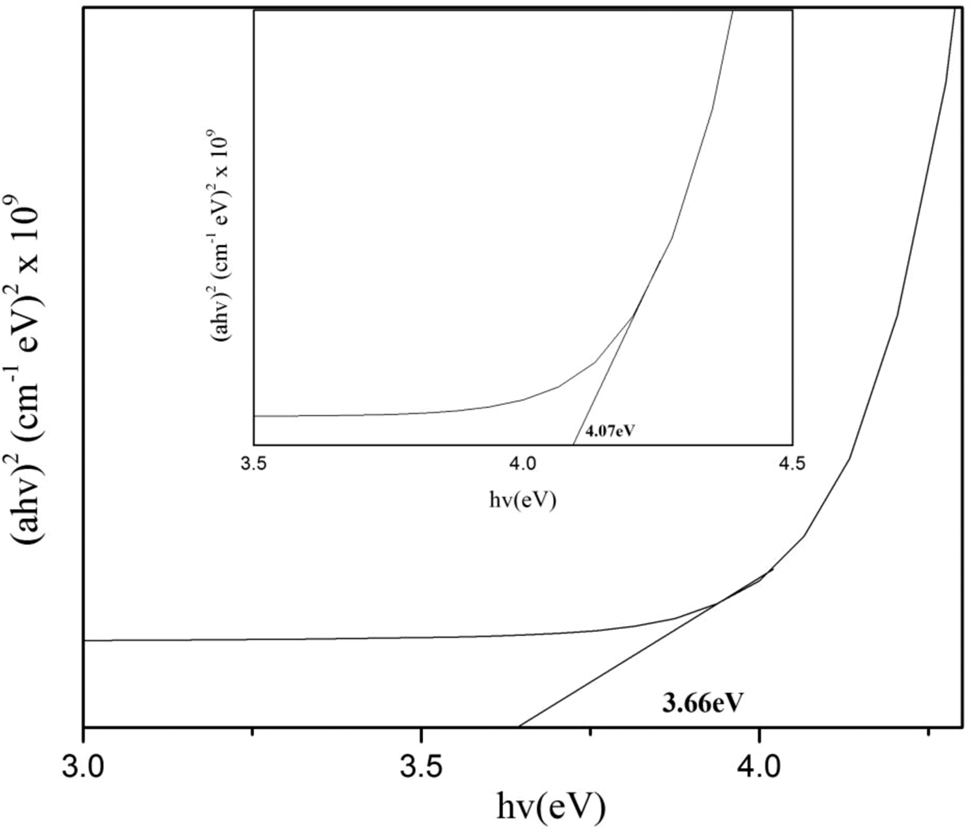
Band gap of Fe/CeO2–SiO2 nanocomposite inside is band gap of CeO2–SiO2 nanocomposite.
The band gap values of CeO2–SiO2 nanocomposite was 4.07 eV as shown inside Fig. 4. The band gap value was found higher than bulk CeO2 (3.15 eV) [35] while lower than bulk SiO2 (9 eV) [36]. Doping of Fe on CeO2–SiO2 nanocomposite decreases the band gap value up to 3.66 eV as shown in Fig. 4. The results showed that doped nanocomposite showed red shift due to quantum confinement effect. The decrease in band gap value was due to the transfer of electron from 3d orbital of Fe to the absorption edge of CeO2–SiO2 nanocomposite thus led to red shift in optical band gap of doped nanocomposite [28].
Scanning electron microscopy-energy dispersive X-ray analysis (SEM-EDX)
SEM results in Fig. 5(a) showed that Fe/CeO2–SiO2 nanocomposite has irregular symmetry having agglomerated structure.
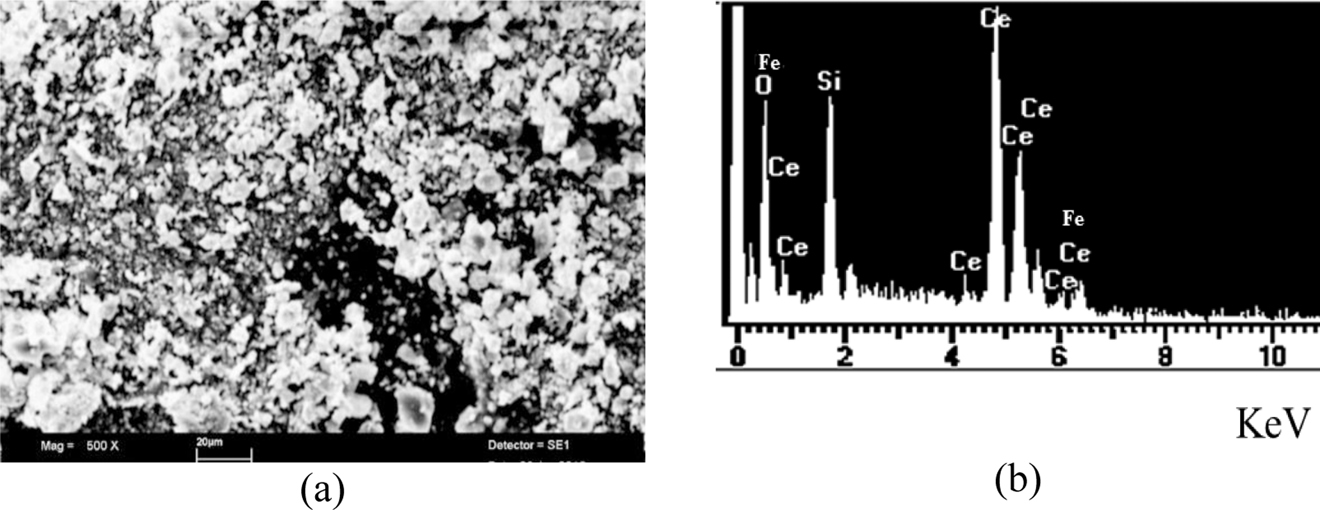
(a) SEM image and (b) EDX spectra of Fe/CeO2–SiO2 nanocomposite.
In Fig. 5(b) EDX spectra confirmed the presence of Fe/CeO2–SiO2 nanocomposite. The results showed that CeO2, SiO2, and Fe are present uniformly. Experimental values found for Ce, Si, O, and Fe were 67.41, 10.69, 21.90, and 2.27 %, respectively.
Thermogravimetric analysis (TGA)
Analysis of uncalcined Fe/CeO2–SiO2 nanocomposite was done by TGA instrument, SDT Q600 which showed the TGA-DSC curve of Fe/CeO2–SiO2 nanocomposite as shown in Fig. 6. The TGA-DSC curved showed the weight loss with temperature. The nanocomposite was scanned from 0 to 1200 °C. This analysis was done to describe the thermal stability of the sample.
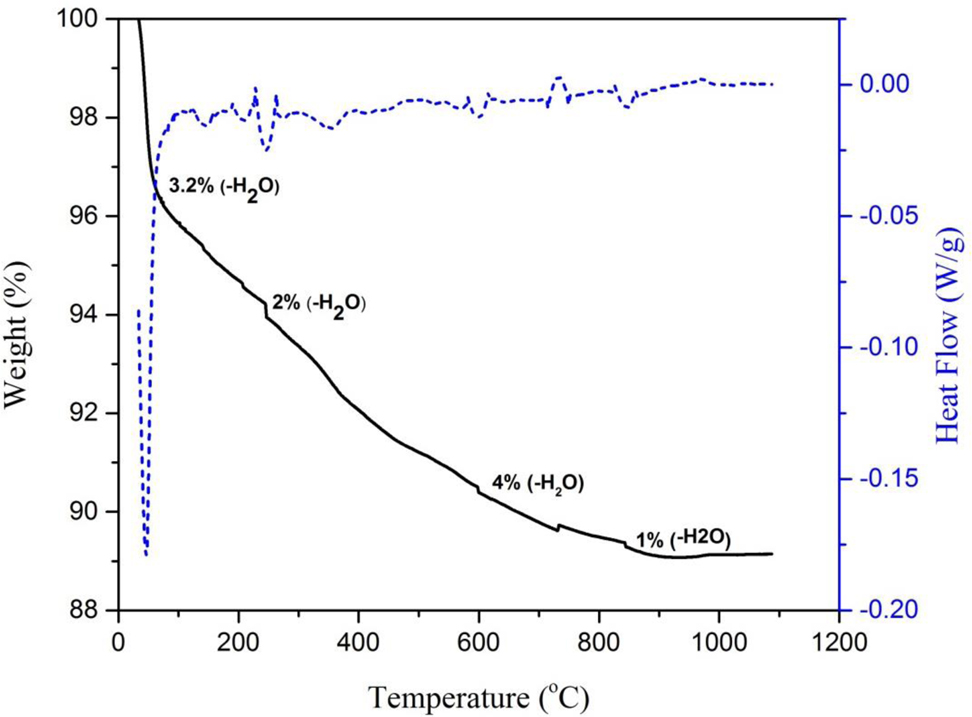
TGA-DSC curve of Fe/CeO2–SiO2 nanocomposite.
First weight loss was 3.2 % at 90 °C was due to the removal of water adsorbed by hydrogen bonding on the surface. Second was 2 % at 250 °C due the removal of water in the microspores of the nanocomposite [37]. Third was 4 % at 600 °C due to removal of water molecules coordinately bonded at the surface of nanocomposite [28]. Fourth was 1 % at 850 °C due to removal of water due to dehydroxlation at high temperature [38]. No weight loss is observed for surfactant because the surfactant was already removed due to calcination of CeO2–SiO2 nanocomposite and doped iron by hydrothermal method was present in zero oxidation state due to these only water loss was observed.
Fourier transform infrared spectroscopy (FTIR)
Figure 7 showed the FTIR spectrum of Fe/CeO2–SiO2 nanocomposite in the range of 650–4000 cm−1. Absence of peak at 677 cm−1 confirmed the presence of Fe in zero oxidation state [38]. Flat region at 806 [39] and 973 cm−1 [40] confirmed the absence of Si–OH bond. Peak at 812 cm−1 is due to the absorption of CeO2 [41]. Peak at 1639 cm−1 is due to the stretching and bending frequency of H–O–H [42]. Peaks at 1067 and 695 cm−1 are due to the asymmetric stretching vibrations of Si–O–Si and symmetric stretching vibrations of Si–O–Si [43]. Peak at 2320 cm−1 is due to the adsorption of CO2 from air at the highly reactive surface of the nanocomposite. Removal of surfactant by calcination and nanocomposite purity was assured by the absence of peak at 2850 cm−1 [44]. A wide band at 3395 cm−1 was appeared due to the stretching vibration of O–H of adsorb water (H2O) molecules [35].
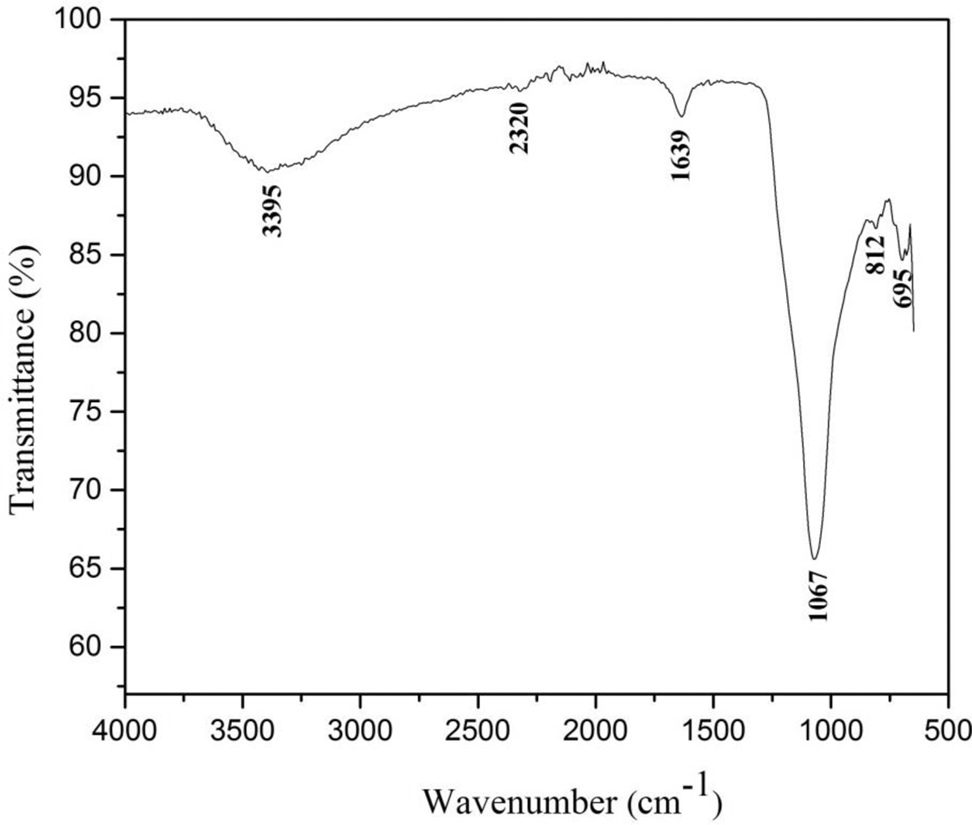
FTIR spectra of Fe/CeO2–SiO2 nanocomposite.
From FTIR spectra vibrational frequency and effective mass of Ce−O and Si−O bonds were determined by Eqs. 20–23 [45].
where, ν is the wavenumber, c is the velocity of light, k is force constant and μ is the effective mass which is determined by following equation
where, μ is the effective mass, M is the atomic masses of Ce, Si, and O. Effective mass (μ) of Ce−O and Si−O bonds are 14.92 and 10.98.
Force constant (k) determined by following equation
Force constant of the Ce–O bond is 3.88 × 1025 kg while Si–O bond is 3.28 × 1025 kg.
Nanofiltration columns
Removal of MB
Ten parts per million of MB solution was prepared and passed through all above mentioned columns as mentioned in Fig. 1 with a flow rate of 12mL/2 min. The absorbance of the eluates was measured at λmax 665 nm by UV–vis spectrophotometer.
In NF column, two functions occurred at the same time, first was the adsorption and second was the degradation. In adsorption process, RHA contained silanol functional groups (–Si–OH). These silanol groups adsorbed MB by making hydrogen bond with the nitrogen atoms from the MB as shown in Fig. 8 because nitrogen atoms have high ability to attract electron due to small radius.
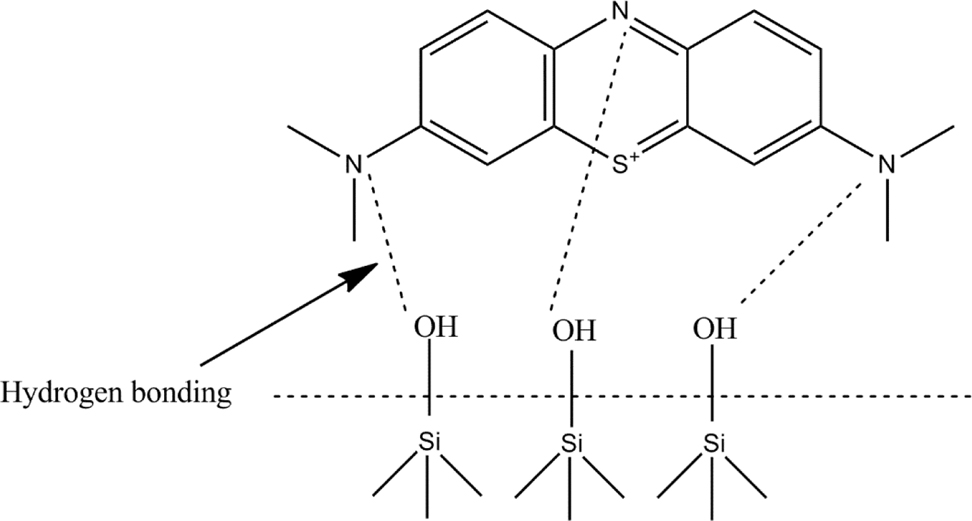
Hydrogen bonding between silanol groups of slurry and methylene blue (MB).
The results showed that 97 % MB was removed in all above mentioned columns by RHA while 3 % removed by nanocomposite.
Column packed with RHA slurry
As mentioned above only RHA as slurry was used in this column so silanol groups from the surface of the slurry adsorbed 97 % MB while no degradation was observed due to the absence of Fe/CeO2–SiO2 nanocomposite.
Column packed with nanocomposite with two layers of RHA slurry
The results showed that although Fe/CeO2–SiO2 nanocomposite was also in column but only 97 % removal of MB was observed because nanocomposite makes a very thin layer in column due to which it has a very small surface area and exposure in column due to which there was less removal showed by nanocomposite [23].
Column packed with nanocomposite mixed with RHA slurry
In this column completely removal of MB observed as shown in Fig. 9(b) because Fe/CeO2–SiO2 nanocomposite was mixed in the slurry as a result their surface area was increased so more number of active sites available for removal of MB. Hundred percent removal was achieved within 11 min and it remained 100 % until complete MB solution was passed. Best results were obtained by this column so it was chosen for reusability [46].
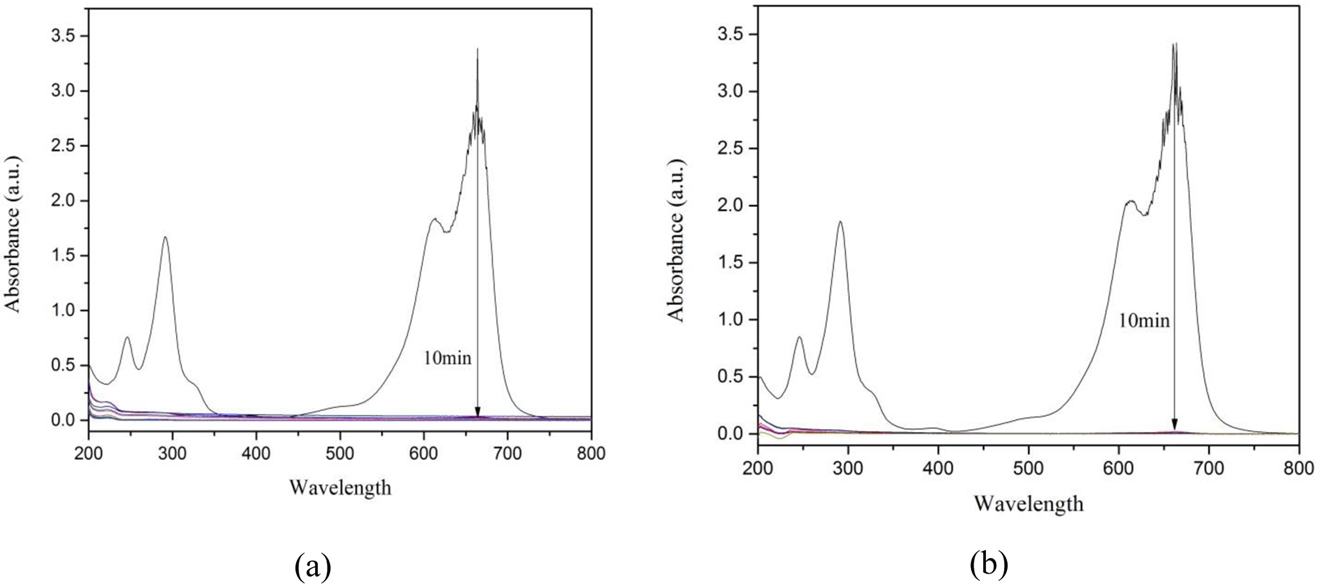
Change in absorption of MB due during its removal from column under visible light irradiation (A) in column (a, b) (B) in column (c).
Reusability of nanofiltration column
Column (c) was reused without washing for removal of MB. The flow rate of the solution was also slow because of the presence of already adsorbed MB [47].
MB shows two strong absorption bands at 291 and 665 nm [48]. These bands decreased up to almost zero only after 10 min in column (a) as shown in Fig. 9(a) and completely zero in column (c) as shown in Fig. 9(b) and its color changes from deep blue to transparent due to complete removal of MB.
Removal of chlorpyrifos
Five parts per million CP solution was prepared and passed through the column (c) (Fig. 1c) with flow rate of 3 mL/2 min. The absorbance of the eluates was taken at λmax 290 nm by UV–vis spectrophotometer [25].
As mentioned above in NF column, two functions occurred at the same time, first was the adsorption and second was the degradation. In adsorption process, RHA contained silanol functional groups (–Si–OH). So these silanol groups adsorbed CP by making hydrogen bond with the nitrogen atom in ring structure of CP [49] as shown in Fig. 10. The affinity of nitrogen atom to make hydrogen bond is mentioned above.

Hydrogen bonding between silanol groups and nitrogen atom of chlorpyrifos (CP).
The results showed that 91 % removal was observed and with the passage of time degradation was decreased. This might be due to the decrease of the availability of adsorption sites.
Figure 11 showed the change in absorbance of CP. The strong absorption bands of CP did not shift depicting that the chemical structure of CP has been destroyed by removal under visible light irradiation and Fe/CeO2–SiO2 nanocomposite [50].
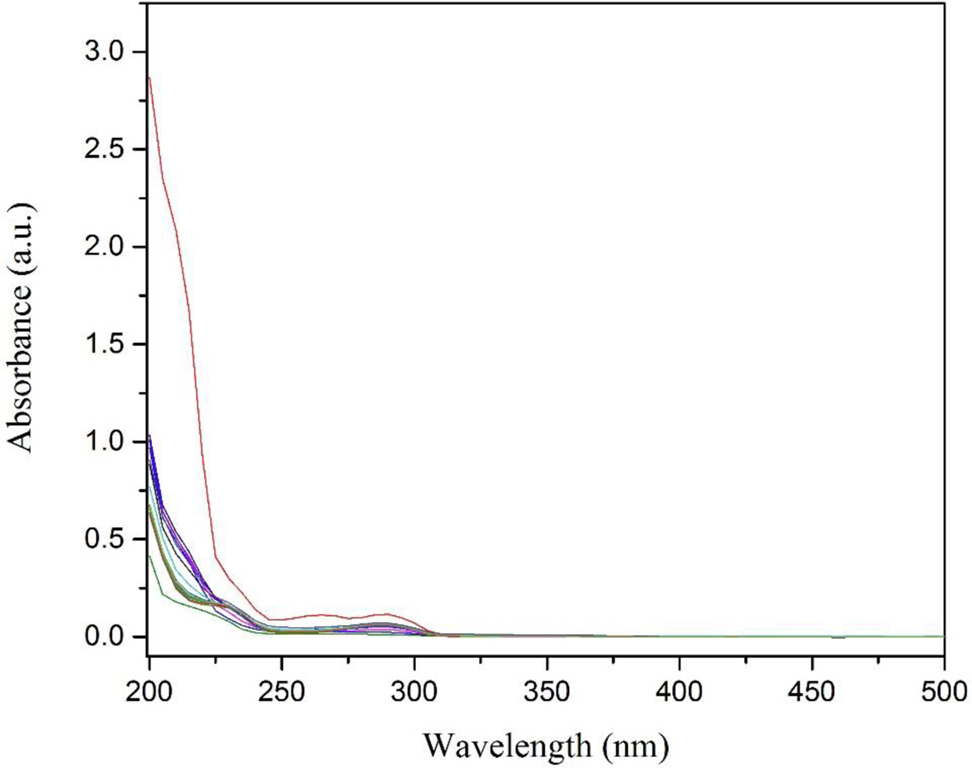
Change in absorption of CP due to adsorption and photodegradation under visible light irradiation.
Reaction mechanism in nanofiltration column
Photodegrdation process of Fe/CeO2–SiO2 nanocomposite can be evaluated by electron-hole pair mechanism. As Fe is doped on CeO2–SiO2 nanocomposite so it absorbs visible light and transfer electron from valence band to the conduction band by leaving hole (h+) at the valence band. 4f orbital of the CeO2 has a very important rule in photo degradation process [51] because electrons can be easily transferred into the 4f orbital of CeO2 due to exceptional electrontransfer mediator ability. Photogenerated electrons of the conduction band from the Fe transferred to the 4f orbital of the CeO2. Oxygen of the CeO2 captured these electrons and produce hydroperoxy (HO2•) radical, superoxide radical (O2•) that can then form hydrogen peroxide (H2O2) and hydroxyl radical (OH•). Hydroxyl radical (OH•) oxidized both MB and CP into their mineralized products Fig. 12. At the same time SiO2 also plays a vital role to increase the catalytic activity of CeO2 by not only adsorbing organic compounds but transfer these organic compounds on the active sites of CeO2. It also helps in avoiding CeO2 agglomeration [52]. The proposed mechanism of both MB and CP is as follow
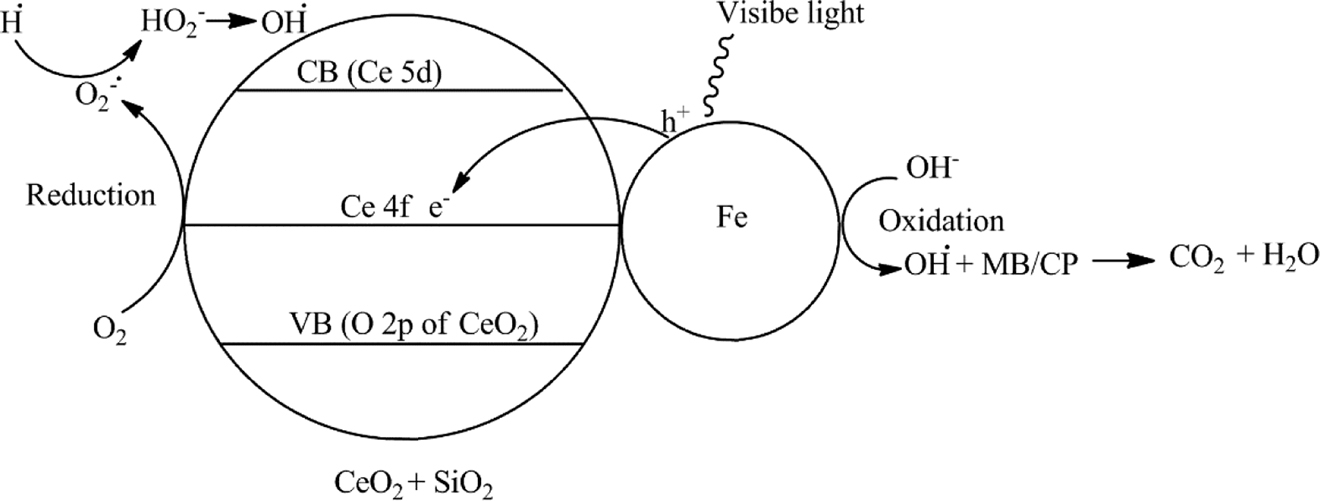
Schematic representation of Fe/CeO2–SiO2 nanocomposite as catalyst under visible light for degradation of MB and CP.
Conclusion
XRD results revealed the SSA of the nanocomposite was 645.54 m2 g−1 while dislocation density was 3.52 × 10⁻² (nm)−2. Nanocomposite functional groups were confirmed by FTIR spectroscopy. The bandgap of CeO2–SiO2 and Fe/CeO2–SiO2 nanocomposite was 4.07 and 3.99 eV. Red shift was observed after doping with Fe so UV–vis results are evidence for the high catalytic activity of the nanocomposite under visible light. Three different types of NF columns were used for removal of MB and CP. Ninety-seven percent MB removal was observed in the column (a) because RHA was the only packing material used in column, in column (b) again 97 % MB removal was observed because only a thin layer of nanocomposite was in two layers of RHA slurry so it had a very small surface area for exposure in the column so less removal was observed. In column (c) nanocomposite was mixed with RHA slurry so greater number of active sites were available for the removal of MB, 100 % removal of MB was observed within 10 min so this column was chosen for degradation of CP which degraded CP up to 91 % within 11 min. Results proved that column (c) is very efficient for the maximum removal of dyes and pesticides.
Article note
A collection of invited papers based on presentations at the Virtual Conference on Chemistry and its Applications (VCCA-2020) held on-line, 1–31 August 2020.
Funding source: Higher Education Commision
Award Identifier / Grant number: 20-3142/NRPU/R&D/HEC/
Acknowledgment
The corresponding author (Muhammad Akhyar Farrukh) would like to thank Higher Education Commission (HEC) Pakistan for providing funds under the Project No. 20-3142/NRPU/R&D/HEC/entitled “Synthesis of iron doped CeO2–SiO2 nanocomposites—”.
-
Research funding: This study was supported by Higher Education Commission (HEC) (Grant no. 20-3142/NRPU/R&D/HEC/).
References
[1] V. Andreu, Y. Pico. Trac. Trends Anal. Chem.23, 772 (2004), https://doi.org/10.1016/j.trac.2004.07.008.Suche in Google Scholar
[2] M. A. Tanveer, S. Zafar. Eur. J. Sci. Res.77, 362 (2012).Suche in Google Scholar
[3] H. Tahir, M. Sultan, Q. Jahanzeb. Afr. J. Biotechnol.7, 2649 (2008).Suche in Google Scholar
[4] M. Robert, C. Sanjeev. Process Biochem. 40, 699 (2005).10.1016/B978-008044612-7/50086-XSuche in Google Scholar
[5] D. A. Khan, I. Hashmi, W. Mahjabeen, T. A. Naqvi. Environ. Monit. Assess.168, 231 (2010), https://doi.org/10.1007/s10661-009-1107-2.Suche in Google Scholar PubMed
[6] H. A. A. Khan, W. Akram, K. Shehzad, E. A. Shaalan. Parasites Vectors4, 1 (2011), https://doi.org/10.1186/1756-3305-4-146.Suche in Google Scholar PubMed PubMed Central
[7] C. A. Damalas, M. Khan. J. Crop Prot.99, 59 (2017), https://doi.org/10.1016/j.cropro.2017.05.004.Suche in Google Scholar
[8] M. J. Khan, M. S. Zia, M. Qasim. Ecol. Eng.4, 12 (2010).Suche in Google Scholar
[9] J. Sultana, J. H. Syed, A. Mahmood, U. Ali, M. Y. A. Rehman, R. N. Malik, J. Li, G. Zhang. Sci. Total Environ.497, 113 (2014), https://doi.org/10.1016/j.scitotenv.2014.07.066.Suche in Google Scholar PubMed
[10] M. R. Asi, A. Hussain, S. T. Muhmood. Int. J. Environ. Res.2, 43 (2008).Suche in Google Scholar
[11] M. R. Jan, J. Shah, M. A. Khawaja, K. Gul. Environ. Monit. Assess.155, 31 (2008), https://doi.org/10.1007/s10661-008-0415-2.Suche in Google Scholar PubMed
[12] D. Ayhan. J. Hazard Mater.167, 1 (2009).Suche in Google Scholar
[13] L. Horrigan, R. S. Lawrence, P. Walker. Environ. Health Perspect.110, 445 (2002), https://doi.org/10.1289/ehp.02110445.Suche in Google Scholar PubMed PubMed Central
[14] F. B. A. Rahman, M. Akter, M. Z. Abedin. Int. J. Sci. Technol. Res.2, 47 (2013).Suche in Google Scholar
[15] A. Akbari, J. C. Remigy, P. Aptel. Chem. Eng. Process41, 601 (2002), https://doi.org/10.1016/s0255-2701(01)00181-7.Suche in Google Scholar
[16] M. F. Abid, M. A. Zablouk, A. M. A. Alameer. Iran. J. Environ. Health Sci. Eng.9, 1 (2012), https://doi.org/10.1186/1735-2746-9-17.Suche in Google Scholar PubMed PubMed Central
[17] Mohamed, R. M., Aazam, E. S., Int. J. Photoenergy2012, 1–8 (2012).10.1155/2012/794874Suche in Google Scholar
[18] Y. Wang, L. Zhu, M. Wang, N. Ren. Int. J. Hydrogen Energy41, 15710 (2016), https://doi.org/10.1016/j.ijhydene.2016.04.178.Suche in Google Scholar
[19] D. Chen, Z. Zeng, Y. Zeng, F. Zhang, M. Wang. Water Resour. Ind.15, 1 (2016), https://doi.org/10.1016/j.wri.2016.05.003.Suche in Google Scholar
[20] M. K. Chinnu, K. V. Anand, R. M. Kumar, T. Alagesan, R. Jayavel. J. Optoelectron. Adv. Mater.7, 976 (2013).Suche in Google Scholar
[21] D. Channei, B. Inceesungvorn, N. Wetchakun, S. Phanichphant, A. Nakaruk, P. Koshy, C. C. Sorrell. Ceram. Int.39, 3129 (2013), https://doi.org/10.1016/j.ceramint.2012.09.093.Suche in Google Scholar
[22] M. Nolan. J. Mater. Chem.21, 9160 (2011), https://doi.org/10.1039/c1jm11238d.Suche in Google Scholar
[23] C. Liang, Z. Ma, H. Lin, L. Ding, J. Qiu, W. Frandsen, D. Su. J. Mater. Chem.19, 1417 (2009), https://doi.org/10.1039/b817942e.Suche in Google Scholar
[24] Z. Wang, Z. Quan. J. Lin. Inorg. Chem.43, 5237 (2007), https://doi.org/10.1021/ic0701256.Suche in Google Scholar PubMed
[25] S. Parveen, M. A. Farrukh. J. Mater. Sci. Mater. Electron.29, 3219 (2018).10.1007/s10854-017-8257-8Suche in Google Scholar
[26] M. A. Farrukh, I. Muneer, S. Sharif, Z. Munawar, N. Batool. Mater. Res. Express5, 1 (2018), https://doi.org/10.1088/2053-1591/aadbf5.Suche in Google Scholar
[27] M. A. Farrukh, K. M. Butt, K. K. Chong, W. S. Chang. J Saudi Chem. Soc.23, 561 (2018).10.1016/j.jscs.2018.10.002Suche in Google Scholar
[28] A. Afzaal, M. A. Farrukh. Mater. Sci. Eng., B223, 167 (2017), https://doi.org/10.1016/j.mseb.2017.06.015.Suche in Google Scholar
[29] L. Li, X. Li. J. Phys. Chem.117, 15383 (2013), https://doi.org/10.1021/jp4043649.Suche in Google Scholar
[30] A. K. Zak, W. H. A. Majid, M. E. Abrishami. Solid State Sci. 13, 251 (2011).10.1016/j.solidstatesciences.2010.11.024Suche in Google Scholar
[31] P. Bindu, S. Thomas. J. Theor. Appl. Phys.8, 123 (2014), https://doi.org/10.1007/s40094-014-0141-9.Suche in Google Scholar
[32] T. Theivasanthi, N. kartheeswari, M. Alagar. Chem. Sci. Trans.2, 497 (2013).10.7598/cst2013.207Suche in Google Scholar
[33] H. T. Chen, J. G. Chang. J. Phys. Chem. C115, 14745 (2011), https://doi.org/10.1021/jp201231d.Suche in Google Scholar
[34] M. A. Farrukh, M. Shahid, I. Muneer, S. Javaid, M. K. Rahmani. J. Mater. Sci. Mater. Electron.27, 2994 (2016), https://doi.org/10.1007/s10854-015-4121-x.Suche in Google Scholar
[35] S. K. Sahoo, M. Mohapatra, A. K. Singh, S. Anand. Mater. Manuf. Process.25, 982 (2010).10.1080/10426914.2010.480995Suche in Google Scholar
[36] S. Sankar, S. K. Sharma, D. Y. Kim. Int. J. Eng. Sci.17, 353 (2016).Suche in Google Scholar
[37] B. M. Reddy, A. Khan. Catal. Surv. Asia9, 155 (2005), https://doi.org/10.1007/s10563-005-7552-1.Suche in Google Scholar
[38] D. P. Joshi, G. Pant, N. Arora, S. Nainwal. Heliyon3, 1 (2017), https://doi.org/10.1016/j.heliyon.2017.e00253.Suche in Google Scholar PubMed PubMed Central
[39] T. H. Liou, C. C. Yang. Mater. Sci. Eng., B176, 521 (2011), https://doi.org/10.1016/j.mseb.2011.01.007.Suche in Google Scholar
[40] I. A. Rahman, P. Vejayakumanran, C. S. Sipaut, J. Ismail, C. K. Chee. Mater. Chem. Phys.114, 328 (2009), https://doi.org/10.1016/j.matchemphys.2008.09.068.Suche in Google Scholar
[41] E. Kumar, P. Selvarajan, K. Balasubramanian. Recent Res. Sci. Technol.2, 37 (2010).Suche in Google Scholar
[42] P. Mishra, A. Saxena, A. S. Rawat, P. K. Dixit, R. Kumar, P. K. Rai. Environ. Prog. Sustain.37, 420 (2017), https://doi.org/10.1002/ep.12660.Suche in Google Scholar
[43] A. K. Gupta, A. Kaushik, P. R. Solanki, C. Dhand, S. Bhansali, B. D. Malhotra. J. Nanosci. Lett.4, 1 (2014).Suche in Google Scholar
[44] R. Bakkiyaraj, M. Balakrishnan, R. Subramanian. Mater. Res. Innovat.2, 351 (2016), https://doi.org/10.1080/14328917.2016.1265256.Suche in Google Scholar
[45] H. H. Singh, K. L. Yadav. Ceram. Int.41, 9285 (2015), https://doi.org/10.1016/j.ceramint.2015.03.212.Suche in Google Scholar
[46] F. A. Ozdemir, B. Demirata, R. Apak. J. Appl. Polym. Sci.112, 3442 (2009), https://doi.org/10.1002/app.29835.Suche in Google Scholar
[47] M. A. Rahman, S. M. R. Amin, A. M. S. Alam. J. Sci.60, 185 (2012), https://doi.org/10.3329/dujs.v60i2.11491.Suche in Google Scholar
[48] S. Xia, L. Zhang, G. Pan, P. Qian, Z. Ni. Phys. Chem. Chem. Phys.17, 5345 (2015), https://doi.org/10.1039/c4cp03877k.Suche in Google Scholar PubMed
[49] M. Ahmaruzzaman, V. K. Gupta. Ind. Eng. Chem. Res.50, 13589 (2011), https://doi.org/10.1021/ie201477c.Suche in Google Scholar
[50] A. S. Nair, T. Pradeep. J. Nanosci. Nanotechnol.7, 1 (2007), https://doi.org/10.1166/jnn.2007.733.Suche in Google Scholar PubMed
[51] F. B. Li, X. Z. Li, M. F. Hou, K. W. Cheah, W. C. H. Choy. Appl. Catal., A285, 181 (2005), https://doi.org/10.1016/j.apcata.2005.02.025.Suche in Google Scholar
[52] S. Phanichphant, A. Nakaruk, D. Channei. Appl. Surf. Sci.387, 214 (2016), https://doi.org/10.1016/j.apsusc.2016.06.072.Suche in Google Scholar
© 2021 IUPAC & De Gruyter. This work is licensed under a Creative Commons Attribution-NonCommercial-NoDerivatives 4.0 International License. For more information, please visit: http://creativecommons.org/licenses/by-nc-nd/4.0/
Artikel in diesem Heft
- Frontmatter
- In this issue
- Special topic paper
- State-of-the-art progress in tracking plasmon-mediated photoredox catalysis
- Invited papers
- Leading by example
- A blueprint for green chemists: lessons from nature for sustainable synthesis
- Synthetic approaches to 2,5-bis(hydroxymethyl)furan (BHMF): a stable bio-based diol
- Conference papers
- Virtual Conference on Chemistry and its Applications VCCA-2020
- Comparison of P- and As-core-modified porphyrins with the parental porphyrin: a computational study
- Data curation to improve the pattern recognition performance of B-cell epitope prediction by support vector machine
- Molecular insights of metal–metal interactions in transition metal complexes using computational methods
- Structure, electronic and optical properties of chalcopyrite-type nano-clusters XFeY2 (X=Cu, Ag, Au; Y=S, Se, Te): a density functional theory study
- An efficient nanofiltration system containing mixture of rice husk ash and Fe/CeO2–SiO2 nanocomposite for the removal of azo dye and pesticide
- Synthesis and comparative study on the antibacterial activity organotin(IV) 3-hydroxybenzoate compounds
- IUPAC Technical Report
- Interpretation and use of standard atomic weights (IUPAC Technical Report)