Research Image Management Practices Reported by Scientific Literature: An Analysis by Research Domain
-
Joana Rodrigues
 und
Carla Teixeira Lopes
und
Carla Teixeira Lopes

Abstract
Research data management is essential for safeguarding and prospecting data generated in a scientific context. Specific issues arise regarding data in image format, as this data typology poses particular challenges and opportunities; however, not much attention has been given to data as images. We reviewed 109 articles from several research domains where images were used either as data or metadata to understand how researchers specifically deal with this data format, and what are your habits and behaviors. We use the Web of Science (WoS), considering its five main areas of research. We included in the initial corpus the most relevant articles by research domain, selecting the ten most cited articles in WoS, by year, between 2010 and 2021. The selected articles should be in English and in open access. The results found that images have been used in scientific works numerous times, but, unfortunately, few are those in which they are the central element of the study. Photography is the type of image most used in most domains. In terms of the instruments used, the Technology and Life Sciences and Biomedicine domains use the microscope more, while the Arts and Humanities and Physical Sciences domains use the camera more. We found that the images are mostly produced in the context of the project, rather than reused by third parties. As for their collection scenario, these are mostly produced/used in a laboratory context. The overwhelming majority of the images present in the articles are digital, and only a small part is analog. We verify that Arts and Humanities are more likely to perform qualitative types of analyses, while Life Sciences and Biomedicine overwhelmingly use quantitative analyses. As for the issues of sharing and depositing, Life Sciences and Biomedicine is the domain that stands out the most in the tasks of depositing and sharing images. It was found that the licenses of a project are intrinsically related to the motivations for sharing results with third parties. Description, a fundamental step in the data management process, is neglected by a large number of researchers. The images are mostly not described or annotated and when this happens, researchers don’t provide much detail about this.
1 Introduction
The information and communication society in which we currently live tends to record all transactions (Serén, 2013). The image should not be demoted from its prominent place in this society, as this documentary typology constitutes a social object with materiality and associated ideas. Like text, images have and transmit information or meaning. While text uses conventional and arbitrary symbols to convey information, images share information through the representation and similarity of objects as they are. It is not by chance that, often, images are used together with text since they contain different information, unable to be represented by the text (Layne, 1994).
The scientific community accepts different types of images in research, a practice that is common in several domains of research, from the social sciences to the exact sciences, life sciences, or natural sciences (Banks, 2007; Sandweiss, 2007; Silva, 2014). Research data can be defined as factual records used as primary sources in scientific research. These data are indispensable for the validation of results and research processes. The data can be seen as “facts, measurements, recordings, records, or observations about the world collected by scientists and others, with a minimum of contextual interpretation. Data may be in any format or medium taking the form of writings, notes, numbers, symbols, text, images, films, video, sound recordings, pictorial reproductions, drawings, designs or other graphical representations, procedural manuals, forms, diagrams, work flow charts, equipment descriptions, data files, data processing algorithms, or statistical records” (CASRAI, 2022). How data are produced and collected can also be varied (OECD, 2007).
The management of research data is a complex issue involving many parts and, therefore, gives rise to technical needs and challenges. Research financiers are pushing for open data in the European Union, and researchers are becoming more aware of research data management (RDM) benefits. These factors create a growing need for institutional support for data management. Palmer et al., (2017) analyzes the importance of creating a structure of principles and processes that help to articulate and support the description of data. One point of consensus is the crucial role of images as metadata for research documentation. The images have a double purpose: they function as metadata, providing context, and as data, recording the object of study. This approach leaves room for positioning an image in RDM as a fundamental asset in describing and interpreting specific domains. Palmer’s study evidences the need to bridge the gap between researchers and data curators while guidelines and tools to support metadata and RDM are being created.
Science benefits from images since the possibility of accurate registration enhances research. In addition, images are helpful for visualization and communication in science. The abundance of images, diversity of origins, and diversity of holders create various practices regarding description, interpretation, and systematic use. It is essential to understand the behavior of researchers using and producing images and to know more about their habits. What kinds of images are produced by researchers? How are images collected? Which instruments are used in this process? Are images described and deposited in repositories? These responses will allow, for example, us to identify failures and propose good practices.
To study the use and production of images in research, we have systematically reviewed 109 articles from several domains where images were used either as data or as metadata. This work aims to answer several research questions, namely: RQ1: In the published works, is it possible to identify formal practices and standards in managing images as research data? RQ2: Do research domains manage images differently? RQ3: Are researchers aware of data management practices and policies? RQ4: Do image-related habits and trends tend to change over the years?
This work has an innovative character, since to date we have not found similar review articles already published. The dynamics of image management are not much studied and the use of this document typology as data or metadata does not seem to be discussed by the scientific community. In addition, this work presents a unique methodology that allows obtaining the best results, without the need to specify a particular research domain, but rather welcoming all in its analysis. Section 2 explains this process in detail.
It should be noted that the study falls within the scope of RDM, namely data and metadata in image typology.
That we know of, besides a study published in 2020 (Fernandes, Rodrigues, & Lopes 2020), no other study addresses image in RDM practices.
2 Methodology
To understand how images are used, produced, and managed in research contexts, we conducted a systematic literature review with slight adaptations in the way articles are identified and analyzed. After selecting the information sources and defining the search strategy, three main stages guided our methodological approach (Figure 1). The following sections detail these phases.

Methodological approach.
2.1 Article Selection
The overall selection process followed the PRISMA statement (Liberati et al., 2009) and is described in Figure 2.

Flow diagram of study selection.
We decided to use the Web of Science (WoS) for its prestige, extensiveness, and organization. In this work, we considered the five main research areas of WoS: Arts and Humanities (ArtH), LifeSciences and Biomedicine (LifeSB), Physical Sciences (PhyS), Social Sciences (SocS), and Technology (Tech). Instead of defining a search query, as typically done in systematic reviews, we included the most relevant articles per research domain. Note that we do not want to collect articles related to a specific topic. Instead, we want to gather the most important article in each discipline and analyze their image-management practices. To pick the most relevant articles for each domain, we selected the ten most cited articles in WoS, per year, between 2010 and 2021. In addition, articles should be in the English language and in open access. Overall, we identified 600 articles.
The screening process involved reading the title, the abstract, the keywords, and the methodology of each of the 598 articles (two were excluded for not having the full text). In this reading, the objective was to understand whether the positioning of the images, namely their role as research data, was sufficiently relevant. It was found that many articles used or produced images. However, images were often not the primary data type used or produced, meaning that the authors did not highlight the relevance of images in the research work. When this happened, the articles were excluded. It also happened that, in some cases, there was not enough information on the topic under study. That is, the topic of the images seemed to be relevant in the article; however, the present information did not provide sufficient details to consider including the article in the final sample. These details are, for example, the method of producing the images, the type of instruments used, the type of images, formats, quality and editing techniques, and the type of analysis involved, among others.
In the eligibility stage, articles were read in full to decide on their inclusiveness in the final sample. Nine of them did not include sufficiently comprehensive information for the study in question and were, therefore, excluded.
Of the 600 documents analyzed, 109 (18.2%) constituted the final sample. The articles that caused any doubt about the inclusion/exclusion were read almost in full. Of the 109 documents, 29 (26.6%) belong to the domain of ArtH, 23 (21.1%) of LifeSB, 2 (1.8%) of SocS, 21 (19.3%) of PhyS, and 34 (31.2%) of Tech.
2.2 Article Analysis
All 109 articles were downloaded and organized in folders by research domain and year of publication. In each folder, we included a document with the articles’ titles, authors, number of citations in the primary collection of WoS, the total number of citations, and accession number.
A large number of articles, their multidisciplinarity, and the need to facilitate the subsequent analysis of the selected articles made us define 13 dimensions of analysis shown in Table 1. Each of them is composed of a controlled vocabulary, defined as we analyzed the articles, considering the research and specific terminology. The controlled vocabularies functioned as an information tool that facilitated the description of the articles and the analysis process.
Dimensions of analysis
| Dimension | Possible values |
|---|---|
| Image as data? | Yes, no |
| Image as metadata? | Yes, no |
| Image type | Animation, drawing, engraving, graphic, illustration, medical images, microscopic images, painting, photography, plant, portrait, video, computer-made image, map, print screen |
| Collection technique | Images produced by researchers in the laboratory, images produced by researchers outside the laboratory, images produced by the study participants, images collected by researchers from third parties, images collected by researchers from previous projects |
| Programs used | ImageJ, Mathworks, Matlab, SPSS, others |
| Instruments used | Microscope, medical instrument, camera, manual writing, computer |
| Analysis type | Qualitative, quantitative |
| Licenses | CC BY, CC BY-SA, CC BY-ND, CC BY-NC, CC BY-NC-SA, CC BY-NC-ND, Nature, APA, Elsevier, ACS, AAAS |
| Image format | Analogic image, digital image |
| Use and production? | Use, production |
| Image editing | Correction/editing, reframing footage, cropping, composition, adjust of scale/calibration, without editing |
| Image description | Structural metadata, non-structural metadata |
| Image deposit | Yes |
We created a spreadsheet to describe each of the selected articles. For each article, we included its title, research domain, year, and ID (sequentially assigned), along with the 13 dimensions of analysis (Table 1). After reading each full article, we filled this spreadsheet. The complete spreadsheet will be made available in open access, through a data set published in a data repository (after the article review phase).
2.3 Statistical Analysis
To analyze the collected data, we used the Statistical Package for the Social Sciences (SPSS). As shown in Table 1, all the dimensions of analysis are nominal variables. Therefore, we did our descriptive analysis through cross-tabulation. For inferential analysis, we used the Chi-square test for equality of proportions for comparisons between domains, and Cochran’s Q test for comparisons between dimension analysis.
3 Results
After detailing our methodology, we describe our results organized by the different phases of the research lifecycle as defined by the Data Documentation Initiative (Structural Reform Group, 2004), DataONE (Ball, 2012), and UK Data Archive, (2019). The stages of the research data lifecycle are planning, creation/compilation, quality assurance, processing/analysis, description, storage, and sharing. Afterward, we will discuss the results and present our conclusions.
We will not report results related to the storage stage because none of the articles included information about this. It is important to note that, for the Social Sciences domain, only two articles were collected, so conclusions related to SocS may need further analysis.
All analyzed articles are available in a dataset generated with all the information collected from each of the documents. This data set is published in the INESC TEC[1] data repository, in open access. The dataset can be seen at the following DOI link: https://doi.org/10.25747/k9f6-kt23.
3.1 Planning
For this study, we realized that none of the articles had information about the planning phase. This phase is related to the moments prior to the execution of the projects, in which documents with guidelines for the course of the project are prepared. At this stage, you can build data management plans, documents to safeguard sensitive data, or others that involve structured planning of actions throughout the project. We cannot say that such planning does not exist, we only know that it was not reported by the authors of the article.
3.2 Creation/Compilation
The creation and complication phase is inherent to the types of images that are produced or used, as well as the instruments used in these moments. Furthermore, this phase relates to the role of images in research, namely whether they are originally produced or used by third parties. Finally, the creation and complication phase makes it possible to determine the scenarios in which the images were produced, that is, in which place and under what conditions their production took place.
3.2.1 Types of Images
We could identify the type of image being used in every article. In total, eight types of images were identified, namely, computer-made images (images generated in the field of computer graphics, often referred to as computer-generated imagery [CGI[), drawings, illustrations, medical images (e.g., X-ray, tomography, magnetic resonance imaging [MRI]), microscopic images (images generated exclusively through the use of microscopic), maps, photographs, and videos.
It is important to note that an article may use/produce several types of images, so the number of types of images per domain may be greater than the number of articles per domain. In Table 2, we show the domains that use each type of image, how frequently, and if this frequency is significantly different from other domains’ frequency. In each domain, we also analyzed the significant differences between the use of different types of images.
Image types used per domain and significant comparisons
 |
In an analysis by domain, we can see that photography is the type of image most present in ArtH, standing out significantly. In LifeSB, this highlight is in the microscopic images. Photography is again the most present in PhyS and SocS. In the Tech domain, the emphasis on one type of image is not as pronounced as in the previous ones, even so, microscopic images prevail. This last fact surprised us, and after analyzing the 16 articles in question, we realized these studies regard the development, implementation, and analysis of technologies that allow the capture and study of microscopic images. In the domain of LifeSB, it would be expected that medical images would have a more pronounced presence; however, after analyzing the articles, it was found that in this field the studies are closely related to the microscopic analysis of diseases or medical conditions and, also, with the proposal of medical approaches for the decoding of microscopic images.
Considering image types, we can see that photographs and microscopic images are the only ones that are significantly larger than other types. Another interesting fact is that videos, illustrations, and drawings only appear in the domain of ArtH. In addition, the last two are associated with analog images. Finally, we want to emphasize that photographs are the only image typology present in all research domains.
3.2.2 Types of Instrument
As with the types of images, it was important to identify the main types of instruments associated with the production of the images under study. We identified the following instruments: camera, computer, medical instrument, microscope, and paper. Table 3 shows the use of instruments in the research domain.
Instrument type used per domain and significant comparisons
 |
We can see that, as expected, the type of instrument is directly related to the image type. In other words, images such as photographs and videos are produced with the camera; medical images with medical instruments; microscopic images with the microscope; drawings and illustrations are produced using manual writing and maps, graphics, and computer-made images with the computer. It is logical for researchers to know which instrument is used in the production of an image when they are the ones who produce it. However, when they don’t produce it, they might not have this information. However, in the analysis of the documents, only two of the documents do not present information in relation to the instrument, and this happens when the images are produced by third parties.
In the domains, it is possible to highlight that the camera has a more significant presence in ArtH and PhyS. The microscope, on the other hand, has this highlight in LifeSB and Tech. Paper only exists in ArtH. In terms of types of instruments, the camera, in general, has a more significant presence than the others.
3.2.3 Use and Production
When planning a research project, the types of images and instruments to be used are not the only topics to consider. When it comes to data in image format, it is necessary to plan how the images will be acquired and included in the investigation. In a research project, an image may be authored by the researchers of that project, and therefore, it may be considered that it was produced by themselves or else be reused from third parties and, in this case, considered to be used. All documents under analysis mentioned the type of image acquisition. The labels “production” and “use” were created to classify the images according to their acquisition. Table 4 shows the use and production of images by the research domain and the associated significant comparisons.
Use and production of images in research domains and significant comparisons
 |
The ArtH domain presents a homogeneous distribution of results by use and production, the remaining domains have a significant prevalence of production. All articles from LifeSB, SocS, and Tech have produced their images.
The analysis of the articles made it possible to perceive that the researchers privilege their own production of the images, and when the images are used by third parties, there is not much information about the method used in this image reuse.
3.2.4 Collection Scenarios
To systematize the different ways of collecting the images, two scenarios in which they may occur were studied, namely: images produced by researchers in the laboratory (inlab) and images produced by researchers outside the laboratory (outlab). Table 5 shows the methods for collecting images by research domain.
Collection scenarios per domain and significant comparisons
 |
It is possible to verify that the inlab and outlab scenarios depend on the research domain. The inlab scenario is most representative in the LifeSB and Tech domains. In turn, the outlab inside scenario is more prominent in the PhyS domain. There are several examples taken from articles about inlab and outlab scenarios. Even so, it is possible to identify that studies involving microscopic data, medical data, and technological development are more associated with the laboratory. Georeferential data, observations, and astronomy-related data are more associated with scenarios outside the laboratory. It is also interesting to note that five articles mentioned that their data were collected using study participants. Of these five cases, four belong to the ArtH domain and one to the LifeSB domain. Analyzing the articles, we realize that these cases fall mainly on ArtH, as they are related to social studies in which participants were recruited to determine behaviors and establish standards, through a series of questions raised by the authors of the studies.
3.3 Quality Assurance
The growing production of images is undeniable. Nowadays, through image capture devices, this is available to anyone. However, this was not always the case. Just think of the years that began the current millennium to see that most images were analog. Currently, the trend has reversed, and the majority of the images produced are digital, as the available technologies allow the production or capture of an image quickly, allowing its storage or sharing at the same moment, without the constraint of places, times, or devices.
One of the methods most used by researchers to ensure the quality of their images is the format in which they are stored. In this work, the format of the images present in the documents was analyzed. For this, the images were divided into two groups: analogic images and digital images. Table 6 presents the information regarding image formats by research domain.
Image format per domain and significant comparisons
 |
It was possible to identify the formats of the images in all the documents. The predominance of the digital format is evident. For documents that combine analog and digital images, only one was identified. The domain of ArtH was the only one that presented analog images, namely three drawings and two illustrations. With the analog and digital format, we have a drawing.
In the case of digital images, the most mentioned formats were JPEG (Joint Photographic Experts Group), PNG (Portable Network Graphics), PX (Pixel Image), TIFF (Tagged Image File Format), ICN (Windows Icon File), MNG (Multiple image Network Graphic), and PSD (Photoshop Document). In the case of analog images, the only support mentioned was paper.
3.4 Processing/Analysis
The type of analysis and processing chosen in the context of research are determining factors in the data management process. The processing and analysis phase is related to the edits made or not to the images, as this information can be decisive in the treatment and study of the data since they can change the original characteristics of the images. This phase also addresses the type of analysis to which the images are submitted, as well as the programs used to perform this task.
3.4.1 Image Editing
The production of images sometimes implies that they have to go through an editing process. The improvement of an image can include aspects such as cropping, and adjusting brightness, including the scale, among others.
In this work, we analyzed how images were edited. For each document, it was verified whether or not there was an edition in the images. Eighty-four documents did not include this information. For this reason, it is not possible to say whether the images were edited or not. In the others, we identified five types of editions: adjusting of scale/calibration, correction/editing, composition, reframing footage, and cropping. In addition to these, it was decided to include in the analysis, documents that had images without editing and documents in which this information was not available. A document can have more than one type of image editing associated with it. Table 7 systematizes this information.
Image editing per domain and significant comparisons
 |
The adjustment of scale/calibration, composition, and reframing of the footage appeared only once. Cropping appeared twice. Correction/editing was the one that appeared most often and therefore stands out from the rest of the types of editing. Fourteen documents explicitly identified that the images were not edited. This factor is important, as for some types of studies it is important to keep the image intact, as only its originality will achieve the expected results. An edition could alter the “truth” of that reality. Images without editing were only identified in the ArtH and LifeSB domains. However, it is important to remember that it is not possible to say that in other areas this has not happened, and there is just no information about it.
3.4.2 Analysis Type
Another process related to image processing/analysis is the type of analysis that can be performed. The analysis used for the images is an important feature to verify. In the context of this study, two types of analyses were determined: qualitative analysis and quantitative analysis. Table 8 presents this information.
Analysis type per domain and significant comparisons
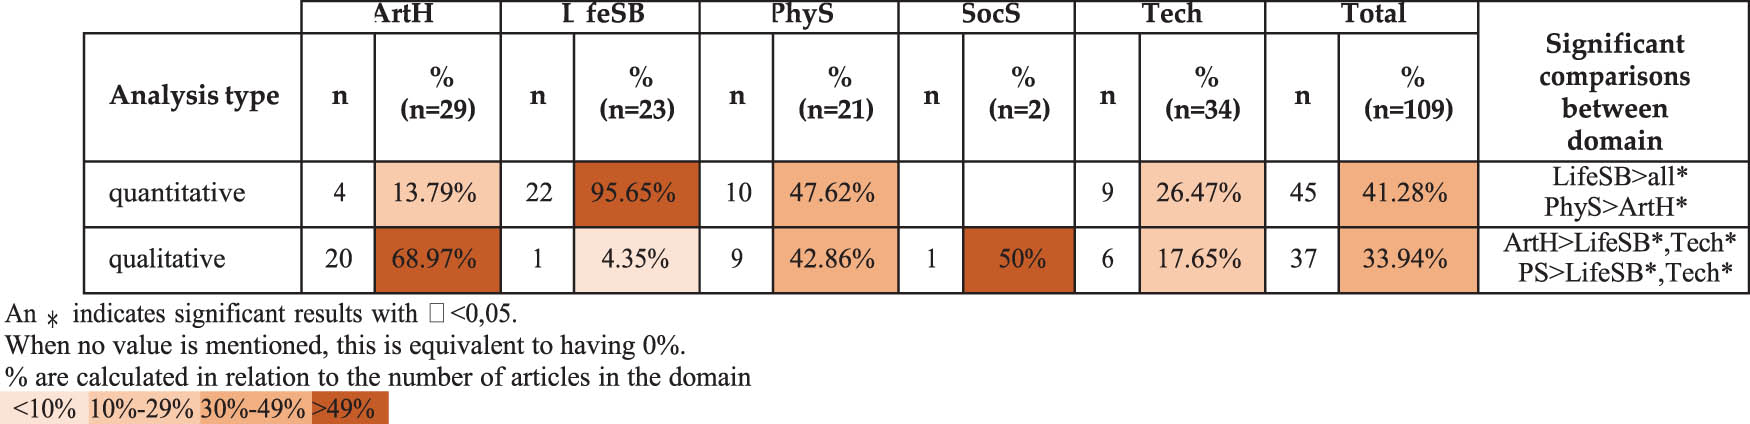 |
The ArtH and SocS domains are those in which qualitative analysis prevails. This result was expected, as studies in the social and human spheres are closely associated with qualitative analysis techniques. In the cases under study, the works were related to filmed interviews, image content analysis, and the determination of psychological pathologies through images obtained by patients and study participants. In LifeSB, PhyS, and Tech, quantitative analysis prevails. The first one with a lot of prominences, which is also an expected result. In PhyS and Tech, the distribution is more balanced; however, given the character of these domains, more emphasis on quantitative analysis would be expected.
When analyzed in detail, it appears that the articles, in several cases, do not present the information related to processing and analysis. In fact, any process that involves data, as a rule, has an associated analysis. However, this information is not always reported in the articles, as they tend to have summarized information, as has been seen in several cases throughout this study.
The type of analysis performed on the images can often be related to the scenario in which these images were collected. For this reason, it is interesting to see what kind of correlation exists between these two parameters. When we verify the relationship between the type of analysis made to the images and the collection scenarios, we realize that when it comes to images produced by researchers in the laboratory, it tends to be quantitative analysis. When the images are produced by researchers outside the laboratory, the type of analysis tends to be qualitative (Table 9).
Collection technique vs analysis type
| Qualitative | Quantitative | ||
|---|---|---|---|
| Collection technique | In lab | 9 | 31 |
| Out lab | 22 | 11 | |
| Total | 31 | 42 | |
3.4.3 Programs
Also, the programs that are used during research are important in the processing/analysis phase. It is necessary to understand what kinds of programs are used for tasks such as editing or analyzing images. In the context of this work, 45 programs were identified. Note that a document can have more than one associated program. Table 10 presents the analysis of the programs.
Programs used per domain and significant comparisons
 |
The four programs with the highest incidence are ImageJ (computer program for image processing, publicly accessible and developed in Java), Matlab (high-performance interactive software focused on numerical analysis, matrix calculation, signal processing, and graphing), Mathworks (mathematical computing software that supports data analysis and simulation), and SPSS (software with application analytics, data mining, text mining, and statistics). In total, 67 of the documents did not contain information on the programs. The ImageJ program is the one that appears most persistently in the analyzed documents. Although these are the most representative programs in the sample of articles under study, it is clear that there is a set of other programs used in the most diverse domains.
It was found that in 100% of the cases collected regarding the programs, these are associated with digital images. In Section 3.5, the results related to the description tasks that occurred in the images under study will be presented. However, it is interesting to note that 7 of the 19 occurrences of description that were verified happen when there is the identification of an associated program. Further ArtH, there will be results inherent to the deposits/publications of the images under analysis, in Section 3.6. However, still, in the context of the programs, it is interesting to note that in 11 of the 13 documents where it was explicit that the task of depositing the images existed, there is also evidence of the use of a program.
This indicates that they make the description in a more formal way than the others that only identify annotation tasks. Of all the documents analyzed, 90 did not present information regarding the description of the images. Taking into account the potential of data management, this value is high, as it would be expected that more researchers would describe their data. However, as with other topics, the fact that it is not mentioned in the article does not necessarily imply that it did not happen.
3.5 Description
The description is a big challenge in data management. Metadata plays an essential role in this task since they allow the inclusion of important information for the interpretation of data by third parties. In addition, they allow data reuse and preservation. However, the data description process is often seen as demanding and time-consuming. For this work, it was important to understand if the researchers described their images and how this task was performed. The description can be done using various techniques. In the analyzed documents, we identified nine notes/annotations, one tag, four metadata/descriptors, three labels, one classification, and one keyword.
In order to systematize all the information, these description techniques were divided into two categories: structural metadata (metadata, descriptor, label, classification, and keywords) and non-structural metadata (notes, annotations, and tags). Table 11 shows the relation of the description of the images by research domain.
Image description per domain and significant comparisons
 |
ArtH and Tech privilege descriptions at a non-structural level, using more informal methods, such as annotations or tags. However, in ArtH, there is no use of structural methods, which leads one to wonder if the socio-humanistic domains do not usually use planned description approaches. LifeSB and Phys, on the other hand, use structural metadata more frequently, with more formal characteristics. The PhyS uses exclusively structural description, which may be related to the accuracy of description that is necessary for studies in this domain.
The distribution of results between the two categories is very balanced. However, non-structural metadata stands out lightly. It should be noted that only four documents explicitly present the terminology “metadata”/“descriptors,” which indicates that they make the description in a more formal way than the others that only identify annotation tasks. The first case is in the LifeSB domain, where microscopic images were collected in which metadata was associated with each set of images. In addition to being present in the description, the authors of the article stated that the metadata were also deposited and shared along with the datasets. In the second case, in PhyS domain, a description of the data was carried out, establishing a set of descriptors to be filled out. One of the descriptors was filled in using an image that showed the type of infrastructure (“photo used”). The remaining descriptors were textual (“green infrastructure” and “type scale level”). The last two cases are in the Tech domain. In the first case, a list of descriptors is presented at the end of the article, which systematizes the article and allows for a better interpretation. It is possible to see this list as a metadata model for describing the data, including images. In the second case, the data set contains a set of photos uploaded by amateur photographers with searchable metadata and keywords.
Of all the documents analyzed, 90 did not present information regarding the description of the images. Taking into account the potential of data management, this value is high, as it would be expected that more researchers would describe their data. However, as with other topics, the fact that it is not mentioned in the article does not necessarily imply that it did not happen.
Still, in the description sphere, it was tried to verify if the type of image has any relevance in the description. Only five types of images appear associated with the description: photographs, microscopic images, medical images, computer-made images, and videos. Table 12 systematizes these results.
Image type vs image description
| Image type | Total images with associated description |
|---|---|
| Photography | 10 (55.56%) |
| Microscopic image | 6 (33.33%) |
| Medical image | 2 (11.11%) |
| Computer-made image | 1 (5.56%) |
| Video | 1 (5.56%) |
3.6 Sharing
Researchers are increasingly encouraged (and sometimes required) to make their research data findability, accessible, interoperable, and reusable. Sharing is one of the essential phases of these practices. In this topic, deposit and licensing issues were analyzed.
3.6.1 Data Deposit
Data deposit practices are increasingly recurrent. Researchers find here an opportunity to disseminate their work, share knowledge, and see their work reused and cited. However, many researchers still show some resistance to depositing and sharing their data openly.
This topic presents an analysis of the documents that present information about depositing or publishing your images. Table 13 presents this information. This table only presents information for documents that claimed to deposit their images. None of the remaining documents analyzed stated clearly that it did not deposit the images.
Image deposit per domain and significant comparisons
 |
We identified 16 documents in which the images were deposited; 92 documents did not present this information, so we don’t know if they were deposited or not. The LifeSB domain showed the most cases. The remaining domains show few results for deposit.
As for the verified deposit locations, they are diverse, but they fall mainly on open access archives, institutional open access repositories, general open access repositories, and on GitHub. This fact leads us to believe that there may be other works whose data are deposited; however, it is not possible to say whether they do it or not. None of the analyzed documents showed the access policy of their deposits; therefore, it is not possible to identify whether the deposited images were shared with open access or if they are kept private. The access policy, as a rule, may depend on the phase in which the project is taking place, on the need to share it for publication in scientific journals, or, for example, for the guarantee of authorship.
3.6.2 Licenses
Licenses are essential tools in the scientific production and communication process. They secure copyrights and identify the access policy. In this work, all licenses mentioned by the authors of the documents were identified. Nine licenses have been identified, four belonging to the Creative Commons Licenses group. Nature, APA, Elsevier, AAAS, and ACS licenses were also identified. Note that only 55 of the 109 articles under analysis included information regarding the license. A brief explanation of these licenses is given in Table 14.
License description
| License | Description | Link |
|---|---|---|
| CCBY | It allows others to distribute, adapt, and develop others’ work, even commercially, as long as they credit the original author. This is the most flexible license | shorturl.at/mtvBO |
| CCBY-NC | This license allows others to adapt and develop works by other authors on a non-commercial basis. It does not require the licensing of derivative works on the same terms as the originals | shorturl.at/dkloG |
| CCBY-NC-ND | It is the most restrictive license as it only allows others to download works and share them, as long as credit is given to the original authors. It is not allowed to change or use the works for commercial purposes | shorturl.at/dirtB |
| CCBY-NC-SA | This license allows others to adapt and develop the work of the original authors on a non-commercial basis, as long as they credit the authors and license the new creations under the same terms | shorturl.at/rsyIQ |
| Nature | License applied to all journals published by Nature Portfolio, including Nature and journals with “Nature” in their titles. These policies are compatible with the vast majority of funders’ open access and self-archiving policies | shorturl.at/msxJL |
| APA | License that addresses licensing and certification issues in psychology | shorturl.at/goxOQ |
| Elsevier | Works under an Elsevier license are copyrighted. Users may access, download, copy, translate, and extract texts and data, for non-commercial purposes, under a set of conditions. However, it is not possible to redistribute, display, or adapt the works | shorturl.at/pFKOT |
| AAAS | This license allows AAAS exclusive rights to publish the work. Authors can choose between two Creative Commons licenses (CC BY-NC and CC BY) | shorturl.at/wFLR9 |
| ACS | Intended for core feature sets and add-on licenses based on incremental features. Allows the author to choose four different typologies. Requires a base license file to be applied to each ACS server. Has Large Deployment and CTS feature licenses | shorturl.at/JPQ28 |
Table 15 indicates the use of licenses by the research domain. From a general point of view, licenses from the Creative Commons group are the most used, especially CCBY, with the exception of the PhyS domain where CCBY-NC-ND is the most used.
Licenses per domain and significant comparisons
 |
The Tech domain has a greater diversity of licenses. Given the broad spectrum of types of works in this domain, we were expecting it. In ArtH, 11 works have an associated license, while in LifeSB, 18 works have an assigned license, proving to be the best-positioned domain in terms of licenses. PhyS, on the other hand, only present eight documents with information on the licenses. In SocS, the two documents that make up the domain present information on the licenses.
Whether we produce a resource or reuse it from third parties, it is important to indicate the intellectual property relating to that resource. Scientific transparency allows for resource sharing and, consequently, a healthy open-access policy. For this reason, Table 16 presents the relationship between the use and production of the images and the respective licenses.
Image acquisition vs licenses
| License | Total | |||||||||
|---|---|---|---|---|---|---|---|---|---|---|
| CC BY | CC BY NC-ND | CC BY NC-SA | CC BY NC | APA | Elsevier | AAAS | Nature | ACS | ||
| Use | 3 (60%) | 2 (40%) | 0 | 0 | 0 | 0 | 0 | 0 | 0 | 5 (9.1%) |
| Production | 29 (58%) | 9 (18%) | 3 (6%) | 1 (2%) | 1 (2%) | 1 (2%) | 1 (2%) | 4 (8%) | 1 (2%) | 50 (90.9%) |
| Total | 32 (58.18%) | 11 (20%) | 3 (5.45%) | 1 (1.82%) | 1 (1.82%) | 1 (1.82%) | 1 (1.82%) | 4 (7.27%) | 1 (1.82%) | 55 |
Of the 19 documents in which the images are used, 5 (26.32%) mention the license. In all five cases, we found that the intellectual property belongs to another person, and therefore, there may be no knowledge of the license. However, when images are collected from platforms such as repositories, in most cases the license has to be associated with the resource. However, it is also common for researchers to obtain resources through direct contacts, such as e-mails, and therefore, this information may not be transmitted.
Of the 91 documents in which the images are produced, 50 (54.95%) mention the license. When the images are of their own authorship, researchers tend to indicate the license, as it works as security in relation to resources. Still, in the analyzed documents, just over half indicated the license information. This does not exclude that the license exists; it may just not have been included in the final version of the document.
4 Discussion
After a detailed analysis of the results obtained from this study, it is important to discuss those that were the essential topics that motivated the accomplishment of this work. For this, it is necessary to understand whether answers were obtained for the research questions presented in Section 1. As for RQ1, we can say that in the published works, it was not possible to identify with precision and without any doubt the existence of formal practices and standards in the management of images as research data. In several cases, we were able to identify patterns by research domain or practices that are more associated with a certain type of image or research profile. With the analysis of all the works, we were able to conclude that there are several behaviors associated with image management; however, these behaviors do not result from a formal protocol, pre-established and designed to standardize the method of image data management. It became clear that in research routines, researchers tend to find methods, techniques, and tools that they consider more favorable for the context of their work, but they do not formally document these practices in the work they publish.
In relation to RQ2, it was quite clear that the research domain, in several cases, determines the way images are managed. We noticed that most of the time, different research domains manage images differently. First, the image types prevalent in each domain are different from each other. This difference means that images are often managed in different ways. If in other types of data, the differences are not always so significant, in data in image format, their typology determines very different characteristics. A photograph has characteristics that distinguish it from a map, just as a drawing has different characteristics from a microscopic image. These particularities reveal a need for its own management, whether due to its format, form of analysis, organizational and storage capacity, or even publication. Furthermore, the profile of researchers in each domain is different. Whether due to working conditions (in the laboratory or outside it, for example), previous knowledge, academic education, and previous interaction with the dynamics of RDM.
Regarding RQ3, it is possible to notice that a good part of the works indicates that the researchers are aware of some data management practices and policies, although they do not explicitly say so in their works. This conclusion can be obtained through the analysis performed. We believe that the management practices they plan and execute are not documented in the articles they publish, other than mandatory topics, such as licenses. In many cases, a thorough reading of the work and an analysis of the procedures were necessary to find and interpret these practices and policies. They exist in many cases but are rarely documented in the articles. This is also a particularity in this analysis because in most cases where there is no information about a particular topic, we cannot say whether that practice exists or not, there is just no information about it.
As for RQ4, we cannot say with certainty that habits and trends related to image tend to change over the years. Our study covered a time span of 11 years (2010–2021), so during this period, there were no major variations or certain specific characteristics that we can identify and say are related to the passage of years.
This work arose from the need to understand the habits and behaviors of researchers who use and produce images. When we started this study, we found that the literature did not have works that would allow us to clearly analyze this topic. The theoretical material found never focused on this subject as the main theme of the studies and this gap limited future work. For this reason, over the last few years, we have developed some works that explore these dynamics, trying to understand in detail the issues of images in science.
In 2019, we carried out work, focused on a case study, composed of a research group in the domain of sustainable mobility (Rodrigues & Lopes, 2020). In 2020, we started a new study, this time with researchers and groups from different research domains, where, through questionnaires, we collected numerous results on image management (Fernandes et al., 2020). In 2022, we will continue this study, this time using semi-structured interviews, in order to compare the results previously obtained (Rodrigues & Lopes, 2022b). Also in 2022, we carried out a study where we focused on image management practices in the description phase, in order to verify the particularities of this research process and which resulted in the proposal of a new metadata model for the description of data in image format and a set of controlled vocabularies for some of your metadata (Rodrigues & Lopes, 2022a). With this work, we intend to close this research cycle, combining the results of the literature with the results obtained in contact with researchers. These five works made it possible to perceive the consistency of some practices and habits, determine limitations and challenges, and give robustness to the results achieved.
5 Conclusion
This study allowed us to reflect on how research projects and researchers prepare and plan the use of images. In fact, it became clear that the use and production of images can happen many times; however, this frequency decreases when images acquire the main role of research.
Clearly, there are still tasks associated with RDM that are left out by researchers. This happens with the most common data typologies, such as textual and numeric data, but it is even more accentuated when the data are of an imagery nature. There is no clear reason for this. In fact, the exponential growth of image production, associated with technological advances that allow the capture and dissemination of images, has led to a greater awareness of this type of data. Perhaps, because the images are still seen as complements to the research, they make them more susceptible to lack of management, unless they are imperatively the main topic of the study. Practices related to the definition of the typology of images and capture instruments, as well as the establishment of the use and production of images, their type of analysis, and methodology, are in several cases reported in the articles. However, details related to programs used, descriptions of images, and deposits are often omitted. One of the problems of this careful analysis, thorough analysis dimensions, involves realizing whether that information is really non-existent or just not reported in the article.
The idea is that two fundamental pillars are missing: (1) alerting to the diversity of data typologies, associated with the explanation of their characteristics, potentials, and challenges; (2) encouraging, sensitizing, and teaching about RDM and its impact on research projects.
Future work involves developing several tools that facilitate the work of researchers in the task of data management, namely when these data are images. We are in the process of publishing a metadata model and controlled vocabularies for the description of images. We believe that this will significantly contribute to a better understanding of the image description process. We are also working on an experiment that aims to establish a scenario of how the process of interpreting images in repositories occurs, with the objective of determining gaps and proposing improvements in the deposit and publication process. Previous work, the present work, and what is defined as future work will be fundamental for another objective: to prepare a guiding document with guidelines for the management of data in image format that systematizes a series of good practices, suggests research and management policies, and clearly explains its advantages, in order to raise awareness of this topic.
Although it follows a systematic process, this work has specific characteristics that make it deviate from a pure systematic review. Since we wanted to consider articles from different scientific fields, we did not use a search query and selected works by their impact (assessed through their number of citations). We limited the selection to the top ten most cited works per year to allow a manual analysis of the results. Given this, future replications of this methodology may consider a different set of articles. However, besides changes caused by the natural evolution of the current practices, we don’t expect this change in the included articles will impact our results. We believe our 109 articles statistically represent the actual state of image management practices.
Acknowledgments
Joana Rodrigues is supported by a research grant from FCT – Fundação para a Ciência e Tecnologia: PD/BD/150288/2019.
-
Conflict of interest: The authors state no conflict of interest.
References
Ball, A. (2012). Review of data management lifecycle models (tech. rep.). Bath, UK: University of Bath. https://purehost.bath.ac.uk/ws/files/206543/redm1rep120110ab10.pdf.Suche in Google Scholar
Banks, M. (2007). Using visual data in qualitative research. In U. Flick (Ed.). USA: SAGE Publications.10.4135/9780857020260Suche in Google Scholar
CASRAI. (2022). Data. https://casrai.org/term/data/.Suche in Google Scholar
Fernandes, M., Rodrigues, J., & Lopes, C. T. (2020). Management of research data in image format: An exploratory study on current practices. International Conference on Theory and Practice of Digital Libraries - Digital Libraries for Open Knowledge (pp. 212–226). doi: 10.1007/978-3-030-54956-5_16.Suche in Google Scholar
Layne, S. S. (1994). Some issues in the indexing of images. Journal of the American Society for Information Science, 45(8), 583–588. doi: 10.1002/(SICI)1097- 4571(199409)45:8<583: AID-ASI13>3.0.CO;2-N.Suche in Google Scholar
Liberati, A., Altman, D. G., Tetzlaff, J., Mulrow, C., Gøtzsche, P. C., Ioannidis, J. P. A., … Moher, D. (2009). The prisma statement for reporting systematic reviews and meta-analyses of studies that evaluate healthcare interventions: Explanation and elaboration. BMJ, 339. doi: 10.1136/bmj.b2700.Suche in Google Scholar
OECD. (2007). OECD Principles and Guidelines for Access to Research Data from Public Funding. https://www.oecd.org/sti/inno/38500813.pdf.10.1787/9789264034020-en-frSuche in Google Scholar
Palmer, C. L., Thomer, A. K., Baker, K. S., Wickett, K. M., Hendrix, C. L., Rodman, A., … Fouke, B. W. (2017). Site-based data curation based on hot spring geobiology. PLoS ONE, 12(3), e0172090. doi: 10.1371/journal.pone.0172090.Suche in Google Scholar
Rodrigues, J., & Lopes, C. T. (2020). A utilização e tratamento de documentos fotográficos em projetos de investigação: O caso do generation.mobi. Actas del IV Congreso ISKO España-Portugal 2019, XIV Congreso ISKO España, 241–252.Suche in Google Scholar
Rodrigues, J., & Lopes, C. T. (2022a). Describing data in image format: Proposal of a metadata model and controlled vocabularies. Journal of Library Metadata, 213–234. doi: 10.1080/19386389.2022.2117511.Suche in Google Scholar
Rodrigues, J., & Lopes, C. T. (2022b). Research data management in the image lifecycle: A study of current behaviors. RCIS: International Conference on Research Challenges in Information Science. Lecture Notes in Business Information Processing (Vol. 446, pp. 213–234).10.1007/978-3-031-05760-1_3Suche in Google Scholar
Sandweiss, M. A. (2007). Image and artifact: The photograph as evidence in the digital age. Journal of American History, 94(1), 193–202. doi: 10.2307/25094789.Suche in Google Scholar
Serén, M. d. C. (2013). O documento fotográfico: Da mediação cultural à mediação técnica. Revista Do CITCEM, 25, 183–192. https://ojs.letras.up.pt/index.php/CITCEM/article/view/4855.Suche in Google Scholar
Silva, J. R. (2014). Photography and science: The utopia of objective image and its uses in the sciences and medicine. Boletim do Museu Paraense Emilio Goeldi: Ciencias Humanas, 9(2), 343–360. doi: 10.1590/1981-81222014000200006.Suche in Google Scholar
Structural Reform Group. (2004). DDI Version 3.0 Conceptual Model, DDI Alliance. https://ddialliance.org/sites/default/files/Concept-Model-WD.pdf.Suche in Google Scholar
UK Data Archive. (2019). Research data lifecycle. Retrieved December 19, 2019, from. https://www.ukdataservice.ac.uk/manage-data/lifecycle.aspx.Suche in Google Scholar
© 2023 the author(s), published by De Gruyter
This work is licensed under the Creative Commons Attribution 4.0 International License.
Artikel in diesem Heft
- Regular Articles
- An Empirical Evaluation of Research on “Library Management” at the Doctoral Level in India: A Study of the Last 50 Years from 1971 to 2020
- Social Unrest Prediction Through Sentiment Analysis on Twitter Using Support Vector Machine: Experimental Study on Nigeria’s #EndSARS
- Measuring the Concept of PID Literacy: User Perceptions and Understanding of PIDs in Support of Open Scholarly Infrastructure
- Culturally Responsive Librarians: Shifting Perspectives Toward Racial Empathy
- Farmers’ Use of the Mobile Phone for Accessing Agricultural Information in Haryana: An Analytical Study
- How European Research Libraries Can Support Citizen-Enhanced Open Science
- Research Image Management Practices Reported by Scientific Literature: An Analysis by Research Domain
- Adding Perspective to the Bibliometric Mapping Using Bidirected Graph
- Students’ Perspectives on the Application of Internet of Things for Redesigning Library Services at Kurukshetra University
- Whom Do I Ask? First-Time Postpartum Mothers in a Developing Economy
- The Effectiveness of Software Designed to Detect AI-Generated Writing: A Comparison of 16 AI Text Detectors
- Requirements of Digital Archiving in Saudi Libraries in the Light of International Standards: King Fahad National Library as a Model
- Analyzing Hate Speech Against Women on Instagram
- Adequacy of LIS Curriculum in Response to Global Trends: A Case Study of Tanzanian Universities
- COVID-19 Emergency Remote Teaching: Lessons Learned from Five EU Library and Information Science Departments
- Review Article
- Assessing Diversity in Academic Library Book Collections: Diversity Audit Principles and Methods
- Communications
- Twitter Interactions in the Era of the Virtual Academic Conference: A Comparison Between Years
- The Classification of Q1 SJR-Ranked Library and Information Science Journals by an AI-driven “Suspected Predatory” Journal Classifier
- Scopus-Based Study of Sustainability in the Syrian Higher Education Focusing on the Largest University
- Letter to the Editor
- Most Preprint Servers Allow the Publication of Opinion Papers
- SI Communicating Pandemics: COVID-19 in Mass Media
- COVID-19 in Mass Media: Manufacturing Mass Perceptions of the Virus among Older Adults
- Topical Issue: TI Information Behaviour and Information Ethics
- A Compass for What Matters: Applying Virtue Ethics to Information Behavior
- Studies on Information Users and Non-Users: An Alternative Proposal
- Ethical Issues of Human Information Behaviour and Human Information Interactions
- Ethics and Social Responsibility in Information Behavior, an Interdisciplinary Research in Uruguay