Cooperative Authoritarians and Regime Stability
-
Clay Robert Fuller


Abstract
This article assumes that the post-cold war unipolar global power structure marked the beginnings of a two-level game of national survival involving an international process of “othering,” where the winning democracies and their leaders (the “West”) view many non-democracies and their leaders as threats that they must convert, subjugate, or eradicate. Using new data on special economic zones (SEZs), I find that geographically restricting economic liberalization and reducing competition from opposition parties increases authoritarian stability and durability in this new environment.
References
Brambor, Thomas, William Roberts Clark, and Matt Golder. 2005. “Understanding Interaction Models: Improving Empirical Analyses.” Political Analysis 13:1–20.10.1093/pan/mpi014Suche in Google Scholar
Boix, Carles, and Milan Svolik. 2013. “The Foundations of Limited Authoritarian Government: Institutions and Power-Sharing in Dictatorships.” Journal of Politics 75 (2):300–16.10.1017/S0022381613000029Suche in Google Scholar
Boyenge, J.P.S. 2007. ILO Database on Export Processing Zones, Revised. Geneva: International Labour Organization.Suche in Google Scholar
De Mesquita, B., A.S. Bruce, R.M. Siverson, and J.D. Morrow. 2003. Logic of Political Survival. Cambridge: MIT Press.10.7551/mitpress/4292.001.0001Suche in Google Scholar
Drukker, D.M. 2003. “Testing for Serial Correlation in Linear Panel Data Models.” The Stata Journal 3 (2):168–177.10.1177/1536867X0300300206Suche in Google Scholar
Dunning, T. 2008. Crude Democracy: Natural Resource Wealth and Political Regimes. Cambridge: Cambridge University Press.10.1017/CBO9780511510052Suche in Google Scholar
Farole, T., and G. Akinci, ed. 2011. Special Economic Zones; Progress, Emerging Challenges, and Future Directions. Washington, DC: The World Bank.10.1596/978-0-8213-8763-4Suche in Google Scholar
FIAS (Foreign Investment Advisory Service). 2008. Special Economic Zones. Performance, Lessons Learned, and Implications for Zone Development. Washington, DC: World Bank.Suche in Google Scholar
Fine, M. 1994. “Working the Hyphens: Reinventing Self and Other in Qualitative Research.” In Handbook of Qualitative Research, edited by by N.K. Denzin and Y. Lincoln, 70–82. Sage: Thousand Oaks.Suche in Google Scholar
Gates, S., H. Hegre, M.P. Jones, and H. Strand. 2006. “Institutional Inconsistency and Political Instability: Polity Duration, 1800-2000.” American Journal of Political Science 50 (4):893–908.10.1111/j.1540-5907.2006.00222.xSuche in Google Scholar
Ge, W. 1999. “Special Economic Zones and the Opening of the Chinese Economy: Some Lessons for Economic Liberalization.” World Development 27 (7):1267–1285.10.1016/S0305-750X(99)00056-XSuche in Google Scholar
Gehlbach, S., and A. Simpser. 2015. “Electoral Manipulation as Bureaucratic Control.” American Journal of Political Science 59 (1):212–224.10.1111/ajps.12122Suche in Google Scholar
Hayek, Friedrich A. 1944. The Road to Serfdom. Chicago: University of Chicago Press.Suche in Google Scholar
Kaufmann, D., A. Kraay, and M. Mastruzzi. 2010. “The Worldwide Governance Indicators: Methodology and Analytical Issues.” Policy Research Working Paper Series 5430. The World Bank.Suche in Google Scholar
Katzenstein, P.J., ed. 1978. Between Power and Plenty: Foreign Economic Policies of Advanced Industrial States. Madison: University of Wisconsin Press.Suche in Google Scholar
Kawczynski, D. 2011. Seeking Gaddafi: Libya, the West, and the Arab Spring. Biteback Publishing: London.Suche in Google Scholar
Krasner, S. 1978. Defending the National Interest: Raw Materials Investments and U.S. Foreign Policy. Princeton: Princeton University Press.10.1515/9780691219516Suche in Google Scholar
Laakso, M., and R. Taagepara. 1979. “Effective Number of Parties: A Measure with Application to Western Europe.” Comparative Political Studies 12 (1):3–27.10.1177/001041407901200101Suche in Google Scholar
Levitsky, S., and L.A. Way. 2010. Competitive Authoritarianism: Hybrid Regimes after the Cold War. Cambridge: Cambridge University Press.10.1017/CBO9780511781353Suche in Google Scholar
Marshall, M.G., and B.R. Cole. 2009. “State Fragility Index Matrix 2009.” Center for Systemic Peace.Suche in Google Scholar
Milner, H.V. 1997. Interests, Institutions, and Information. Princeton University Press: Princeton.Suche in Google Scholar
Nohlen, Dieter, Florian Grotz, and Christof Hartmann. 2002. Elections in Asia: A Data Handbook. Oxford University Press.Suche in Google Scholar
Pargeter, A. 2012. Libya: The Rise and Fall of Qadaffi. Yale University Press: New Haven.Suche in Google Scholar
Putnam, R.D. 1988. “Diplomacy and Domestic Politics: The Logic of Two-Level Games.” International Organization 42 (3):427–460.10.4324/9781315251981-16Suche in Google Scholar
Ramet, Sabrina P. 2007. The Liberal Project and the Transformation of Democracy: The Case of East Central Europe. College Station: Texas A&M University Press.Suche in Google Scholar
Rueschemeyer, D., E.H. Stephens, and J.D. Stephens. 1992. Capitalist Development & Democracy. University of Chicago Press: Chicago.Suche in Google Scholar
Schwalbe, Michael, Sandra Godwin, Daphne Holden, Douglas Schrock, Shealy Thompson, and Michele Wolkomir. 2000. “Generic Processes in the Reproduction of Inequality: An Interactionist Analysis.” Social Forces 79 (2):419–52.10.2307/2675505Suche in Google Scholar
Tsai, Kellee S. 2007. Capitalism Without Democracy: The Private Sector in Contemporary China. Ithaca: Cornell University Press.Suche in Google Scholar
Wilson, Matthew, and Joseph Wright. 2015. “Autocratic Legislatures and Expropriation Risk.” British Journal of Political Science 47:1–17.10.1017/S0007123415000149Suche in Google Scholar
Wintrobe, Ronald. 1998. The Political Economy of Dictatorship. Cambridge: Cambridge University Press.10.1017/CBO9781139174916Suche in Google Scholar
Wooldridge, J. 2002. Econometric Analysis of Cross Section and Panel Data. MIT Press: Cambridge.Suche in Google Scholar
Wright, Joseph. 2008. “Do Authoritarian Institutions Constrain? How Legislatures Affect Economic Growth and Investment.” American Journal of Political Science 52 (2):322–43.10.1111/j.1540-5907.2008.00315.xSuche in Google Scholar
Wright, Joseph. 2009.“How Foreign Aid Can Foster Democratization in Authoritarian Regimes.” American Journal of Political Science 53:552–71.10.1111/j.1540-5907.2009.00386.xSuche in Google Scholar
Appendix
Benefits provided by SEZs
Table 3 lists the potential direct and indirect benefits generated from SEZs (the list is not exhaustive). SEZs boost foreign direct investment (FDI) by enticing preselected international investors with prefabricated or impressive infrastructure, low or absent import/export duties, and large labor pools. Because investors are preselected and zones are built specifically to needs, elites are able to screen potential political challengers. Elites can also restrict the employment and foreign exchange earnings generated by SEZs to other trustworthy elites or even outsource labor to less threatening neighboring populations. Indirect benefits include training from multinationals, technology transfer, demonstration effects, and a restricted environment for testing wider economic reform policies among other things. These indirect effects are clearly apparent in China where the Chinese government uses the training provided in SEZs and copies technologies to build their own versions of everything from green technology, transportation systems, cars, and smart phones to their own versions of Facebook (Renren) and Twitter (Weibo).
Explanation of coding scheme for SEZs
A score of 1 = “In Name Only” and represents the passage of a SEZ law. The SEZ program categories range accordingly; 2 = “Isolated,” 3 = “Small,” 4 = “Medium,” 5 = “Large,” and 6 = “Extensive.” Each of these categories represents a significant step up in the size and quality. In the large and extensive categories, this coding implies that a significant amount of wealth and power is being restricted to a screened group of regime supporting elites. According to the theory we should expect that the interaction between higher levels of SEZ program and the inconsistent institutional environment of anocracies will positively and significantly correlate with regime stability is such regimes, ceteris paribus.
Isolated zone programs typically contain a small EPZ, industrial park, or single factory program with mostly local investment. Cameroon is an example of this type of zone system; it has one small EPZ, a single-factory, and mostly local investment (FIAS (Foreign Investment Advisory Service) 2008). Small zone programs have moderate size EPZs or FTZs with at least one foreign investor and a limited number of production sectors. Belarus is an example; its Brest Economic Zone set up in 1996, is of a moderate size and boasts investment from three neighboring countries.
Medium zone programs have several moderate sized EPZs, FTZs, and a Freeport. Venezuela illustrates this category; it has a Freeport (Isla Margarita) and three moderate sized FTZs (Paraguana Peninsula, Santa Elena de Uairen, and Merida). Large zone programs have multiple EPZs, FTZs, or Freeports with multiple sectors and multiple foreign investors. Russia and Singapore fall in the large category. Russia has over 25 SEZs that are ambitiously expanding and Singapore has 8 large freeports and SEZs spread over its territory. Honduras, a country that declared the entire country a SEZ in 1998, falls in this category as well (Farole and Akinci. 2011). Extensive zone programs are essentially large zone programs that represent a larger portion of the state’s macroeconomic outlook and contain “specialized zones” such as Education Cities, Media and Internet zones, or other purposeful zones. The U.A.E., China, Egypt, and Jordan are examples of this category. The U.A.E. and Jordan have every type of known zone, China creates zones for very narrow purposes, Egypt has what are called QIZ (qualified industrial zones) that have been set up by the U.S. in order to foster trade and peace between Egypt, Jordan, and Israel (FIAS (Foreign Investment Advisory Service) 2008).
Explanation of the state fragility index
Political effectiveness measures regime durability, leader years, and total coup events and political legitimacy measures factionalism, ethnic discrimination, and the salience of elite ethnicity. Economic effectiveness is GDP per capita and economic legitimacy is the share of export trade in manufactured goods. Social effectiveness measures human capital development and social legitimacy measures the infant mortality rate. Security effectiveness measures the total residual war and security legitimacy is a measure of state repression. In the original data a zero represents a lack of fragility and a 25 represents extreme fragility. I reverse the score, so that a zero equates to extreme instability (fragility) and a 25 equates to strong stability, in order to make the results more readily interpretable. Taken together, the levels of effectiveness and legitimacy in the political, economic, social, and security realms provide a broad and general picture of regime stability. For a detailed look at the coding rules for all eight levels, see the State Fragility Index Codebook here http://www.systemicpeace.org/inscr/SFImatrix2009c.pdf. See the 2011 Global Report from the Center for Systemic Peace here http://www.systemicpeace.org/GlobalReport2011.pdf. Many analysts use infant mortality to proxy for state “well-being” or sometimes government stability. The State Fragility Index correlates with infant mortality very strongly at the .864 level, but it has better coverage of a wider range of indicators. Table 5 shows what each additive indicator measures.
Plotted state fragility index (alternative outcome variable)
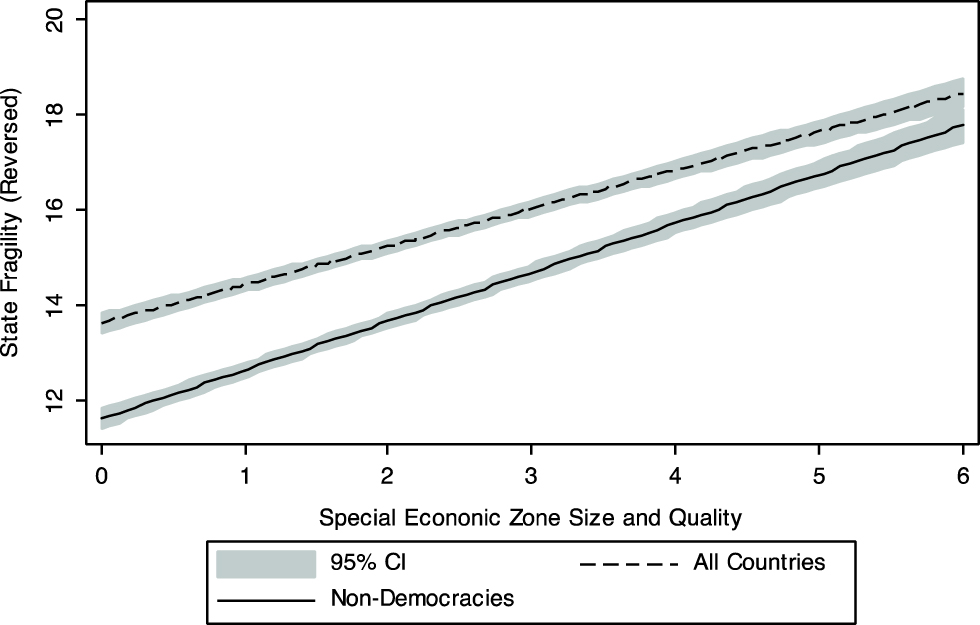
Predicted political stability by SEZs (1995–2010).
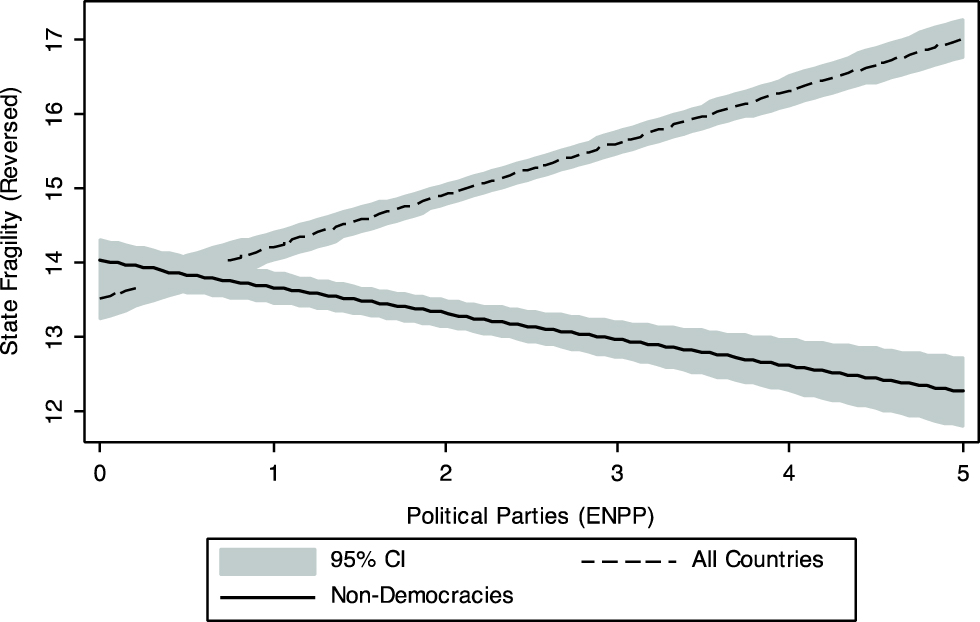
Predicted political stability by political parties (1995–2010).
© 2017 Walter de Gruyter GmbH, Berlin/Boston
Artikel in diesem Heft
- Frontmatter
- Articles
- Cooperative Authoritarians and Regime Stability
- FDI Uppers and Downers: A Macedonian Case Study
- Commentary
- Bruce Mazlish and Global History
- Review Essay
- Don Tapscott and Alex Tapscott: Blockchain Revolution
- Documentation
- America’s Global Moment: Italy Witnesses the Spanish-American War
- Book Reviews
- Barry Buzan and George Lawson: The Global Transformation: History, Modernity and the Making of International Relations
- Tim Bartley, Sebastien Koos, Hiram Samel, Gustavo Setrini and Nik Summers: Looking Behind the Label: Global Industries and the Conscientious Consumer