Detection and management of differences in biochemical results across identical analyzers in high-volume laboratories: a practical internal quality control-based method
-
Özlem Gürsoy Doruk

 ,
Sezer Uysal
,
Hazar Gözgöz
,
Burak Gündoğdu
,
Sezer Uysal
,
Hazar Gözgöz
,
Burak Gündoğdu

Abstract
Objectives
Ensuring result comparability across identical analyzers is critical in high-throughput clinical laboratories. ISO 15189:2022 emphasizes this requirement (clause 7.3.7.4), particularly for assays with low within-subject biological variation (BV), where reference intervals may be insufficient to detect clinically relevant changes.
Methods
This study aimed to implement a practical rule-based approach for evaluating result consistency across identical analyzers using only internal quality control (IQC) data. At Dokuz Eylul University Central Laboratory (DEU-CL), IQC results from two Beckman Coulter AU5800 and two UniCel DxI 800 analyzers were collected over 12 months (May 2022–April 2023). Coefficient of variation (CV) and bias were calculated from the first five consecutive working days of each month. Total error (TE) was computed using the RMS method (TE=Bias + 1.65 × CV) and compared to total allowable error (TEa) limits defined by the EFLM BV database and Rili-BAEK guideline.
Results
Among the 20 parameters evaluated, blood urea nitrogen (BUN), C-reactive protein (CRP), direct/total bilirubin, triglycerides, and uric acid consistently met EFLM TEa criteria. In contrast, albumin, creatinine, sodium, and total protein frequently exceeded EFLM limits. Sodium exhibited persistent nonconformities across all months. Most parameters fulfilled Rili-BAEK specifications.
Conclusions
The proposed model enables continuous monthly performance assessment of identical analyzers using only routine IQC data. This approach supports ISO 15189:2022 compliance, facilitates early detection of analytical discrepancies, and may serve as an efficient, cost-effective quality assurance tool for high-volume laboratories.
Introduction
Clinical laboratories are essential for patient management, disease monitoring, and treatment evaluation. Compliance with the International Organization for Standardization (ISO) 15,189:2022 becoming increasingly necessary [1]. One of the technical requirements of this standard (ISO 15189:2022, clause 7.3.7.4) emphasizes the need to ensure the comparability of patient results when the same test is performed on multiple devices.
Clinical assessment of patient results often relies solely on reference ranges, which cover only 95 % of the population. Furthermore, using reference ranges in tests where individual biological variation (BV) is lower than group variation may fail to detect minor but clinically important changes in an individual’s results, which is a characteristic of most clinical biochemistry tests. In such cases, criteria such as critical difference and relative change value (RCV), which represent the variation between consecutive measurements and consider within-individual variability, become relevant [2], 3]. Therefore, using multiple devices for the same test, even if they are of the same brand and model, highlights the importance of minimizing analytical variability.
Results from different devices, even of the same brand and model, must be comparable to ensure consistent patient care. While comparison studies are conducted, there is no consensus on how to perform and evaluate them in daily practice [4].
The literature review reveals a need for more consensus on evaluating the significance of differences between results and using different criteria for this purpose [5], [6], [7].
Our university laboratory, accredited under ISO 15189 since 2012, has consistently maintained this status and initiated systematic studies to compare results from analyzers of the same brand and model. The primary goal was to standardize a model that is easy to implement in routine practice, requires minimal additional workload, and is cost-effective.
In this study, we aimed to demonstrate how, in our institution, a more practical approach can be used to compare the results of the same test performed on multiple identical analyzers by relying solely on internal quality control (IQC) data.
Materials and methods
Materials
Dokuz Eylul University Central Laboratory (DEU-CL) is a tertiary public university laboratory housing biochemistry and microbiology units, where approximately 280 different tests are performed, with about 9.5 million tests per year generated in the biochemistry unit. In 2024, our 1.500 bed hospital served 48.000 inpatients and provided outpatient clinic services to 1.2 million patients. When the analyzers in the biochemistry unit of the CL at our hospital were first installed in the laboratory, a meticulous method verification was performed. This was followed by a comprehensive device comparison with the previous analyzers. Once device and kit performance was approved, they were put into routine operation. The same procedures were performed prior to any change in brand, model, or reagent, and repeated every four years as part of reaccreditation.
Our laboratory has two Beckman Coulter AU5800 analyzers and two Beckman Coulter UniCel DxI 800 Access Immunoassay Systems (Beckman Coulter Inc., Brea, CA, USA), all of which provide two levels of IQC twice daily. After evaluating the results according to Westgard rules (22 S – reject when two consecutive control measurements exceed the same mean plus 2 S or the same mean minus 2 S control limit, 13 S – reject when a single control measurement exceeds the mean plus 3 S or the mean minus 3 S control limit, R4S – reject when one control measurement in a group exceeds the mean plus 2 S and another exceeds the mean minus 2 S), patient samples are tested only on analyzers that comply with the established rules. Two IQC concentrations (Level 1: normal and Level 2: high) provided by the manufacturer were used, with values chosen as close as possible to clinical decision levels or within the reference intervals (Table 1). These data were used throughout the study.
The mean concentrations and units of the two-level (Level 1 and Level 2) IQC materials used were based on the values recommended in the manufacturer’s instructions for usea.
| Test nameb | Level 1 meanc | Level 2 meanc | Unit |
|---|---|---|---|
| Albumin | 2.24 | 4.49 | g/dL |
| ALT | 40.5 | 124 | U/L |
| AST | 48 | 137 | U/L |
| BUN | 17.7 | 80.4 | mg/dL |
| Calcium | 8.96 | 12.4 | mg/dL |
| Creatinine | 1.21 | 5.66 | mg/dL |
| CRP | 13.4 | 25.6 | mg/L |
| Direct bilirubin | 1.08 | 5.34 | mg/dL |
| Ethanol | 41.30 | 104 | mg/dL |
| Glucose | 95.9 | 230 | mg/dL |
| hCG | 3.96 | 27.4 | mIU/mL |
| Hs-TnI | 29 | 58 | ng/L |
| Potassium | 4.12 | 7.07 | mmol/L |
| Sodium | 123 | 153 | mmol/L |
| Triglyceride | 150 | 335 | mg/dL |
| Total bilirubin | 1.51 | 6.26 | mg/dL |
| Total cholesterol | 158 | 296 | mg/dL |
| Total protein | 3.61 | 7.66 | g/dL |
| TSH | 0.24 | 3.04 | µIU/mL |
| Uric acid | 6.12 | 9.83 | mg/dL |
-
aAs specified in the package insert or product prospectus. bThese included clinical significance, the use of different measurement methods such as enzymatic, colorimetric, ultraviolet, and ion-selective electrode techniques, and high-test request frequency. In addition, the ethanol test was included due to its classification as a forensic sample. cFour different materials served as IQC, materials: Beckman coulter control serum, Beckman coulter ITA, control, autonorm immunoassay Sero Control, and Thermo Scientific MAS Control.
Additionally, it should be emphasized that in our laboratory, external quality control (EQC) is performed on each individual autoanalyzer through participation in the Bio-Rad Monthly Clinical Chemistry External Quality Assurance (EQAS) program. The results generated by each analyzer are evaluated separately on a monthly basis.
Within the scope of this study, 17 parameters (albumin, alanine aminotransferase (ALT), aspartate aminotransferase (AST), blood urea nitrogen (BUN), calcium, C-reactive protein (CRP), creatinine, direct bilirubin, ethanol, glucose, potassium, sodium, total bilirubin, total cholesterol, total protein, triglycerides, and uric acid) analyzed in two Beckman Coulter AU5800 devices and three parameters (human chorionic gonadotropin (hCG), high sensitivity troponin I (hs-TnI), thyroid stimulating hormone (TSH)) analyzed in two UniCel DxI 800 Access Immunoassay System analyzers located in the DEU-CL routine biochemistry unit were evaluated. Among the 72 tests analyzed on these analyzers, 20 tests were selected based on clinical significance, frequency, and measurement diversity (Table 1). Specifically, creatinine accounted for 6.53 % of all requests, BUN for 6.11 %, and sodium/potassium for 5.95 %.
One of AU5800 analyzer is equipped with two photometric units, effectively creating three separate analytical paths when distributing photometric analytes. For high-demand tests, multiple reagents can be loaded onto a single unit, and samples are randomly distributed across analyzers. This setup may introduce variability in results.
This study was approved by the Dokuz Eylul University Non-Invasive Clinical Research Ethics Committee (Approval Date: May 31, 2023; Decision Number: 2023/18–09).
Methods
As summarized and illustrated in Figure 1, the study utilized two-level IQC data that Westgard criteria (22 S, 13 S, R4S) and were approved during the first five uninterrupted working days of each month between May 2022 and April 2023. In our study, the CV was calculated using L1 and L2 IQC data obtained over five consecutive working days that met the Westgard rule acceptance criteria. For each test, a CV value was first calculated from the L1 data and another from the L2 data, and the mean of these two values was taken as the CV for that test. Although the number of IQC results used varied according to the characteristics of the test, between 15 and 200 IQC measurements were analyzed for each level, as presented under the “Number of controls” column in Table 2. The first IQC result produced was accepted as the target value (initial result) for that month, and all subsequent calculations were based on this value. This approach supplemented the use of Westgard rules. The rationale behind this method was to enable the detection of minor variations between analyzers.
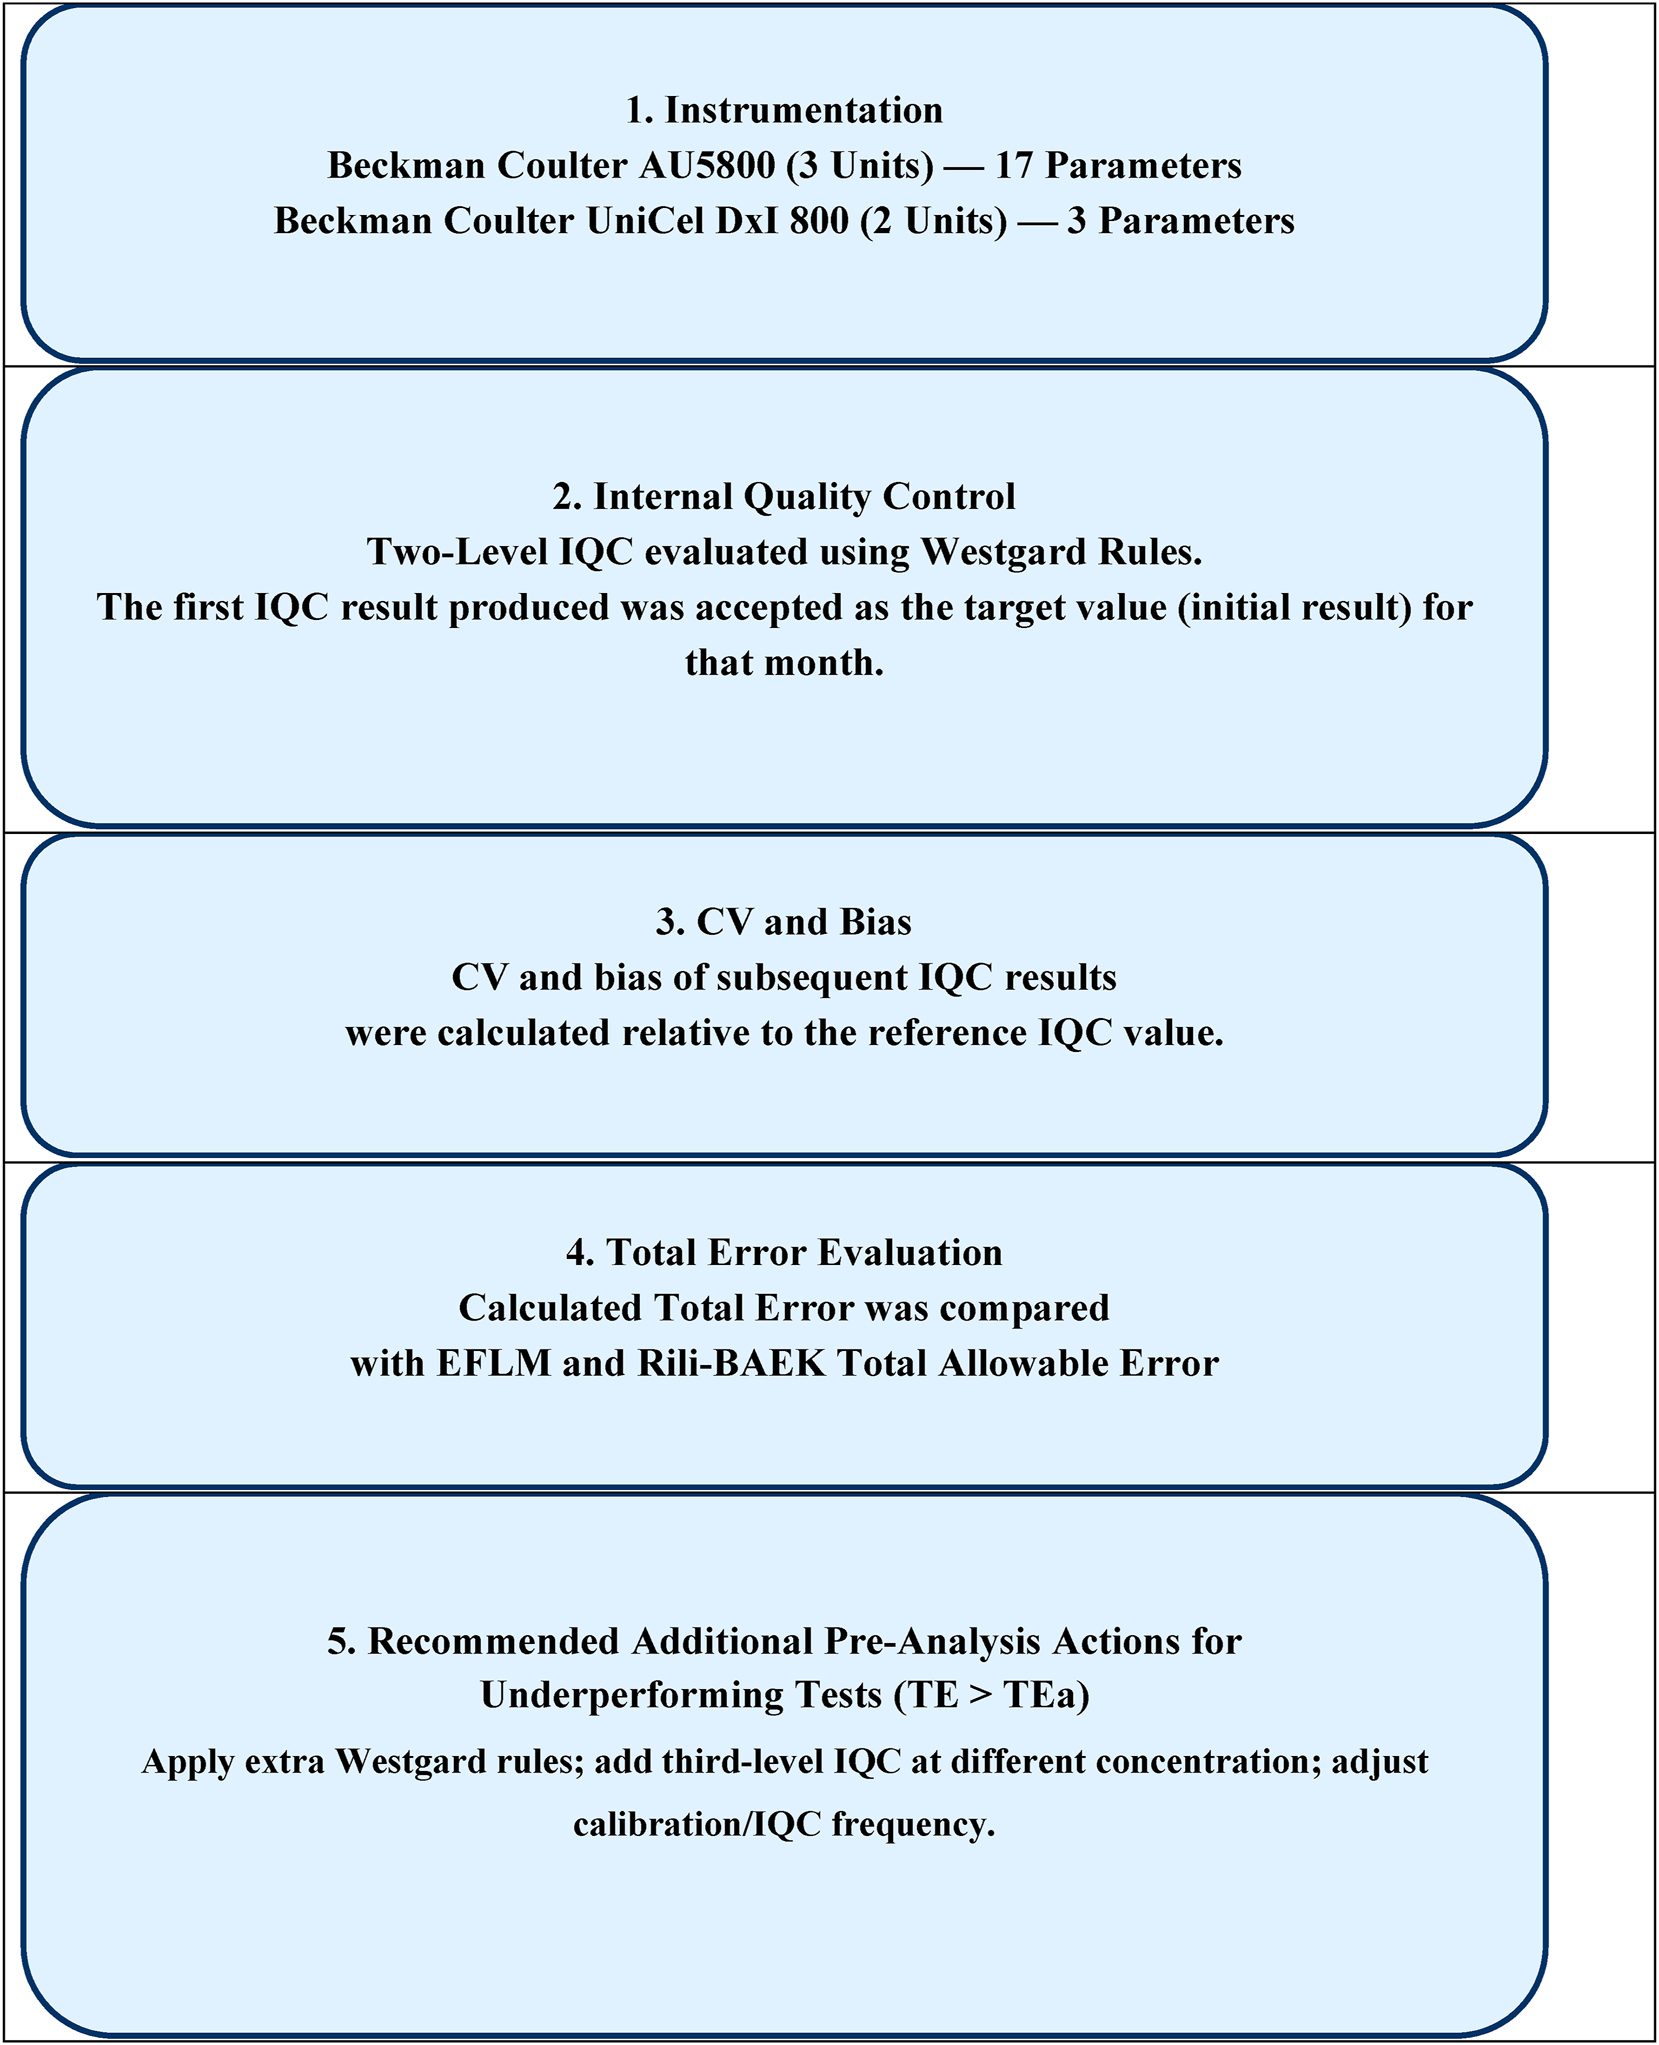
Flowchart depicting the evaluation process for two-level IQC data according to westgard rules (22 S, 13 S, R4S) and comparision of calculated total error with total acceptable error from EFLM and Rili-BAEK. EFLM, european federation of clinical chemistry and laboratory medicine; IQC, internal quality control; Rili-BAEK, German guidelines for quality assurance; TE, total error; TEa, total allowable error.
CV and bias values calculated separately for each month using internal quality control data for 20 parameters.
| Test name | Number of controlsa, Median (range) | CV, %, Median (range) | Bias, %, Median (range) |
|---|---|---|---|
| Albumin | 121 (94–142) | 2.13 (1.20–4.26) | 2.12 (0.96–4.77) |
| ALT | 134 (111–148) | 3.26 (2.15–6.47) | 3.42 (1.84–6.46) |
| AST | 120 (88–150) | 2.95 (2.14–4.61) | 4.1 (1.23–6.68) |
| BUN | 132 (112–156) | 2.99 (2.14–4.89) | 2.99 (2.42–6.85) |
| Calcium | 82 (56–92) | 2.34 (1.22–2.85) | 2.19 (1.35–4.12) |
| Creatinine | 96 (68–120) | 3.96 (2.25–4.52) | 3.91 (3.15–6.51) |
| CRP | 170 (117–200) | 2.13 (1.34–2.68) | 2.19 (1.25–3.97) |
| Direct bilirubin | 63 (46–78) | 3.04 (1.55–6.17) | 3.81 (1.34–11.03) |
| Ethanol | 25 (17–47) | 4.33 (2.18–6.34) | 4.06 (2.5–8.09) |
| Glucose | 126 (100–165) | 2.54 (1.64–3.77) | 2.28 (0.84–4.92) |
| hCG | 31 (24–36) | 4.09 (2.69–8.24) | 5.42 (3.21–26.15) |
| Hs-TnI | 59 (31–40) | 9.03 (5.08–12.87) | 10.68 (4.64–16.9) |
| Potassium | 42 (36–47) | 2.33 (1.58–3.80) | 2.1 (1.45–5.58) |
| Sodium | 40 (35–49) | 2.22 (1.56–2.61) | 1.95 (1.4–3.09) |
| Triglyceride | 34 (19–48) | 2.70 (1.31–4.52) | 2.41 (1.4–5.79) |
| Total bilirubin | 50 (37–74) | 2.99 (1.60–4.40) | 3.42 (0.01–5.24) |
| Total cholesterol | 26 (15–35) | 2.51 (1.49–4.99) | 2.87 (2.02–5.5) |
| Total protein | 59 (46–71) | 2.02 (1.11–3.62) | 1.7 (1.39–3.74) |
| TSH | 20 (20–30) | 3.80 (2.26–9.22) | 4.56 (2.96–24.46) |
| Uric acid | 55 (44–73) | 2.51 (1.44–3.21) | 2.4 (1.42–5.7) |
-
aNumber of IQC, measurements obtained during the uninterrupted first five consecutive working days of each representative month and accepted according to Westgard rules.
Based on the initial result, the coefficients of variation (CV) and bias for all subsequent IQC results within the five-day period were calculated using the formulas shown below.
CV and bias values of representative five days of the month were then used to obtain pooled CV and bias. Pooled bias values were derived using the root mean square (RMS) deviation method [8]. A single total error (TE) value was calculated using the corresponding pooled CV and bias values. The TE was determined using the formula: TE=Bias + 1.65 × CV, and the acceptability of the error was evaluated according to predefined analytical quality specifications. For this purpose, monthly TE values were compared against two analytical quality specifications: Total allowable error (TEa) limits defined by the European Federation of Clinical Chemistry and Laboratory Medicine (EFLM) BV database, and the German guideline (Rili-BAEK) [9], 10].
Statistical analysis
Statistical analyses were performed using SPSS version 24. The homogeneity of data distribution was assessed with the Kolmogorov–Smirnov test. CV, bias and TE values were calculated using Microsoft Excel.
Results
In our study, all IQC data for each month between May 2022 and April 2023 – evaluated and accepted according to multiple Westgard rules (22 S, 13 S, R4S) – were collected during the first five consecutive working days of each month. The 12-month CV and bias values calculated for 20 tests, along with the number of IQC samples analyzed, are summarized in Table 2. An important point is that, in our laboratory, patient sample analysis on the analyzers begins only After the IQC runs have been accepted using the laboratory-defined multiple Westgard rules. Nevertheless, to eliminate potential inter-analyzer result differences, the approach designed in this study allows the implementation of additional measures – prior to running patient samples on the analyzers – when deemed necessary for certain tests. Such measures may include applying additional Westgard rules, introducing a third-level IQC material at a different concentration, updating calibration and IQC frequencies, or reviewing reagent kit test volumes, among others. The lowest number of IQC measurements was recorded for total cholesterol (n=15) and ethanol (n=17), whereas the highest average numbers of IQC measurements were observed for CRP (n=200), glucose (n=165) and BUN (n=156). The increased number of IQC runs for these tests was attributed to the use of multiple reagent kits within the same analytical unit.
Imprecision and bias
During the 12-month period, the lowest CV (1.11 %) was observed for total protein analysis in March 2023, whereas the highest CV (12.87 %) was recorded for hs-TnI in September 2022. When all monthly data were individually evaluated in terms of bias, the test with the lowest bias was total protein (3.78 %) in December 2022, while the highest bias was observed for hs-TnI (58.12 %) in September 2022. Following hs-TnI, the tests with the highest bias values were TSH (33.21 %), hCG (29.69 %), ALT (23.26 %), direct bilirubin (19.95 %), BUN (18.92 %), ethanol (16.24 %), and total bilirubin (14.13 %).
It is worth noting that the mean CV values across all analytes ranged from 2.05 to 8.92 % over the study period, indicating that most tests demonstrated stable analytical performance, aside from a few notable outliers in certain months. Since CV and bias values were incorporated into the TE calculations, these data were not presented separately in tabular form.
Total error
TE values were calculated using the pooled CV and pooled bias values derived from two-level IQC data for the first week of each month as shown in Table 3. These values were compared with TEa limits defined by the EFLM BV database and the Rili-BAEK guideline, which were used as analytical quality specifications. Table 3 presents the classification of analytical performance according to both criteria.
Calculated monthly total error and corresponding acceptable limits according to EFLM and RILIBAEK criteria.
| Test | Monthly calculated total error for each analytea | EFLM, TEa b | RILIBAEK TEa | |||||||||||
| M1 | M2 | M3 | M4 | M5 | M6 | M7 | M8 | M9 | M10 | M11 | M12 | |||
|---|---|---|---|---|---|---|---|---|---|---|---|---|---|---|
| Albumin | 6.24 | 5.24 | 7.32 | 11.19 | 4.96 | 6.47 | 6.55 | 4.60 | 11.09 | 5.92 | 3.23 | 7.44 | 3.4 | 20 |
| ALT | 17.70 | 6.25 | 13.99 | 8.14 | 7.98 | 10.27 | 10.87 | 6.73 | 13.08 | 9.54 | 7.59 | 9.66 | 16.1 | 21 |
| AST | 9.75 | 10.21 | 7.59 | 7.02 | 14.52 | 7.10 | 7.36 | 8.84 | 7.35 | 11.04 | 10.15 | 11.30 | 13.6 | 21 |
| BUN | 7.78 | 8.09 | 12.76 | 9.72 | 8.48 | 8.26 | 13.78 | 6.55 | 10.14 | 8.72 | 11.17 | 9.60 | 17.8 | 21 |
| Calcium | 6.62 | 8.38 | 5.21 | 6.41 | 7.44 | 5.90 | 7.35 | 5.62 | 6.24 | 7.29 | 3.70 | 8.94 | 6.5 | 10 |
| Creatinine | 12.13 | 10.95 | 10.99 | 10.29 | 10.30 | 12.47 | 12.40 | 8.60 | 13.04 | 14.70 | 13.30 | 12.76 | 7.4 | 20 |
| CRP | 4.39 | 7.33 | 8.44 | 4.16 | 6.91 | 4.25 | 5.75 | 6.22 | 7.27 | 6.03 | 5.96 | 6.50 | 50.7 | 20 |
| Direct bilirubin | 23.30 | 9.80 | 10.33 | 18.27 | 10.35 | 7.48 | 6.82 | 10.12 | 11.91 | 15.53 | 4.29 | 5.92 | 24.8 | 22 |
| Glucose | 10.41 | 7.85 | 5.92 | 8.80 | 7.99 | 6.45 | 6.90 | 4.97 | 6.77 | 6.78 | 4.91 | 10.27 | 6.5 | 15 |
| Ethanol | 16.57 | 8.37 | 10.69 | 14.82 | 7.47 | 7.62 | 18.88 | 18.15 | 17.59 | 13.18 | 9.24 | 11.24 | 10 | 21 |
| hCG | 9.17 | 27.18 | 13.46 | 10.26 | 16.69 | 11.88 | 10.54 | 11.77 | 17.61 | 18.59 | 43.73 | 10.77 | 20 | 30 |
| Hs-TnI | 19.26 | 27.16 | 16.93 | 14.32 | 41.95 | 31.98 | 33.80 | 34.10 | 25.52 | 29.62 | 36.67 | 17.81 | 19.4 | 33 |
| Potassium | 6.82 | 5.95 | 6.14 | 6.02 | 9.92 | 5.34 | 7.05 | 4.47 | 6.96 | 6.95 | 4.96 | 7.77 | 4.8 | 8 |
| Sodium | 5.84 | 5.95 | 6.24 | 5.28 | 7.26 | 5.29 | 6.41 | 4.37 | 6.81 | 6.50 | 5.03 | 7.89 | 0.7 | 5 |
| Triglyceride | 5.54 | 7.22 | 6.82 | 14.58 | 9.76 | 9.00 | 7.33 | 5.91 | 3.92 | 11.29 | 7.93 | 7.41 | 27 | 16 |
| Total bilirubin | 10.03 | 7.34 | 11.22 | 10.03 | 9.87 | 9.85 | 6.96 | 9.21 | 5.74 | 13.75 | 4.63 | 7.12 | 24.8 | 22 |
| Total cholesterol | 8.16 | 5.28 | 6.91 | 6.97 | 15.10 | 10.57 | 9.67 | 9.28 | 8.76 | 6.72 | 5.67 | 8.14 | 8.8 | 13 |
| Total protein | 5.61 | 4.40 | 10.68 | 5.80 | 8.40 | 5.13 | 5.46 | 4.06 | 5.82 | 9.00 | 3.54 | 4.97 | 3.5 | 10 |
| TSH | 8.58 | 33.44 | 17.18 | 11.89 | 11.10 | 11.85 | 9.91 | 9.23 | 23.32 | 27.95 | 43.64 | 9.54 | 24.6 | 24 |
| Uric acid | 7.63 | 5.91 | 9.00 | 7.83 | 6.81 | 6.42 | 9.61 | 4.18 | 7.00 | 12.10 | 8.03 | 6.26 | 12.8 | 13 |
-
aIncludes 12 months between May 2022 and April 2023. bEFLM, Desirable Analytical Performance Specifications. CRed highlighted cells indicate that the calculated monthly total error exceeded the corresponding EFLM, allowable limit.
According to the EFLM-based TE evaluation, the tests that consistently met the target in all months were BUN, CRP, direct bilirubin, total bilirubin, triglycerides, and uric acid. ALT and AST exceeded the EFLM TEa limit in only one month each. However, several AST values between months 10 and 12 approached the TEa threshold (13.6 %), indicating borderline performance. hCG exceeded the limit in two months, and TSH in three months. Albumin and potassium failed to meet the EFLM target in 11 out of 12 months, while creatinine, sodium, and total protein exceeded the limit in all months. Ethanol also failed to meet the EFLM target in eight months, including a borderline exceedance in month 3 (10.69 %).
When evaluated against the Rili-BAEK criteria, TE results were generally acceptable. All tests except sodium met the Rili-BAEK TEa limits in most months. TSH and hs-TnI exceeded the Rili-BAEK thresholds in several months. Direct bilirubin, hCG, potassium, total cholesterol, and total protein exceeded the threshold in only one month. Sodium exceeded the Rili-BAEK limit in eight months, reaching a maximum value of 57.8 %. This frequent deviation may be attributed to its extremely low within-subject biological variation (CVindividual=0.25 %).
Discussion
In routine practice, accuracy is monitored on a daily basis using IQC with Westgard rules frequently applied for performance evaluation. In our laboratory, the results from each autoanalyzer are routinely evaluated individually through participation in EQA programs. EQA results are generally the most reliable method for detecting bias. However, it often takes up to two weeks for these EQA results to become available to laboratories, leading to a considerable delay in the identification of test deviations.
Random errors increase patient risk and are more challenging to detect. Designing a QC plan to increase precision is crucial for patient safety. This reduces erroneous test results and decreases the need for patient retesting [7].
In high-capacity hospitals, daily IQC evaluation may require further improvement, as inter-device differences should not exceed biological variation. For this purpose, quality goals such as RCV, which includes BV and associated evaluation targets, can be utilized [11]. Additionally, using TE, obtained from various sources, has been widely accepted for evaluating analytical differences [11]. TE can be defined as an analytical quality requirement that sets a limit for both imprecision (random error) and bias (systematic error) that are tolerable in a single measurement or test result.
In our laboratory, due to reagent capacity and test volume, multiple reagent bottles may be used in a single module for tests like AST, ALT, creatinine, glucose, and urea. Given the possibility of reporting results using different devices or, within the same device, different modules and reagents on the same day particularly for hospitalized patients this study aimed to develop a standardized evaluation procedure to ensure reagent compatibility by utilizing IQC data and implementing a practical, Laboratory Information System (LIS)-integrated approach suitable for routine daily use.
Despite standardized calibrators and controls, personnel and equipment differences may influence results.
A Clinical and Laboratory Standards Institute (CLSI) guideline related to this topic (EP31-A-IR) is available [12]. According to the guideline, no standardized “Acceptance Criteria (AC)” covers all tests for comparison experiments. Depending on the variety of tests used in laboratories, different ACs may be appropriate. The Laboratory Director decides which of these criteria is suitable. We aim to establish a workflow suitable for routine use, facilitating our evaluation by defining rules that can be narrowed or expanded for each test.
Another strong AC in the guideline is “goals set by accreditation agencies”. Accreditation organizations and regulatory authorities, such as College of American Pathologists (CAP) or Rili-BAEK, set targets like TEa using Proficiency Testing or EQA results. Our study used TEa values determined by EFLM and Rili-BAEK as the target AC. When calculating bias, we used the difference between the initial value obtained for each test, as recommended in some publications, rather than the manufacturer’s assigned values of IQC [13]. It has been reported that as the number of measurements increases, the average results approach the manufacturer’s values, but the analytical CV increases [6].
In our study, the number of control results used ranged from 15 to 200 so these numbers explain why our CV values are higher than those reported in the literature.
Furthermore, since IQC results were obtained at different times of the day and weekly, our likelihood of encountering bias due to factors such as carry-over and reagent decay is higher than reported in the literature. In this instance, our data demonstrated greater reproducibility than repeatability [14], [15], [16]. Depending on the clinical purpose of the test, the laboratory specialist must make a specific evaluation for each test by narrowing or expanding the evaluation algorithm rules we defined. The technical requirements defined by the ISO 15189 standard emphasize that the comparability of patient results should be ensured when the same test is performed on multiple devices. It is stated that it should be periodically checked at clinically significant intervals, and if a difference is detected, its effect on biological reference ranges and clinical decision limits should be evaluated. Although patient samples are preferred for this purpose, the practical use of only IQC for daily comparison may be feasible.
When reviewing the literature, it is observed that there have been few publications related to device comparison methods in recent years. Until now, many studies have generally accepted the validity of TEa or measurement uncertainty (MU) methods in method validation. However, there still needs to be a consensus on the comparability of multiple devices of the same brand and model. TE, CV and bias, sigma metrics, and MU have been used in different publications [4], 6], 17], 18].
In a study published in 2023, data from two analyzers were compared over four years [18]. Monthly TE calculations were based on IQC CVs, and biases were derived from EQC data. Since we aimed to incorporate our defined workflow into daily routine operations, we intended to use only IQC data. In this study, unlike ours, the analytical performance of clinical chemistry tests performed on different brand autoanalyzers in different years was evaluated. Nevertheless, the results obtained are highly compatible with ours. When assessed according to the EFLM European Biological Variation Study (EuBIVAS) criteria, almost all tests failed; in contrast, nearly all parameters were within the acceptable limits defined by other guidelines, such as the Clinical Laboratory Improvement Amendments (CLIA).
In another study, they used IQC to calculate CV and EQC to calculate bias in an accredited laboratory with similar characteristics to ours, and they evaluated the data with CLIA TEa [5]. They evaluated the CV, bias, and TE goals of 26 tests separately. Tests identified as out of quality specifications (QS) were like our findings, including sodium and albumin. In a similar study, tests performed on two analyzers were grouped according to sigma values using a different perspective [6]. Albumin and sodium have the lowest sigma values in almost all groupings.
In another study with methods most like ours, one analyzer’s IQC results were compared with the results of the other analyzer using only bias calculation [4]. When average biases were examined over 60 months, it was reported that less than 2 % of the samples exceeded the allowable bias for low-level controls of bilirubin, chloride, glucose, potassium, sodium, and urea, but these were deemed clinically insignificant. In our results, bilirubin and urea were successful when compared with EuBIVAS. Sodium, creatinine, glucose, and potassium were found to be unsuccessful in some months, like this study. Evaluations in the mentioned study were based solely on bias, and albumin was not included, unlike in our study.
A recently published study evaluated the effectiveness of the EP31-A-IR guideline for the periodic verification of comparability between results obtained from different analyzers by CLSI [19]. The assessment was made by comparing the maximum observed differences between the IQC results of the devices with the Maximum Allowable Differences. The Maximum Allowable Differences were calculated from the pooled standard deviation data obtained in the short- and long-term studies. The results showed that the differences between the analyzers did not exceed the target values for all parameters evaluated. Because our study aimed to compare devices of the same model in the same environment, we used the TE approach. However, as the variance components increase, it would be more appropriate to use more comprehensive measurement uncertainty approaches.
To our knowledge, no prior studies have simultaneously calculated TE and used such extensive IQC data as in our study The TEa model has gained widespread acceptance in practical laboratory settings due to its ease of use and the inclusion of random and systematic errors in analytical processes. Despite being primarily intended for method validation and standardization, we repurposed it for our study.
When each test was evaluated on a monthly basis, the 12-month TE results were analyzed by comparison with the EUBIVAS criteria, ALT, AST, BUN, CRP, direct and total bilirubin, triglycerides, and uric acid performed well. In contrast, other tests showed varying degrees of poor performance. When evaluated with Rili-BAEK, the variety of failed tests and the number of months decreased, with only sodium failing throughout the year. When tests meeting the EFLM Desirable Total Error (DTE) criteria were examined, they were almost perfectly aligned with the literature. In this case, we can say that comparing TE data with DTE will be sufficient for routine use.
The failure of sodium to meet all ACs, similarly to our study, has been emphasized in all literature. However, given today’s patient load, using multiple devices for sodium testing in laboratories is inevitable. According to the Milan Consensus criteria established in 2014, Analytical Performance Specifications (APS) should primarily be based on clinical output studies or BV data [20]. The BV based APS model is the preferred model for many tests performed in CLs, but this model has limitations in some cases. When applying the TE model is impossible, the “state-of-the-art” approach is recommended. It is known that some measurands, including sodium, fail to meet the APS predicted by BV models for currently used models due to their very low measurement uncertainty (<2 %) and the very narrow BV resulting from tight homeostatic control. When evaluated from a medical perspective according to the Milan hierarchy, the authors concluded that the current analytical quality of sodium meets medical needs.
Ideally, users should select analytical goals according to clinical needs [14]. Oosterhuis et al. also stated that for tests like sodium, which are widely used medically, state-of-the-art studies should be conducted, and APS should be based on medical necessity or outputs [21].
According to the rule-based approach proposed in our study, a TE value below the allowable limit defined by the EFLM indicates that the analytical performance of the test is adequate and that no additional control step is required. When the TE value falls between the TEa thresholds defined by the EFLM and Rili-BAEK, it serves as a warning signal, prompting close monitoring of the test by the laboratory specialist. TE values exceeding the Rili-BAEK threshold, however, necessitate the implementation of test-specific corrective actions, with the final decision to be made by the responsible laboratory expert.
The main limitations of our study include the use of Desirable Performance Specifications for TEa, which may not reflect optimal analytical conditions despite its widespread use in clinical practice, and the omission of preanalytical factors like sample handling, which should be addressed in future research.
Conclusions
In high-volume laboratories with multiple analyzers, ensuring result consistency is essential to prevent discrepancies that may affect patient diagnosis and follow-up. Our model enables continuous performance assessment of identical analyzers using only routine IQC data. Integrating this approach into the LIS may allow early detection and correction of inter-analyzer differences before they impact patient results, thereby improving the reliability of laboratory data, particularly for low-performing tests such as sodium, albumin, creatinine, and potassium.
-
Research ethics: Not applicable.
-
Informed consent: Not applicable.
-
Author contributions: All authors have accepted responsibility for the entire content of this manuscript and approved its submission.
-
Use of large language models, AI and machine learning tools: None declared.
-
Conflict of interest: The authors state no conflict of interest.
-
Research funding: None declared.
-
Data availability: Not applicable.
References
1. International Organization for Standardization. ISO 15189:2022: medical laboratories–requirements for quality and competence. Geneva, Switzerland: ISO; 2022.Suche in Google Scholar
2. Kim, SK, Chung, JW, Lim, J, Jeong, TD, Chang, J, Seo, M, et al.. Interpreting changes in consecutive laboratory results: clinician’s perspectives on clinically significant change. Clin Chim Acta 2023;548:117462. https://doi.org/10.1016/j.cca.2023.117462.Suche in Google Scholar PubMed
3. Thue, G, Sandberg, S. Analytical performance specifications based on how clinicians use laboratory tests: experiences from a post-analytical external quality assessment programme. Clin Chem Lab Med 2015;53:1174–5. https://doi.org/10.1515/cclm-2014-1280.Suche in Google Scholar PubMed
4. Miler, M, Simundic, AM, Stefanovic, M, Ferenec-Ruzic, D, Kvaternik, M, Topic, E, et al.. A model for results comparison on two different biochemistry analyzers in laboratory accredited according to the ISO 15189. Biochem Med 2009;19:287–93. https://doi.org/10.11613/bm.2009.027.Suche in Google Scholar
5. Rahn, B, Jerin, A, Skitek, M, Snoj, N, Martinello, F. Analytical performance evaluation of biochemical parameters of a public hospital laboratory. J Bras Patol Med Lab 2021;57. https://doi.org/10.5935/1676-2444.20210054.Suche in Google Scholar
6. Oktay, SB. Assessment of analytical process performance by using six sigma method: comparison of two biochemistry analyzers. Int J Med Biochem 2021;4:97–103. https://doi.org/10.14744/ijmb.2021.14633.Suche in Google Scholar
7. Bellio, P, De Angelis, S, Piccirilli, A, Di Michele, G, Barnabei, R, Amicosante, G, et al.. Evaluation of the analytical performances of the Biolabo SOLEA 100 Optical Coagulometer and comparison with the Stago STA-R MAX analyser in the determination of PT, APTT, and fibrinogen. Diagnostics 2022;13:85. https://doi.org/10.3390/diagnostics13010085.Suche in Google Scholar PubMed PubMed Central
8. Wang, W, Zhang, Z, Zhang, C, Zhao, H, Yuan, S, Liu, J, et al.. Evaluation of coefficients of variation for clinical chemistry tests based on internal quality control data across 5,425 laboratories in China from 2013 to 2022. Ann Lab Med 2024;44:245–52. https://doi.org/10.3343/alm.2023.0236.Suche in Google Scholar PubMed PubMed Central
9. Sandberg, S, Carobene, A, Bartlett, B, Coskun, A, Fernandez-Calle, P, Jonker, N, et al.. Biological variation: recent development and future challenges. Clin Chem Lab Med 2023;61:741–50. https://doi.org/10.1515/cclm-2022-1255.Suche in Google Scholar PubMed
10. German Medical Association. Revision of the “guideline of the German medical association on quality assurance in medical laboratory examinations – Rili-BAEK”. J Lab Med 2015;39:26–69.10.1515/labmed-2014-0046Suche in Google Scholar
11. Westgard, JO, Westgard, SA. Measuring analytical quality. Clin Lab Med 2017;37:1–13. https://doi.org/10.1016/j.cll.2016.09.001.Suche in Google Scholar PubMed
12. Budd, JR. Measurement procedure comparison and bias estimation using patient samples: approved guideline, 3rd ed. Wayne (PA): Clinical and Laboratory Standards Institute; 2013.Suche in Google Scholar
13. Skitek, M, Martinello, F, Jerin, A. How to really understand and improve the system of internal quality control and external quality assessment in the accreditation process of the medical laboratory? EJIFCC Apr 11, 2022;33:23–7.Suche in Google Scholar
14. Kallner, A, Theodorsson, E. Repeatability imprecision from analysis of duplicates of patient samples and control materials. Scand J Clin Lab Invest 2020;80:210–4. https://doi.org/10.1080/00365513.2019.1710243.Suche in Google Scholar PubMed
15. Oosterhuis, WP, Bayat, H, Armbruster, D, Coskun, A, Freeman, KP, Kallner, A, et al.. The use of error and uncertainty methods in the medical laboratory. Clin Chem Lab Med 2018;56:209–19. https://doi.org/10.1515/cclm-2017-0341.Suche in Google Scholar PubMed
16. Talon, L, Feriel, J, Sinegre, T, Lebreton, A, Lecomte, M, Hemar, C. Multicenter analytical performance evaluation of the ST Genesia thrombin generation system. Ann Biol Clin 2025;83:35–48. https://doi.org/10.1684/abc.2025.1942.Suche in Google Scholar PubMed
17. Goel, P, Malik, G, Prasad, S, Rani, I, Manhas, S, Goel, K. Analysis of performance of clinical biochemistry laboratory using sigma metrics and quality goal index. Pract Lab Med 2021;23:e00195. https://doi.org/10.1016/j.plabm.2020.e00195.Suche in Google Scholar PubMed PubMed Central
18. Duz, M, Menekse, E, Avci, B, Gumus, A. Comparison of two clinical chemistry analyzers by total analytical error and measurement uncertainty. Clin Lab 2023;69:e20230043. https://doi.org/10.7754/clin.lab.2022.220846.Suche in Google Scholar PubMed
19. Guiñón, L, Illana, FJ, Cuevas, B, Canyelles, M, Martínez-Bru, C, García-Osuna, Á. Periodic verification of results’ comparability between several analyzers: experience in the application of the EP31-A-IR guideline. Clin Chem Lab Med 2024;62:428–35. https://doi.org/10.1515/cclm-2023-0994.Suche in Google Scholar PubMed
20. Sandberg, S, Fraser, CG, Horvath, AR, Jansen, R, Jones, G, Oosterhuis, W, et al.. Defining analytical performance specifications: consensus statement from the 1st strategic conference of the European federation of clinical chemistry and laboratory medicine. Clin Chem Lab Med 2015;53:833–5. https://doi.org/10.1515/cclm-2015-0067.Suche in Google Scholar PubMed
21. Oosterhuis, WP, Coskun, A, Sandberg, S, Theodorsson, E. Performance specifications for sodium should not be based on biological variation. Clin Chim Acta 2023;540:117221. https://doi.org/10.1016/j.cca.2023.117221.Suche in Google Scholar PubMed
© 2025 the author(s), published by De Gruyter, Berlin/Boston
This work is licensed under the Creative Commons Attribution 4.0 International License.