
Clinically significant depressive symptoms and high diabetes distress in adults with type 1 and type 2 diabetes in Appalachian Ohio
-
Elizabeth A. Beverly

 und
Francis Osowik
und
Francis Osowik

Abstract
Context
In rural southeastern Ohio, the prevalence of diabetes is 19.9%, nearly double the national average of 10.5%. Despite the high rate of diabetes, its impact on the region is understudied; one such understudied topic is psychosocial difficulties. People with diabetes experience disproportionately higher rates of major depressive disorder (MDD), clinically significant depressive symptoms, and diabetes distress. Diabetes distress refers to the negative emotional experience of living with diabetes. It reflects an individual’s worries, concerns, and fears about living a chronic and progressive disease.
Objectives
To assess the prevalence of diabetes distress as well as comorbid, clinically significant depressive symptoms and diabetes distress among patients in southeastern Ohio; and to assess impact of depressive symptoms and diabetes distress on A1C levels, diabetes self care behaviors, and diabetes quality of life (DQOL).
Methods
In this cross sectional survey study, individuals aged 18 years and older, diagnosed with type 1 (T1D) or type 2 (T2D) diabetes, who were able to read and speak English, and living in southeastern Ohio were invited to participate. Participants completed the Diabetes Distress Scale for T2D or T1D, the Patient Health Questionnaire-9, the Self Care Inventory-Revised, and the DQOL Scale as part of the study survey. Participants completed the survey via an online questionnaire service or mailed packets. Chi square tests determined the comorbidity of clinically significant depressive symptoms and high diabetes distress levels by type of diabetes. Multiple regression models examined the relationships among clinically significant depressive symptoms, diabetes distress scores, A1C levels, self care behaviors, and DQOL scores. Statistical significance was defined as a p<0.05.
Results
A total of 325 adults participated (mean ± standard deviation [SD] age, 41.6 ± 19.2 years; 131 (40.7%) with T1D; 194 (59.7%) with T2D; mean ± SD A1C, 7.5 ± 1.6%; mean ± SD duration, 12.4 ± 9.6 years). Of the 325 participants, 70 (21.5%) indicated clinically significant depressive symptoms, with 29 (22.3%) T1D participants and 41 (21.0%) T2D participants reporting clinically significant depressive symptoms. A total of 92 (28.3%) participants reported high diabetes distress (39 (30.5%) T1D participants and 53 (27.5%) T2D participants). Forty-eight participants (15.0%) screened positive for both clinically significant depressive symptoms and high diabetes distress. Regression models showed that higher diabetes distress scores were associated with fewer self care behaviors (T1D, b=−0.268, p=0.030; T2D, b=−0.312, p<0.001) and lower DQOL (T1D, b=0.726, p<0.001; T2D, b=0.501, p<0.001). Further, more depressive symptoms were associated with lower DQOL in participants with T2D (b=0.363, p<0.001). Higher diabetes distress scores were not associated with higher A1C levels in participants with T1D or T2D; however, increased depressive symptoms were associated with higher A1C levels in participants with T2D (b=0.390, p<0.001).
Conclusions
Findings showed that adults in southeastern Ohio experienced high levels of diabetes distress and co-occurring clinically significant depressive symptoms that were within range of data from previous studies. These findings highlight the importance of routine screening for both clinically significant depressive symptoms and diabetes distress. Future longitudinal research is needed to confirm these findings and examine the evolution of these relationships over time.
Osteopathic physicians are trained to treat the whole person – body, mind, and spirit [1]. This holistic approach to care hinges on the belief that the whole person is composed of interdependent parts. If one part is not functioning properly, all other parts will be affected. Diabetes is a condition that necessitates holistic care. Diabetes, if left untreated, is associated with a multitude of physical complications, including but not limited to coronary heart disease, stroke, retinopathy, neuropathy, and nephropathy [2]. Moreover, diabetes is associated with numerous psychosocial difficulties, including depression, diabetes distress, and lower quality of life [3]. Thus, in the same way that diabetes care requires a holistic approach, research that addresses the whole person is needed.
In southeastern Appalachian Ohio, diabetes rates (19.9% in 2016) [4] far exceed both the national prevalence in the United States (US) (10.5% in 2018) [5] and the state prevalence in Ohio (11.1% in 2016) [6]. In recent years, the prevalence of diabetes in southeastern Ohio has increased by 76.1%, from 11.3% in 2009 [7] to 19.9% in 2016 [4]. Residents of Appalachian Ohio have been documented to have delayed diagnoses, more complications, limited access to health care, and lower health literacy [7], [8], [9]. Further, more people are financially insecure, unemployed, have lower educational achievement, and limited access to transportation [10], [11]. These social determinants of health contribute to a mortality rate 28.4% higher than the national average [12]. Despite the high rates of diabetes and mortality in the region, the impact of diabetes in Appalachian Ohio is understudied.
One area of research that is lacking for patients in this region is psychosocial difficulties. Psychosocial difficulties like depression and diabetes distress are disproportionately more common in people with diabetes [13]. Specifically, major depressive disorder (MDD) and clinically significant depressive symptoms affect one in four people with type 1 (T1D) or type 2 diabetes (T2D) [14]. Symptoms of MDD have been associated with fewer self care behaviors [15], higher hemoglobin A1c levels (A1C) [16], increased complications [17], hospitalization [18], and mortality [18]. A study by de Groot et al. [19] found that one in three adults in southeastern Ohio reported clinically significant depressive symptoms. Like MDD, diabetes distress is also a common psychosocial difficulty. Importantly, diabetes distress is clinically distinct from MDD [20]. Unlike MMD, diabetes distress is not a psychiatric disorder and it does not assume psychopathology [20]. Rather, diabetes distress refers to the negative affective experience of living with diabetes [21]. It describes a person’s worries, concerns, and fears about living with a demanding, progressive chronic disease [21]. Specifically, diabetes distress refers to frustrations with self care behaviors, concerns about the future and the possibility of developing complications, worries about the cost and quality of medical care, and perceived lack of support from family members and/or friends [22]. Previous metaanalyses estimated that from 22 [23] to 36% [24] of people with diabetes report high diabetes distress, with women and younger adults more likely to report elevated levels [23], [25]. High diabetes distress scores have been associated with fewer self care behaviors [26], higher A1C levels [27], increased complications [28], and lower quality of life (QOL) [29]. Further, cross sectional and longitudinal analyses of 506 adults with T2D from the Distress and Depression in Diabetes (3D) study showed that 15.9% of people with moderate or high diabetes distress met criteria for MDD, whereas 66.7% of people with MDD reported moderate or high diabetes distress [20, 21, 30]. Further, longitudinal analyses revealed the persistence of MDD and diabetes distress over an 18 month time period [30]. Considering the comorbidity of these psychosocial difficulties, their persistence over time, and impact on health outcomes, the American Diabetes Association (ADA) recommends routine screening of depressive symptoms and diabetes distress in all populations of people with diabetes [3].
The prevalence of diabetes distress in southeastern Ohio and the comorbidity of clinically significant depressive symptoms with diabetes distress is unknown. Therefore, the aim of this study was to assess the prevalence of diabetes distress as well as the comorbidity of these psychosocial difficulties. In addition, the association between clinically significant depressive symptoms and diabetes distress on health outcomes was examined. Specifically, associations among A1C levels, diabetes self care behaviors, and diabetes quality of life (DQOL) were assessed. First, we hypothesized that high levels of diabetes distress would exceed 25.0% for adults with T1D and T2D; we selected >25.0% as our hypothesized rate based on the 22.0% estimate given in the metaanalysis from Dennick et al. [23] Second, we hypothesized that the comorbidity of clinically significant depressive symptoms and high diabetes distress would exceed 15% for adults with T1D and T2D; we selected 15.0% per the 15.9% comorbidity rate from the 3D study [20], [30]. Third, we hypothesized that diabetes distress, not clinically depressive symptoms, would be associated with higher A1C levels, fewer self care behaviors, and lower DQOL for adults with T1D and T2D given prior associations observed in Fisher et al. [26], Fisher et al. [27], Carper et al. [29], and Standberg et al. [31].
Methods
Participants and survey distribution
Adults diagnosed by a provider with T1D or T2D who were aged 18 years and older, who were able to read and speak English, and who were living in southeastern Ohio (Athens, Hocking, Meigs, Morgan, Perry, Vinton, or Washington counties) were eligible to participate in the study. The Ohio University Office of Research Compliance approved the study protocol (IRB 17X234) and all recruitment procedures and materials. Participants were recruited via email, flyers, newspaper advertisements, social media, and announcements in the community. Specifically, emails were distributed to the Ohio University listserv, consisting of faculty, staff, and students, as well as the Ohio University Diabetes Institute Registry, consisting of adults with T1D or T2D who signed a release form to be contacted for future diabetes studies. The Ohio University listserv was used because the university is the largest employer in southeastern Ohio. Flyers were posted in public places on community bulletin boards. In addition, digital flyers were posted in social media accounts and flyers were printed in local newspapers. Lastly, research assistants traveled to local health fairs, job fairs, and health department screening events to announce the study to adults in attendance of these events. For the purposes of the study, a unique email address and phone line were created. Individuals interested in participating could send an email or leave a voice message and request the electronic survey or mailed packet. Participant information was recorded temporarily for email or postal distribution. An electronic, anonymous survey (Qualtrics) or printed packet with two prepaid envelopes (one envelope for the survey and one envelope for the informed consent form and remuneration form, to protect from a breach of confidentiality) were distributed to eligible participants. All participants provided electronic or written informed consent, respectively. Completion of the measures took approximately 30–45 min. Participants received a $15.00 gift card as remuneration for participating in the study. To receive the gift card, participants either completed a second Qualtrics link or mailed the remuneration form with their personal information placed in a second prepaid envelope, such that the study data was not associated with their name or email address. Due to the anonymous nature of the study, participants did not have to complete the measures to receive the gift card.
After survey distribution, all participant information was destroyed per the IRB 17X234 protocol. The University’s Clinical and Translational Research Unit provided assistance with email and postal distribution to maintain anonymity from the research team. The study opened on December 14, 2017 and continued until August 18, 2019. Participation in the study was completely voluntary. A subset of the data from the University’s listserv, collected between December 14, 2017 and January 3, 2018, was published previously [32].
Power analysis
We conducted an a priori power analysis using Statulator [33], an online statistical calculator, which estimated that a total sample size of 289 participants would be needed to determine that 25% of participants had high diabetes distress. Similarly, we determined that a sample size of 196 would needed to determine a 15% prevalence of co-occurring high diabetes distress and clinically significant depressive symptoms. Finally, we determined that a minimum required sample size of 84 participants would be required for a multiple regression model with four predictors for 80% power at a 5% significance level (p<0.05) to detect an effect size of 0.15.
Survey measures
The survey began with 102 questions for participants with T2D and 113 for participants with T1D (Supplementary Material) regarding the participant’s sociodemographic (age, gender, race, education level, marital status, occupation, insurance coverage) and health factors (duration of diabetes, self reported A1C) levels, diabetes medication, and height and weight to calculate body mass index (BMI). Note, the data collected on race followed the National Institutes of Health categories (i.e., American Indian/Alaskan Native, Asian, Black/African American, Hispanic/Latinx, Native Hawaiian/Pacific Islander, White, two or more races, and another race not listed) [34].
In addition, participants completed the following measures:
Type 2 Diabetes Distress Scale (T2DDS) [22]: a 17-item measure that uses a six point Likert scale to assess total T2D distress and its four subscales, (1) emotional burden, (2) physician related distress, (3) regimen related distress, and (4) interpersonal distress. Participants are asked to indicate the degree to which each item bothered them in the prior month, ranging from “not a problem” to “a very serious problem.” To score the scale, the participant’s responses are summed and divided by the number of items in the scale or subscale. The cut-points for distress include the following: little or no distress (<2.0); low diabetes distress (1.5–1.9); moderate distress (2.0–2.9); high distress (≥3.0) [26]. The measure demonstrates excellent internal consistency (alpha=0.93, subscales range alpha=0.88–0.90) [22].
Type 1 Diabetes Distress Scale (T1-DDS) [35]: a 28-item measure that uses a six point Likert scale to assess total T1D distress and its seven subscales, (1) powerlessness, (2) negative social perceptions, (3) physician distress, (4) friend/family distress, (5) hypoglycemia distress, (6) management distress, and (7) eating distress. Participants are asked to indicate the degree to which each item bothered them in the prior month, ranging from “not a problem” to “a very serious problem.” To score the scale, the participant’s responses are summed and divided by the number of items in the scale or subscale. The cut-points for distress include the following: little or no distress (1.0–1.4); low diabetes distress (1.5–1.9), moderate distress (2.0–2.9); high distress (≥3) [35]. The measure demonstrates good to excellent internal consistency (alpha=0.91, subscale range alpha=0.76–0.88) and good test-retest reliability (r=0.74) [35].
Patient Health Questionnaire-9 (PHQ-9) [36]: a nine item measure that uses a four point scale (“not at all, several days, more than half the days, nearly every day”) to screen for depression. The nine items are derived from the diagnostic criteria of MDD from the Diagnostic and Statistical Manual of Mental Disorders-5 [37]. Participants are asked to rate how much they have been bothered by each item over the prior 2 weeks. To score the PHQ-9, all items are multiplied by the value indicated and summed to produce a total scare, ranging from 0 to 27. For the purposes of this study, 10 was the cutoff score for clinically significant depressive symptoms [38].
Self Care Inventory-R (SCI-R) [39], [40]: a 19-item measure that assesses diabetes self care behaviors, including diet, physical activity, blood glucose monitoring, and medication. Participants are asked to indicate whether they followed their diabetes treatment plan in the past 1–2 months on a five point Likert scale (“never, rarely, sometimes, usually, always”). The inventory demonstrates good internal consistency (alpha=0.87) [39], [40].
DQOL Scale [41]: a 39 item measure that assesses satisfaction, general health, impact of treatment, and future effects of diabetes on a five point Likert scale (“never, seldom, sometimes, often, all the time”). All questions are worded negatively, so higher scores indicate lower DQOL. The DQOL demonstrates excellent internal consistency (alpha=0.92) and strong test-retest reliability (0.78–0.92) [41].
Data analysis
The first step in our data analysis was to investigate data completeness and accuracy through descriptive statistics, correlations, and histograms, and a missing data report. Histograms revealed normal distributions for total diabetes distress, T1D distress, T2D distress, A1C levels, diabetes self care behaviors, and DQOL; depressive symptoms were skewed positively. After we verified our data, we compiled means and frequencies of all sociodemographic and health characteristics. We created dichotomous variables for clinically significant depressive symptoms, using the cutoff score of ≥10.0 (yes=1, no=0), and high diabetes distress, using the cutoff score of ≥3.0 (yes=1, no=0). Next, we calculated frequencies of clinically significant depressive symptoms and high diabetes distress levels to estimate prevalence levels. We then used Chi square tests to determine the comorbidity of the dichotomous variables for clinically significant depressive symptoms and high diabetes distress levels by type of diabetes. In addition, Chi square tests were conducted to examine differences by type of diabetes and gender and independent t tests were conducted to examine differences by age given prior associations in the literature [23], [42]. Finally, we conducted six multiple regression models examining the relationships with the continuous measures for clinically significant depressive symptoms and high diabetes distress scores and A1C levels, self care behaviors, and DQOL, controlling for age and gender in each model. Statistical significance was defined as a p<0.05. All analyses were conducted with SPSS statistical software version 26.0 (SPSS, Inc.).
Results
Sample characteristics
A total of 368 individuals consented to participate in the study; however, 43 online participants did not complete the surveys and were removed from the analysis. The final sample included 325 participants. The mean age ± standard deviation (SD) of participants was 41.6 ± 19.2 years; 202 (62.2%) self identified as women, 119 (36.6%) self identified as men, three (0.9%) self identified as “other” with regard to gender, and one (0.3%) preferred not to answer. Fifty two (15.9%) participants had a high school education or less and 85 (26.2%) of the participants had Medicaid or Medicare insurance (Table 1). The self reported racial and ethnic background of the participants included 271 (83.4%) identifying as White, 17 (5.2%) identifying as Black or African American, 15 (4.6%) identifying as Asian, six (1.8%) identifying as Hispanic or Latinx, six (1.8%) identifying as two or more races, five (1.5%) identifying as American Indian or Alaska Native, four (1.2%) identifying as another race not listed, and one (0.3%) identifying as Native Hawaiian or Pacific Islander. Of the 325 participants, 131 (40.3%) reported a diagnosis of T1D and 194 (59.7%) reported a diagnosis of T2D. Overall, the participants had a mean A1C ± SD of 7.5 ± 1.6% and a mean diabetes duration ± SD of 12.4 ± 9.6 years. The Mean participant BMI ± SD was 31.4 ± 9.0 kg/m2 and 131 participants (51.7%) reported taking insulin or a combination of insulin and oral medication(s).
Participant demographic and health characteristics (n=325).
| Variable | Total (n=325) |
Type 1 (n=131) |
Type 2 (n=194) |
p-Value |
|---|---|---|---|---|
| Age | ||||
| Mean ± standard deviation, years | 41.6 ± 19.2 | 26.4 ± 11.7 | 51.9 ± 16.2 | <0.001 |
| Gender | ||||
| Female | 202 (62.2) | 85 (64.9) | 117 (60.3) | 0.728 |
| Male | 119 (36.6) | 45 (34.4) | 74 (38.1) | |
| Other | 3 (0.9) | 1 (0.8) | 2 (1.0) | |
| Prefer not to answer | 1 (0.3) | 0 (0) | 1 (1.1) | |
| Race | ||||
| American Indian or Alaska Native | 5 (1.5) | 0 (0) | 5 (2.6) | 0.037 |
| Asian | 15 (4.6) | 3 (2.3) | 12 (6.2) | |
| Black or African American | 17 (5.2) | 3 (2.3) | 14 (7.2) | |
| Hispanic or Latinx | 6 (1.8) | 2 (1.5) | 4 (2.1) | |
| Native Hawaiian or Pacific Islander | 1 (0.3) | 0 (0) | 1 (0.5) | |
| White | 271 (83.4) | 120 (91.6) | 151 (77.8) | |
| Two or more races | 6 (1.8) | 1 (0.8) | 5 (2.6) | |
| Another race not listed | 4 (1.2) | 2 (1.5) | 2 (1.0) | |
| Education | ||||
| Elementary school only | 1 (0.3) | 1 (0.8) | 0 (0) | <0.001 |
| Some high school, but did not finish | 6 (1.8) | 0 (0) | 6 (3.1) | |
| High school | 45 (13.8) | 8 (6.1) | 37 (19.1) | |
| Current undergraduate | 71 (21.8) | 59 (45.0) | 12 (6.2) | |
| Some college | 31 (9.5) | 9 (6.9) | 22 (11.3) | |
| Two-year degree | 34 (10.5) | 7 (5.3) | 27 (13.9) | |
| Four-year degree | 38 (11.7) | 13 (9.9) | 25 (12.92) | |
| Current graduate student | 9 (2.8) | 5 (3.8) | 4 (2.1) | |
| Some graduate work | 11 (3.4) | 2 (1.5) | 9 (4.6) | |
| Master’s degree | 31 (9.5) | 7 (5.3) | 24 (12.4) | |
| Doctoral/professional degree | 31 (9.5) | 3 (2.3) | 28 (14.4) | |
| Health insurance | ||||
| No coverage | 15 (4.6) | 5 (3.8) | 10 (5.2) | 0.007 |
| Medicaid and/or Medicare | 85 (26.2) | 19 (14.5) | 66 (34.0) | |
| Private insurance | 184 (56.6) | 81 (61.8) | 103 (53.1) | |
| Other | 22 (6.8) | 7 (5.3) | 15 (7.7) | |
| Hemoglobin A1c | ||||
| Mean ± standard deviation, % | 7.5 ± 1.6 | 7.8 ± 1.6 | 7.3 ± 1.5 | 0.004 |
| Body mass index (BMI) | ||||
| Mean ± standard deviation, kg/m2 | 31.4 ± 8.9 | 26.7 ± 6.6 | 34.1 ± 9.0 | <0.001 |
| Diabetes duration | ||||
| Mean ± standard deviation, years | 12.4 ± 9.6 | 14.1 ± 8.8 | 11.2 ± 10.0 | 0.008 |
| Diabetes treatment | ||||
| Diet and exercise | 24 (13.9) | 0 (0) | 18 (20.5) | <0.001 |
| Oral medication | 50 (28.9) | 1 (1.2) | 49 (55.7) | |
| Insulin | 750 (43.4) | 73 (85.9) | 2 (2.3) | |
| Insulin and oral medication | 16 (9.2) | 4 (4.7) | 12 (13.6) | |
| Other | 8 (4.6) | 1 (1.2) | 7 (8.0) | |
-
Values missing for Education (n=17), Health insurance (n=19), A1C (n=31), BMI (n=26), Duration (n=10), Diabetes treatment (n=27).
Participants with T1D were younger (mean age ± SD=26.4 ± 11.7 years vs. 51.8 ± 16.2 years; t=−15.441; p<0.001; Table 1), had a longer diabetes duration (mean ± SD=14.1 ± 8.8 years vs. 11.2 ± 10.0 years; t=2.652; p=0.008), and had higher A1C levels (mean ± SD=7.8 ± 1.5 vs. 7.2 ± 1.5; t=2.927; p=0.004), and a lower BMI (mean ± SD=26.7 ± 6.6 vs. 34.1 ± 9.0; t=−7.598; p<0.001) than the participants with T2D. Also, participants with T1D were more likely to be prescribed insulin (χ 2=180.345; degree of freedom [df]=4,; p<0.001), current undergraduate students (χ 2=97.667; df=10; p<0.001), White (χ 2=13.407; df=6; p=0.037), and have private insurance coverage (χ 2=12.089; df=1; p=0.007) than with T2D.
Clinically significant depressive symptoms
Of the 325 participants, 70 (21.7%) indicated clinically significant depressive symptoms, including 29 (22.8%) participants with T1D and 41 (21.0%) with T2D. In the combined analysis of participants with T1D and T2D, women were more likely than men to report clinically significant depressive symptoms (χ 2=5.871; df=1; p=0.015). In analyses by type of diabetes, only women with T2D were more likely to report clinically significant depressive symptoms (χ 2=4.027; df=1; p=0.045). Women with T1D did not differ from men with T1D in the frequency of clinically significant depressive symptoms (χ 2=1.833; df=1; p=0.176). The frequency of clinically significant depressive symptoms did not differ by diabetes type (χ 2=0.148; df=1; p=0.701) or age (t=−1.020, p=0.308).
High diabetes distress levels
Based on the clinical cutoffs, 140 (43.6%) reported little to no diabetes distress, 89 (27.7%) reported moderate distress, and 92 (28.3%) reported high distress. Among participants with T1D, 50 (39.1%) reported little to no diabetes distress, 39 (30.5%) reported moderate distress, and 39 (30.5%) reported high distress. Among participants with T2D, 90 (46.6%) reported little to no diabetes distress, 50 (25.9%) reported moderate distress, and 53 (27.5%) reported high distress. The subscale with the highest T1D distress level was powerlessness (n=65 [50.8%]; Figure 1) and the subscale with the highest T2D distress level was regimen related distress (n=78 [40.0%]; Figure 1). Of importance, 48 participants (15.0%) also screened positive for clinically significant depressive symptoms, of which 22 were T1D participants (17.3%) and 26 were T2D participants (13.5%). The cutoff for clinically significant depressive symptoms was associated with the cutoff for high diabetes distress (χ 2=70.918; df=1; p<0.001). Additional analyses revealed that clinically significant depressive symptoms were associated with all seven T1D distress subscales and three of the four T2D subscales, with the only exception being high physician related distress (χ 2=1.397; df=1; p=0.175). Women (χ 2=5.081; df=1; p=0.024) and younger participants (t=−3.214; p=0.002) with T2D were more likely to screen positive for high diabetes distress levels (χ 2=5.081; df=1; p=0.024). No gender (χ 2=0.323; df=1; p=0.570) or age differences (t=−1.201; p=0.232) were observed in distress levels by participants with T1D.
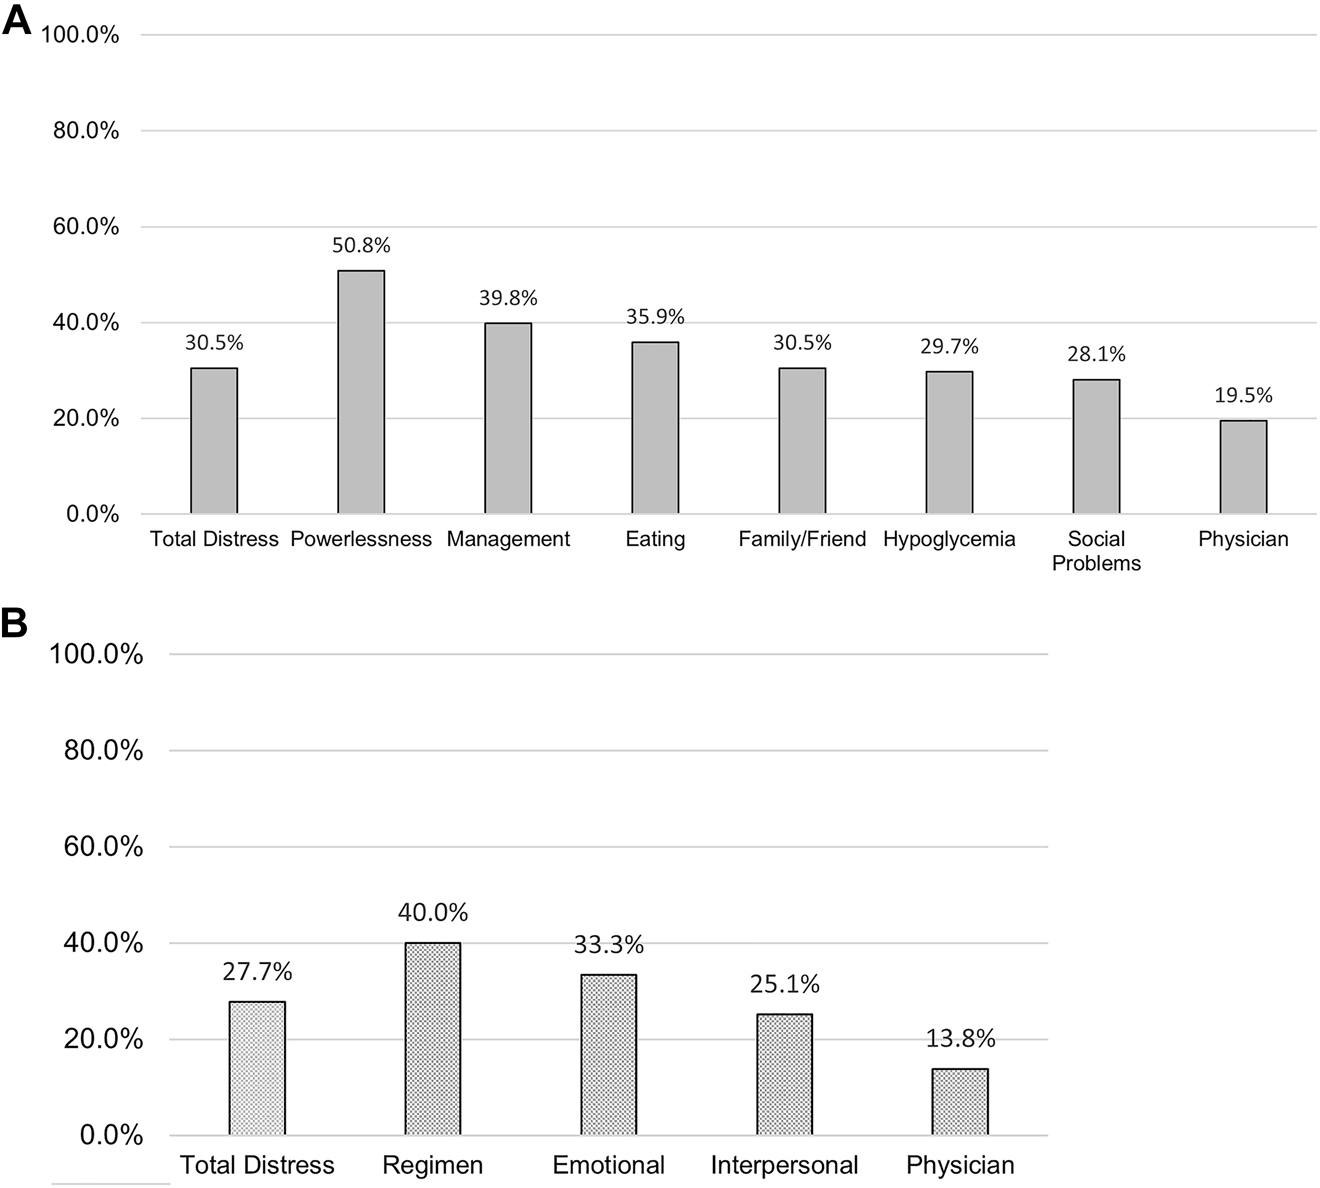
Frequency of high diabetes distress and related subscales for participants with type 1 and type 2 diabetes.
(A) Type 1 diabetes distress (n=128). (B) Type 2 diabetes distress (n=194).
Regression models
Multiple regression models examined associations among depressive symptoms, diabetes distress scores, A1C levels, diabetes self care behaviors, and DQOL in participants with T1D and T2D (Table 2). In model 1, neither depressive symptoms nor diabetes distress scores were associated with A1C levels in participants with T1D (b=0.132, p<0.222; b=0.179, p=0.097). In Model 2, higher scores of diabetes distress (b=−0.268; p=0.030; R 2=0.08) were independently associated with fewer diabetes self care behaviors in participants with T1D, after controlling for age and gender. Similarly, in Model 3, higher scores of diabetes distress (b=0.726; p<0.001; R 2=0.61) were independently associated with lower DQOL in T1D participants, after controlling for age and gender. Depressive symptoms were not associated with A1C levels, self care, or DQOL in T1D participants.
Multiple regression models examining associations among depressive symptoms and diabetes distress scores with A1C levels, self care, and diabetes quality of life in participants with type 1 or type 2 diabetes.
| Type 1 diabetes | |||||
|---|---|---|---|---|---|
| Model 1: A1C levels, R 2=0.16, n=123 | |||||
| Predictors | Β | SE B | β | t-value | p-Value |
| Age | −0.005 | 0.012 | −0.036 | −0.416 | 0.678 |
| Gender | −0.824 | 0.290 | −0.247 | −2.839 | 0.005 |
| Depressive symptoms | 0.029 | 0.024 | 0.132 | 1.227 | 0.222 |
| Diabetes distress score | 0.290 | 0.174 | 0.179 | 1.672 | 0.097 |
| Model 2: Diabetes self care, R 2=0.08, n=107 | |||||
| Predictors | Β | SE B | β | t-value | p-Value |
| Age | 0.018 | 0.132 | 0.013 | 0.135 | 0.893 |
| Gender | −3.224 | 3.400 | −0.092 | −0.948 | 0.345 |
| Depressive symptoms | −0.011 | 0.359 | −0.004 | −0.030 | 0.976 |
| Diabetes distress scores | −4.730 | 2.154 | −0.268 | −2.196 | 0.030 |
| Model 3: Diabetes quality of life, R 2=0.61, n=108 | |||||
| Predictors | Β | SE B | β | t-value | p-Value |
| Age | −0.007 | 0.076 | −0.006 | −0.087 | 0.930 |
| Gender | 0.247 | 1.958 | 0.008 | 0.126 | 0.900 |
| Depressive symptoms | 0.208 | 0.208 | 0.080 | 1.000 | 0.320 |
| Diabetes distress scores | 11.378 | 1.246 | 0.726 | 9.129 | <0.001 |
| Type 2 diabetes | |||||
| Model 4: A1C levels, R 2=0.19, n=163 | |||||
| Predictors | Β | SE B | β | t-value | p-Value |
| Age | 0.020 | 0.008 | 0.192 | 2.582 | 0.011 |
| Gender | −0.084 | 0.229 | −0.027 | −0.366 | 0.715 |
| Depressive symptoms | 0.100 | 0.022 | 0.390 | 4.520 | <0.001 |
| Diabetes distress score | 0.033 | 0.132 | 0.022 | 0.250 | 0.803 |
| Model 5: Diabetes self care, R 2=0.14, n=187 | |||||
| Predictors | Β | SE B | β | t-value | p-Value |
| Age | 0.179 | 0.081 | 0.157 | 2.211 | 0.028 |
| Gender | −1.123 | 2.585 | −0.030 | −0.434 | 0.665 |
| Depressive symptoms | 0.047 | 0.252 | 0.016 | 0.188 | 0.851 |
| Diabetes distress score | −5.501 | 1.509 | −0.312 | −3.644 | <0.001 |
| Model 6: Diabetes quality of life, R 2=0.66, n=188 | |||||
| Predictors | Β | SE B | β | t-value | p-Value |
| Age | −0.171 | 0.043 | −0.175 | −3.944 | <0.001 |
| Gender | 1.159 | 1.390 | 0.036 | 0.834 | 0.405 |
| Depressive symptoms | 0.944 | 0.135 | 0.363 | 6.974 | <0.005 |
| Diabetes distress score | 7.606 | 0.810 | 0.501 | 9.385 | <0.005 |
For participants with T2D, model 4 showed that increased depressive symptoms were associated with higher A1C levels (b=0.390; p<0.001; R 2=0.19) after controlling for age and gender. In model 5, higher scores of diabetes distress (b=−0.312; p<0.001; R 2=0.14) were independently associated with fewer diabetes self care behaviors in T2D participants, after controlling for age and gender. Finally, in model 6, both increased depressive symptoms (b=0.363; p<0.001; R 2=0.66) and higher scores of diabetes distress (b=0.501; p<0.001) were associated with lower DQOL in participants with T2D, after controlling for age and gender.
Discussion
This cross sectional survey study assessed high diabetes distress levels as well as the comorbidity of clinically significant depressive symptoms and high diabetes distress in adults living in southeastern Appalachian Ohio. Overall, 92 (28.3%) participants reported high diabetes distress levels, of which 39 (30.5%) were participants with T1D and 53 (27.5%) were participants with T2D. These findings supported our hypothesis of a prevalence for high diabetes distress greater than 25.0% in southeastern Ohio. Our overall prevalence was within the prevalence ranges reported in two previous metaanalyses (22.0% [23] and 36.0% [24]) that pooled diabetes distress data from 58 and 55 studies, respectively, from mostly urban locales in 17 different countries. However, those metaanalyses [23], [24] used a DDS cutoff ≥2.0 to indicate diabetes distress. Had we used a ≥2.0 cutoff for diabetes distress, 181 (56.4%) participants would have reported moderate to severe diabetes distress in our sample, far exceeding the prevalence reported in both previous metaanalyses. We utilized the cutoff scores of the validated T1DDS and T2DDS [22], [35]. Despite the difference in cutoff scores, our data and these metaanalyses show that diabetes distress is widespread.
There has been minimal prior research on diabetes distress in rural communities [43], [44], [45]. While diabetes distress research in the rural US is lacking, comparisons can be drawn between southeastern Ohio and the southern US. Both regions are located in the “Diabetes Belt,” a geographically distinct region characterized by higher rates of diabetes, poverty, and unemployment [46]. A recent study [47] examining diabetes distress and social support in Alabama’s Medicaid population found that 16% of participants had moderate diabetes distress and 7.7% had high distress. While our study included only 85 (26.2%) participants who had Medicare/Medicaid, our participants reported much higher rates of moderate (27.7%) and high (28.3%) diabetes distress. The social determinants of health in southeastern Ohio – such as financial insecurity, food insecurity, lack of access to health care, and lack of social support – may explain the variability in diabetes distress rates. Another study [48] conducted in Tennessee reported a 64% prevalence of moderate to high diabetes distress (≥2.0 cutoff) in adults with T1D. Combined, our 61.0% prevalence of moderate and high distress levels in T1D participants was comparable to that sample. Of note, both of those studies [47], [48] conducted in the southern US were not in rural communities. This supports the need for more diabetes distress research in rural and Appalachian communities.
The comorbidity of clinically significant depressive symptoms and high diabetes distress levels was 15.0% among T1D and T2D participants (17.3 and 13.5%, respectively). This finding did not support our second hypothesis of a comorbidity rate exceeding 15.0%; however, the observed rate is supported by previous literature. Chew et al. [49] reported a 14.0% combined rate for clinically significant depressive symptoms and diabetes distress. Another study from the Australia National Diabetes Audit, by Nanayakkara et al. [50], documented a 5% comorbidity of clinically significant depressive symptoms and high diabetes distress. Our rate is comparable to the rates presented in those studies. More research is needed to confirm our findings and examine temporal relationships between clinically significant depressive symptoms and diabetes distress over time to identify potential mediators and moderators in the pathway to target for interventions.
Our regression models showed that higher diabetes distress scores were associated with fewer self care behaviors and lower DQOL in both participants with T1D and T2D. Further, more depressive symptoms were associated with lower DQOL participants with T2D. Contrary to our hypothesis, higher diabetes distress scores were not associated with higher A1C levels in participants with T1D or T2D. We found increased depressive symptoms were associated with higher A1C levels in participants with T2D, which counters the current literature that shows diabetes distress in adults with T2D is associated with higher A1C levels cross sectionally and longitudinally [27]. While some research supports an association between increased depressive symptoms and higher A1C levels [16], [51]; diabetes distress appears to be the stronger predictor of A1C levels [31], [50]. The lack of association between diabetes distress and A1C in T1D and T2D participants may be partially explained by markers of higher socioeconomic status (i.e., education, health insurance coverage) [52] or a narrower range of A1C values in the study sample [53]. Nonetheless, these findings underscore the importance of routine screening for clinically significant depressive symptoms and high diabetes distress in people with T1D and T2D living in southeastern Appalachian Ohio.
Screening for diabetes distress
Osteopathic physicians are well positioned to screen for diabetes distress. More than 121,000 osteopathic physicians are practicing in the US, of which 56.5% identify as primary care physicians [54]. Primary care physicians treat approximately 90% of the people with T2D in the US [55]. Given the current shortage of endocrinologists [56] and increasing rates of diabetes, primary care physicians, in particular osteopathic physicians, will continue to play a large role in the care of people with diabetes. Primary care physicians already screen adults for depression per the 2016 US Preventive Services Task Force (USPSTF) recommendations [57]; thus, the addition of a brief screening tool for diabetes distress is a well timed approach to screen for both psychosocial difficulties. To facilitate routine screening for diabetes distress, osteopathic physicians can employ the abbreviated two item Diabetes Distress Scale [58]. For patients who screen positive for high diabetes distress on the two item scale, physicians can offer the more comprehensive scales adapted for T1D [35] and T2D [22]. These scales are available at no cost to nonprofit institutions [59].
Treatment for diabetes distress
The first line therapy for patients with high diabetes distress is diabetes self management education and support [3], which is an evidence based, important component of diabetes care for all people with diabetes, [60]; ongoing and repeated education is necessary to help patients maintain what they learned during their initial education [61]. For people with high diabetes distress, diabetes education can address areas of diabetes self care that may be the source of frustrations, worries, and concerns (e.g., hypoglycemia, eating, blood glucose monitoring, cost of insulin) [62]. Additionally, layperson-led or peer led diabetes self management education and support from peers or community health workers has been shown to lower diabetes distress in people with T1D and T2D [63], [64]; these interventions may be more effective in rural and culturally distinct regions like Appalachian Ohio. Future research should assess the effectiveness of peer support and community health worker interventions in southeastern Ohio.
The second line therapy for high diabetes distress is behavioral health. If tailored diabetes education does not reduce high diabetes distress, people should be referred to behavioral health providers for evaluation and treatment [3]. Effective behavioral care should incorporate problem solving therapy, cognitive behavioral therapy (CBT), motivational interviewing, and emotion regulation [65], [66], [67]. The ADA recently partnered with the American Psychological Association to offer continuing education credits for licensed mental health professionals to learn about mental health care for people with diabetes. Mental health professionals qualified to treat people with diabetes are listed in the ADA Mental Health Provider Directory Listing [68]. Providers can search the listing for mental health professionals in their region for referrals. In addition, expanded telehealth coverage and policies due to the novel coronavirus 2019 allow providers in rural regions to refer patients to telepsychology services in otherwise designated mental health professional shortage areas. Importantly, ADA guidelines do not recommend antidepressant medication for the treatment of diabetes distress [62].
Treatment for clinically significant depressive symptoms and diabetes distress
Like the USPSTF [57], the ADA guidelines recommend routine screening for MDD and clinically significant depressive symptoms [3]. The primary purpose of screening is to identify patients at high risk for MDD. The MDD diagnosis is made via the Diagnostic and Statistical Manual of Mental Disorders-5 (DSM-5) [37]. Treatment options for MDD in people with diabetes include psychotherapy (i.e., CBT), antidepressant medications, exercise, or a combination of these options [69], [70], [71]. For people with clinically significant depressive symptoms (not MDD) and co-occurring diabetes distress, CBT interventions have been shown to effectively lower depressive symptoms and diabetes distress [66], as have CBT plus exercise interventions [71]. Exercise interventions designed to address only diabetes distress have not been published to date.
Limitations
Limitations of this study include racial/ethnic homogeneity of the study sample, participant self selection, self reported data, and the cross sectional study design. While the predominantly White study sample is reflective of the racial distribution in southeastern Ohio, a larger, more diverse population is necessary to confirm these findings. Next, participant self selection limits the generalizability of the findings to all adults living in Appalachia. We recruited participants via email, flyers, social media, newspaper advertisements, and announcements in the community; thus, participants without access to broadband internet, with limited transportation, or with low literacy may have been less likely to participate. In addition, self reported data are vulnerable to response bias. Specifically, participants’ health related information was collected via self report. This may explain the lack of statistical significance observed between diabetes distress and A1C, which counters a large body of literature that shows higher diabetes distress scores are associated with higher A1C levels [26, 27, 30, 50]. Further, participants completed the PHQ-9 to self report depressive symptoms instead of completing the structured clinical interview, which is the gold standard for depression diagnosis [72]. Future researchers should collect objective physiological measures and conduct structured clinical interviews. Finally, the cross sectional study design limited our ability to detect causal associations between depressive symptoms, diabetes distress, A1C levels, self care, and DQOL. Future longitudinal research should assess these factors with a larger, more heterogenous sample to identify the directionality of the reported relationships among clinically significant depressive symptoms, diabetes distress, A1C, diabetes self care, and DQOL. Additionally, prior longitudinal research showed that diabetes distress is persistent over an 18 month time period [30]. Thus, longitudinal research in southeastern Ohio is necessary to examine how diabetes distress evolves over time and interacts with clinically significant depressive symptoms. Finally, future research should collect data on participants’ use of evidence based interventions for the treatment of diabetes distress (e.g., diabetes education, behavioral therapy) and clinically significant depressive symptoms (e.g., antidepressant medication, behavioral therapy, exercise).
Conclusions
In this study, adults in southeastern Appalachian Ohio reported high levels of diabetes distress and co-occurring clinically significant depressive symptoms. Higher levels of diabetes distress were associated with fewer diabetes self care behaviors and lower DQOL in participants with T1D and T2D. In participants with T2D, increased depressive symptoms were associated with higher A1Cs and lower DQOL. These findings highlight the importance of routine screening for diabetes distress and clinically significant depressive symptoms. Osteopathic primary care physicians are well positioned to screen for diabetes distress while simultaneously screening for depression. Evidence based interventions for diabetes distress and co-occurring clinically significant depressive symptoms are available. With expanded telehealth coverage from the novel coronavirus 2019, access to diabetes self management education and CBT may be more accessible to rural populations like the one in this study.
Funding source: American Osteopathic Association
Award Identifier / Grant number: 1291708718
-
Research funding: The current study was funded by a grant from the American Osteopathic Association (grant no. 1291708718). Grant funds were allocated to pay a percentage of the principal investigator’s salary and fringe benefits, hourly wages for research assistants, provide participant compensation, cover printing and mailing costs for surveys, and support travel for dissemination of findings at scientific conferences. The AOA made a recommendation to submit the findings to the Journal of Osteopathic Medicine in the grant request for application (RFA); however, the AOA was not involved in the final decision to submit the manuscript to JOM. The AOA had no role in the design, acquisition of data or analysis, composition of the manuscript, or review of the final document prior to manuscript submission.
-
Author contributions: Both authors provided substantial contributions to conception and design, acquisition of data, or analysis and interpretation of data; both authors drafted the article or revised it critically for important intellectual content; both authors gave final approval of the version of the article to be published; and both authors agree to be accountable for all aspects of the work in ensuring that questions related to the accuracy or integrity of any part of the work are appropriately investigated and resolved.
-
Competing interests: None reported.
-
Informed consent: All participants provided electronic or written informed consent, which was determined by the type of survey modality they completed. Informed consent was completed prior to participation in the study.
-
Ethical approval: The study was approved by the Ohio University Office of Research Compliance (Institutional Review Board #17X234).
References
1. Gevitz, N. The DOs: osteopathic medicine in America. Baltimore, MD: The Johns Hopkins University Press; 2004.Suche in Google Scholar
2. Harding, JL, Pavkov, ME, Magliano, DJ, Shaw, JE, Gregg, EW. Global trends in diabetes complications: a review of current evidence. Diabetologia 2019;62:3–16. https://doi.org/10.1007/s00125-018-4711-2.Suche in Google Scholar
3. Young-Hyman, D, de Groot, M, Hill-Briggs, F, Gonzalez, JS, Hood, K, Peyrot, M. Psychosocial care for people with diabetes: a position statement of the American Diabetes Association. Diabetes Care 2016;39:2126–40. https://doi.org/10.2337/dc16-2053.Suche in Google Scholar
4. Ruhil, A, Johnson, L, Cook, K, Trainer, M, Beverly, EA, Olson, M, et al.. What does diabetes look like in our region: a summary of the regional diabetes needs assessment study. Athens, OH: Ohio University’s Diabetes Institute; 2017:1–8 pp.Suche in Google Scholar
5. Centers for Disease Control and Prevention. National diabetes statistics report 2020: estimates of diabetes and its burden in the United States. Atlanta, GA: Centers for Diabetes Control and Prevention; 2020.Suche in Google Scholar
6. American Diabetes Association. The burden of diabetes in Ohio. Chicago, IL: American Diabetes Association; 2018.Suche in Google Scholar
7. Schwartz, F, Ruhil, AV, Denham, S, Shubrook, J, Simpson, C, Boyd, SL. High self-reported prevalence of diabetes mellitus, heart disease, and stroke in 11 counties of rural Appalachian Ohio. J Rural Health 2009;25:226–30. https://doi.org/10.1111/j.1748-0361.2009.00222.x.Suche in Google Scholar
8. Zaugg, SD, Dogbey, G, Collins, K, Reynolds, S, Batista, C, Brannan, G, et al.. Diabetes numeracy and blood glucose control: association with type of diabetes and source of care. Clin Diabetes 2014;32:152–7. https://doi.org/10.2337/diaclin.32.4.152.Suche in Google Scholar
9. Brown, KA, Holben, DH, Shubrook, JH, Schwartz, FL. Glycemic control, food access and produce intake/behaviors of individuals with diabetes in rural Appalachian Ohio. J Acad Nutr Diet 2012;112:A90. https://doi.org/10.1016/j.jand.2012.06.327.Suche in Google Scholar
10. Pollard, K, Jacobsen, LA. The Appalachian region: a data overview from the 2013–2017 American community survey. Available from: https://www.arc.gov/wp-content/uploads/2020/06/DataOverviewfrom2013to2017ACS.pdf [Accessed 8 Feb 2021].Suche in Google Scholar
11. Appalachian Regional Commission. County economic status and distressed areas in Appalachia. Available from: https://www.arc.gov/appalachian_region/CountyEconomicStatusandDistressedAreasinAppalachia.asp [Accessed 13 Oct 2016].Suche in Google Scholar
12. Marshall, JL, Thomas, L, Lane, NM, Holmes, GM, Arcury, TA, Randolph, R, et al.. Health disparities in Appalachia. Washington, DC: Appalachian Regional Commission; 2017:1–382 pp.Suche in Google Scholar
13. de Groot, M, Golden, SH, Wagner, J. Psychological conditions in adults with diabetes. Am Psychol 2016;71:552–62. https://doi.org/10.1037/a0040408.Suche in Google Scholar
14. Anderson, RJ, Freedland, KE, Clouse, RE, Lustman, PJ. The prevalence of comorbid depression in adults with diabetes: a meta-analysis. Diabetes Care 2001;24:1069–78. https://doi.org/10.2337/diacare.24.6.1069.Suche in Google Scholar
15. Lin, EH, Katon, W, Von Korff, M, Rutter, C, Simon, GE, Oliver, M, et al.. Relationship of depression and diabetes self-care, medication adherence, and preventive care. Diabetes Care 2004;27:2154–60. https://doi.org/10.2337/diacare.27.9.2154.Suche in Google Scholar
16. Lustman, PJ, Anderson, RJ, Freedland, KE, de Groot, M, Carney, RM, Clouse, RE. Depression and poor glycemic control: a meta-analytic review of the literature. Diabetes Care 2000;23:934–42. https://doi.org/10.2337/diacare.23.7.934.Suche in Google Scholar
17. de Groot, M, Anderson, R, Freedland, KE, Clouse, RE, Lustman, PJ. Association of depression and diabetes complications: a meta-analysis. Psychosom Med 2001;63:619–30. https://doi.org/10.1097/00006842-200107000-00015.Suche in Google Scholar
18. Rosenthal, MJ, Fajardo, M, Gilmore, S, Morley, JE, Naliboff, BD. Hospitalization and mortality of diabetes in older adults. A 3-year prospective study. Diabetes Care 1998;21:231–5. https://doi.org/10.2337/diacare.21.2.231.Suche in Google Scholar
19. de Groot, M, Doyle, T, Hockman, E, Wheeler, C, Pinkerman, B, Shubrook, J, et al.. Depression among type 2 diabetes rural Appalachian clinic attendees. Diabetes Care 2007;30:1602–4. https://doi.org/10.2337/dc06-1599.Suche in Google Scholar
20. Fisher, L, Gonzalez, JS, Polonsky, WH. The confusing tale of depression and distress in patients with diabetes: a call for greater clarity and precision. Diabet Med 2014;31:764–72. https://doi.org/10.1111/dme.12428.Suche in Google Scholar
21. Fisher, L, Skaff, MM, Mullan, JT, Arean, P, Mohr, D, Masharani, U, et al.. Clinical depression versus distress among patients with type 2 diabetes: not just a question of semantics. Diabetes Care 2007;30:542–8. https://doi.org/10.2337/dc06-1614.Suche in Google Scholar
22. Polonsky, WH, Fisher, L, Earles, J, Dudl, RJ, Lees, J, Mullan, J, et al.. Assessing psychosocial distress in diabetes: development of the diabetes distress scale. Diabetes Care 2005;28:626–31. https://doi.org/10.2337/diacare.28.3.626.Suche in Google Scholar
23. Dennick, K, Sturt, J, Hessler, D, Purssell, E, Hunter, B, Oliver, J, et al.. High rates of elevated diabetes distress in research populations: a systematic review and meta-analysis. Int Diabetes Nurs 2016;12:93–107. https://doi.org/10.1080/20573316.2016.1202497.Suche in Google Scholar
24. Perrin, NE, Davies, MJ, Robertson, N, Snoek, FJ, Khunti, K. The prevalence of diabetes-specific emotional distress in people with type 2 diabetes: a systematic review and meta-analysis. Diabet Med 2017;34:1508–20. https://doi.org/10.1111/dme.13448.Suche in Google Scholar
25. Berg, CA, Helgeson, VS, Kelly, CS, Tracy, EL, Litchman, ML, Butner, JE. Age differences in reactivity to daily general and type 1 diabetes stressors. Psychol Aging 2020;35:1115–26. https://doi.org/10.1037/pag0000519.Suche in Google Scholar
26. Fisher, L, Hessler, DM, Polonsky, WH, Mullan, J. When is diabetes distress clinically meaningful?: establishing cut points for the diabetes distress scale. Diabetes Care 2012;35:259–64. https://doi.org/10.2337/dc11-1572.Suche in Google Scholar
27. Fisher, L, Mullan, JT, Arean, P, Glasgow, RE, Hessler, D, Masharani, U. Diabetes distress but not clinical depression or depressive symptoms is associated with glycemic control in both cross-sectional and longitudinal analyses. Diabetes Care 2010;33:23–8. https://doi.org/10.2337/dc09-1238.Suche in Google Scholar
28. Bai, JW, Lovblom, LE, Cardinez, M, Weisman, A, Farooqi, MA, Halpern, EM, et al.. Neuropathy and presence of emotional distress and depression in longstanding diabetes: results from the Canadian study of longevity in type 1 diabetes. J Diabet Complicat 2017;31:1318–24. https://doi.org/10.1016/j.jdiacomp.2017.05.002.Suche in Google Scholar
29. Carper, MM, Traeger, L, Gonzalez, JS, Wexler, DJ, Psaros, C, Safren, SA. The differential associations of depression and diabetes distress with quality of life domains in type 2 diabetes. J Behav Med 2014;37:501–10. https://doi.org/10.1007/s10865-013-9505-x.Suche in Google Scholar
30. Fisher, L, Skaff, MM, Mullan, JT, Arean, P, Glasgow, R, Masharani, U. A longitudinal study of affective and anxiety disorders, depressive affect and diabetes distress in adults with type 2 diabetes. Diabet Med 2008;25:1096–101. https://doi.org/10.1111/j.1464-5491.2008.02533.x.Suche in Google Scholar
31. Strandberg, RB, Graue, M, Wentzel-Larsen, T, Peyrot, M, Rokne, B. Relationships of diabetes-specific emotional distress, depression, anxiety, and overall well-being with HbA1c in adult persons with type 1 diabetes. J Psychosom Res 2014;77:174–9. https://doi.org/10.1016/j.jpsychores.2014.06.015.Suche in Google Scholar
32. Beverly, EA, Rennie, RG, Guseman, EH, Rodgers, A, Healy, AM. High prevalence of diabetes distress in a university population. J Am Osteopath Assoc 2019;119:556–68. https://doi.org/10.7556/jaoa.2019.099.Suche in Google Scholar
33. Dhand, NK, Khatkar, MS. Statulator: an online statistical calculator. Sample size calculator for comparing two paired means. Available from: http://statulator.com/SampleSize/ss2PM.html [Accessed 10 Jul 2020].Suche in Google Scholar
34. National Institutes of Health. Racial and ethnic categories and definitions for NIH diversity programs and for other reporting purposes. Available from: https://grants.nih.gov/grants/guide/notice-files/NOT-OD-15-089.html [Accessed 18 Feb 2021].Suche in Google Scholar
35. Fisher, L, Polonsky, WH, Hessler, DM, Masharani, U, Blumer, I, Peters, AL, et al.. Understanding the sources of diabetes distress in adults with type 1 diabetes. J Diabet Complicat 2015;29:572–7. https://doi.org/10.1016/j.jdiacomp.2015.01.012.Suche in Google Scholar
36. Kroenke, K, Spitzer, RL, Williams, JB. The PHQ-9: validity of a brief depression severity measure. J Gen Intern Med 2001;16:606–13. https://doi.org/10.1046/j.1525-1497.2001.016009606.x.Suche in Google Scholar
37. American Psychiatric Association. Diagnostic and statistical manual of mental disorders: DSM-5, 5th ed Arlington, VA: American Psychiatric Association; 2013.10.1176/appi.books.9780890425596Suche in Google Scholar
38. Manea, L, Gilbody, S, McMillan, D. Optimal cut-off score for diagnosing depression with the Patient Health Questionnaire (PHQ-9): a meta-analysis. CMAJ 2012;184:E191–6. https://doi.org/10.1503/cmaj.110829.Suche in Google Scholar
39. Weinger, K, Butler, HA, Welch, GW, La Greca, AM. Measuring diabetes self-care: a psychometric analysis of the self-care inventory-revised with adults. Diabetes Care 2005;28:1346–52. https://doi.org/10.2337/diacare.28.6.1346.Suche in Google Scholar
40. Weinger, K, Beverly, EA, Lee, Y, Sitnokov, L, Ganda, OP, Caballero, AE. The effect of a structured behavioral intervention on poorly controlled diabetes: a randomized controlled trial. Arch Intern Med 2011;171:1990–9. https://doi.org/10.1001/archinternmed.2011.502.Suche in Google Scholar
41. Jacobson, AM. The DCCT Research Group: the diabetes quality of life measure. In: Bradley, C, ed. Handbook of psychology and diabetes. London: J. Wiley; 1994.Suche in Google Scholar
42. Delahanty, LM, Grant, RW, Wittenberg, E, Bosch, JL, Wexler, DJ, Cagliero, E, et al.. Association of diabetes-related emotional distress with diabetes treatment in primary care patients with type 2 diabetes. Diabet Med 2007;24:48–54. https://doi.org/10.1111/j.1464-5491.2007.02028.x.Suche in Google Scholar
43. Sasi, ST, Kodali, M, Burra, KC, Muppala, BS, Gutta, P, Bethanbhatla, MK. Self care activities, diabetic distress and other factors which affected the glycaemic control in a tertiary care teaching hospital in south India. J Clin Diagn Res 2013;7:857–60. https://doi.org/10.7860/JCDR/2013/5726.2958.Suche in Google Scholar
44. Chew, BH, Mohd-Sidik, S, Shariff-Ghazali, S. Negative effects of diabetes-related distress on health-related quality of life: an evaluation among the adult patients with type 2 diabetes mellitus in three primary healthcare clinics in Malaysia. Health Qual Life Outcome 2015;13:187. https://doi.org/10.1186/s12955-015-0384-4.Suche in Google Scholar
45. Miller, ST, Elasy, TA. Psychometric evaluation of the problem areas in diabetes (PAID) survey in southern, rural african American women with type 2 diabetes. BMC Publ Health 2008;8:70. https://doi.org/10.1186/1471-2458-8-70.Suche in Google Scholar
46. Myers, CA, Slack, T, Broyles, ST, Heymsfield, SB, Church, TS, Martin, CK. Diabetes prevalence is associated with different community factors in the diabetes belt versus the rest of the United States. Obesity 2017;25:452–9. https://doi.org/10.1002/oby.21725.Suche in Google Scholar
47. Presley, CA, Mondesir, FL, Juarez, LD, Agne, AA, Riggs, KR, Li, Y, et al.. Social support and diabetes distress among adults with type 2 diabetes covered by Alabama Medicaid. Diabet Med 2021;38:e14503. https://doi.org/10.1111/dme.14503.Suche in Google Scholar
48. Abdoli, S, Miller-Bains, K, Burr, EM, Smither, B, Vora, A, Hessler, D. Burnout, distress, and depressive symptoms in adults with type 1 diabetes. J Diabet Complicat 2020;34:107608. https://doi.org/10.1016/j.jdiacomp.2020.107608.Suche in Google Scholar
49. Chew, BH, Vos, R, Mohd-Sidik, S, Rutten, GE. Diabetes-related distress, depression and distress-depression among adults with type 2 diabetes mellitus in Malaysia. PLoS One 2016;11:e0152095. https://doi.org/10.1371/journal.pone.0152095.Suche in Google Scholar
50. Nanayakkara, N, Pease, A, Ranasinha, S, Wischer, N, Andrikopoulos, S, Speight, J, et al.. Depression and diabetes distress in adults with type 2 diabetes: results from the Australian National Diabetes Audit (ANDA) 2016. Sci Rep 2018;8:7846. https://doi.org/10.1038/s41598-018-26138-5.Suche in Google Scholar
51. Schmitt, A, Reimer, A, Hermanns, N, Kulzer, B, Ehrmann, D, Krichbaum, M, et al.. Depression is linked to hyperglycaemia via suboptimal diabetes self-management: a cross-sectional mediation analysis. J Psychosom Res 2017;94:17–23. https://doi.org/10.1016/j.jpsychores.2016.12.015.Suche in Google Scholar
52. Fegan-Bohm, K, Minard, CG, Anderson, BJ, Butler, AM, Titus, C, Weissberg-Benchell, J, et al.. Diabetes distress and HbA1c in racially/ethnically and socioeconomically diverse youth with type 1 diabetes. Pediatr Diabetes 2020;21:1362–9. https://doi.org/10.1111/pedi.13108.Suche in Google Scholar
53. Hessler, D, Fisher, L, Glasgow, RE, Strycker, LA, Dickinson, LM, Arean, PA, et al.. Reductions in regimen distress are associated with improved management and glycemic control over time. Diabetes Care 2014;37:617–24. https://doi.org/10.2337/dc13-0762.Suche in Google Scholar
54. Osteopathic medical profession report. Available from: https://osteopathic.org/wp-content/uploads/OMP2019-Report_Web_FINAL.pdf [Accessed 9 Feb 2021].Suche in Google Scholar
55. Davidson, JA. The increasing role of primary care physicians in caring for patients with type 2 diabetes mellitus. Mayo Clin Proc 2010;85:S3–4. https://doi.org/10.4065/mcp.2010.0466.Suche in Google Scholar
56. Romeo, GR, Hirsch, IB, Lash, RW, Gabbay, RA. Trends in the endocrinology fellowship recruitment: reasons for concern and possible interventions. J Clin Endocrinol Metab 2020;105:1701–6. https://doi.org/10.1210/clinem/dgaa134.Suche in Google Scholar
57. U.S. Preventive Services Task Force. Screening for depression in adults: recommendation statement. Am Fam Physician 2016;94:340A-D.Suche in Google Scholar
58. Fisher, L, Glasgow, RE, Mullan, JT, Skaff, MM, Polonsky, WH. Development of a brief diabetes distress screening instrument. Ann Fam Med 2008;6:246–52. https://doi.org/10.1370/afm.842.Suche in Google Scholar
59. Scales and measures. Available from: https://behavioraldiabetes.org/scales-and-measures/ [Accessed 14 Jun 2021].Suche in Google Scholar
60. Ismail, K, Winkley, K, Rabe-Hesketh, S. Systematic review and meta-analysis of randomised controlled trials of psychological interventions to improve glycaemic control in patients with type 2 diabetes. Lancet 2004;363:1589–97. https://doi.org/10.1016/s0140-6736(04)16202-8.Suche in Google Scholar
61. Beverly, EA, Fitzgerald, SM, Brooks, KM, Hultgren, BA, Ganda, OP, Munshi, M, et al.. Impact of reinforcement of diabetes self-care on poorly controlled diabetes: a randomized controlled trial. Diabetes Educat 2013;39:504–14. https://doi.org/10.1177/0145721713486837.Suche in Google Scholar
62. American Diabetes Association. ADA’s standards of medical care in diabetes. Clin Diabetes 2021;39:128.10.2337/cd21-pe01Suche in Google Scholar PubMed PubMed Central
63. Joensen, LE, Meldgaard Andersen, M, Jensen, S, Norgaard, K, Willaing, I. The effect of peer support in adults with insulin pump-treated type 1 diabetes: a pilot study of a flexible and participatory intervention. Patient Prefer Adherence 2017;11:1879–90. https://doi.org/10.2147/ppa.s142204.Suche in Google Scholar
64. Spencer, MS, Kieffer, EC, Sinco, B, Piatt, G, Palmisano, G, Hawkins, J, et al.. Outcomes at 18 Months from a community health worker and peer leader diabetes self-management program for Latino adults. Diabetes Care 2018;41:1414–22. https://doi.org/10.2337/dc17-0978.Suche in Google Scholar
65. Fisher, L, Hessler, D, Glasgow, RE, Arean, PA, Masharani, U, Naranjo, D, et al.. REDEEM: a pragmatic trial to reduce diabetes distress. Diabetes Care 2013;36:2551–8. https://doi.org/10.2337/dc12-2493.Suche in Google Scholar
66. Hermanns, N, Schmitt, A, Gahr, A, Herder, C, Nowotny, B, Roden, M, et al.. The effect of a Diabetes-Specific Cognitive Behavioral Treatment Program (DIAMOS) for patients with diabetes and subclinical depression: results of a randomized controlled trial. Diabetes Care 2015;38:551–60. https://doi.org/10.2337/dc14-1416.Suche in Google Scholar
67. Fisher, L, Hessler, D, Polonsky, WH, Masharani, U, Guzman, S, Bowyer, V, et al.. T1-REDEEM: a randomized controlled trial to reduce diabetes distress among adults with type 1 diabetes. Diabetes Care 2018;41:1862–9. https://doi.org/10.2337/dc18-0391.Suche in Google Scholar
68. American Diabetes Association. Mental health provider directory listing. Available from: https://professional.diabetes.org/mhp_listing [Accessed 15 Mar 2021].Suche in Google Scholar
69. Katon, WJ, Lin, EH, Von Korff, M, Ciechanowski, P, Ludman, EJ, Young, B, et al.. Collaborative care for patients with depression and chronic illnesses. N Engl J Med 2010;363:2611–20. https://doi.org/10.1056/nejmoa1003955.Suche in Google Scholar
70. Piette, JD, Richardson, C, Himle, J, Duffy, S, Torres, T, Vogel, M, et al.. A randomized trial of telephonic counseling plus walking for depressed diabetes patients. Med Care 2011;49:641–8. https://doi.org/10.1097/mlr.0b013e318215d0c9.Suche in Google Scholar
71. de Groot, M, Shubrook, JH, Hornsby, WGJr, Pillay, Y, Mather, KJ, Fitzpatrick, K, et al.. Program ACTIVE II: outcomes from a randomized, multistate community-based depression treatment for rural and urban adults with type 2 diabetes. Diabetes Care 2019;42:1185–93. https://doi.org/10.2337/dc18-2400.Suche in Google Scholar
72. Williams, JBW, Karg, RS, Spitzer, RL. Structured clinical interview for DSM-5, research version (SCID-5 for DSM-5, research version; SCID-5-RV). Arlington, VA: American Psychiatric Association; 2015.Suche in Google Scholar
Supplementary Material
The online version of this article offers supplementary material (https://doi.org/10.1515/jom-2021-0091).
© 2021 Elizabeth A. Beverly and Francis Osowik, published by De Gruyter, Berlin/Boston
This work is licensed under the Creative Commons Attribution 4.0 International License.
Artikel in diesem Heft
- Frontmatter
- Behavioral Health
- Original Article
- A survey of Midwest physicians’ experiences with patients in psychiatric distress in the emergency department
- General
- Original Article
- Knowledge of osteopathic manipulative medicine and osteopathic physicians in a New York South Asian community
- Medical Education
- Original Article
- U.S. medical school admissions and enrollment practices: status of LGBTQ inclusivity
- Neuromusculoskeletal Medicine (OMT)
- Original Article
- Patient-centered care or osteopathic manipulative treatment as mediators of clinical outcomes in patients with chronic low back pain
- Obstetrics and Gynecology
- Clinical Practice
- Osteopathic considerations for breastfeeding women
- Public Health and Primary Care
- Original Article
- Clinically significant depressive symptoms and high diabetes distress in adults with type 1 and type 2 diabetes in Appalachian Ohio
- Clinical Image
- Kaposi varicelliform eruption in a patient with atopic dermatitis