
The Impact of Manufacturing Transfer from China to India on China’s GDP and Employment
-
Xiaoxu Zhang

Abstract
With the rising labor costs and increasing resource and environmental constraints in China, coupled with geopolitical conflicts, related industries or production processes are shifting to emerging economies such as Southeast Asia, South Asia, and Mexico. Among these, India’s development potential has garnered significant attention, and the “China-to-India Industrial Transfer Model” in the global industrial chain poses a greater impact and threat to China. This paper constructs a quantitative model to measure the impact of industrial transfer on the home country. It designs three scenarios—ultra-long-term, medium-to-long-term, and short-to-medium-term—and uses counterfactual analysis to assess the impact of India’s absorption of China’s industrial transfer on China’s GDP and employment under different scenarios. The research results indicate that the transfer of industries from China to India will generate significant socio-economic shocks. In the ultra-long-term, this industrial transfer could lead to a 15.6% reduction in China’s GDP, a 16.8% decrease in the overall income of the workforce, and a reduction in the number of employed people by 110 million. The impacts are also substantial in the medium- to-long-term and short-to-medium-term scenarios. By sectors, the relocation of low and medium-low R&D intensity manufacturing sectors has a significant impact on the Chinese economy in both the short-to-medium and medium-to-long term perspectives. The relocation of high R&D intensity manufacturing sectors, represented by the computer industry, also causes considerable negative effects on the Chinese economy in the ultra-long-term perspective. This quantitative analysis helps anticipate the economic impact of future changes in industrial layout on China’s economy and facilitates the development of preemptive strategies. Based on the medium-to-long-term international economic outlook and the characteristics of domestic regional and industrial economic development, we propose three policy implications.
1 Introduction
The continuous imbalance in global trade in goods requires the re-layout of the global industrial chain. The changing international political and economic environment, the escalation of geopolitical conflicts, the resurgence of trade protectionism, and the impact of major public health and security incidents have jointly accelerated the trend of global value chain restructuring (Brakman et al., 2020). The division of labor, operation logic, rule system and competition paradigm of the industrial chain and supply chain are undergoing profound changes. The layout of the global value chain has gradually shifted from emphasizing cost and efficiency to emphasizing security and stability, and the industrial layout has shown a trend of “localization”, “regionalization” and “friendly shore”. In addition, more and more studies use “global supply chains” instead of “global value chains” (Baldwin and Freeman, 2022; Carvalho et al., 2021; Timmer et al., 2021). The security and stability of industrial and supply chains have become an important factor to macroeconomic recovery. Since the 18th National Congress of the Communist Party of China, General Secretary Xi Jinping has repeatedly made important instructions on the security and stability of industrial and supply chains, and the overall development and security issues have been raised to an unprecedented new height.
Since the 1990’s, with the continuous spread of “process-based” production around the world, the production process has been divided into a series of interconnected production processes and distributed to different economies (Cheng, 2015; Tang and Zhang, 2018), China has become the “factory of the world” by virtue of its labor endowment and low-cost advantages (Shan, 2002; Lemoine and Ünal-Kesenci, 2004). However, since the beginning of the 21st century, the era of cheap labor in China has come to an end (Li et al., 2012), and labor-intensive industries (such as textiles) or labor-intensive production links (such as assembly and processing) have begun to divert to other emerging economies (Upward et al., 2013; Yang et al., 2020; Zhu et al., 2020). Abundant labor resources, a flexible investment climate, and a desire for rapid development make the Global South a more attractive destination for the relocation of manufacturing industries (Meng et al., 2018).
International industrial transfer is an important issue related to the security and stability of China’s industrial and supply chains, and is closely related to stabilizing the economy, improving resilience and high-quality economic development. At present, there are many studies in the literature on the impact of GVC restructuring on China’s economy (Cai et al., 2009; Zhang and Liu, 2009; Ma et al., 2013; Pan and Li, 2018; Jing and Yuan, 2019; Ni and Tian, 2023), and there are relatively few studies on China’s outward industrial transfer (Yan and Tian, 2020; Gao, 2022; Yin et al., 2024), and mainly focuses on ex-post impact analysis, and rarely conducts ex-ante impact assessment. In addition, the focus on the relocation of enterprises in China is mainly focused on the withdrawal of foreign capital (Li et al., 2016; Luo and Si, 2020), there is a lack of research on the emigration of domestic capital. According to the relationship between the host country and the domestic supply chain, China’s outward industrial transfer can be divided into two categories. One is that enterprises move out in order to pursue lower costs and avoid trade risks, and this kind of outward relocated industry chain needs to rely on China’s supply chain to maintain development, which can be summarized as a complementary as “Chinan→Southeast Asia transfer model”. On the other hand, multinational enterprises give priority to economies with relatively complete supply chain systems and similar development potential to China, and this kind of outward relocated industrial chain relies on the supply chain development of the target economy, gets rid of the dependence on China’s supply chain, and forms competition with China’s industrial chain, which can be summarized as the “China → India transfer model” of competition. Current research mainly focuses on the former, and there are relatively few studies on the “China → India transfer model”. However, its importance cannot be overlooked. First of all, India has outstanding comparative advantages in undertaking industrial transfer, and is the most powerful economy to undertake China’s foreign industrial transfer. Second, the model aims to get rid of China’s supply chain, which has a greater impact and threat to China’s economy.
In this context, the study of the impact of China’s foreign industrial transfer and global value chain restructuring has become a national strategic need. In the future adjustment and restructuring of the global value chain, India’s development may have a potential impact on China. China may take steps to slow this trend, but which sectors in India have an advantage? How to measure the scale of India’s undertaking of China’s industrial transfer? In this process, what will be the impact on China’s GDP and employment, and what risks will it face? Considering the relative lack of a prior quantitative model of the impact of industrial transfer on the home country, we construct an evaluation framework for the impact of the industrial transfer on the home country’s economy and employment, and use counterfactual analysis to measure the impact of China’s industrial transfer to India on China’s GDP and employment. On this basis, a feasible strategy for optimizing the layout of China’s productive forces and enhancing the safety and stability of the industrial chain is proposed.
2 Model Framework and Data
2.1 Framework for Assessing the Impact of Foreign Industrial Transfer
Considering the relative lack of a quantification model of the impact of outward industrial transfer on the home country, we take India’s undertaking of China’s industrial transfer as an example and construct an assessment framework for the impact of outward industrial transfer on the home country’s economy.
The different endowment structures make different economies show different production capacity in various industries, and accordingly there will be different advantageous industries. Firstly, drawing on the quantitative evaluation framework for industrial transfer (Zhang et al., 2024) and the industrial gradient coefficient (Dai, 2006), the dominant industries in India to undertake China’s industrial transfer are identified. On the basis of this model, taking into account the path of industry transfer from China’s southeast coastal areas to Chinese mainland, as well as India’s current key industries, we identify three types of advantageous industries A1, A2 and A3 that India undertakes China’s industrial transfer.
Secondly, based on the occupational nature of labor factors, we adjust China’s occupational income structure based on the occupational income structure of the Asian Tigers, and obtain the proportion of China’s industrial transfer in each industry. We use the trade gravity model to obtain the transfer ratio of India to China’s industrial transfer in each industry.
Thirdly, according to whether the undertaking capacity and transfer structure are limited, we design three types of transfer scenarios. Then, based on the input-output framework, considering the heterogeneity of intermediate and final goods, this paper depicts the changes in global industrial layout caused by India’s undertaking of China’s industrial transfer. Using counterfactual analysis, the impact of India’s undertaking of China’s industrial transfer on China’s GDP and employment is measured.
2.2 Industry Identification and Scale Measurement of India’s Undertaking of China’s Industrial Transfer
2.2.1 Identification of India’s Advantageous Industries to Undertake China’s Industrial Transfer
(1) Identification of India’s dominant industry set (A1) to undertake China’s industrial transfer. Drawing on the quantitative assessment framework proposed by Zhang et al. (2024), we identify the set of dominant industries in India to undertake China’s industrial transfer (A1)[1] (see Table 1). The framework integrates the location quotient index, the GVC participation measurement model proposed by Wang et al. (2017), and the industrial transfer value accounting method proposed by Gao et al. (2022).
India’s Advantageous Industries to Undertake China’s Industrial Transfer
| Types of Strengths | Advantageous industries |
|---|---|
| Optimal advantages | Food, beverage and tobacco manufacturing |
| Basic metals | |
| Sub-optimal advantage | Paper products and printing industry |
| Other non-metallic mineral products | |
| Other transport equipment | |
| Medium advantage | Computer, electronic and optical equipment |
| Timber and timber and cork products | |
| Cars, trailers and semi-trailers |
(2) The identification of India’s dominant industry set A2 taking into account the internal transfer of China. Among the many potential destinations to undertake China’s industrial transfer, India has outstanding comparative advantages and is becoming the main host country for a new round of international industrial transfer. At the same time, there is another path in China, that is, from the developed southeastern coastal areas to other inland areas. To this end, we get the set of India’s dominant industries (A2) after the transfer within China.
First, on the basis of the inter-provincial input-output tables of 31 provinces and cities in China compiled by Li (2023), the input-output tables of eight regions were combined according to the corresponding conditions of regions and provinces (see Table 1 in the Supplementary Information available on the Website (SI)).
Then, the advantageous industries of northeastern, northern coastal, central, northwest and southwest regions with lower labor costs than those in the southeast coast (see Table 2 in SI) are measured, and are mapped to the industries in the OECD-ICIO according to the corresponding tables (see Table 3 in SI). We use the industrial gradient coefficient proposed by Dai (2006) to identify the advantageous industries in each region.
Among them, Rijis the location quotient of industry iin region j, Yijis the GDP of industry i in region j, Yj is the GDP of region j, Ei is the gross domestic product of industry i, and E is the gross domestic product of the country.
In Eq. (2), Lij is the comparative labor productivity of industry i in region j, Wij is the number of employees in industry i in region j, and Wi is the number of employees in industry i in the country. It is generally believed that industries with industrial gradient coefficients greater than 1 in a certain region are the industries with certain competitive advantages in the region (Zhang and Gu, 2019).
Then, the gradient coefficients of industrial undertaking in China’s eight regions (see Table 4 in SI) are obtained, and then the industries with industrial advantages in the five inland regions with lower labor costs than those in the southeast coastal region (see Table 5 in SI) are obtained.
Finally, five industries with regional industrial advantages are excluded from set A1, and set A2 of India’s advantageous industries after considering intra-Chinese transfer is obtained (as shown in Table 2).
India’s Advantageous Industries after Considering Intra-Chinese Transfer
| Types of Strengths | Advantageous industries |
|---|---|
| Optimal advantages | Basic metals |
| Sub-optimal advantage | Paper products and printing industry |
| Medium advantage | Computer, electronic and optical equipment |
| Air transport | |
| Cars, trailers and semi-trailers |
(3) Identification of India’s key development advantage industry set A3. The 25 key areas of “Made in India” are selected and mapped to the input-output table, and the dominant manufacturing industry set A3 of India is obtained in Table 3.
A Collection of India’s Key Development Advantage Industry Set A3
| India’s key manufacturing sector |
|---|
| Food, beverage and tobacco manufacturing |
| Textiles, textile products, leather and footwear |
| Coke and refined petroleum products |
| Chemicals and chemical products |
| Pharmaceuticals, medicinal chemicals and plant products |
| Computer, electronic and optical equipment |
| Electrical equipment |
| Cars, trailers and semi-trailers |
2.2.2 Measure of the Scale of India’s Undertaking of China’s Industrial Transfer
(1) Estimation of the degree of China’s outward industrial transfer in various industries.
As the level of labor income increases, the structure of resource endowments in each economy will change. A country’s manufacturing exports will be “service-oriented”, that is, with the growth of GDP per capita, the proportion of productive occupational income in total exports will gradually decline (Kruse et al., 2023). Correspondingly, its industrial structure will also be reconfigured. The differences in the occupational income structure of countries with different income levels also reflect the differences in labor endowments between countries and the structural changes in manufacturing production. In other words, the host country will gradually form an industrial division of labor similar to that of the home country, corresponding to a similar occupational division of labor income structure.
Based on the occupational nature of labor factors, we adjust China’s occupational income structure based on the occupational income structure of Korea, Singapore, Hong Kong, China and Taiwan, China, so as to obtain the proportion of each industry that needs to be transferred, that is, the proportion of China’s industrial outward transfer

Proportion of China’s Industrial Transfer to India in the Ultra-Long and Medium Term[1]
(2) Estimation of the scale of industrial transfer that India can undertake in various industries.
In recent years, India’s economic growth has been mainly driven by domestic demand, resulting in a higher import growth rate than an export growth rate, which has hindered the development of India’s economy to a certain extent. To address this challenge, India Prime Minister Narendra Modi vowed to reinvigorate the “Make in India” flagship policy, which aims to develop India into a global manufacturing and export powerhouse, promote export-led economic development, and accelerate integration into the international market.
Using the economy’s export-oriented degree as a benchmark, this study uses a gravity model to estimate India’s export trade potential by sector (see Table 7 in SI) by using the gravity model as follows:
In Eq. (3), EXij represents the export value of country i to country j; The Vai and Vaj represent the added value of country i and country j, respectively; The DISij represents the geographical distance between the capitals of country i and country j; LANij represents whether country i and country j have a common language; uij is the perturbation term.
In the end, the proportion of industry k that India would undertake China’s industrial transfer
Growth models such as Solow (1956) show that technological progress and capital accumulation can significantly increase an economy’s long-term capacity, i.e., that is, in the ultra-long run, an economy’s capacity can break through existing constraints. Therefore, when the host country undertakes the industrial transfer, its scale will no longer be limited by its own production capacity, but mainly depends on the scale of the transfer in the home country. That is, from an ultra-long-term perspective, the proportion of China’s industrial transfer to India is θ1. However, in the medium term, an economy’s ability to undertake industrial transfer is limited. Ando and Kimura (2005), in their study of production networks in Asia, point out that capacity expansion in the medium term is constrained by the constraints of existing infrastructure, technological level and human capital reserves. Therefore, in the medium term, the proportion of China’s industrial transfer to India is θ2.
2.3 Analysis of the Prospects of India’s Undertaking of China’s Industrial Transfer
In the short term, political stability, changes in laws and regulations, adjustments in trade policies, and even geopolitical tensions may force companies to adjust their production layout, and these decisions may not be based solely on economic cost-effectiveness. In addition, the home country government can also influence the relocation of the industrial chain through policy measures, especially in the short term to take tax incentives, infrastructure construction, technical support and other measures to enhance the competitiveness and attractiveness of the domestic industry. However, in the long run, these policy interventions are often unsustainable and cannot completely prevent the redeployment of the global industrial chain.
Due to the similarities between China and India in terms of economic size, population size, stage of development and policy environment, we assume that India’s path and stage for undertaking global industrial transfer may be similar to China’s. Therefore, we design three types of transfer scenarios to examine the impact of India’s undertaking of China’s industrial transfer on China’s value added and employment at different time periods. The ULT scenario (more than 18 years), the MLT scenario (6–17 years) and the SMT scenario (3–5 years) were set up, and the MLT scenario and the SMT scenario were set up with several sub-scenarios (see Table 4).
India Undertakes China’s Industrial Transfer Scenario (A3)
| scenarios | Basic settings | Objectives |
|---|---|---|
| ULT | India will replace the share of intermediate and final goods in all manufacturing industries in the world that were originally supplied by China, and the substitution ratio of each industry is θ1 | Measure the long-term impact of China’s industrial transfer to India on China’s economy |
| UL-MLT | The share of intermediate and final goods in all manufacturing industries in the world’s economies that were originally supplied by China will be replaced by India, and the substitution ratio of each industry is θ2 | Measure the upper limit of the impact of China’s industrial transfer to India on China’s economy in the medium to long term |
| B1/B2/B3-MLT | The share of intermediate goods and final goods originally supplied by China in some manufacturing industries in various economies around the world will be replaced by India, and the substitution ratio of each industry is θ2, and if the k industry did not transfer, |
Measure the impact of the relocation of some industries to India on China’s economy |
| CE1/CE2/CE3 | The share of intermediate and final goods originally supplied by China in some manufacturing industries in all economies (except China) will be replaced by India, and the substitution ratio of each industry is θ2, and if k industry did not transfer, |
Measure the unavoidable economic impact even if China implements policies |
| CP1/CP2/CP3 | The share of intermediate and final goods originally supplied by China in some manufacturing industries of the United States, Japan, India and Australia will be replaced by India, and the substitution ratio of each industry is θ2, and if the k industry did not transfer, |
Measure the impact of the India-Pacific Strategy on China’s economy |
From an ultra-long-term perspective, as mentioned in the previous section, India’s undertaking of China’s industrial transfer depends mainly on the scale of China’s external transfer. Moreover, this kind of industrial transfer is mainly determined by factors such as labor costs, resource endowments, and market demand, and is usually an all-round transfer, that is, the ULT scenario.
In the medium term, the expansion of an economy’s production capacity will be limited by the existing infrastructure, technology level and human capital reserves, so India’s undertaking of China’s industrial transfer will be limited in the medium term. Industrial transfer led by multinational corporations is an economic behavior to optimize resource allocation and reduce production costs. This kind of industrial transfer is not the unilateral will of any one country, but is driven by multiple factors such as global market dynamics, production factor endowments, technological progress and policy environment. In addition, the process of undertaking industrial transfer in India is likely to be a gradual and selective process, prioritizing the development of industries with comparative advantages while gradually improving the competitiveness of other industries. Based on this, we set up four sub-scenarios of MLT, namely UL- MLT, B1-MLT, B2-MLT, and B3-MLT. Among them, UL-MLT is the upper limit of the impact on China’s economy in the medium and long term, and the last three sub-scenarios show the impact of the relocation of some advantageous industries to Indiaon China’s economy.
From a short-term perspective, industrial transfer may not be entirely based on economic considerations, but may involve multiple factors such as politics and industrial security. For example, the Organization of the United States, Japan, India and Australia (QUAD) is committed to developing India into a manufacturing hub, promoting the transfer of industries to India through policy support and various measures. This shift takes into account not only cost-effectiveness, but also strategic geopolitical and industrial security considerations. Similarly, in order to maintain the security of its industrial chain and its economic development, China may not want some key industries to move abroad too quickly. In response to this trend, China is likely to adopt a series of policies and measures to ensure the stability of the industrial chain and the sustainable development of the domestic economy. These short-term political and security considerations suggest that industrial transfer is a complex decision-making process. Based on this, we subdivide the SMT scenario into six sub-scenarios and set up three types of CE scenarios, which can discuss the economic impact of China’s policies. The three types of CP scenarios are mainly set up to measure the impact of the “India-Pacific Strategy” on China’s economy on the issue of China’s foreign industrial transfer.
2.4 The Economic Impact on China of India’s Undertaking of China’s Industrial Transfer
Industrial transfer has a far-reaching impact on a country’s economic development. For China, there are particular concerns about the employment and economic growth problems that may be triggered by the transfer of industries. Manufacturing is the cornerstone of China’s economic development, providing a large number of jobs and economic growth drivers for China. The relocation of manufacturing can lead to mass unemployment, especially in the absence of new industries and services to absorb labor, which in turn threatens social stability (Autor et al., 2013). In addition, the relocation of manufacturing may slow economic growth by weakening China’s industrial output and export capacity (Rodrik, 2006). To this end, based on the global multi-regional input-output model, we estimate the impact of India’s undertaking of China’s industrial transfer on China’s economy through counterfactual analysis.
2.4.1 Global Multi-Regional Input-Output Model
The global multi-regional input-output (MRIO) table model provides the data and model basis for the calculation of this paper. Without loss of generality, let’s assume that the world is made up of G economies, each of which has N sectors. The superscript indicates the economy r, s = 1,2,…,g, and the subscript represents the industry i, j = 1,2,…, n, and its economic structure is shown in Table 9 in SI.
In this MRIO model:
From the balance of the rows of the input-output table, it can be obtained:
where μ is the unit column vector corresponding to the dimension, and B= (I – A)–1 is the Leontief inverse matrix.
The value added and employment of each region and industry as a result of final demand can be expressed as:
According to Eq. (6) and (7), the value added of the s economy, driven by final demand, can be expressed as:
where
2.4.2 The Impact of India’s Undertaking of China’s Industrial Transfer on China’s Added Value and Employment
India’s undertaking of China’s outward industrial transfer will be accompanied by changes in the global industrial layout. For the change in the source structure of final goods, the logic of Hypothetical Extraction Method (HEM) proposed by Los et al. (2016) is used to shift the final demand of other economies for Chinese final products to the final demand for India’s. Define the relationship between the consumption of final goods between different economies as follows:
Scenario ULT/MLT: The share of China’s supply in the final goods of the world’s manufacturing industry is replaced by India, and the substitution ratio matrix is θ1 and θ2, where
Scenario CE: The share of the final goods supplied by China in the manufacturing industry of all countries in the world (except China) is replaced by India, and the substitution ratio matrix is θ2. The consumption relationship between the final products in different countries is as follows:
Scenario CP: The share supplied by China in the final manufacturing products of the four countries of United States, Japan, India and Australia is replaced by India, and the substitution ratio matrix is θ2. The consumption relationship between the final products in different countries is as follows:
For intermediate goods, due to the different technical conditions of various countries, the consumption of intermediate goods by other economies in China cannot be directly transferred to India, and the treatment method of the aforementioned final goods cannot be adopted. In this paper, we draw on the ideas of Xu and Dietzenbacher (2014), Yan and Tian (2020) to decompose the direct consumption coefficient matrix A into the Hadamard product of the production technology matrix P and the source structure matrix U.
According to the meaning of the direct consumption coefficient,
Let Usr denote the proportion of intermediate goods imported from region s by region r to all imported intermediate goods in region r, and then the source structure matrix U of global intermediate inputs as shown in Eq. (11) is obtained.
Under scenarios ULT/MLT, CE and CP, the source structure matrix of global intermediate inputs is as follows:
Using counterfactual analysis and drawing on the logic of HEM, we obtain the change of China’s value-added DVAVs, and the change in employment DEMAVs, that is, the difference between the actual and hypothetical value-added and employment, respectively.
2.5 Data Description
This paper uses the inter-country input-output table released in OECD2023 and the inter-provincial input-output table of China released by the Development Research Center of the State Council in 2023. The OECD-ICIO table covers 76 economies and the rest of the world, each containing 45 sectors, and the latest year data is for 2020, unless otherwise indicated, 2020 data are used. China’s inter-provincial input-output table includes 31 provinces and municipalities and 42 industries, and the latest year data is for 2017, unless otherwise indicated, 2017 data are used. The manufacturing employment data are derived from the “Chinese Population and Employment Statistical Yearbook”, and the industrial value-added data is derived from China’s input-output table. The occupational income data and employment vector data are derived from the Occupation Database (OD), and corresponded to the 45 industries of the OECD according to the 2-digit ISC. The latest data for OD is for 2018 and we have adjusted the data to 2020 based on the structure of 2018 and the total for 2020. Trade data are derived from the database of the Centre for International Information and Prospects Studies (CEPII) in France.
3 Empirical Analysis
3.1 The Impact of India’s Undertaking of China’s Industrial Transfer on China’s Economy: Overall Results
The negative impact of industrial transfer on China’s economy is significantly different from different time perspectives (see Table 5). Under the ULT scenario, enterprises will have more time to carry out comprehensive resource allocation and strategic adjustment, and the manufacturing sector will be relocated in all directions. This shift would reduce China’s GDP by 15.6 percent, the income of employees by 16.8 percent, and the number of employed people by 107 million (14.7%)1. It is worth noting that the decline in the income of employees has been more significant, which means that not only the number of jobs has been affected, but also the living standards of employees have also fallen (see Table 10 in SI).
The Negative Impact on GDP and Employment
| Scenarios | GDP change(‱) | Income change of employee (‱) | Change of number of employed persons (10 thousand person) |
|---|---|---|---|
| ULT | 1555.6 | 1683.7 | 10776.0 |
| UL-MLT | 925.9 | 974.8 | 6330.2 |
| B1-MLT | 607.7 | 613.8 | 4460.2 |
| B2-MLT | 264.8 | 255.0 | 1301.8 |
| B3-MLT | 571.4 | 570.4 | 4525.4 |
| CE1 | 30.1 | 35.6 | 194.2 |
| CE2 | 15.4 | 14.8 | 81.1 |
| CE3 | 39.3 | 38.5 | 279.0 |
| CP1 | 8.1 | 9.0 | 55.7 |
| CP2 | 4.2 | 4.1 | 23.4 |
| CP3 | 12.0 | 11.7 | 88.3 |
Under the MLT scenario, enterprises are still adjusting and restructuring resources, some industries with comparative advantages would develop with priority, and the competitiveness of other industries would also gradually improve. At this time, the biggest impact of India’s undertaking of China’s industrial transfer on China’s economy would be a 9.3 percentage point decline in GDP, a 9.7% decrease in employment income, and a 63.3 million (8.6%) decrease in employment. Similar to the ultra-long-term scenario, not only the number of jobs will be affected, but the living standards of employees will also decline significantly. The impact of the transfer of different advantageous industries on China’s economy varies. Among them, the B1- MLT scenario has the greatest impact on China’s economy, followed by the B3-MLT scenario, and the impact of B2-MLT scenario is the smallest.
Under the SLT scenario, it is difficult for enterprises and economies to make large-scale adjustments and transfers, and more advantageous industries will be prioritized for transfer. In addition, short-term industrial transfer is not necessarily based entirely on economic considerations, but also involves multi-faceted trade-offs and strategic layouts.
From the breakdown of the sources of shock (see Table 11 in SI), the trade caused by intermediate goods under the ULT, MLT, SLT scenarios is about 70%, 60% and 50%, respectively. The impact of the final product transfer on the number of employed people is higher than the impact on GDP and the income of the employed. Specifically, the impact of intermediate goods transfer on employment is reflected in the number of employed persons and the income of employees, while the impact of final goods on employment is mainly reflected in the number of employed persons in the long run, and in the short and medium term, it is reflected in the number of employed persons and the income of employees.
3.2 The Impact of India’s Undertaking of China’s Industrial Transfer on China’s Economy: Results by Industry
When analyzing the impact of India’s undertaking of China’s industrial transfer on China’s economy, the impact of different industries is significantly different. Over time, the economic impact of industrial transfer within the same industry will also change. In the manufacturing industry, industries with different R&D intensities show significant differences. To this end, we further examine the impact of the transfer of subdivided manufacturing on China’s economy.
3.2.1 The Impact of Industrial Transfer of Manufacturing with Different R&D Intensities
Considering that the performance of sub-sectors is mainly related to their factor density and other characteristics, we classify 17 manufacturing industries according to the OECD technology density classification. The added value of low, low-and-medium, medium-and-high and high R&D intensity manufacturing accounted for 7.35%, 8.60%, 8.40% and 3.55% of China’s GDP, respectively, and the number of employed people accounted for 4.61%, 3.90%, 6.27% and 2.19% of China’s employment, respectively.
(1) Manufacturing industries with different R&D intensity: short- and medium-term impacts.
As shown in Table 6, there are significant differences in the impact of industrial transfer of manufacturing with different R&D intensities on China’s economy in the short to medium term. The transfer of high-R&D-intensive manufacturing may have a lower impact on the economy, while the transfer of medium-to-high-R&D-intensive manufacturing may have a greater negative impact on China’s economic growth and employment. Under the CE scenario (i.e., China’s demand for its own products is not replaced by India), the industrial transfer of manufacturing with medium and high R&D intensity has the most significant impact on China’s economy. The transfer in these industries would lead to 3.14% reduction in China’s GDP, 3.97% decline in the income of overall employees, and a 1.91 million decrease in employment. The impact of the inclustrial transfer of the low-and medium-R&D-intensive manufacturing industry comes next, which mainly comes from intermediate goods trade. The impact of low-R&D intensity manufacturing on China’s employment is secondary, but more of it comes from trade in final goods. In contrast, the industrial transfer in high-R&D- intensive manufacturing would have a smaller impact on China. Under the CP scenario (i.e., only the United States, Japan, India, and Australia replace the demand for Chinese products by India), the impact of the transfer in medium- and high-R&D intensity manufacturing on China is still significant, but the overall impact is relatively small. In addition, the impact of the transfer of low-R&D-intensity manufacturing to China’s economy is mainly reflected in the number of employees, while the impact of low-, medium-high- and high-R&D-intensive manufacturing on China’s economy is mainly reflected in economic growth.
Comparison of the Negative Impact of Industrial Transfer out of Manufacturing with Different R&D Intensities in the Short Term on China’s Economy
| Indicators | Manufacturing with low R&D intensity | Manufacturing with low-and-medium R&D intensity | Manufacturing with medium-and-high R&D intensity | Manufacturing with high R&D intensity | |
|---|---|---|---|---|---|
| Value added share in 2020 | 7.35 | 8.60 | 8.40 | 3.55 | |
| Employee share in2020 | 4.61 | 3.90 | 6.27 | 2.19 | |
| CE scenario | |||||
| GDP change (‱) | Due to intermediates | 6.05 | 14.23 | 15.55 | 2.46 |
| Due to final goods | 9.18 | 2.42 | 15.80 | 3.14 | |
| Total | 15.23 | 16.64 | 31.35 | 5.59 | |
| Income change (‱) | Due to intermediates | 6.37 | 15.26 | 18.18 | 2.55 |
| Due to final goods | 8.36 | 2.79 | 21.55 | 3.34 | |
| Total | 14.73 | 18.05 | 39.73 | 5.89 | |
| Employee change | Due to intermediates | 58.30 | 64.37 | 92.26 | 15.77 |
| Due to final goods | 90.42 | 11.40 | 99.03 | 20.63 | |
| Total | 148.72 | 75.77 | 191.29 | 36.39 | |
| CP scenario | |||||
| GDP change (‱) | Due to intermediates | 1.74 | 3.36 | 4.20 | 0.59 |
| Due to final goods | 3.36 | 0.52 | 4.92 | 1.40 | |
| Total | 5.09 | 3.88 | 9.13 | 2.00 | |
| Income change (‱) | Due to intermediates | 1.98 | 3.66 | 4.90 | 0.64 |
| Due to final goods | 3.04 | 0.64 | 6.14 | 1.50 | |
| Total | 5.02 | 4.30 | 11.04 | 2.14 | |
| Employee change | Due to intermediates | 16.78 | 16.44 | 25.34 | 3.95 |
| Due to final goods | 32.87 | 2.70 | 31.84 | 9.27 | |
| Total | 49.65 | 19.14 | 57.18 | 13.22 | |
Note: Income change indicates the income change of employees. Employee change indicates the change of number of employed persons (unit: 10 thousand persons).
(2) Manufacturing industries with different R&D intensity: medium- and long-term impacts
In the medium to long term (see Table 7), the transfer of manufacturing with low- and medium-R&D intensity has the most significant impact on China’s economy. The transfer of these industries would lead to a decrease in China’s GDP by about 295.29‰, a decrease in the income of overall employees by 368.68‰, and a decrease in the number of employed people by 15.28 million. The industrial transfer impact of manufacturing industry with low R&D intensity is the second. The impact of the transfer of low, medium-and-low R&D intensity, which usually relies on a large number of low-skilled labor, is mainly reflected in employment. The impact of the transfer of manufacturing with medium-high and high R&D intensity is small, but still significant. These industries tend to be more technology-intensive and have higher added value, and their transfer may pose challenges to China’s technological innovation and industrial upgrading. In addition, the impact of the transfer of manufacturing with low- and high-R&D intensity on China’s economy is mainly reflected in the problem of unemployment, while the impact of the transfer of manufacturing with medium-low and medium-high R&D intensity is mainly reflected in economic growth.
Comparison of the Negative Impact of Industrial Transfer out of Manufacturing With Different R&D Intensities in the Ultra-Long and Medium-Long Term on China’s Economy
| Indicators | Manufacturing with low R&D intensity | Manufacturing with low-and-medium R&D intensity | Manufacturing with medium-and-high R&D intensity | Manufacturing with high R&D intensity | |
|---|---|---|---|---|---|
| Medium- and long-term impact | |||||
| GDP change (‱) | Due to intermediates | 177.56 | 357.68 | 161.81 | 30.95 |
| Due to final goods | 117.75 | 11.02 | 105.30 | 14.59 | |
| Total | 295.29 | 368.68 | 267.11 | 45.54 | |
| Income change (‱) | Due to intermediates | 179.63 | 378.65 | 172.35 | 38.73 |
| Due to final goods | 104.97 | 13.63 | 123.73 | 18.22 | |
| Total | 284.62 | 392.28 | 296.07 | 56.94 | |
| Employee change | Due to intermediates | 1864.27 | 1483.60 | 928.87 | 239.53 |
| Due to final goods | 1314.90 | 44.58 | 632.23 | 112.76 | |
| Total | 3179.17 | 1528.18 | 1560.88 | 352.30 | |
| Ultra-long-term impact | |||||
| GDP change (‱) | Due to intermediates | 402.19 | 425.47 | 290.90 | 133.82 |
| Due to final goods | 175.81 | 26.01 | 170.59 | 73.20 | |
| Total | 578.00 | 451.47 | 461.50 | 207.03 | |
| Income change (‱) | Due to intermediates | 460.93 | 458.30 | 316.95 | 135.64 |
| Due to final goods | 158.26 | 30.82 | 203.75 | 73.43 | |
| Total | 619.18 | 489.12 | 520.72 | 209.07 | |
| Employee change | Due to intermediates | 3771.80 | 1860.02 | 1715.95 | 837.08 |
| Due to final goods | 1836.56 | 124.72 | 1054.25 | 453.18 | |
| Total | 5608.44 | 1984.74 | 2770.20 | 1290.26 | |
(3) Manufacturing industries with different R&D intensity: ultra-long-term Impacts
In the ultra-long term, the industrial transfer of manufacturing with low-R&D intensity has the most far-reaching and extensive impact on China’s economy. The transfer of these industries would lead to China’s GDP reduction by 578‰, the overall income of employees decline by 619‰, and employment decrease by 56.08 million. The impact of the industrial transfer of medium- and high-R&D intensive manufacturing is secondary, and its transfer may pose a challenge to China’s technological innovation capability and industrial structure adjustment. The impact of the industrial transfer of manufacturing with high R&D intensity on China’s economy is relatively small, but itis still important, especially in terms of technological innovation and the development of high value-added industries. In addition, the impact of the transfer of low-R&D- intensive manufacturing on China’s economy is mainly reflected in the problem of unemployment, while the impact of low-, medium-high- and high-R&D-intensive manufacturing on China’s economy is mainly reflected in economic growth. It is worth noting that the industrial transfer of high-R&D-intensive manufacturing industries would have a very large negative impact on China’s long-term economy.
3.2.2 The Impact of Industrial Transfer of Different Manufacturing Industries
In the previous section, we compared the impact of industrial transfer of manufacturing with different R&D intensities. Considering that the characteristics of the performance of industries in the same type of R&D intensity are also different, this section analyzes the impact of industrial outward transfer on China’s GDP and employment at the level of each manufacturing industry.
(1) Each manufacturing industry: short- and medium-term impacts
In the short- to medium-term (as shown in Figure 2), under the CE scenario (China’s demand for its own products is not replaced by India), textiles and garments, machinery and equipment, chemical products, electronic equipment and automobile manufacturing are the five industries that have the greatest impact on China’s GDP. The impact of these industries on GDP accounting for 48.44% of the total impacts of all industries. In terms of employment, textiles and garments, food and tobacco, machinery and equipment, electronic equipment and automobile manufacturing are the five industries with the greatest impact, accounting for 55.04% of the total.
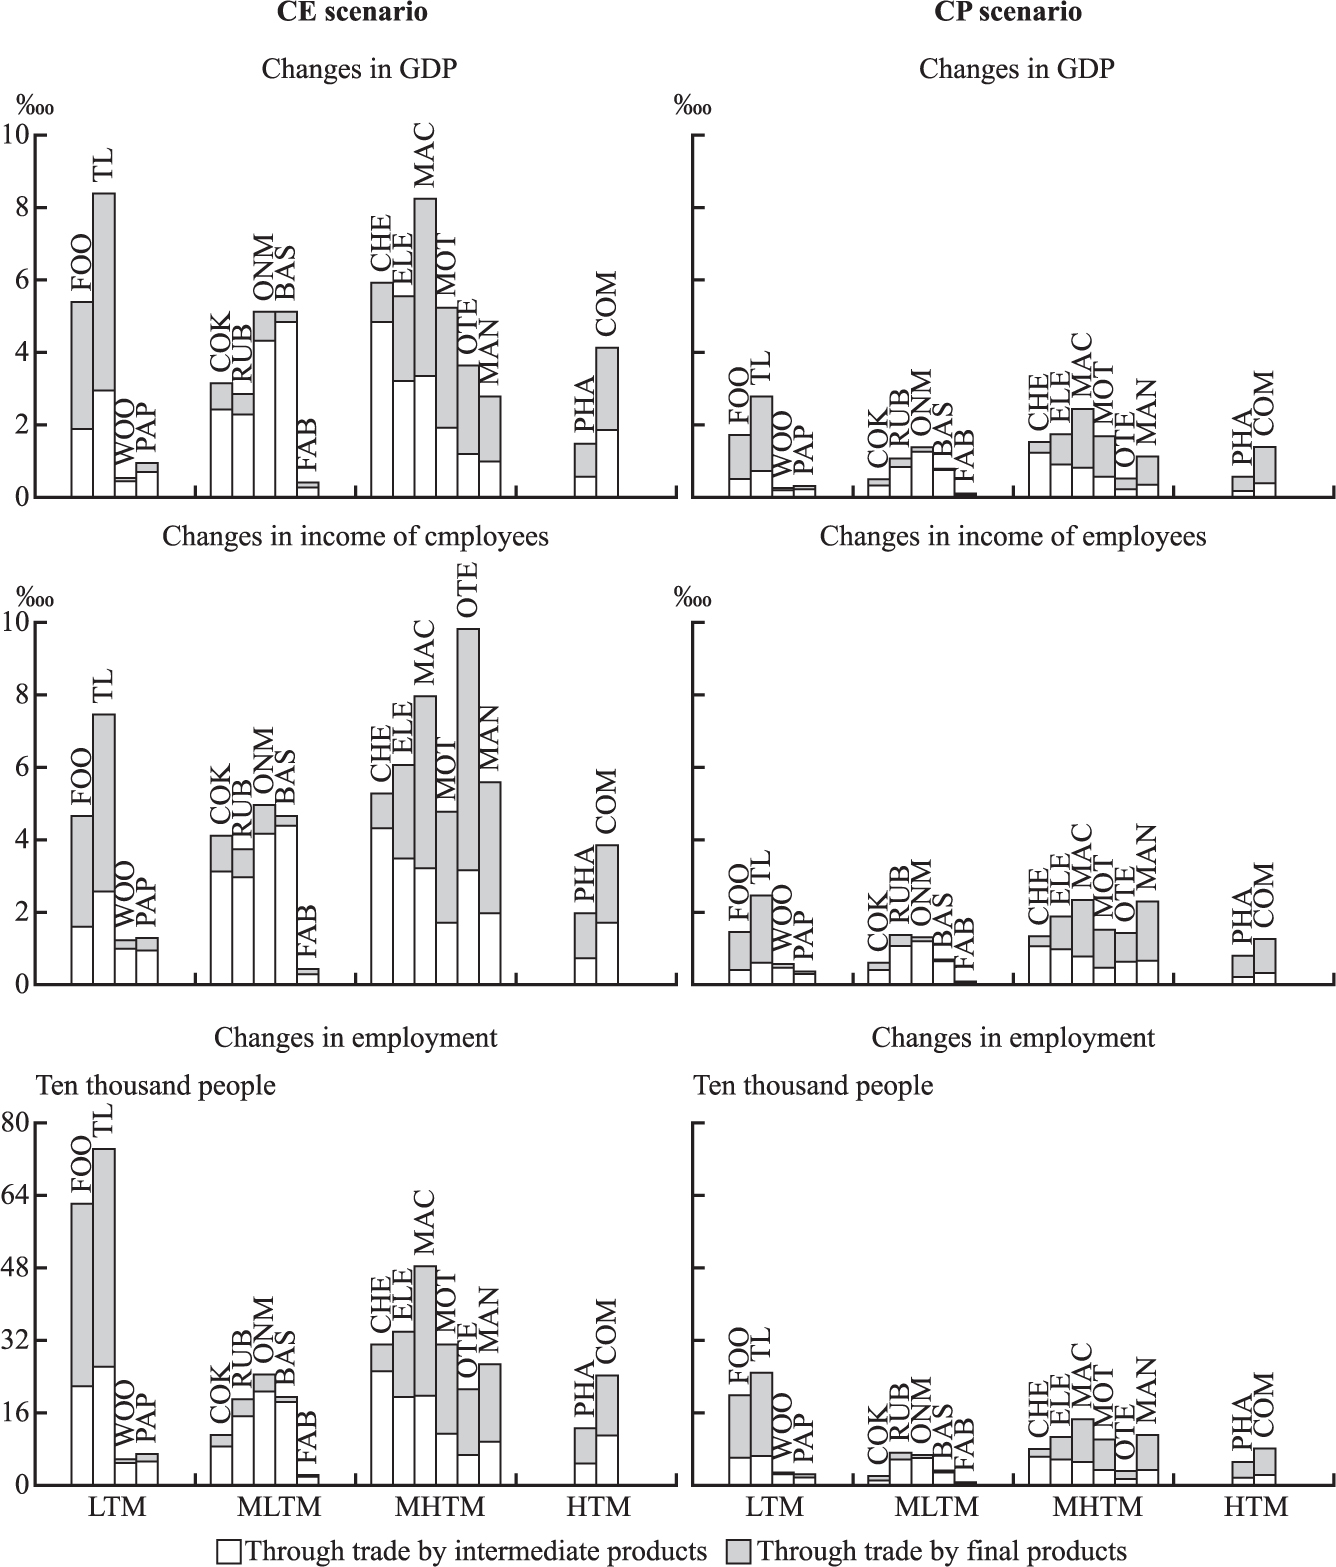
The Impact of Industrial Transfer of Diff erent Industries on China’s Economy in the Short Term
Under the CE scenario, the textile and garment industry has the most significant impact on China’s economy, with its outward transfer leading to a decrease of 0.84‰ in China’s GDP, a decrease of 0.75‰ in the overall income of employees, and a decrease in the number of employed persons by 742,000 (1.01‰). The labor-intensive nature of the textile and garment industry would lead to a particularly significant impact on employment caused by industrial transfer. The transfer of machinery and equipment, electronic equipment and automobile manufacturing would also have an important impact on China’s economy, and these industries usually involve technology-intensive production, and their transfer may bring long-term challenges to the loss of technical talents and the adjustment of industrial structure. Under the CP scenario, the five industries with the greatest impact are textile and garment, machinery and equipment, electronic equipment, food and tobacco, and automobile manufacturing, which mainly belong to the manufacturing industries with low R&D intensity and medium and high R&D intensity, and their impact on GDP accounts for 51.96% of the total impact of all industries.
Overall, the negative impact of the transfer of labor-intensive and technology-intensive industries on China’s economy in the short- to medium-term is particularly significant. For these industries, China needs to formulate effective industrial policies and strategies to promote the optimization and adjustment of the economic structure, while mitigating the impact on China’s economy and achieving sustainable development in the face of global competition.
(2) Each manufacturing industry: medium- and long-term impact
In the medium to long term (Figure 3), the five industries that have the greatest impact on China’s economy are food and tobacco, basic metals, non-metallic minerals, petroleum products, and automobile manufacturing. These industries belong to low-R&D, medium-low-R&D, and medium-high R&D intensity manufacturing, and are mainly capital-intensive. Their impact on GDP accounts for 67.16% of the total impact. At the same time, the five industries that have the greatest impact on China’s employment include food and tobacco, automobile manufacturing, basic metals, non-metallic minerals, and textiles and garments, which account for 67.94% of the total impact on the employment market. Capital-intensive industries have a large demand for fixed asset investment, so their negative impact on China’s economy in the short and medium term is not significant, but in the medium and long term, it has a large negative impact. Among them, the food and tobacco industry has the most significant impact on China’s economy in the medium and long term, and its outward transfer would lead to a 2.16% decrease in China’s GDP, a 1.89% decrease in the overall income of employees, and a decrease in employment of 25.01 million people (3.41%). The impact of this sector on GDP accounted for 22.15% of the total impact of all industries and 37.78% of the impact on employment.
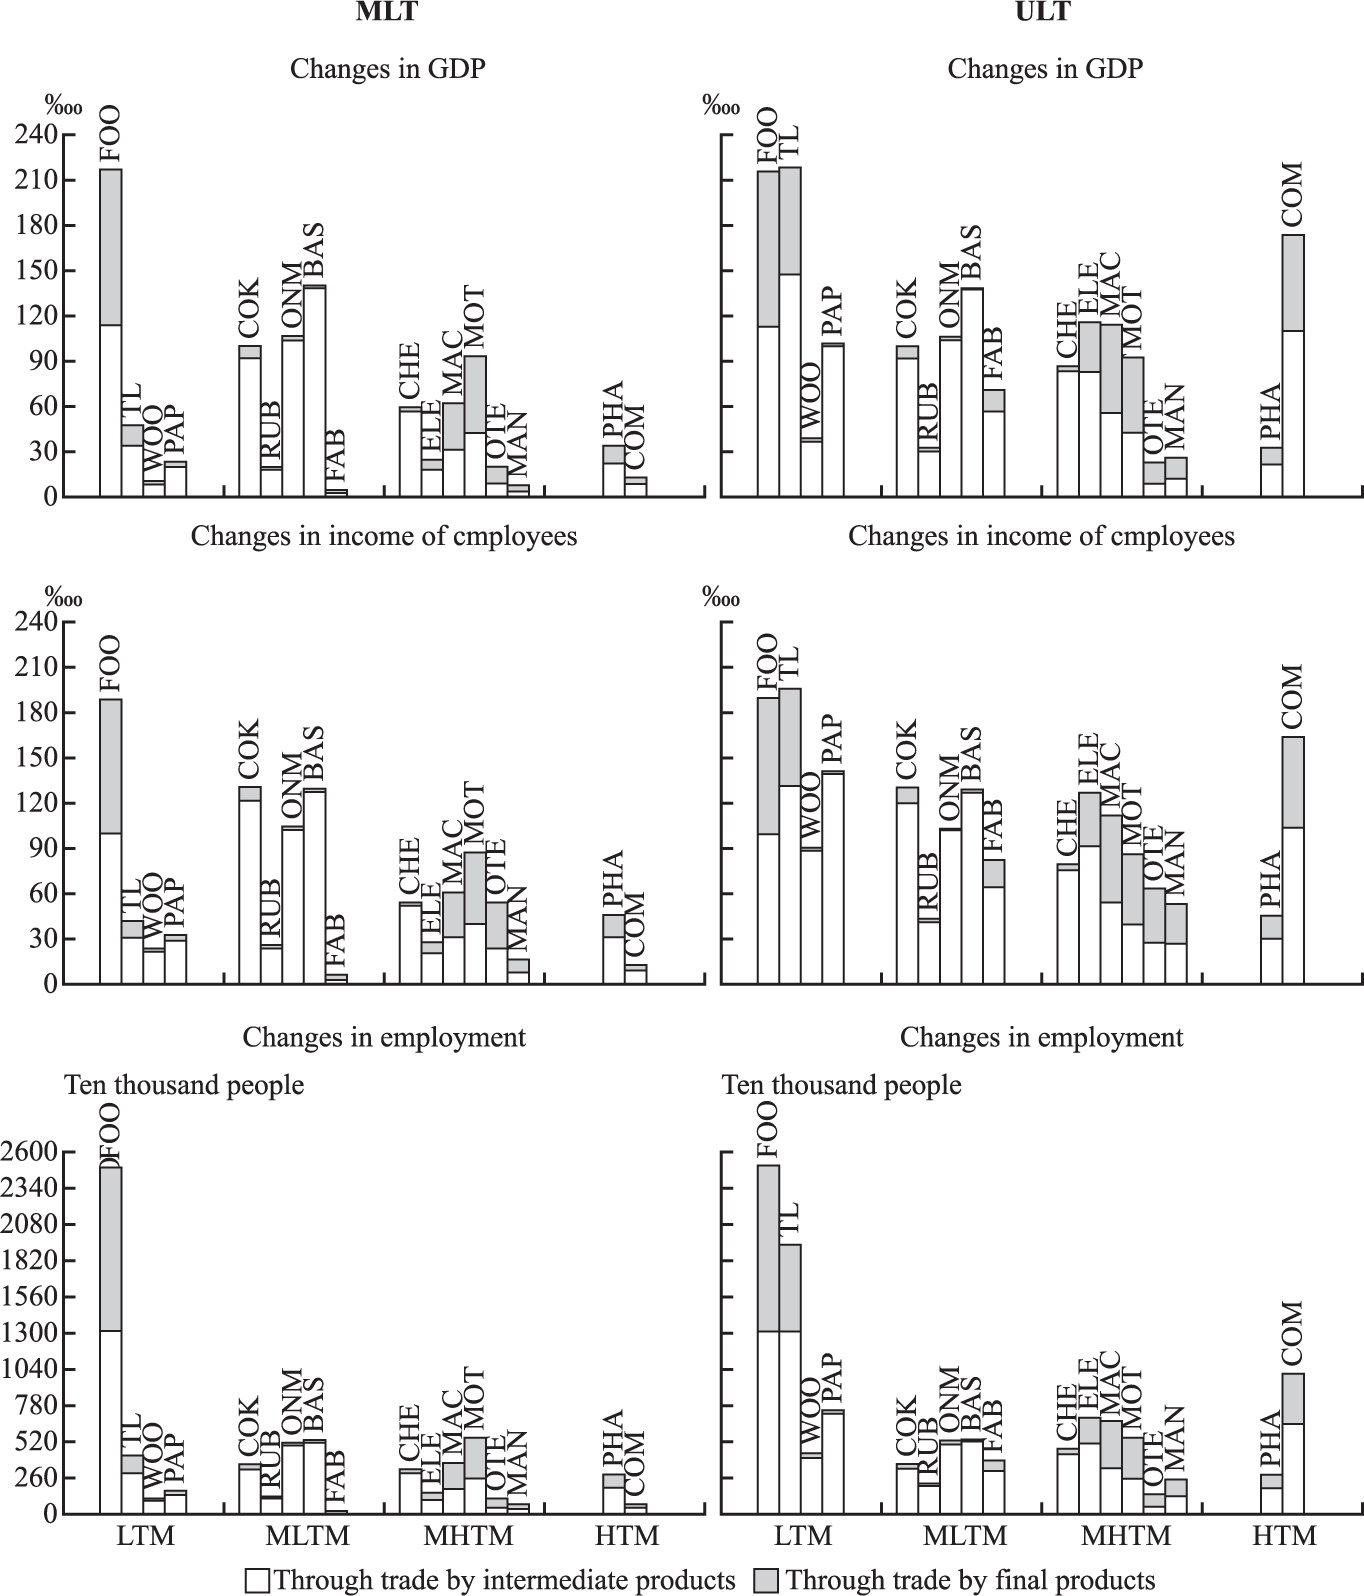
The Impact of Industrial Transfers of Different Industries on China’s Economy in the Medium- and Long-term and Ultra-long-term
(3) Different manufacturing industry: ultra-long-term impact
In the ultra-long term (as shown in Figure 2), the five industries that have the greatest impact on China’s economy are textiles and garments, food and tobacco, electronic equipment, machinery and equipment, and computers. These industries belong to low-R&D-intensity, medium-high-R&D-intensity, and high-R&D-intensity manufacturing, and are mainly characterized by technology-intensive and labor-intensive industries. These five industries account for 49.52% of the total impact on GDP. At the same time, the five industries that have the greatest impact on China’s employment include food and tobacco, textiles and garments, computers, paper and printing, and electronic equipment, which account for 59.15% of the total impact on the job market. In the medium term, the negative impact of industrial transfer of high- R&D intensive industries on China’s economy is not significant, but in the ultra-long term, it has a large negative impact on China’s economy. The outward transfer of industries with high R&D intensity would lead to problems such as technology loss, deterioration of the innovation environment, and vacancies in high value-added industries, which would have a profound impact on the sustainable development of the economy. Among them, the transfer of the electronic equipment industry would lead to a 1.16% decrease in China’s GDP, a 1.27% decrease in the overall income of employees, and a decrease of 7 million people (0.95%) in employment. The outward transfer of the computer industry would lead to a 1.74% decrease in China’s GDP, a 1.64% decrease in the overall income of employees, and a decrease of 10.11 million people (1.38%) in employment.
In summary, the impact of India’s undertaking of China’s industrial transfer on China’s GDP and employment varies in different time dimensions and industries. From an ultra-long-term perspective, the outward transfer of labor-intensive and technology-intensive industries would have the greatest negative impact on China’s economy, and the continuous transfer of these industries may affect domestic consumption capacity and innovation environment, which has an important impact on the longterm development of the economy. China needs to address these challenges through effective industrial policies and strategies to maintain economic competitiveness and sustainable development.
4 Conclusions and Policy Implications
In recent years, the global value chain has dynamically adjusted to adapt to the continuous changes in the geopolitical and economic landscape, and international industrial transfer is one of the consequences of this trend. China’s overseas industrial transfer is not only the result of global capital and technology flows, but also the inevitable choice for the economy to transform into high-quality development. The complex dynamics in this transition process would have an impact on China’s GDP and employment in different time dimensions. This paper constructs an assessment framework for the impact of industrial transfer on the economy of the home country, and uses counterfactual analysis to reveal the far-reaching impact of India’s undertaking of China’s industrial transfer on China’s GDP and employment. The importance of understanding this research question lies not only in the fact that it is directly related to the future direction of economic development in China and India, but also provides important reference and enlightenment for other developing countries in the changing role of the global economy.
We draw the following main conclusions: First, the negative impact of the transfer of Chinese industries to India on China’s GDP and employment is significant. In the ultra-long term, India’s undertaking of China’s industrial transfer will reduce China’s GDP by 15.6%, reduce the overall income of employees by 16.8%, and reduce the employment of 110 million people. The impact in the medium and long term and the short and medium term is also significant. We should be fully aware of the severe challenges brought by China’s industrial transfer to its own economic growth and employment. In addition, the estimates in this paper are based on the current technological structure, and the transfer of technology-intensive industries may lead to a slowdown in domestic technological progress and innovation, and the transfer of labor-intensive industries will reduce the consumption power of low-income groups, thereby increasing the impact on China’s economy. Second, at any time, the transfer of low-R&D-intensity manufacturing represented by labor-intensive industries such as textiles and garments, food and tobacco will have a greater negative impact on China’s economy. China has not yet developed to the point where it can allow a large number of labor-intensive industries to move outward, and we also need to keep an eye on the transfer of technology-intensive industries. Third, the long-term impact of high-R&D- intensive manufacturing on China’s GDP and employment is obvious. In the medium term, the shift in R&D-intensive manufacturing will not have a significant negative impact on China’s economy. However, in the ultra-long term, in addition to the low- R&D-intensity manufacturing industry, the industrial transfer of high-R&D-intensity manufacturing industry will also have a very large negative impact on China’s economy. We need to take precautions against the shift of industries with high R&D intensity. Fourth, the industrial transfer from the southeast coastal region to the inland region can significantly reduce the negative impact on China’s GDP and employment: compared with the B1-MLT scenario, the negative impact on China’s GDP under the B2-ULT scenario can be mitigated by 3.43 percentage points, and the impact on unemployment can be reduced by 31.58 million people.
Based on the results of this paper, we put forward the following three policy suggestions to optimize the layout of China’s productive forces and enhance the safety and stability of the industrial chain.
First, consolidate the foundation of comparative advantage and promote the transfer of labor-intensive industries in a scientific and orderly manner: The low- R&D-intensive manufacturing industry, represented by labor-intensive industries such as textiles and garments, food and tobacco, is still an important carrier of China’s economic development. We should give full play to the advantages of lower labor costs in inland areas such as the central and western regions, and promote the orderly transfer of industries in the country. At the same time, it will also help to tap and release the development potential of inland areas, so as to further consolidate the unique advantages of China’s perfect industrial system and huge market scale at both ends of supply and demand, and enhance the stamina of economic development.
Second, enhance the competitiveness of technology-intensive industries and strengthen the protection of high-tech manufacturing: In order to reduce the negative impact of the transfer of technology-intensive industries on the domestic economy, China should implement an innovation-driven development strategy, increase investment in technology R&D and innovation, and enhance the core competitiveness of domestic industries. By guiding enterprises to strengthen cooperation with international leading enterprises and scientific research institutions, promote technology introduction and independent innovation, establish and improve the intellectual property protection system, and stimulate the innovation vitality of enterprises. From a long-term perspective, high-R&D-intensive manufacturing has a significant impact on China’s economy. The government should introduce relevant policies to encourage the localization of high-tech enterprises, and provide tax incentives, R&D subsidies and other support measures to ensure the development of high-R&D-intensive manufacturing in China. At the same time, we pay attention to cultivating and introducing high-end technical talents and build a complete innovation ecosystem.
Third, take multiple measures to promote regional coordinated development and foreign-related strategic cooperation: In the process of promoting the industrial transfer from the southeast coastal region to the inland region, regional coordination should be strengthened, and the optimization of infrastructure construction and business environment should be promoted to ensure the smooth progress of industrial transfer. The government can set up a special fund to support the infrastructure construction in the central and western regions, improve their ability to undertake industrial transfer, and form a new pattern of coordinated development of the regional economy. In terms of foreign-related strategies, we will strengthen economic and trade cooperation with countries along the “Belt and Road”, promote the signing and implementation of multilateral trade agreements, and ensure the status and competitiveness of Chinese enterprises in the global value chain. In addition, by participating in the formulation of international standards, we will enhance the international discourse and influence of Chinese enterprises, and ensure that they will occupy an active position in the process of reshaping the global industrial chain.
Value in parentheses is the proportion of change in the number of employed persons, the same below.
References
Ando, M., & Kimura, F. (2005). The Formation of International Production and Distribution Networks in East Asia. International Trade in East Asia. Chicago: University of Chicago Press.10.7208/chicago/9780226379005.003.0007Suche in Google Scholar
Autor, D. H., Dorn, D., & Hanson, G. H. (2013). The China Syndrome: Local Labor Market Effects of Import Competition in the United States. American Economic Review, 103(6), 2121–2168.10.1257/aer.103.6.2121Suche in Google Scholar
Baldwin, R., & Freeman, R. (2022). Risks and Global Supply Chains: What We Know and What We Need to Know. Annual Review of Economics, 14, 153–180.10.1146/annurev-economics-051420-113737Suche in Google Scholar
Brakman, S., Garretsen, H., & Van Witteloostuijn, A. (2020). The Turn from Just-in-Time to Just-in-Case Globalization in and after Times of COVID-19: An Essay on the Risk Re-appraisal of Borders and Buffers. Social Sciences & Humanities Open, 2(1), 100034.10.1016/j.ssaho.2020.100034Suche in Google Scholar
Cai, F., Wang, D., & Qu, Y. (2009). Flying Geese within Borders: How China Sustains Its labour-intensive Industries?. Economic Research Journal (Jingji Yanjiu), 44(9), 4–14.Suche in Google Scholar
Carvalho, V. M., Nirei, M., Saito, Y. U., & Tahbaz-Salehi, A. (2021). Supply Chain Disruptions: Evidence from the Great East Japan Earthquake. The Quarterly Journal of Economics, 136(2), 1255–1321.10.1093/qje/qjaa044Suche in Google Scholar
Cheng, D. (2015). China’s Integration into the Global Value Chains: A Transnational Input-output Analysis. Economic Research Journal (Jingji Yanjiu), 50(9), 4–16.Suche in Google Scholar
Dai, H. (2006). International Industrial Relocation and the Development of China’s Manufacturing Industry. Beijing: People’s Publishing House.Suche in Google Scholar
Gao, X., Hewings, G, J,, & Yang, C. (2022). Offshore, Re-shore, Re-offshore: What Happened to Global Manufacturing Location between 2007 and 2014?. Cambridge Journal of Regions, Economy and Society, 15(2), 183–206.10.1093/cjres/rsac004Suche in Google Scholar
Jing, L., & Yuan, P. (2019). New Trends of Global Value Chain Changes and China’s countermeasures. Journal of Management World (Guanli Shijie), 35(11), 72–79.Suche in Google Scholar
Kruse, H., Timmer, M. P., De Vries, G. J., & Ye, X. (2023). Export Diversification from an Activity Perspective: An Exploration Using Occupation Data. Washington D C: The World Bank.Suche in Google Scholar
Lemoine, F., & Ünal-Kesenci, D. (2004). Assembly Trade and Technology Transfer: The Case of China. World Development, 32(5), 829–850.10.1016/j.worlddev.2004.01.001Suche in Google Scholar
Li, H., Li, L., Wu, B., & Xiong, Y. (2012). The End of Cheap Chinese Labor. Journal of Economic Perspectives, 26(4), 57–74.10.1257/jep.26.4.57Suche in Google Scholar
Li, S., He, J., Zhu, K., Zhang, Z., Pan, C., et al. (2023). China’s Multi-Regional Input-output Model: 1987–2017. Beijing: Economic Science Press.Suche in Google Scholar
Li, Y., Liu, X., & Yang, L. (2016). Foreign Investment Divestment: Motivation and Influence Mechanism: An Empirical Analysis Based on a Questionnaire Survey in 10 Eastern Coastal Cities. Journal of Management World (Guanli Shijie), (4), 37–51.Suche in Google Scholar
Los, B., Timmer, M. P., & De Vries, G. J. (2016). Tracing Value-added and Double Counting in Gross Exports: Comment. American Economic Review, 106(7), 1958–1966.10.1257/aer.20140883Suche in Google Scholar
Luo, C., & Si, C. (2020). Determinants of Foreign Divestment: Evidence from Chinese Industrial Enterprises. The Journal of World Economy (Shijie Jingji), 43(8), 26–53.Suche in Google Scholar
Ma, H., Qiao, X., & Xu, Y. (2013). Job Creation and Destruction in China’s Manufacturing Sector. Economic Research Journal (Jingji Yanjiu), 48(12), 68–80.Suche in Google Scholar
Meng, J., Mi, Z., Guan, D., Li, J., Tao, S., et al. (2018). The Rise of South-South Trade and Its Effect on Global CO2 Emissions. Nature Communications, 9(1), 1871.10.1038/s41467-018-04337-ySuche in Google Scholar
Ni, H., & Tian, Y. (2023). The Dynamic Changes of China’s Economic Double Cycle and International Comparison — A New Framework of Global Value Chain Decomposition with Factor Ownership. China Economic Quarterly (Jingjixue Jikan), 23(5), 1668–1685.Suche in Google Scholar
Pan, W., & Li, G. (2018). National Value Chain and Global Value Chain in Chinese Regions: Regional Interaction and Value-added Gains. Economic Research Journal (Jingji Yanjiu), 53(3), 171–186.Suche in Google Scholar
Rodrik, D. (2006). Goodbye Washington Consensus, Hello Washington Confusion? A Review of the World Bank’s Economic Growth in the 1990s: Learning from a Decade of Reform. Journal of Economic literature, 44(4), 973–987.10.1257/jel.44.4.973Suche in Google Scholar
Shan, J. (2002). A VAR Approach to the Economics of FDI in China. Applied Economics, 34(7), 885–893.10.1080/00036840110058941Suche in Google Scholar
Solow, R. M. (1956). A Contribution to the Theory of Economic Growth. The Quarterly Journal of Economics, 70(1), 65–94.10.2307/1884513Suche in Google Scholar
Tang, Y., & Zhang, P. (2018). Research on the Position and Changing Mechanism of Chinese Enterprises’ Embedding in Global Production Chain. Journal of Management World (Guanli Shijie), 34(5), 28–46.Suche in Google Scholar
Timmer, M. P., Los, B., Stehrer, R., & De Vries, G. J. (2021). Supply Chain Fragmentation and the Global Trade Elasticity: A New Accounting Framework. IMF Economic Review, 69(4), 1–25.10.1057/s41308-021-00134-8Suche in Google Scholar
Upward, R., Wang, Z., & Zheng, J. (2013). Weighing China’s Export Basket: The Domestic Content and Technology Intensity of Chinese Exports. Journal of Comparative Economics, 41(2), 527–543.10.1016/j.jce.2012.07.004Suche in Google Scholar
Wang, Z., Wei, S., Yu, X., & Zhu, K. (2017). Measures of Participation in Global Value Chains and Global Business Cycles (No. w23222). Cambridge: National Bureau of Economic Research Working Paper.10.3386/w23222Suche in Google Scholar
Xu, Y., & Dietzenbacher, E. (2014). A Structural Decomposition Analysis of the Emissions Embodied in Trade. Ecological Economics, 101, 10–20.10.1016/j.ecolecon.2014.02.015Suche in Google Scholar
Yan, B., & Tian, K. (2020). The Impact Analysis of Industrial Relocation on China’s GDP and Employment: From the Perspective of Global Value Chain. China Industrial Economics (Zhongguo Gongye Jingji), (12), 121–139.Suche in Google Scholar
Yang, C., Tian, K., Gao, X., & Zhang, J. (2020). A Review and Prospect of Research into Global Value Chain. Systems Engineering - Theory & Practice (Xitong Gongcheng Lilun yu Shijian), 40(8), 1961–1976.Suche in Google Scholar
Yin, J., Gao, X., & Yang, C. (2024). A Quantitative Model of International Industry Relocation Distinguishing Between Domestic and Foreign Enterprises and Its Empirical Study of China. Systems Engineering - Theory & Practice (Xitong Gongcheng Lilun yu Shijian), 44(5), 1421–1436.Suche in Google Scholar
Zhang, S., & Gu, C. (2019). China-Germany Industrial Cooperation in the Context of the Belt and Road Initiative — An Analysis Focusing on Shandong Province. Social Sciences in China (Zhongguo Shehui Kexue), (8), 44–57.Suche in Google Scholar
Zhang, S., & Liu, Z. (2009). Industry Transference of GVC Mode — Force, Influence and Inspiration for China’s Industrial Upgrading and Balanced Development of Areas. China Industrial Economics (Zhongguo Gongye Jingji), (11), 5–15.Suche in Google Scholar
Zhang, X., Gao, X., & Yang, C. (2024). Analysis of India’s Prospects in Undertaking Industry Relocation Amidst the Restructuring of Global Value Chains. China Journal of Econometrics (Jiliang Jingji Xuebao), (1), 58–87.Suche in Google Scholar
Zhu, K., Yu, X., Wei, S., & Wang, Z. (2022). MNEs’ Activities Measurements and Value-added Tracing in GVCs. Economic Research Journal (Jingji Yanjiu), (4), 136–154.Suche in Google Scholar
© 2024 Xiaoxu Zhang, Kunfu Zhu, Shouyang Wang, Published by De Gruyter
This work is licensed under the Creative Commons Attribution 4.0 International License.
Artikel in diesem Heft
- Frontmatter
- Column: China’s Economic Development
- China’s Dual Structure-Based Growth Accounting—Theoretical and Empirical Analysis of Introducing the Labor Employment Rate
- The Growth Contribution of China’s Regional Coordinated Development Strategy—On the Dispute of Regional Policy Paths
- New Production Relations Driven by New Quality Productive Forces: Trends, Challenges and Countermeasures
- The Theoretical Gap in the Study of New Quality Productive Forces and the Economic Analytical Perspective of “Heterogeneity”
- The Impact of Manufacturing Transfer from China to India on China’s GDP and Employment
- Functional Upgrading of Value Chains and the Carbon Emissions Reduction Embodied in China’s Exports: From the Perspective of the Improvement in the FDI Quality