
Combination of edge enhancement and cold diffusion model for low dose CT image denoising
-
Yinglin Du

 ,
Pengcheng Zhang
,
Pengcheng Zhang

Abstract
Objectives
Since the quality of low dose CT (LDCT) images is often severely affected by noise and artifacts, it is very important to maintain high quality CT images while effectively reducing the radiation dose.
Methods
In recent years, the representation of diffusion models to produce high quality images and stable trainability has attracted wide attention. With the extension of the cold diffusion model to the classical diffusion model, its application has greater flexibility. Inspired by the cold diffusion model, we proposes a low dose CT image denoising method, called CECDM, based on the combination of edge enhancement and cold diffusion model. The LDCT image is taken as the end point (forward) of the diffusion process and the starting point (reverse) of the sampling process. Improved sobel operator and Convolution Block Attention Module are added to the network, and compound loss function is adopted.
Results
The experimental results show that CECDM can effectively remove noise and artifacts from LDCT images while the inference time of a single image is reduced to 0.41 s.
Conclusions
Compared with the existing LDCT image post-processing methods, CECDM has a significant improvement in all indexes.
Introduction
CT imaging is widely used in clinical examination and treatment. However, with the wide application of CT, more and more attention has been paid to its potential threat to the health of the subject. As a kind of ionizing radiation, X-ray may cause human gene damage and induce cancer, and this probability increases with the radiation dose [1].
Low-Dose CT (LDCT) reduces the damage to the subject’s body by reducing the radiation intensity of X-rays, while reducing the X-ray radiation dose will lead to the reduction of CT image quality, non-stationary fringe artifacts and increased noise [2]. The loss of important details such as potential lesion information in CT images will affect the outcome of clinical diagnosis. Therefore, the purpose of LDCT image denoising is to accurately analyze the noise area and small structure texture under low radiation dose. While efficiently denoising the noise area, the image structure and texture details are preserved as much as possible, so as to obtain CT images with similar quality to that of normal dose CT.
Over the past few decades, researchers have proposed a number of LDCT image denoising methods, which can be roughly divided into three categories: projection domain pre-processing algorithm, image domain reconstruction algorithm and image domain post-processing algorithm, the development of the first two methods are limited by the difficulty in obtaining projection data and the high calculation cost. Image domain post-processing method directly processes reconstructed images, gets rid of the dependence on projection data and scanning equipment, is convenient, simple and has outstanding effects, so it has been widely studied.
Traditional image post-processing methods include NLM [3], BM3D [4] and so on. Ma et al. [5] used the information redundancy in the previous normal dose scan to calculate the non-local weight of LDCT image denoising based on the non-local mean (NLM). Sheng et al. proposed a low dose CT image denoising algorithm based on block matching 3D (BM3D), which enhanced the visual saliency of soft tissue by using the saliency map obtained from residual texture information after BM3D denoising [6].
The LDCT artifact suppression method proposed by Chen et al. [7] based on large-scale neighborhood non-local mean filtering takes into account the similarity of pixel structures in large-scale windows, and has good artifact suppression effect. Wang et al. [8] proposed a novel anisotropic fourth-order diffusion (NAFOD) model, which overcomes the shortcomings of AFOD [9] model, which produces blocky effect and ignores texture and detail protection. In addition, there are many explorations of LDCT image noise reduction in transform domain. For example, LDCT image denoising algorithm based on multi-scale singularity detection [10], 3D block matching filtering algorithm [4] which improves NLM method in wavelet domain, and methods based on sparse representation and dictionary learning [11] are also research hotspots in LDCT image denoising field in recent years. Traditional denoising methods can significantly improve the quality of LDCT images, but the principle of the algorithm relies too much on manual design, which is difficult to adjust flexibly, and its performance has great limitations. During denoising, there are problems of excessive smoothness and residue, and the texture and information of CT images cannot be well preserved.
In recent years, with the development of deep learning technology, LDCT denoising method based on deep learning has been widely used because of its strong feature learning ability, wide adaptability and high execution speed. More and more studies have explored the role of convolutional neural networks (CNNS) in LDCT image processing. Chen et al. [12] proposed a de-noising network RED-CNN, which combines the structure of ResNet and Autoencoder, and optimized the network to denoise LDCT images by minimizing the pixel loss between denoising and normal dose CT (NDCT) images. Fan et al. [13] replace the convolutional layer and deconvolution layer with Quadratic filters, and construct the encoder-decoder structure with quadratic neurons, called Quadratic autoencoder (QAE), which improves the model efficiency of LDCT denoising. In [14], Liang et al. proposed EDCNN based on edge enhancement and dense connectivity. Benefit from the trainable sobel convolution, the quality of CT images processed by EDCNN is significantly improved. Shan et al. [15] introduced a Modular Adaptive Processing Neural Network (MAP-NN) for LDCT imaging based on progressive denoising, which introduces the Sobel filtering difference between the real image and the estimated image to measure the edge incoherence, which induces the generated denoised image to retain more texture information, reduce the noise and enhance the edges. Although these methods have excellent denoising performance, they often result in excessive smoothing of the image, and to mitigate this problem, some methods use generative adduction networks (GANs) to retain more texture and detail as close as possible to the NDCT image [16]. For example, Yang et al. combined Wasserstein GAN and perceptual loss (WGAN-VGG) to produce a more realistic denoised image [17]. However, due to the adversarial nature of GANs, they are often difficult to train and require careful design optimization and network architecture to ensure convergence. Li et al. [18] proposed a low-dose CT denoising method based on multi-scale feature fusion network (MSFLNet), which combines features of context information from multiple scales while maintaining spatial details of denoised CT images. Wang et al. [19] proposed the first Convolution free Token2Token Dilated Vision Transformer (CTformer) for LDCT denoising. By extending and moving the feature map, the information interaction in a longer range is obtained, and the overlap inference mechanism is introduced to effectively eliminate the common boundary artifacts in the codec model. Kang et al. proposed FSformer model [20], which combines the local information extracted by CNN with the global information extracted by Transformer, complements the high and low frequency information, better simulates the global, regional and local range dependence of capture, and effectively reduces LDCT image noise. Yan et al. [21] combined convolutional dictionary learning with convolutional neural networks (CNN) to propose a transfer learning dense connected convolutional dictionary learning (TLD-CDL) framework, which improved the quality of CT images with complex noise and artifacts.
In 2020, Jonathan Ho et al. first proposed Denoising Diffusion Probabilistic Models (DDPM) [22], which has received widespread attention for its excellent image generation performance. Diffusion model has great potential in improving the imaging performance of LDCT. However, the biggest problem of diffusion model-based techniques is the high computational effort and long inference time, so most of the previous work has focused on accelerating the reverse process and improving its sampling speed. Based on [22], Xia et al. used a fast ordinary differential equation solver (ODE) to accelerate DDPM for LDCT image denoising, requiring only 50 sampling steps [23]. Liu et al. [24] developed a low-dose CT image denoising algorithm Dn-Dp based on diffusion priors. In the reverse process of diffusion model, multiple MAP estimation problems were iteratively solved, but the network memory consumption was large, and it took 10.11 s to process single LDCT image of 256 × 256. The problem of long inference time of diffusion model has not been improved significantly. Qi et al. proposed a context error modulated generalized diffusion model, called CoreDiff [25], and designed a one-time learning framework, which can make the trained model adapt to the new dose level quickly and easily. Unlike the traditional diffusion model, the inference time is too long and only 10 sampling steps are required. Although CoreDiff has greatly improved the application speed of the diffusion model, it still needs to be improved in the preservation of image edges, textures and other details.
Inspired by the cold diffusion model [26], we propose a low dose CT image denoising method, called CECDM, based on the combination of edge enhancement and cold diffusion model. NDCT image is taken as the starting point of the diffusion process, LDCT image is taken as the diffusion end point, and edge enhancement is further optimized on the basis of the network architecture proposed in CoreDiff. While ensuring the application speed of diffusion model, focusing on the performance of LDCT image denoising makes the image have better denoising effect while retaining more texture details.
In general, the contributions of this paper can be summarized as follows:
The cold diffusion model is used in low-dose CT image denoising tasks, which only requires 10 sampling steps compared with the classical diffusion model, thus increasing the application speed.
Improved sobel operator and CBAM convolutional attention module are added to the network framework of the recovery network, which enables the model to extract edge information more accurately, overcome the smoothing problem of the denoised image, enhance the texture details of the image, and improve the visual quality.
The compound loss of MSE+Charbonnier loss is introduced to train the recovery network, improve the generalization ability of the model, enrich the depth features in the network, and improve the model performance.
The overall structure of this paper can be summarized as follows: in Section “Introduction”, we focus on the current state of research on LDCT denosing; in Section “Related work”, we describe the basic principles and related work of the diffusion model involved in the introduction; in Section “The proposed CECDM”, we introduce the complex loss function of CECDM network structure, module design and network optimization in detail; and in Section “Experiments and results”, the experimental configuration and corresponding experimental results and analysis are given; we make some concluding statements and future directions in Section “Conclusion and discussion”.
Related work
Denoising diffusion probabilistic models (DDPM)
DDPM refers to a generation model that learns target data distribution from samples [22]. DDPM consists of two Markov processes: a fixed forward process and a learning-based reverse process, as shown in Figure 1.
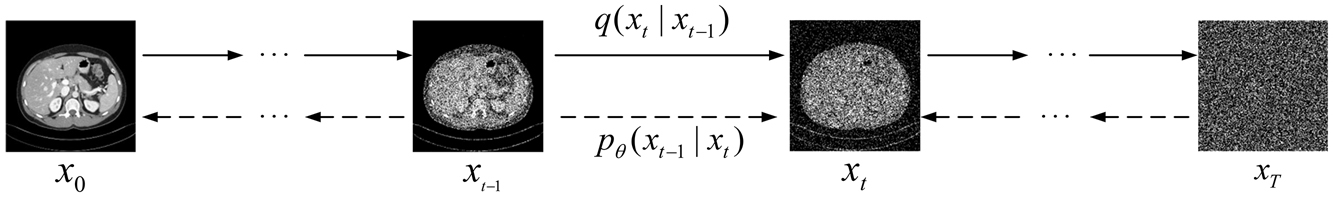
Diagram of denoising diffusion probabilistic models. The Markov chain of forward (reverse) diffusion process of generating a sample by slowly adding (removing) noise.
Forward process: Starting from a sample x0∼q(x0) of a clean image, Gaussian noise is gradually added according to the following probability:
Type of
where
Reverse process: Since the inverse procedure q(xt−1|x t ) depends on the entire data distribution and is difficult to handle, a neural network can be used to learn the parameterized Gaussian probability p θ (xt−1|x t ), as follows:
where
In the reverse process, x t in equation (5) can be replaced by (2) to obtain the relation of xt-1 represented by x0 and noise, which can also be interpreted as that each step of reverse sampling actually predicts the initial image. Then the noise map in the current state is linearly superimposed on the predicted image, resulting in a new image that serves as the image for the next iteration.
Cold diffusion
The cold diffusion model is a generalized diffusion model that extends the diffusion and sampling of Gaussian noise to any type of degradation, such as adding various types of noise, blurring, downsampling, etc. Specifically, given an image x0 from the training data distribution Q, the image x0 (cold state) is gradually degraded to an image x T sampled from a random initial distribution P (hot state) using a specific degradation operator D(·), such as a Gaussian distribution where T is the total number of time steps of diffusion. Then, the image x t of any time step t in the diffusion process is defined as x t =D(x0,x t ,t), where t corresponds to the degree of degradation, and for any t, the operator D(·) should be continuous.
In LDCT image denoising, the NDCT image is taken as the starting point x0 and the LDCT image is used as the end point of the diffusion process which is x T . The degradation operator D(·) is introduced to ensure that the middle image x t of the diffusion process maintains the same expectation as x0, without introducing additional CT number shift, which is defined as follows [25]:
where x T is a random noise with a known distribution and α t <αt-1, ∀1≤t≤T.
In the reverse process, x T is first sampled from P, and then the diffusion process is reversed using the recovery operator R(·), which can be expressed as:
In practice, R(·) is a neural network parameterized to θ, which can be optimized by the following objective functions:
It is worth noting that for any t, R
θ
(·) can directly generate the recovered image
In order to solve this problem, the cold diffusion model follows the annealing sampling algorithm in the classical diffusion model, adopts the “restoration-redegradation” sampling algorithm, and gradually generates the image through T sampling steps. From the predicted value
Although this iterative sampling algorithm can produce a sharper image than the single step prediction, the prediction error between x0 and
where
Convolutional block attention module
As shown in the lower left corner of Figure 2, CBAM [27] is a convolutional block attention module that combines channel and spatial. Given an input feature, CBAM can derive the attention graph along two independent dimensions, channel dimension and space dimension respectively, and then multiply the attention graph with the input feature for adaptive feature thinning.
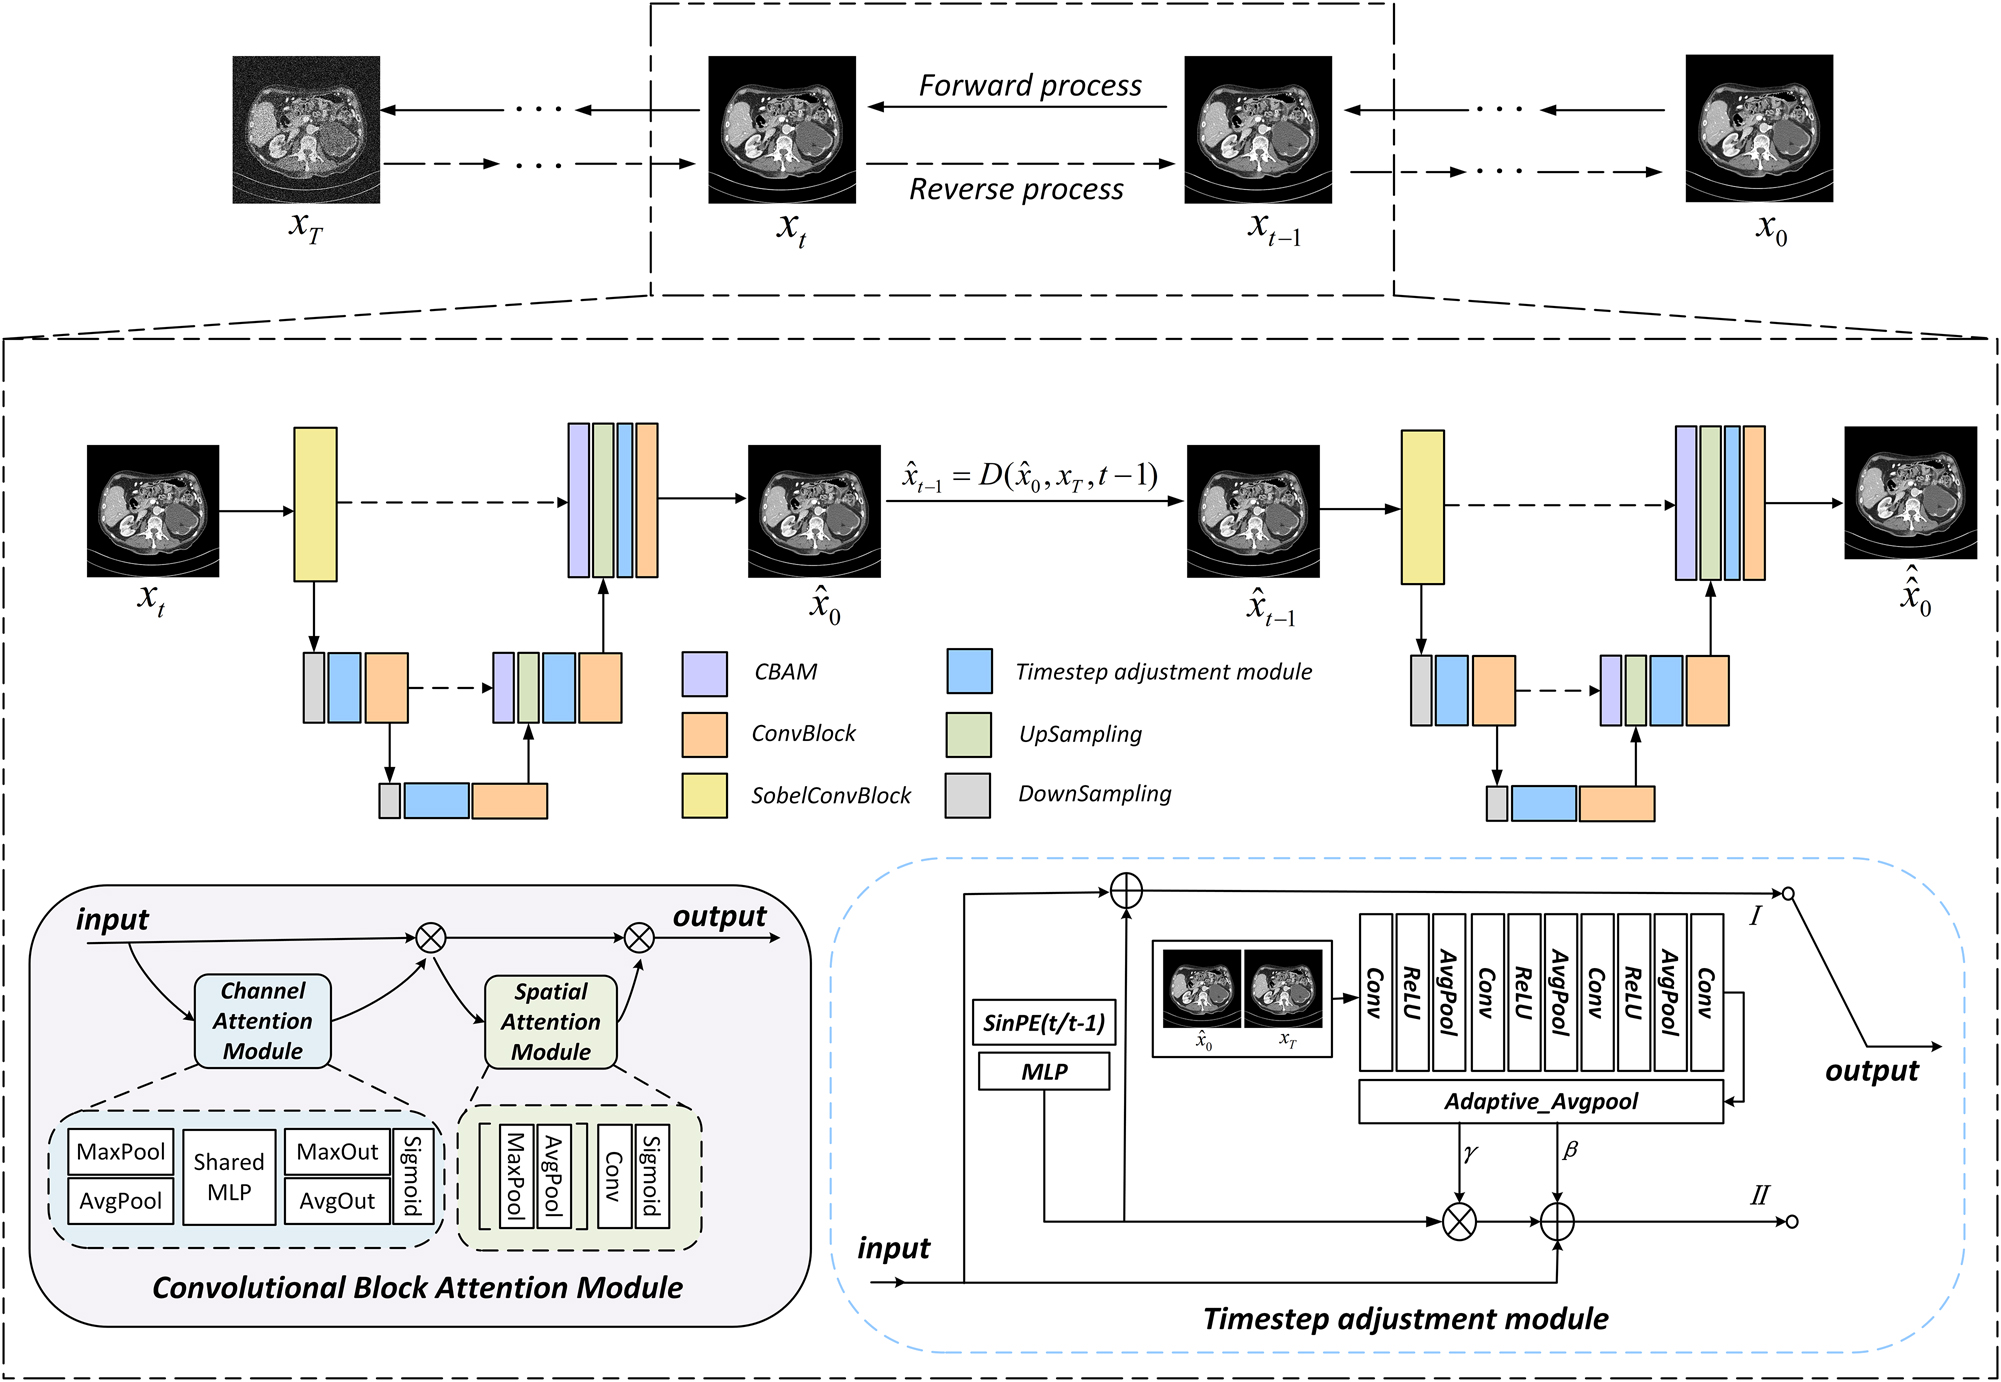
Overall architecture of CECDM network. The lower left corner is the CBAM module, and the lower right corner is timestep adjustment module.
In terms of channel attention (the blue part in Figure 2), the spatial dimension of the input image graph was compressed, the channel attention was calculated, and then aggregated. Two descriptors were obtained by means of average pooling and maximum pooling. These descriptors are forwarded to a three-layer shared multilayer perceptron (MLP) to generate a attention map. The inputs for each MLP are then summed by unit and the channel attention is calculated using the sigmoid function.
Spatial feature relationships are then used to supplement channel attention (green in Figure 2). Spatial attention is focused on the information part by applying average pooling and maximum pooling channel calculations and then concatenating the two to get a single feature descriptor. In addition, convolutional layers are used on the connected feature descriptors to generate spatial attention graphs, which are encoded to emphasize or suppress. The channel information of feature graph is aggregated by average pooling feature and maximum pooling feature, and then convolution and convolution are performed to generate two-dimensional spatial attention maps.
The proposed CECDM
Network architecture
The overall structure of the CECDM network proposed in this paper is shown in Figure 2. Each timestep in the training process is divided into two stages, the left is the first stage in the training process, the right is the second stage, the two parts of the network composition is the same. In the first stage, the input image x
t
estimates x0 through the recovery network R
θ
(·), which is equivalent to one-step prediction of x0. In the second stage,
The whole recovery network R θ (·) adopts UNet network framework. The input images are first processed by 3 × 3 sobel convolution module, then average pooling undersampling and TAM module in corresponding stage, and finally output by a combination of 3 × 3 Conv and ReLU, which is introduced into CBAM module before upsampling. The CA module uses average pooling and maximum pooling to compress the spatial dimension of the feature map and retain more texture information of LDCT image. The SA module supplements the CA mechanism and reduces the number of channels to one through the dimensionality reduction filtering of 7 × 7 convolution kernel. Finally, the SA feature map is obtained through the sigmoid activation function. Enrich the input information up-sampled. The feature is modulated by TAM module after each up and down sampling.
Timestep adjustment module
The timestep embedding feature Cond t is obtained by sinusoidal position coding t and MLP. The output of the first stage is obtained by adding the module input and t time feature:
The timestep input of the second stage is t−1, and
Sobel convolution block
In order to enrich the input information of the model, a trainable sobel convolution block is used as the edge enhancement module of the network, and some changes are made to it while retaining the excellent edge extraction ability of the sobel operator, as shown in Figure 3.
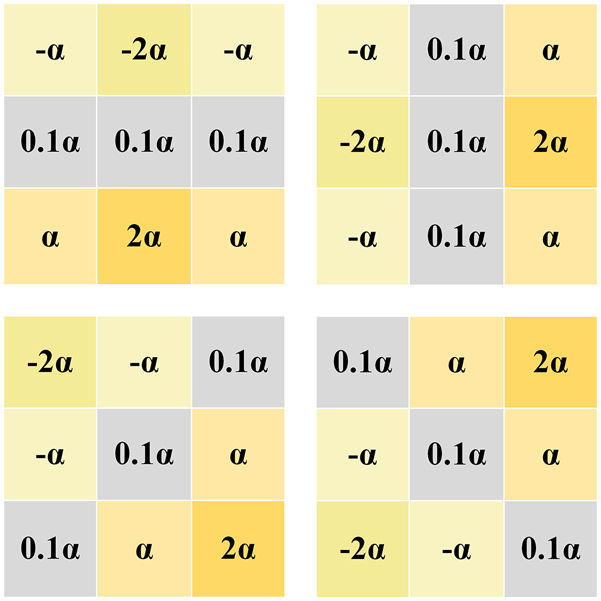
Learnable sobel operator.
When processing LDCT images, it is found that the edge information extracted by using a single traditional sobel operator is incomplete. In this case, the absence of contour information is more serious. Different from the traditional fixed-valued Sobel operator [28], EDCNN [15] proposes a trainable Sobel operator, which defines four operators in the horizontal, vertical and diagonal directions as a group, and this module is also used in DEformer [29], so that the parameter values can be adaptively adjusted during the optimization training process to extract the edge information with different intensities. In order to make the CECDM model extract edge information more accurately, we make some modifications on this basis by changing the learnable parameter α in the sobel algorithm from 0 to 0.1, and other parameters remain unchanged.
Loss function
In this paper, we take the composite loss of MSE+Charbonnier loss as the final training target of the network. The output of the first stage of the network is R
θ
(x
t
,t), and the output of the second stage t−1 is
Charbonnier Loss [30], 31] is an approximation of L1 loss and is used to improve the performance of the model. Lchar calculates the loss between the network output
The corresponding formula for the final compound loss
where λ1 and λ2 are predefined constants, λ1=1.5, λ2=0.05 in this paper.
Experiments and results
In this section, we explain the data set used for training and testing the proposed model, as well as the configuration of the experiment. Then we present the experimental results and evaluate the noise reduction performance of the model in terms of visual effects and quantitative indicators.
Mayo dataset
The 2016 NIH-AAMP-Mayo Clinic low-dose CT Grand Challenge [32] provided a total of 2,378,512 × 512 abdominal CT scans from 10 patients. Under the parameter setting of 120 kVP tube voltage and 200 mAs effective dose, the image was scanned and reconstructed with CT scanner, and the image section thickness was 1 mm and 3 mm. To simulate images at low dose levels, Poisson noise was inserted into the projected data for each case to obtain LDCT images corresponding to a noise level of one-quarter of the full dose. We used 3 mm thickness slices, 2,167 images of nine patients for training, and 211 images of one patient for testing.
Piglet dataset
Real Piglet dataset [33] provided 850 CT images of 512 × 512 piglets with section thickness of 0.625 mm. Under the condition of 100 kVP tube voltage, GE scanner adjusted the tube current of 300 ∼ 15 mAs to perform CT scanning and reconstruction on piglets. Among them, 300 mAs is used as the conventional dose level, and the remaining dose level images are obtained by reducing the dose to 50 %, 25 %, 10 % and 5 % of the original dose, respectively. Four dose data of 50 %, 25 %, 10 % and 5 % were selected for training and testing. 525 Piglet images were selected for each dose as training input and 40 images were selected for testing.
Experimental detail setting
We use U-Net as the backbone of the proposed CECDM with an input size of 3 × 512 × 512. We optimized it using the Adam optimizer with a batchsize of four and a learning rate of 2 × 10⁻⁴, for a total of 100 k iterations of training. α1, … , α T is set to the cosine timesteps schedule [34] from 0.999 to 0, where s=0.008. The experiment was based on the Pytorch framework and trained and tested the network using a computer configured as an NVIDIA GeForce RTX 2080 SUPER GPU.
Analysis of experimental results
In order to test the effectiveness of the proposed CECDM algorithm, the proposed algorithm is compared with REDCNN [12], QAE [13], EDCNN [14], CTformer [19] and CoreDiff [25] in terms of visual assessment and quantitative assessment. Among them, objective evaluation indicators in quantitative assessment include the peak signal-to-noise ratio (PSNR) based on the grey diference of the pixel, the structural similarity measure (SSIM) based on the structural diference [35], the gradient similarity deviation (GMSD) based on the change of the gradient [36], the feature similarity measure (FSIM) based on the diference of the feature [37], and the implementation of the multiscale pixel domain (VIFs) based on visual perception [38] are used. GMSD represents the pixel similarity of the gradient amplitude map between the reference image and the processed image, and the lower the GMSD score of the processed result is. In addition to GMSD, the higher the value of other indicators, the better the quality of CT images after noise removal. The comparison experiments are derived from the official code, and their parameters are set according to the recommendations of the paper.
Mayo dataset visual assessment
Figure 4 show the processed results of two representative slices (denoted as Case 1 and Case 2) from the Mayo test dataset by different methods. All CT images of the axial view are displayed in the [−160, 240] HU window. Due to insufficient photons from incident X-rays, there are a lot of speckle noise and edge artifacts in LDCT images, making it difficult for physicians to determine clinically significant lesion information. From NDCT images (Figure 4(b1) and (b2)), clear lesions can be observed, but there are serious artifacts and noise in LDCT images, as shown in Figure 4(a1) and (a2), so it is difficult to sketch accurately. To show the noise reduction more clearly, we also zoom three ROI(region of interesting) areas (ROI1 in the lower right corner of Case 1, ROI2 in the upper left corner of Case 2, and ROI3 in the lower right corner) and marked them with red arrows and blue circles for better comparison. In general, these six methods can achieve a certain degree of denoising effect, and different denoising methods have different degrees of suppression of noise and artifacts in LDCT images.
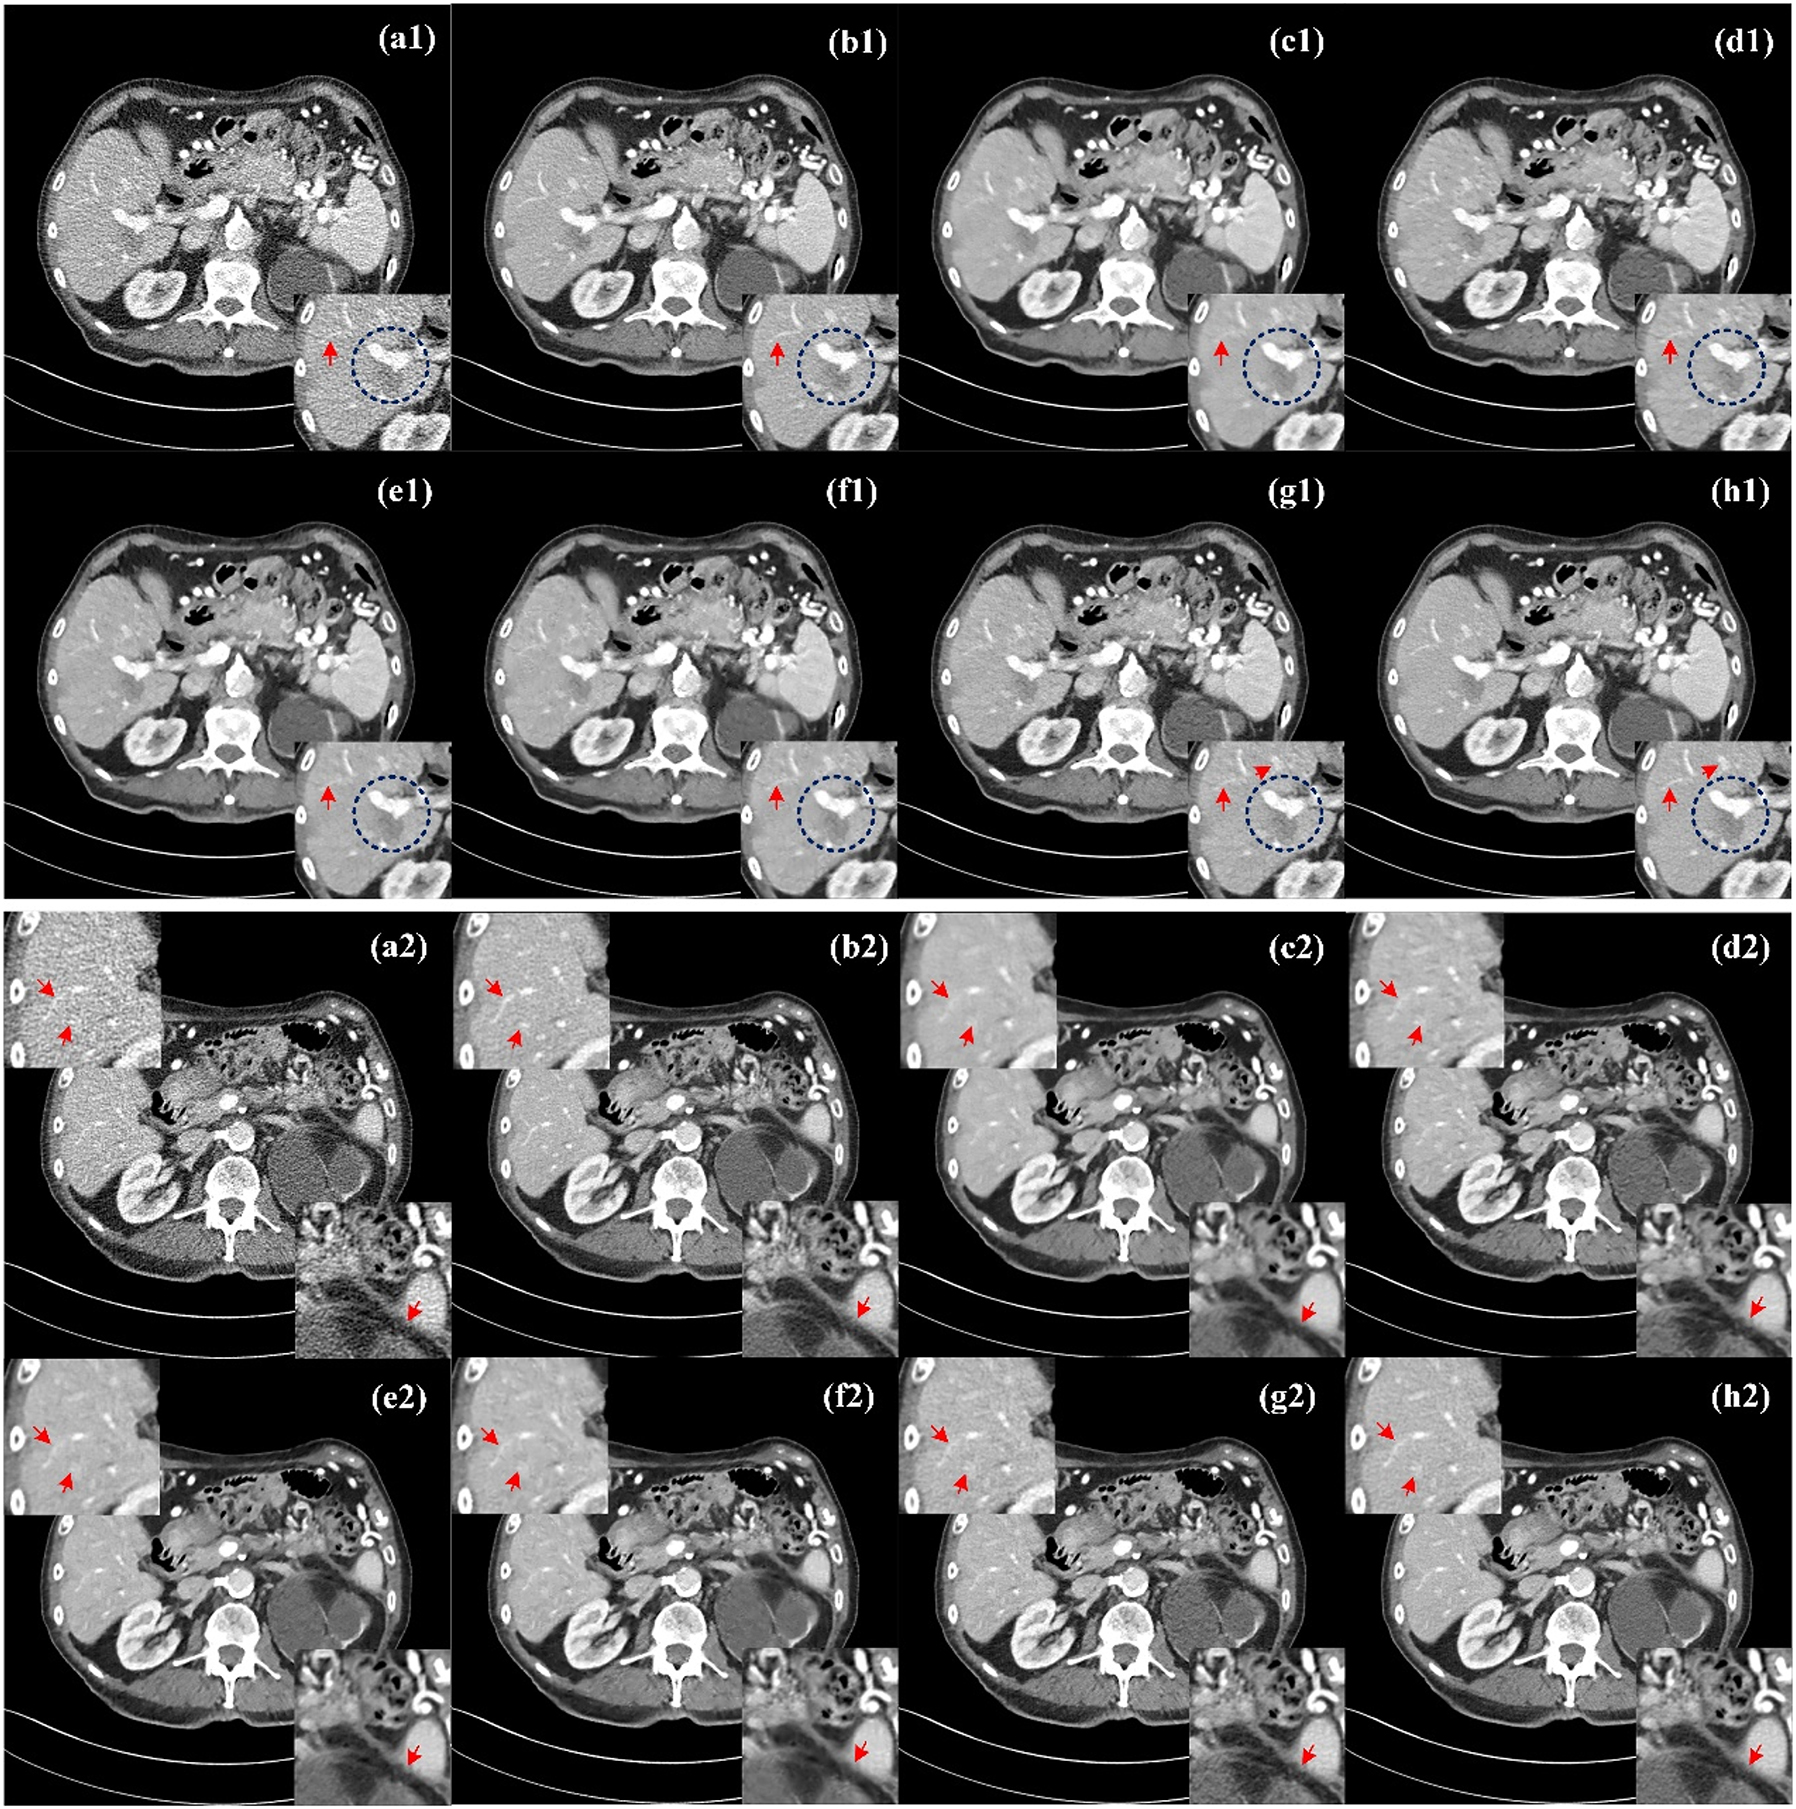
Comparison of processed images by different methods for Case 1 and Case 2. (a1, a2) LDCT, (b1, b2) NDCT, (c1, c2) REDCNN, (d1, d2) QAE, (e1, e2) EDCNN, (f1, f2) CTformer, (g1, g2) CoreDiff, (h1, h2) CECDM. ROI1 in the lower right corner of Case 1, ROI2 in the upper left corner of Case 2, and ROI3 in the lower right corner.
In contrast, REDCNN (Figure 4(c1) and (c2)), while eliminating some noise, suffers from image blurring and images that are too smooth and texture details are lost, such as the details marked by the red arrow in ROI2, the upper left corner of Figure 4(c2). QAE (Figure 4(d1) and (d2)) and CoreDiff (Figure 4(g1) and (g2)) can significantly eliminate noise, and the detail retention effect is better than REDCNN to a certain extent, but the visual effect of these two methods is blurry. EDCNN(Figure 4(e1) and (e2)) and CTformer (Figure 4(f1) and (f2)) are better at preserving image detail than the other methods, but fine striped artifacts are still visible at the red arrows of ROI1 and ROI2. In contrast, CECDM achieves better results in effectively removing noise/artifacts and preserving tissue/structure. The lesion contours of ROI1 (blue circles shown in Figure 4(e1) and (h1)) are easy to identify. It can be found that the lesion contours of EDCNN and CECDM are the clearest, while those of other methods are fuzzy, which confirms the role of edge enhancement module. In addition, CECDM has the clearest tissue edges in ROI3 in Figure 4 (h2). Compared with other images in ROI3 in Figure 4, CECDM has the strongest ability to remove noise and artifacts, while other methods have significant residual artifacts. The results show that CECDM has good texture preservation and noise suppression ability.
Mayo dataset quantitative assessment
In order to quantitatively evaluate the denoising effect of different methods, the average PSNR, SSIM, GMSD, FSIM and VIFs values of all test results of different algorithms are given in Table 1. The best values are shown in red and the next best values are shown in blue. The method in this paper has good quantitative performance on all objective indicators, and the improvement of PSNR and SSIM is also obvious.
Quantitative results of different algorithms on the mayo dataset (mean ± SD).
| Method | PSNR ↑ | SSIM ↑ | GMSD ↓ | FSIM ↑ | VIFs ↑ |
|---|---|---|---|---|---|
| LDCT | 29.2443 ± 2.1138 | 0.8838 ± 0.0372 | 0.0804 ± 0.0190 | 0.9640 ± 0.0299 | 0.4834 ± 0.0531 |
| REDCNN | 33.0346 ± 1.6658 | 0.9188 ± 0.0271 | 0.0622 ± 0.0113 | 0.9714 ± 0.0270 | 0.5507 ± 0.0451 |
| QAE | 33.0647 ± 1.8117 | 0.9221 ± 0.0282 | 0.0559 ± 0.0124 | 0.9731 ± 0.0283 | 0.5481 ± 0.0486 |
| EDCNN | 32.7956 ± 1.6544 | 0.9188 ± 0.0274 | 0.0609 ± 0.0111 | 0.9717 ± 0.0264 | 0.5392 ± 0.0458 |
| CTformer | 33.0285 ± 1.7682 | 0.9199 ± 0.0291 | 0.0558 ± 0.0122 | 0.9720 ± 0.0298 | 0.5435 ± 0.0480 |
| CoreDiff | 33.1065 ± 1.8678 | 0.9250 ± 0.0273 | 0.0532 ± 0.0124 | 0.9758 ± 0.0260 | 0.5573 ± 0.0496 |
| CECDM | 33.4405 ± 1.8602 | 0.9278 ± 0.0266 | 0.0512 ± 0.0117 | 0.9794 ± 0.0218 | 0.5662 ± 0.0488 |
As can be seen from Table 1, the difference between REDCNN, QAE and CTformer in PSNR is small. But REDCNN had the lowest GMSD score, consistent with the visual judgment that the image was too smooth and had low contrast. EDCNN performs poorly on PSNR, GMSD, and VIFs, but has a smaller gap with other methods on other quantitative measures. QAE and CTformer are superior to the two typical CNN-based methods above on SSIM and FSIM. CoreDiff and CECDM are ahead of other methods on all indicators, which proves that diffusion models hold encouraging promise in the field of LDCT post-processing.
CECDM has the best value on several indexes, indicating that CECDM can achieve better noise/artifact suppression and feature information retention, and the results are close to the corresponding NDCT images. In summary, CECDM is superior to other comparative methods in visual effect and quantitative index analysis.
Piglet dataset visual assessment
Figure 5 shows the treatment results of representative piglet slices (Case 3) by different methods at different doses (50 %, 25 %, 10 %, 5 %). All CT images are displayed in window [−160, 240] HU. Figure 5(a1)–(a4) shows LDCT images at 150 mAs, 75 mAs, 30 mAs and 15 mAs. Figure 5(b1)–(b4) shows the corresponding NDCT images. Six comparison algorithms RED-CNN, Q-AE, EDCNN, CTformer, CoreDiff and CECDM. Comparing LDCT and NDCT images, it is found that the lower the X-ray dose, the richer the noise information in LDCT images. When the tube current drops to 15 mAs, the quality of LDCT image is significantly lower than that of NDCT image, and it is difficult to observe the tissue structure and detailed information.
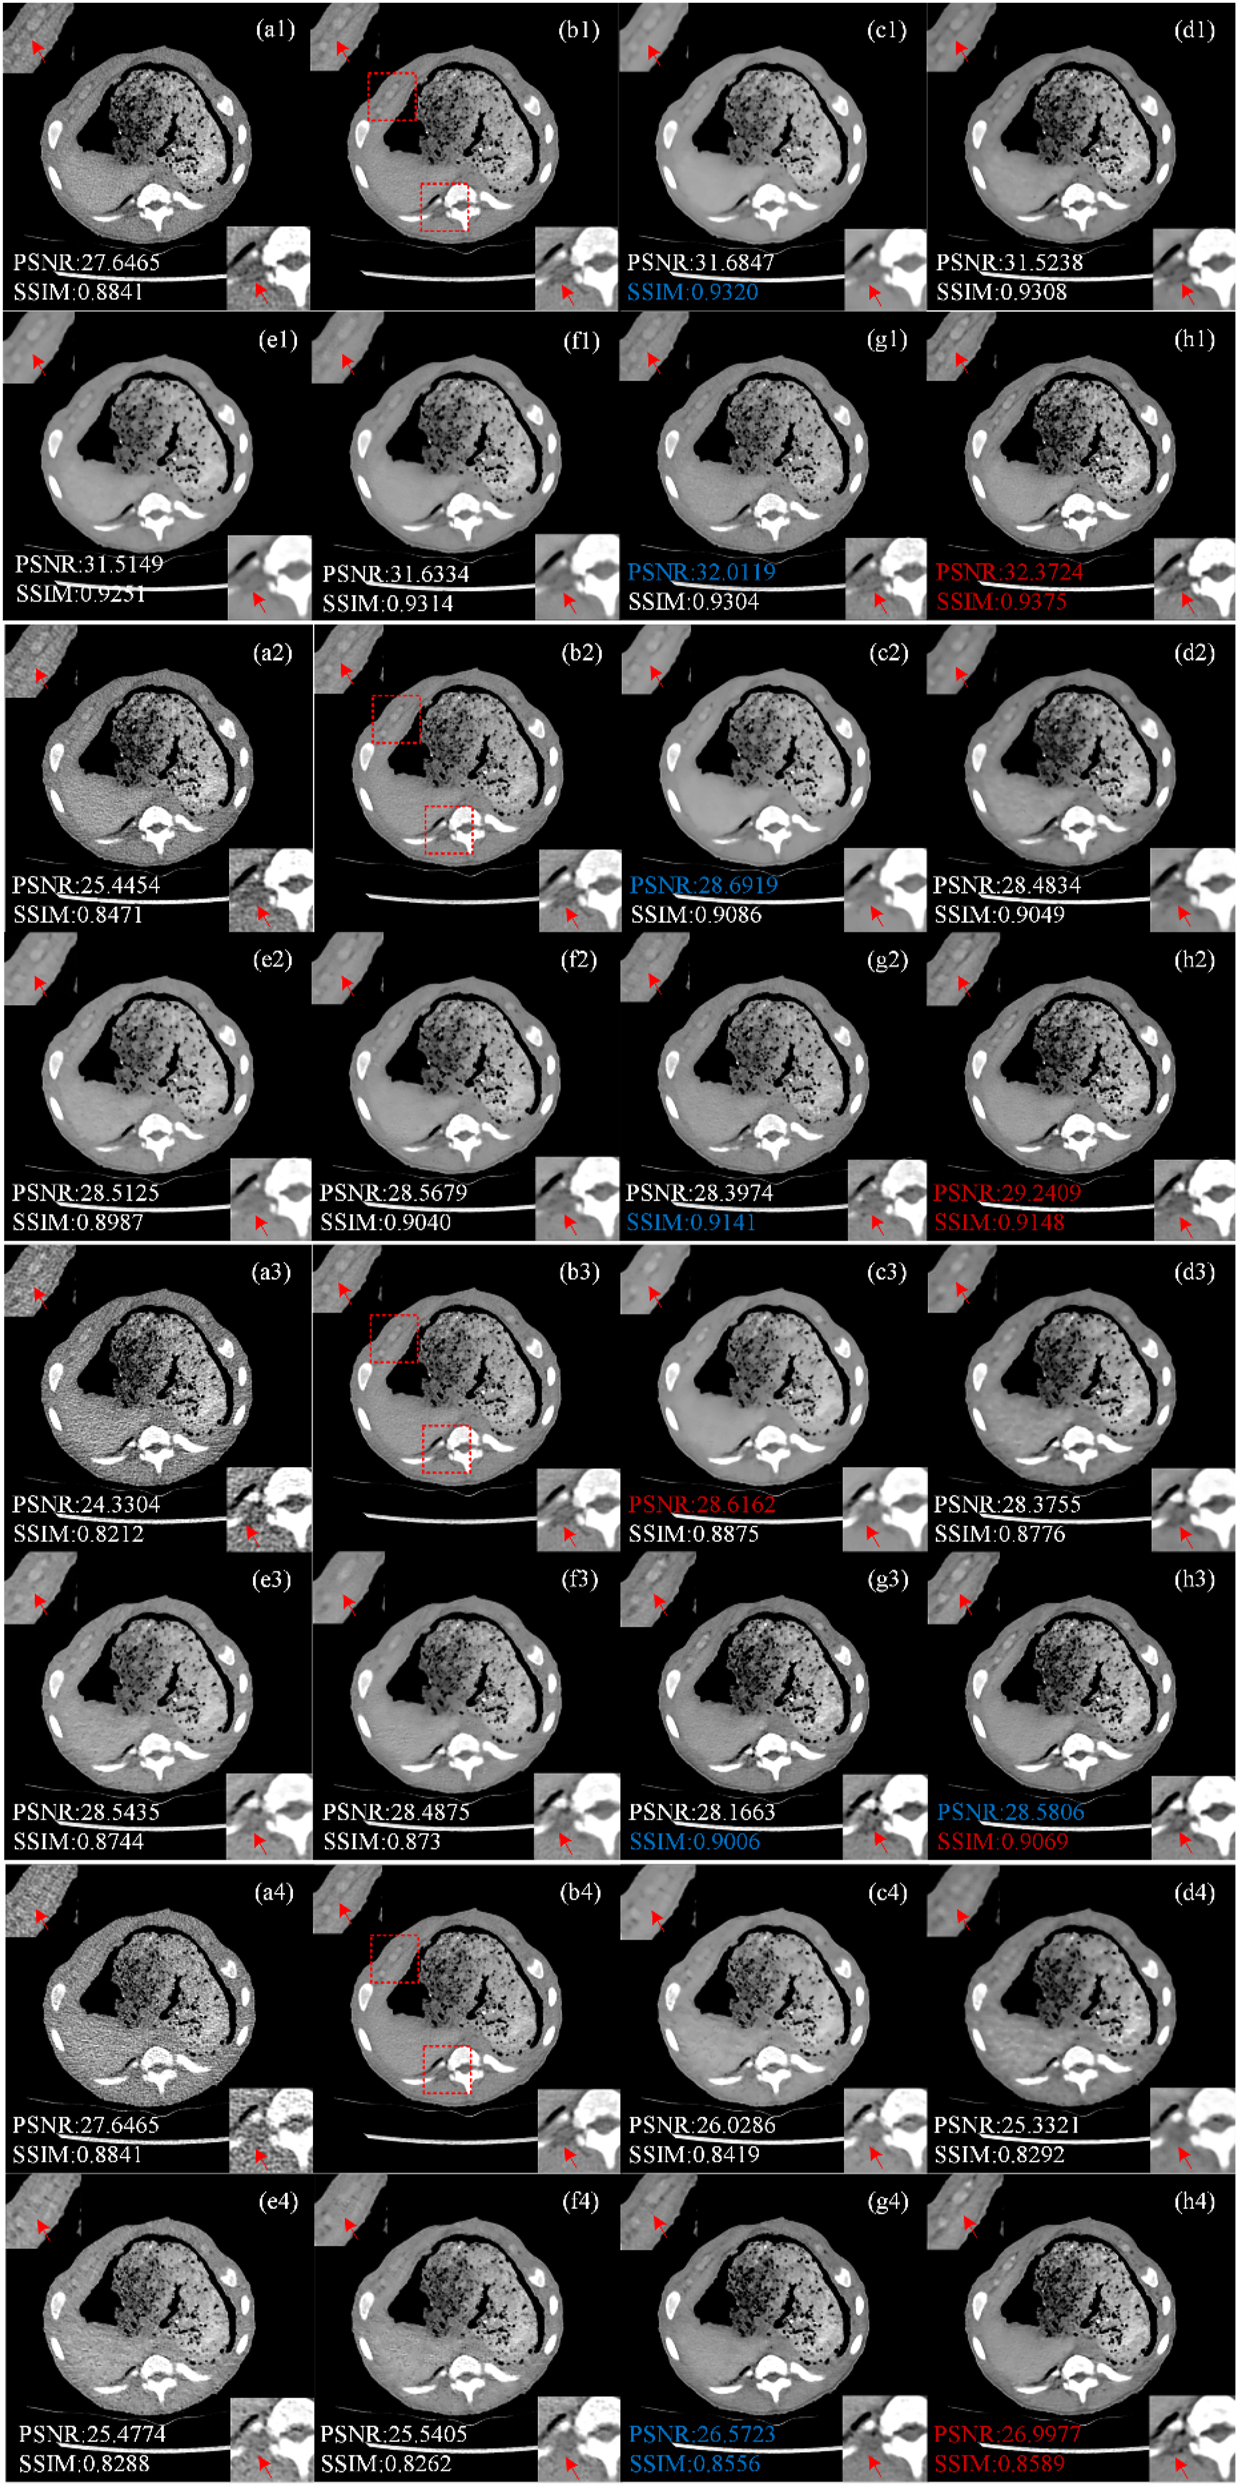
Image comparison of different processing methods in piglet dataset. (a1–a4) LDCT (the tube currents are in order 150 mAs, 75 mAs, 30 mAs and 15 mAs), (b1–b4) NDCT, (c1–c4) REDCNN, (d1–d4) QAE, (e1–e4) EDCNN, (f1–f4) CTformer, (g1–g4) CoreDiff, (h1–h4) CECDM.
We zoom two ROI areas (marked by red rectangles in Figure 5(b)) for better comparison, trained and tested the four doses of LDCT separately, and we can see that above methods have different performance in noise reduction effect when tested on 150 mAs and 75 mAs datasets. Similar to the results from the Mayo dataset, RED-CNN, EDCNN, CTformer, and Q-AE were effective in suppressing noise at high doses (i.e. 50 % and 25 %). However, the RED-CNN image is too smooth (ROI regions (c1), (c2) in the lower right corner of Figure 5). Although EDCNN can retain edge information and has good noise reduction effect, there is still a problem of blurred details in the image (as shown in Figure 5(e1)–(e2)). CTformer can obtain improved images of better quality, but there is a smoothing phenomenon (as shown in Figure 5(f1)–(f2) top left corner ROI regions). The results of CoreDiff and CECDM are superior to those of the above methods, and it can be seen that the method proposed in this paper has good performance in both ROI regions (Figure 5(h1)–(h2)). However, when the tube current is reduced to 30 mAs and 15 mAs respectively, the image quality is seriously polluted. The two diffusion model-based methods proposed by us, CECDM and CoreDiff, have remarkable denoising effects and are obviously superior to other methods.
Piglet dataset quantitative assessment
Figure 5 shows the PSNR and SSIM indicators for the optimal and sub-optimal values of different noise levels, denoted in red and blue respectively. As can be seen from Figure 5, the X-ray dose is closely related to the LDCT reduction results of the six algorithms on the piglet test set. The higher the X-ray dose, the better the image index, and the lower the dose, the worse the image index.
It can be seen that when the tube current is 150 mAs and 75 mAs the indexes of RED-CNN are improved, and the optimal and sub-optimal values are obtained in some indexes. However, the index gap of other methods is not obvious. When the tube currents are 30 mAs and 15 mAs, CoreDiff and CECDM methods based on cold diffusion are obviously better than other methods, and most of the indexes are optimal. In general, the CECDM method proposed in this paper has achieved good results on measurements of LDCT image denoising at different doses, and has strong robustness.
Ablation studies
In this section, we design several sets of ablation studies to analyze and verify the performance of the proposed CECDM model under different network component and compound loss. In addition, it is worth mentioning that the cross-validation strategy is no longer used in this part of the experiment, but a set of data tests from the Mayo dataset are fixed.
Diffusion timesteps T
The performance of CECDM in training and inference was evaluated at T=1, 10, 50 and 200. Figure 6 shows the images after noise reduction with different T values. When T=1, CECDM is a one-step restoration, the edge of the image after noise removal is blurred, and the texture details are not clear. With the increase of T, the organizational boundary becomes clearer. At T=200, the degree of detail retention of the image is better than that of the image at T=50, but the inference time also increases significantly.
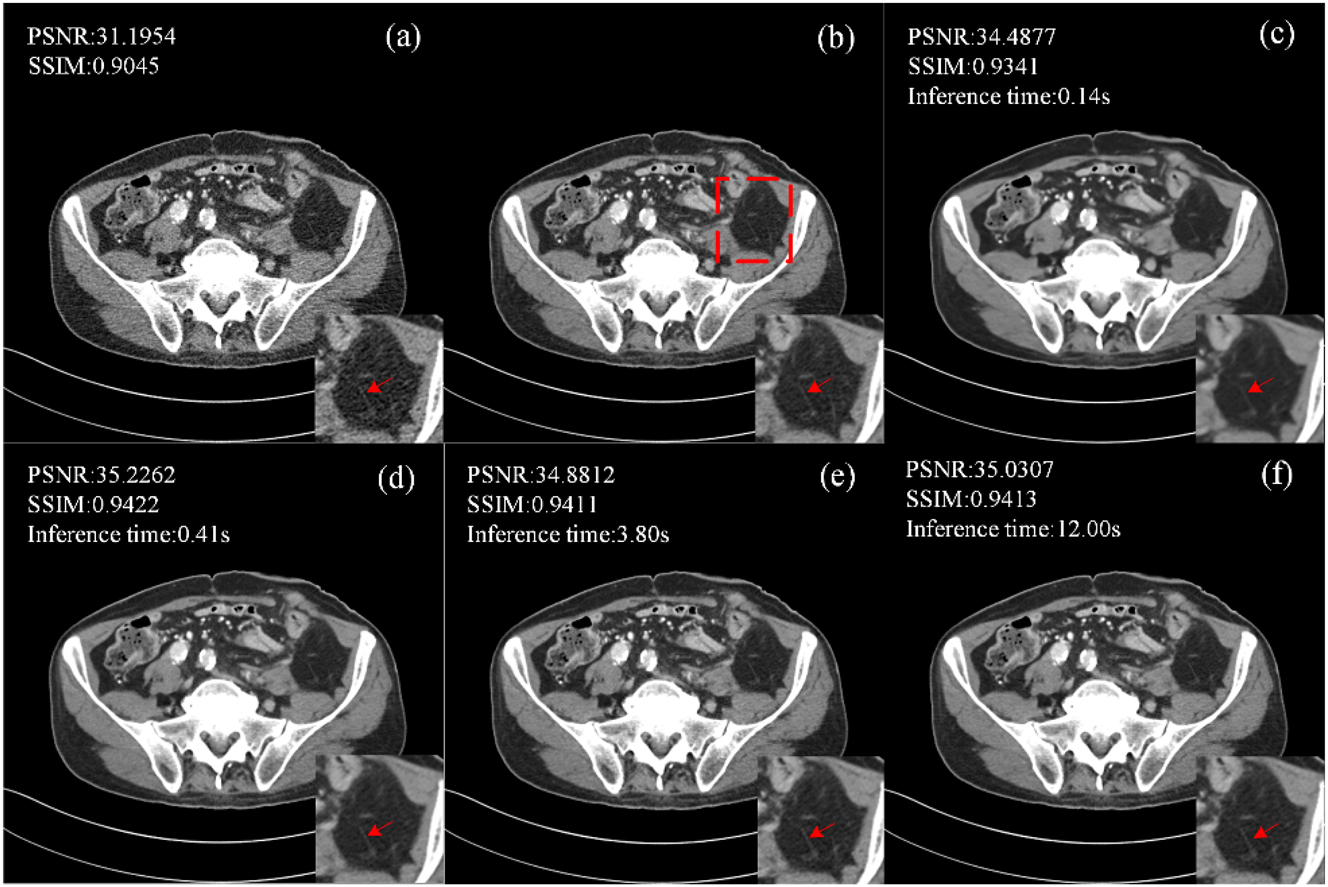
Ablation studies of CECDM with different T settings (a) LDCT, (b) NDCT, (c) T=1, (d) T=10, (e) T=50, (f) T=200.
When T=10, the PSNR and SSIM values of CECDM are the highest, and the image after noise removal is the closest to NDCT visually. When T≥50, the quantitative performance of CECDM decreased gradually. When T=200, PSNR increases to a certain extent. Therefore, considering the sharpness of the denoised image, quantitative performance, and inference time of the method, T=10 is a suitable setting for CECDM.
Network components and compound loss functions
TAM and Sobel+CBAM modules are used to improve the network structure and compound loss function is used to optimize the network performance. In order to prove the effectiveness of these improvements, a series of ablation studies are conducted to evaluate their effects on the performance of the noise reduction network. The results of quantitative analysis are shown in Table 2, and it can be seen that our proposed CECDM method is the most effective. All four different combinations of improvements have been improved to some extent, with Sobel+CBAM showing the most significant improvement. The proposed improvements have been improved to some extent, among which Sobel+CBAM has the most obvious improvement effect. Although the overall index of other improvements has not been greatly improved, there are still some gaps in some small details. In summary, the improvement strategy proposed in this paper has a positive effect on improving the quality of denoised images.
Quantitative analysis of different improvements.
| Network component | Loss function | PSNR | SSIM | |||
|---|---|---|---|---|---|---|
| TAM | √ | √ | √ | 34.4340 | 0.9251 | |
| Sobel+CBAM | √ | √ | √ | 34.6269 | 0.9269 | |
| MSE | √ | √ | √ | 34.6050 | 0.9265 | |
| CHAR | √ | √ | √ | 34.5024 | 0.9255 | |
| CECDM | √ | √ | √ | √ | 34.7412 | 0.9278 |
Conclusion and discussion
In order to suppress the radiation dose and reduce the noise and artifacts generated by CT images, we proposed a low dose CT image denoising method based on the combination of edge enhancement and cold diffusion model, called CECDM, which replaced random gaussian noise with LDCT images as the end point of the diffusion process, simplified the forward degradation process, and greatly reduced the sampling steps. Based on Unet network structure, the trainable sobel operator and CBAM attention module are introduced, and the compound loss function of MSE+Charbonnier loss is used to guide the training process of the recovery network. Experiments on Mayo and Piglet datasets show that CECDM outperforms all comparison algorithms on both subjective visual and objective evaluation indicators, effectively removes noise and artifacts from LDCT images, and improves the clarity of reconstructed images. The results show that the model has strong generalization ability.
Although the cold diffusion model architecture used can greatly accelerate the inference process of the diffusion model, there is still a certain gap between it and other classical LDCT denoising methods (for example, the denoising time of QAE single image is 0.029 s), and it can be further optimized in this respect in the future. In addition to the limitation of inference speed, more in-depth studies are still needed to compare data sets of different clinical application scenarios and LDCT images of different radiation doses to achieve better noise reduction effects and strengthen the generalization ability of the model.
Funding source: the Fundamental Research Program of Shanxi Province
Award Identifier / Grant number: 202303021211148
Funding source: the Patent Transformation Project of Shanxi Province
Award Identifier / Grant number: 202302006
-
Research ethics: This work involved human subjects or animals in its research. Approval of all ethical and experimental procedures and protocols was granted by Biological and Medical Ethics Committee of North University of China. Application No. NUC20200827-003, and performed in line with the Research on artifact suppression algorithms for low-dose CT.
-
Informed consent: Not applicable.
-
Author contributions: The author have accepted responsibility for the entire content of this manuscript and approved its submission.
-
Use of Large Language Models, AI and Machine Learning Tools: None declared.
-
Conflict of interest: The author state no conflict of interest.
-
Research funding: This work was supported by the Fundamental Research Program of Shanxi Province under Grant 202303021211148; the Patent Transformation Project of Shanxi Province under Grant 202302006.
-
Data availability: The raw data can be obtained on request from the corresponding author.
References
1. Brenner, DJ, Hall, EJ. Computed tomography — an increasing source of radiation exposure. N Engl J Med 2007;357:2277–84. https://doi.org/10.1056/nejmra072149.Suche in Google Scholar
2. Mohd, SSV, George, SN. A review on medical image denoising algorithms. Biomed Signal Process Control 2020;61:102036. https://doi.org/10.1016/j.bspc.2020.102036.Suche in Google Scholar
3. Arabi, H, Zaidi, H. Spatially guided nonlocal mean approach for denoising of PET images. Med Phys 2020;47:1656–69. https://doi.org/10.1002/mp.14024.Suche in Google Scholar PubMed
4. Fumene Feruglio, P, Vinegoni, C, Gros, J, Sbarbati, A, Weissleder, R. Block matching 3D random noise filtering for absorption optical projection tomography. Phys Med Biol 2010;55:5401–15. https://doi.org/10.1088/0031-9155/55/18/009.Suche in Google Scholar PubMed PubMed Central
5. Ma, J, Huang, J, Feng, Q, Zhang, H, Lu, H, Liang, Z, et al.. Low-dose computed tomography image restoration using previous normal-dose scan. Med Phys 2011;38:5713–31. https://doi.org/10.1118/1.3638125.Suche in Google Scholar PubMed PubMed Central
6. Ma, Y, Wei, B, Feng, P, He, P, Yamauchi, Y, Wang, G. Low-dose CT image denoising using a generative adversarial network with a hybrid loss function for noise learning. IEEE Access 2020;8:67519–29. https://doi.org/10.1109/access.2020.2986388.Suche in Google Scholar
7. Chen, Y, Chen, W, Yin, X, Ye, X, Bao, X, Luo, L, et al.. Improving low-dose abdominal CT images by weighted intensity averaging over large-scale neighborhoods. Eur J Radiol 2011;80:e42–9. https://doi.org/10.1016/j.ejrad.2010.07.003.Suche in Google Scholar PubMed
8. Wang, L, Liu, Y, Wu, R, Liu, Y, Yan, R, Ren, S, et al.. Image processing for low-dose CT via novel anisotropic fourth-order diffusion model. IEEE Access 2022;10:50114–24. https://doi.org/10.1109/access.2022.3172975.Suche in Google Scholar
9. Hajiaboli, MR. An anisotropic fourth-order diffusion filter for image noise removal. Int J Comput Vis 2010;92:177–91. https://doi.org/10.1007/s11263-010-0330-1.Suche in Google Scholar
10. Zhong, J, Ning, R, Conover, D. Image denoising based on multiscale singularity detection for cone beam CT breast imaging. IEEE Trans Med Imag 2004;23:696–703. https://doi.org/10.1109/tmi.2004.826944.Suche in Google Scholar PubMed
11. Chen, Y, Shi, L, Feng, Q, Yang, J, Shu, H, Luo, L, et al.. Artifact suppressed dictionary learning for low-dose CT image processing. IEEE Trans Med Imag 2014;33:2271–92. https://doi.org/10.1109/tmi.2014.2336860.Suche in Google Scholar
12. Chen, H, Zhang, Y, Kalra, MK, Lin, F, Chen, Y, Liao, P, et al.. Low-dose CT with a residual encoder-decoder convolutional neural network. IEEE Trans Med Imag 2017;36:2524–35. https://doi.org/10.1109/tmi.2017.2715284.Suche in Google Scholar PubMed PubMed Central
13. Fan, F, Shan, H, Kalra, MK, Singh, R, Qian, G, Getzin, M, et al.. Quadratic autoencoder (Q-AE) for low-dose CT denoising. IEEE Trans Med Imag 2020;39:2035–50. https://doi.org/10.1109/tmi.2019.2963248.Suche in Google Scholar
14. Liang, T, Jin, Y, Li, Y, Wang, T, Feng, S, Lang, C. EDCNN: edge enhancement-based densely connected network with compound loss for low-dose CT denoising [Internet]. arXiv.org.; 2020. https://arxiv.org/abs/2011.00139 [Accessed 16 Jul 2024].Suche in Google Scholar
15. Shan, H, Padole, A, Homayounieh, F, Kruger, U, Khera, RD, Nitiwarangkul, C, et al.. Competitive performance of a modularized deep neural network compared to commercial algorithms for low-dose CT image reconstruction. Nat Mach Intell 2019;1:269–76. https://doi.org/10.1038/s42256-019-0057-9.Suche in Google Scholar PubMed PubMed Central
16. Kang, E, Koo, HJ, Yang, DH, Seo, JB, Ye, JC. Cycle‐consistent adversarial denoising network for multiphase coronary CT angiography. Med Phys 2018;46:550–62. https://doi.org/10.1002/mp.13284.Suche in Google Scholar PubMed
17. Yang, Q, Yan, P, Zhang, Y, Yu, H, Shi, Y, Mou, X, et al.. Low-dose CT image denoising using a generative adversarial network with Wasserstein distance and perceptual loss. IEEE Trans Med Imag 2018;37:1348–57. https://doi.org/10.1109/tmi.2018.2827462.Suche in Google Scholar
18. Li, Z, Liu, Y, Shu, H, Lu, J, Kang, J, Chen, Y, et al.. Multi-scale feature fusion network for low-dose CT denoising. J Digit Imag 2023;36:1808–25. https://doi.org/10.1007/s10278-023-00805-0.Suche in Google Scholar PubMed PubMed Central
19. Wang, D, Fan, F, Wu, Z, Liu, R, Wang, F, Yu, H. CTformer: convolution-free Token2Token dilated vision transformer for low-dose CT denoising. Phys Med Biol 2023;68:065012–2. https://doi.org/10.1088/1361-6560/acc000.Suche in Google Scholar PubMed
20. Kang, J, Liu, Y, Zhang, P, Guo, N, Wang, L, Du, Y, et al.. FSformer: a combined frequency separation network and transformer for LDCT denoising. Comput Biol Med 2024;173:108378–8. https://doi.org/10.1016/j.compbiomed.2024.108378.Suche in Google Scholar PubMed
21. Yan, R, Liu, Y, Liu, Y, Wang, L, Zhao, R, Bai, Y, et al.. Image denoising for low-dose CT via convolutional dictionary learning and neural network. IEEE Trans Comput Imag. 2023;9:83–93. https://doi.org/10.1109/tci.2023.3241546.Suche in Google Scholar
22. Ho, J, Jain, A, Abbeel, P. Denoising diffusion probabilistic models. arxivorg [Internet]; 2020. Available from: https://arxiv.org/abs/2006.11239.Suche in Google Scholar
23. Xia, W, Lyu, Q, Wang, G. Low-dose CT using denoising diffusion probabilistic model for 20× speedup [Internet]. arXiv.org. 2022. https://arxiv.org/abs/2209.15136 [Accessed 26 Sep 2023].Suche in Google Scholar
24. Liu, X, Xie, Y, Diao, S, Tan, S, Liang, X. Diffusion probabilistic priors for zero-shot low-dose CT image denoising. Med Phys 2024. https://doi.org/10.1002/mp.17431.10.1002/mp.17431Suche in Google Scholar PubMed
25. Gao, Q, Li, Z, Zhang, J, Zhang, Y, Shan, H. CoreDiff: contextual error-modulated generalized diffusion model for low-dose CT denoising and generalization. IEEE Trans Med Imag 2024;43:745–59. https://doi.org/10.1109/tmi.2023.3320812.Suche in Google Scholar
26. Bansal, A, Borgnia, E, Chu, HM, Li, JS, Kazemi, H, Huang, F, et al.. Cold diffusion: inverting arbitrary image transforms without noise [Internet]. arXiv.org; 2022. https://arxiv.org/abs/2208.09392 [Accessed 25 Jun 2023].Suche in Google Scholar
27. Woo, S, Park, J, Lee, JY, Kweon, IS. CBAM: convolutional block attention module. Computer Vision – ECCV 2018;2018:3–19. https://doi.org/10.1007/978-3-030-01234-2_1.Suche in Google Scholar
28. Sobel, I, Feldman, G. An Isotropic 3×3 image gradient operator [Internet]. Semantic Scholar; 1990. Available from: https://www.semanticscholar.org/paper/An-Isotropic-3%C3%973-image-gradient-operator-Sobel-Feldman/1ab70add6ba3b85c2ab4f5f6dc1a448e57ebeb30.Suche in Google Scholar
29. Li, H, Yang, X, Yang, S, Wang, D, Jeon, G. Transformer with double enhancement for low-dose CT denoising. IEEE J Biomed Health Inf 2023;27:4660–71. https://doi.org/10.1109/jbhi.2022.3216887.Suche in Google Scholar
30. Lai, WS, Huang, JB, Ahuja, N, Yang, MH. Fast and accurate image super-resolution with deep laplacian pyramid networks. IEEE Trans Pattern Anal Mach Intell 2019;41:2599–613. https://doi.org/10.1109/tpami.2018.2865304.Suche in Google Scholar PubMed
31. Chen, Z, Niu, C, Gao, Q, Wang, G, Shan, H. LIT-former: linking in-plane and through-plane transformers for simultaneous CT image denoising and deblurring. IEEE Trans Med Imag 2024:1. https://doi.org/10.1109/tmi.2024.3351723.Suche in Google Scholar
32. Zhang, J, Gong, W, Ye, L, Wang, F, Zhibo, S, Cheng, Y. A Review of deep learning methods for denoising of medical low-dose CT images. Comput Biol Med 2024;171:108112–2. https://doi.org/10.1016/j.compbiomed.2024.108112.Suche in Google Scholar PubMed
33. Yi, X, Babyn, P. Sharpness-aware low-dose CT denoising using conditional generative adversarial network. J Digit Imag 2018;31:655–69. https://doi.org/10.1007/s10278-018-0056-0.Suche in Google Scholar PubMed PubMed Central
34. Nichol, A, Dhariwal, P. Improved denoising diffusion probabilistic models [Internet]. arXiv.org.; 2021. Available from: https://arxiv.org/abs/2102.09672?ref=assemblyai.com.Suche in Google Scholar
35. Wang, Z, Bovik, AC, Sheikh, HR, Simoncelli, EP. Image quality assessment: from error visibility to structural similarity. IEEE Trans Image Process 2004;13:600–12. https://doi.org/10.1109/tip.2003.819861.Suche in Google Scholar PubMed
36. Xue, W, Zhang, L, Mou, X, Bovik, AC. Gradient magnitude similarity deviation: a highly efficient perceptual image quality index. IEEE Trans Image Process 2014;23:684–95. https://doi.org/10.1109/tip.2013.2293423.Suche in Google Scholar PubMed
37. Zhang, L, Zhang, L, Mou, X, Zhang, D. FSIM: a feature similarity index for image quality assessment. IEEE Trans Image Process 2011;20:2378–86. https://doi.org/10.1109/tip.2011.2109730.Suche in Google Scholar
38. Sheikh, HR, Bovik, AC. Image information and visual quality. IEEE Trans Image Process 2006;15:430–44.10.1109/TIP.2005.859378Suche in Google Scholar
Supplementary Material
This article contains supplementary material (https://doi.org/10.1515/bmt-2024-0362).
© 2024 the author(s), published by De Gruyter, Berlin/Boston
This work is licensed under the Creative Commons Attribution 4.0 International License.
Artikel in diesem Heft
- Frontmatter
- Review
- Hydrogel promotes bone regeneration through various mechanisms: a review
- Research Articles
- Wear investigation of implant-supported upper removable prothesis with electroplated gold or PEKK secondary crowns
- Straight and helical plating with locking plates for proximal humeral shaft fractures – a biomechanical comparison under physiological load conditions
- Integration of neuromuscular control for multidirectional horizontal planar reaching movements in a portable upper limb exoskeleton for enhanced stroke rehabilitation
- Recognition analysis of spiral and straight-line drawings in tremor assessment
- Combination of edge enhancement and cold diffusion model for low dose CT image denoising
- High-performance breast cancer diagnosis method using hybrid feature selection method
- A multimodal deep learning-based algorithm for specific fetal heart rate events detection