Influence of Multilayer Interlocked Fabrics Structure on Their Thermal Performance
-
Ferran Parés


Abstract
This paper examines the influence of weaving variables such as yarn count, number of layers, warp and weft ratio, materials of the top layer, weft density and interlocking cell shape, and size on the thermal performance of multilayer interlocked woven fabrics. A split-plot design was used to construct a total of 64 fabric structures, which were assessed for thermal performance in terms of resistance to convective, conductive, and radiative heat. It was found that, for equal weft density and yarn number, protective performance improved with the number of fabric layers and with the presence of air cells between these layers, especially if air was not trapped within and could rather pass freely between the cells. An optimal combination of factors for the thermal response to the three types of heat was established via a Derringer–a much needed desirability function. The results of this paper are useful for identifying the interaction between configuration parameters and thermal performance, and hence for the design of improved heat protective clothing.
1 Introduction
The development of fire and heat protection fabrics is a field of immense interest for obvious reasons of personal safety. Nowadays, a significant number of heat protective fabrics are commercially available, ranging from single-layer materials consisting of fireproofed cotton or cellulose-based fibers, to multilayer materials containing aramids and other thermo-resistant fibers developed for increased protection. However, in many applications for personal protection, these heat protective fabrics must also possess acceptable mechanical and comfort-related properties in addition to a high thermal resistance.
An example is firefighter clothing, which is intended to be routinely exposed to fire and heat. Firefighters cannot work efficiently if they feel uncomfortable with their clothing [1]. The assembly should provide excellent heat protection as well as moisture comfort, thus should allow easy sweating-control. Due to this, existing firefighter clothing is typically a three-layer assembly consisting of an outer flame-resistant fabric, an interlayer moisture barrier, and an inner thermal liner.
In the framework of fire and heat personal protection, fabrics have been extensively studied from different perspectives, including the heat transmission process, fiber properties, and surface treatments. The influence of fabric configuration and garment manufacture has been investigated extensively [2,3,4,5,6,7,8]. The effectiveness of the heat protection offered by this kind of fabrics depends especially on fiber composition, but also on a number of factors, such as yarn count and density, the number of layers in the fabric, the way they are interlocked, or the distribution of fibers within these layers, among others.
The response of fabrics of variable composition to convective, radiative, and conductive heat has been the subject of much research [9,10,11,12,13]. Most studies in this context have focused on the thermal behavior of single-layer or assembled multilayer fabrics [9,10,11,12,13,14,15]. Nonetheless, the influence of the weaving-process parameters has been less widely assessed. In many cases, these studies remain limited to the experimental work carried out by the factories that manufacture and/or commercialize such fabrics; and, to the present authors’ best knowledge, no study has yet been carried out regarding the influence of weaving parameters on multilayer interlocked heat protective fabrics.
Multilayer interlocked woven fabrics constitute a class of 3D textile structures manufactured by interlocking fabric layers at the weaving stage. Multilayer fabrics provide the advantage of performing cost-effective manufacturing—that is easier handling—together with control over binding point density based on weave variations [16]. Furthermore, multilayer interlocked woven fabrics can also be constructed with different interlocking patterns in order to create air cells inside the fabrics and thereby further increase the heat protection.
In the present work, we report on the design of multilayer interlocked fabrics consisting of various layers assembled by the same weaving process. Our primary aim was to examine the influence of construction parameters on the heat protective efficiency of these fabrics, with the objective of identifying the interactions between the different parameters and thereby improve the design of these woven fabrics. Therefore, besides the yarn composition and yarn count, several weaving factors were included in the analysis: the number of layers, warp and weft ratio, materials of the top layer, weft density, and both the interlocking cell shape and size. These factors were selected taking into account the processability of the fabrics on the loom, as well as to ensure a sufficiently wide range of samples for analysis. For availability reasons, the two yarn metric numbers and the two yarn distributions (warp ratio) on the warp beam were fixed by the materials provider.
A split-plot design was used to construct a total of 64 fabric structures that were assessed for thermal resistance against convective, conductive, and radiative heat.
2 Experimental
2.1 Materials and methods
Among the most common materials used for thermal protective fabrics, the highest levels of protection are offered by m-aramids, followed by mixtures thereof with viscose Flame retardant (FR), modacrylic fibers, and finally treated cottons. Although m-aramids confer the highest levels of protection and meet most of the demands of the industry, the best comfort levels are obtained when these materials are mixed with viscose FR, that possess higher hydrophilicity. In some cases, a low percentage of around 5% of p-aramid is also included in the mixtures in order to obtain a higher mechanical performance.
Two types of yarn were selected taking into account the aforementioned factors: one consisting of 93% meta-aramid, 5% para-aramid and 2% antistatic fiber (AR yarn), and the other of 50% viscose FR, 43% meta-aramid, 5% para-aramid, and 2% antistatic agent (CV-AR yarn). Both yarns were used in two different metric numbers: 2/60 and 2/90.
Two different warp ratios were used—namely: 1:1 (AR and CV-AR) and 2:1 (AR, AR, and CV-AR)— to prepare the warp beam. Therefore, four warp beams were prepared with the combination of the different yarn counts and warp ratios. Each warp beam was used to weave different fabrics of variable parameters on a on a Dornier LWV8/J 190 loom (Figure 1), available in the weaving workshop of the Textile Engineering division (Materials Science and Engineering Department) of the Universitat Politècnica de Catalunya (UPC). The loom —which is equipped with a Jacquard Stäubli LX 1600B 6480-thread electronic machine— was operated at 650 picks/cm, with its 170 cm-wide reed count of 10 dents/cm threaded in with 4 yarns/dent.

Jacquard loom used to weave the fabrics.
The weaving parameters were set to obtain two-layer and four-layer interlock plain-woven fabrics, half of them with a single material face —only AR yarns on the top layer— half of them with two materials on the top layer —alternating AR and CV-AR yarns— (see Table 1). The weft densities were of 28 or 40 picks/cm.
Fabric configurations according to the warp/weft ratios, number of layers and top layer materials
| Warp ratio and weft ratio 1:1 Yams used: 50% AR, 50% CV-AR |
Two-layer fabric |  |
Top layer: 1 material Aramid |
 |
Top layer: 2 materials Aramid and viscose FR | ||
| Four-layer fabric |  |
Top layer: 1 material Aramid | |
 |
Top layer: 2 materials Aramid and viscose FR | ||
| Warp ratio and weft ratio 2:1 Yams used: 67% AR, 33% CV-AR |
Two-layer fabric |  |
Top layer: 1 material Aramid |
 |
Top layer: 2 materials Aramid and viscose FR | ||
| Four-layer fabric |  |
Top layer: 1 material Aramid | |
 |
Top layer: 2 materials Aramid and viscose FR |
Note:
 = AR yarn;
  = CV-AR yarn
Layers were interlocked via Y-shaped or square-shaped cells of two different sizes: 0.8 cm and 1.6 cm (Figure 2), but in all cases the interlocking was achieved between the top and the bottom layers, as schematized in Figure 3.

Variations of the interlocking cells according to shape and size.

Scheme of the interlocking between the top and the bottom layers.
The fabrics obtained were assessed for resistance to convective, conductive (350 °C), and radiative heat in accordance with the UNE-EN 367:1994, UNE-EN 702:1996, and UNE-EN ISO 6942:2002 standard, respectively. The response (variable) of each structure was the time, in seconds, needed to raise its temperature by 24 °C (convective heat) or 12 °C (conductive or radiative heat).
2.2 Experimental plan
Table 2 lists the factors used to examine the response of the studied fabrics to convective, conductive, and radiative heat. Such factors and their levels were chosen in accordance with the experience and knowledge base of a renowned manufacturer of heat protective fabrics.
Factors examined and their levels.
| Factor | Low level (−) | High level (+) |
|---|---|---|
| A. Number of layers | 2 | 4 |
| B. Number of materials in the top layer(s) | 1 | 2 |
| C. Weft density (picks/cm) | 28 | 40 |
| D. Interlocking cell size (cm) | 0.8 | 1.6 |
| E. Interlocking cell shape | Y | Square |
| F. Warp-to-weft ratio | 1:1 | 2:1 |
| G. Yarn metric number | 2/60 | 2/90 |
Crossing the factors in Table 2 would lead to a design comprising 27 = 128 experiments. However, factors F and G were applied during the preparation of the warp beams step, prior to the weaving process, whereas the other factors (A–E) pertained to the weaving process were applied during the weaving step. Therefore, the study was conducted on two types of experimental units: “large” units —warp yarns in the warp beam— and “small” units —corresponding to the woven structures. This method of factor arrangement is known as the “split-plot” design. The present work examined 22 whole plots namely the four warp folders obtained from factors F and G, which are difficult to change— from which each whole plot split into 25 sub-plots or split-plots and finally the 32 structures are obtained from crossing the factors A to E, which are easier to alter.
In order to save resources without detracting from information content, the initial 25 factors were halved into 25−1 with V resolution, where none of the main factors or their interactions was the alias of any other main factor or interaction between two factors. Thus, a total of 64 experiments per response were planned in accordance with the
Experimental plan
| G | − | − | + | + | ||||||
|---|---|---|---|---|---|---|---|---|---|---|
| F | − | + | − | + | ||||||
| No. | No. std | A | B | C | D | E | Time (s) | Time (s) | Time (s) | Time (s) |
| 1 | 17 | − | − | − | − | + | ||||
| 2 | 2 | + | − | − | − | − | ||||
| 3 | 3 | − | + | − | − | − | ||||
| 4 | 20 | + | + | − | − | + | ||||
| 5 | 5 | − | − | + | − | − | ||||
| 6 | 22 | + | − | + | − | + | ||||
| 7 | 23 | − | + | + | − | + | ||||
| 8 | 8 | + | + | + | − | − | ||||
| 9 | 9 | − | − | − | + | − | ||||
| 10 | 26 | + | − | − | + | + | ||||
| 11 | 27 | − | + | − | + | + | ||||
| 12 | 12 | + | + | − | + | − | ||||
| 13 | 29 | − | − | + | + | + | ||||
| 14 | 14 | + | − | + | + | − | ||||
| 15 | 15 | − | + | + | + | − | ||||
| 16 | 32 | + | + | + | + | + | ||||
3 Results and discussion
3.1 Statistical analysis
The effect of each factor was calculated as the difference between the high factor-level average response and the low factor-level average response. The effect of a binary interaction between factors was explained in terms of the difference between the individual effect of one factor at its high level and that of the same factor at the low level of the other. The absolute value of this difference thus provided a measure of the influence of each factor and its interactions.
The magnitude of the effects of the 7 factors and 21 binary interactions studied were represented in a Daniel's (normal probability) plot. Uninfluential factors fell in a straight line near zero. In contrast, active effects departed from the normality line due to the effect of their actually influencing the response of the fabrics rather than being random effects. Figures 4–6 show the normal probability plots for convective, conductive (350 °C), and radiative heat transfer, respectively.

Normal probability plot of the standardized effects on the response to convective heat.
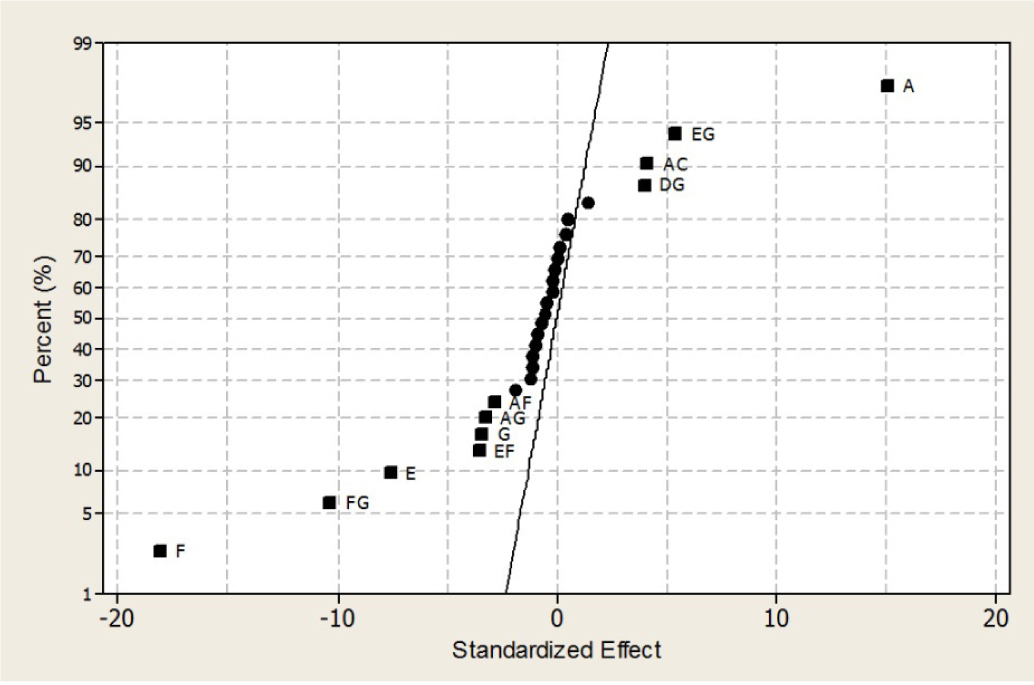
Normal probability plot of the standardized effects on the response to conductive heat.

Normal probability plot of the standardized effects on the response to radiative heat.
ANOVA uses the same numerical calculations for a split-plot design as for any other type of factor design—sums of squares, degrees of freedom, and mean squares. However, the calculated values had to be rearranged in order to identify the two types of error present in the experimental units: the whole-plot error and the sub-plot error. In the absence of replication, high-order interactions were used to construct these errors; however, the whole-plot error could only be constructed from the FG interaction with a single degree of freedom, which led to false statistical significance judgments. In any case, judgments were facilitated by the magnitude of each effect and its contribution to the overall sum of squares.
Tables 4–6 show the ANOVA results for the response of the fabrics to convective, conductive, and radiative heat, respectively. The second column in each table displays the effects and the fourth column, their percentage contribution to total variability. The effects are graphically shown in Figures 7–9.
Figures of merit of the design for the response to convective heat.
| Source | Effects | Sum of squares | Contribution (%) | Df | Mean square | F-ratio | p-value |
|---|---|---|---|---|---|---|---|
| F | −0.2531 | 1.0251 | 1.9021 | 1 | 1.0251 | 0.35 | 0.6599 |
| G | −1.7671 | 49.9672 | 92.7104 | 1 | 49.9672 | 17.16 | 0.1508 |
| WP error (FG) | 0.4265 | 2.91129 | 5.4016 | 1 | 2.91129 | ||
| A | 0.6703 | 7.1891 | 25.9328 | 1 | 7.1891 | 57.73 | 0.0000 |
| B | −0.5296 | 4.4891 | 16.1932 | 1 | 4.4891 | 36.05 | 0.0000 |
| C | 0.2531 | 1.0251 | 3.6980 | 1 | 1.0251 | 8.23 | 0.0061 |
| D | 0.4546 | 3.3078 | 11.9322 | 1 | 3.3078 | 26.56 | 0.0000 |
| E | −0.2109 | 0.7119 | 2.5680 | 1 | 0.7119 | 5.72 | 0.0207 |
| AG | −0.2625 | 1.1025 | 3.9769 | 1 | 1.1025 | 8.85 | 0.0045 |
| BF | 0.3328 | 1.7722 | 6.3928 | 1 | 1.7722 | 14.23 | 0.0004 |
| BG | 0.1968 | 0.6201 | 2.2370 | 1 | 0.6201 | 4.98 | 0.0302 |
| CD | 0.1734 | 0.4812 | 1.7361 | 1 | 0.4812 | 3.87 | 0.0550 |
| DG | −0.1781 | 0.5076 | 1.8312 | 1 | 0.5076 | 4.08 | 0.0490 |
| EG | 0.1593 | 0.4064 | 1.4660 | 1 | 0.4064 | 3.26 | 0.0770 |
| SP error | 6.1017 | 49 | 0.1245 | ||||
| Total | 81.6162 | 63 |
Figures of merit of the design for the response to conductive heat.
| Source | Effects | Sum of squares | Contribution (%) | Df | Mean square | F-Ratio | p-value |
|---|---|---|---|---|---|---|---|
| F | −1.309 | 27.4157 | 73.3709 | 1 | 27.4157 | 3.0548 | 0.33106 |
| G | −0.246937 | 0.9756 | 2.61107 | 1 | 0.9756 | 0.1087 | 0.79720 |
| WP error (FG) | −0.748938 | 8.9745 | 24.0179 | 1 | 8.9745 | ||
| A | 1.09131 | 19.0554 | 53.2869 | 1 | 19.0554 | 259.5 | 0.0000 |
| B | −0.1375 | 0.3025 | 0.84591 | 1 | 0.3025 | 4.12 | 0.0476 |
| E | −0.549875 | 4.8378 | 13.5285 | 1 | 4.8378 | 65.88 | 0.0000 |
| AC | 0.2985 | 1.4256 | 3.9866 | 1 | 1.4256 | 19.41 | 0.0001 |
| AF | −0.204563 | 0.6695 | 1.8722 | 1 | 0.6695 | 9.12 | 0.0039 |
| AG | −0.23625 | 0.8930 | 2.4972 | 1 | 0.8930 | 12.16 | 0.0010 |
| DG | 0.290563 | 1.3508 | 3.7774 | 1 | 1.3508 | 18.40 | 0.0001 |
| EF | −0.255875 | 1.0475 | 2.9293 | 1 | 1.0475 | 14.27 | 0.0004 |
| EG | 0.389937 | 2.4328 | 6.8031 | 1 | 2.4328 | 33.13 | 0.0000 |
| SP error | 3.7450 | 51 | 0.07343 | ||||
| Total | 73.1257 | 63 |
Figures of merit of the design for the response to radiative heat.
| Source | Effects | Sum of squares | Contribution (%) | Df | Mean square | F-Ratio | p-value |
|---|---|---|---|---|---|---|---|
| F | 0.33125 | 1.7556 | 0.2160 | 1 | 1.7556 | 0.3112 | 0.6760 |
| G | −7.09375 | 805.1410 | 99.0897 | 1 | 805.1410 | 142.739 | 0.0531 |
| WP error (FG) | 0.59375 | 5.6406 | 0.6941 | 1 | 5.6406 | ||
| A | 6.40625 | 656.6410 | 49.8717 | 1 | 656.6410 | 95.42 | 0.0000 |
| C | 2.89375 | 133.9810 | 10.1758 | 1 | 133.9810 | 19.47 | 0.0000 |
| AB | 1.26875 | 25.7556 | 1.9561 | 1 | 25.7556 | 3.74 | 0.0583 |
| AG | −2.23125 | 79.6556 | 6.0498 | 1 | 79.6556 | 11.58 | 0.0013 |
| BF | 1.26875 | 25.7556 | 1.9561 | 1 | 25.7556 | 3.74 | 0.0583 |
| CD | −1.20625 | 23.2806 | 1.7681 | 1 | 23.2806 | 3.38 | 0.0714 |
| SP error | 371.5940 | 54 | 6.8813 | ||||
| Total | 2129.2006 | 63 |

Main effects and interaction plot for the response to convective heat.
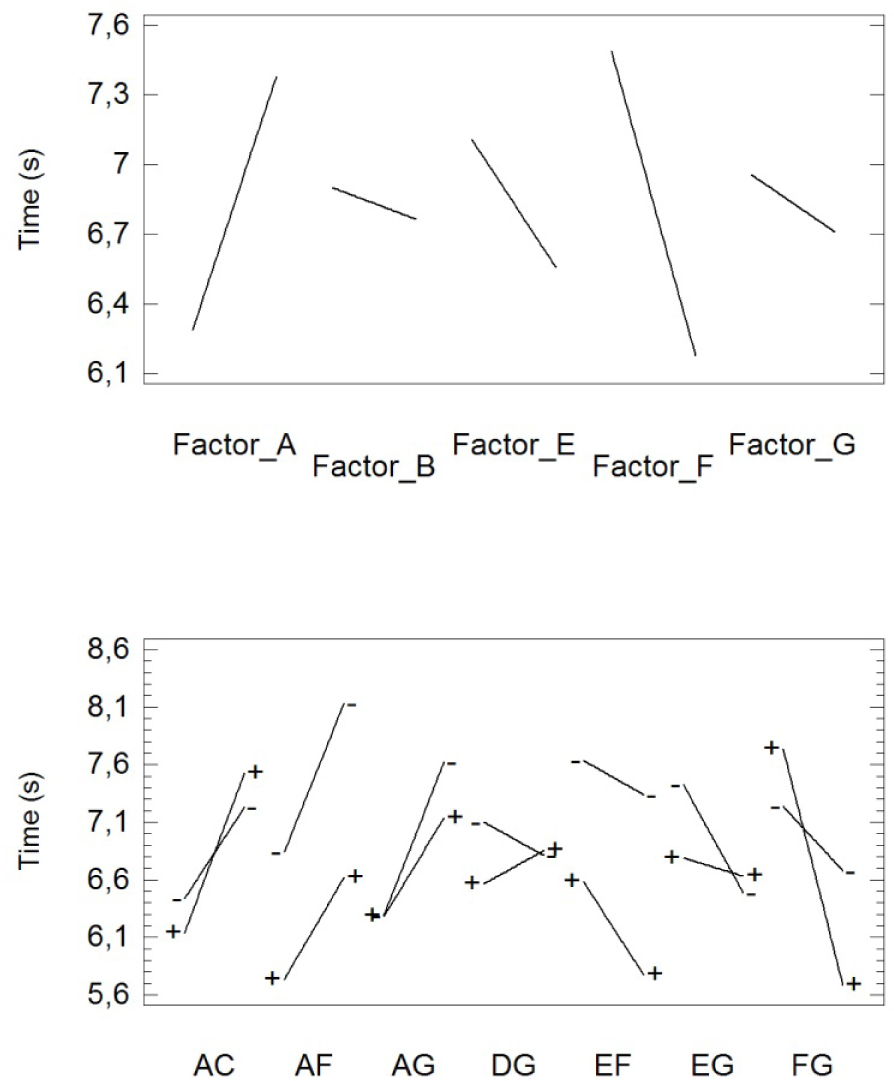
Main effects and interaction plot for the response to conductive heat (350 °C).

Main effects and interaction plot for the response to radiative heat.
3.2 Optimization of multiple thermal protective responses
The effect model for a split-plot design involving 2 whole-plot factors and 5 sub-plot factors is defined by
where μ is the total mean of the results; αi and βj are the main whole-plot effects; θij is the whole-plot error; γk, ψl, τm, ωn, and ϕo are the main sub-plot factors; the 21 combinations of two main effects are binary interactions; and ɛijklmno is the sub-plot error.
Tables 4–6 show the best ANOVA results for the three responses obtained using this design under the assumption of fixed factors. Least-squares regression of the model parameters with quantitative factors spanning the range 1 allowed the responses to be estimated from linear regression models. The coefficients of each model, together with its coefficient of determination as corrected for the particular number of degrees of freedom, are shown in Table 7. Finally, the maximum response of each model falling within the experimental region led to the factor combinations listed in Table 8.
Regression coefficients of the responses to the three types of heat.
| Convective | Conductive | Radiative | |||
|---|---|---|---|---|---|
| Coefficient | Estimate | Coefficient | Estimate | Coefficient | Estimate |
| constant | 6.1125 | Constant | 6.8327 | Constant | 98.0969 |
| A | 0.3351 | A | 0.5456 | A | 3.2031 |
| B | −0.2648 | B | −0.06875 | C | 1.4468 |
| C | 0.1265 | E | −0.2749 | G | −3.5468 |
| D | 0.2273 | F | −0.6545 | AB | 0.6343 |
| E | −0.1054 | AC | 0.1492 | AG | −1.1156 |
| G | −0.8835 | AF | −0.1022 | BF | 0.6343 |
| AG | −0.1312 | AG | −0.1181 | CD | −0.6031 |
| BF | 0.1664 | DG | 0.1452 | ||
| BG | 0.09843 | EF | −0.1279 | ||
| CD | 0.08671 | EG | 0.1949 | ||
| DG | −0.08906 | ||||
| EG | 0.07968 | ||||
| R2 (fitted) | 84.81% | R2 (fitted) | 77.74% | R2 (fitted) | 79.97% |
Optimum factor levels.
| Factor | Low | High | Convective | Conductive | Radiative |
|---|---|---|---|---|---|
| F | −1.0 | 1.0 | −1 | −1 | 1 |
| G | −1.0 | 1.0 | −1 | −1 | −1 |
| A | −1.0 | 1.0 | 1 | 1 | 1 |
| B | −1.0 | 1.0 | −1 | −1 | 1 |
| C | −1.0 | 1.0 | 1 | 0.95 | 1 |
| D | −1.0 | 1.0 | 1 | −1 | −1 |
| E | −1.0 | 1.0 | −1 | −1 | −1 |
A useful approach to the optimization of multiple responses is to use the simultaneous optimizations technique developed by Derringer and Suich [17]. As the objective for the response is a maximum value, the individual desirability function is expressed as follows:
Where ŷ is the estimated response, and the limits “low” and “high” coincide with the extreme observed values. Exponent r is used to select the desired type of transformation; thus, r = 1 (the usual choice) means that desirability increases linearly to the target value.
The desirability function can range from 0 (absolute non-conformance with the target) to 1 (optimal, total conformance).
The individual desirability of each experimental value was used to calculate the total desirability, with the geometric mean weighted on an impact factor I allowing the relative significance of each response to be balanced:
In this work, the values employed were r = 1, an identical impact factor for the three responses (I = 3) and the following experimental ranges: minimum observed time of 4.575 s, 4.835 s, and 88.2 s for convective, conductive, and radiative tests, and a maximum of 9.3 s, 8.702 s, and 113 s, respectively.
The estimated optimum desirability was 0.866385. This value was obtained at the factor levels shown in Table 9 and corresponding optimal responses are 8.7070 s, 8.6680 s, and 106.8060 s for convective, conductive, and radiative heat, respectively.
Optimum level combinations for the responses to the three types of heat.
| Factor | Low | High | Optimum |
|---|---|---|---|
| F | −1.0 | 1.0 | −1 |
| G | −1.0 | 1.0 | −1 |
| A | −1.0 | 1.0 | 1 |
| B | −1.0 | 1.0 | −1 |
| C | −1.0 | 1.0 | 1 |
| D | −1.0 | 1.0 | 1 |
| E | −1.0 | 1.0 | −1 |
4 Discussion
The ANOVA results displayed in Tables 4–6 are summarized in Table 10. As can be seen from this table, factor A and interaction AG were shared by all three types of heat response. The response to convective and radiative heat was especially influenced by factor G (yarn metric number), whereas conductive transfer was more significantly affected by F (ratio of materials in the top layer). Furthermore, the only significant interactions not involving the two whole-plot factors (F and G) were CD for convective heat, AC for conductive heat, and AB for radiative heat.
Significant effects observed in the three types of tests (1: substantial effect; 2: effect significant at the 95% level, and 3: effect significant at the 94% level).
| Effect | Test | ||
|---|---|---|---|
| Convective | Conductive | Radiative | |
| F | – | 1 | |
| G | 1 | – | 1 |
| FG | – | – | – |
| A | 2 | 2 | 2 |
| B | 2 | 2 | – |
| C | 2 | – | 2 |
| D | 2 | – | – |
| E | 2 | 2 | – |
| AB | – | – | 3 |
| AC | – | 2 | – |
| AF | – | 2 | – |
| AG | 2 | 2 | 2 |
| BF | 2 | – | x |
| BG | 2 | – | – |
| CD | 3 | – | – |
| DG | 2 | 2 | – |
| EF | – | 2 | – |
| EG | – | 2 | – |
In fact, as can be seen from the graphs depicted in Figures 7–9, the three responses depended similarly on factor A and interaction AG. Thus, increasing the number of layers from 2 to 4 increased the response time, with a greater increase seen for a metric number of 2/60 than for 2/90. Therefore, the combined effect of layer number and yarn metric number was not additive, but rather synergistic.
As can be seen from Figures 10 and 12, increasing the yarn metric number (i.e., reducing the yarn metric) decreased the response time to convective and radiative heat. In contrast, switching from a 1:1 warp-to-weft ratio to a 2:1 ratio decreased the response time to conductive heat (see Figure 8).

Appearance of the fabrics after the convective heat test. In this case, the optimum fabric for convective heat is sample 78.
The response to convective heat was significantly affected by interaction CD (94% confidence level). Thus, increasing weft density from 28 picks/cm to 40 picks/cm and air cell size from 0.8 cm to 1.6 cm increased the response time (see Figure 10). Fabric response to conductive heat was strongly influenced by interaction AC, with an increase in layer number from 2 to 4 and weft density from 28 to 40 picks/cm strengthen this response (see Figure 8). Finally, as can be seen from Figure 9, the response to radiative heat was improved by the combined effect of factors A and B (i.e., interaction AB), which was significant at the 94% confidence level. Thus, increasing the number of layers from 2 to 4 strengthened the response due to the effect of the top layer consisting of two different materials rather than just one.
Also apparent from the results is that whereas the response to convective (flame) heat was significantly influenced by all sub-plot factors (A–E), while conductive heat was affected by three factors (A, B, and E) and radiative heat by only two factors (A and C).
As can be seen from Figure 7, the response time increased with the increase of (a) the number of layers from 2 to 4, (b) the weft density from 28 picks/cm to 40 picks/cm, and (c) the cell size from 0.8 cm to 1.6 cm. In addition, the response time to convective heat decreased with (a) use of two different materials in the outer layer(s) rather than a single one, and (b) switching the interlocking cells from the Y-shape to the square-shape.
The response to conductive heat was markedly influenced by fabric material and interlocking cell shape compared to radiative heat that is affected by weft density. As can be seen from Figure 8, the response time to conductive heat was shorter with a single material (AR) than with two (CV-AR) in the outer layer, and also with Y-shaped cells rather than with square cells. Likewise, increasing the weft density increased the response time to radiative heat.
The response to convective heat was additionally influenced by interactions BF, BG, and DG (Figure 7). Regarding the BF interaction, this response decreased with an increasing number of materials in the top layer —since the top layer with two materials contained, in fact, less aramid and more markedly with a 1:1 warp-to-weft ratio than with a 2:1 ratio. For the DG interaction, the response time to convective heat was longer with a cell size of 0.8 cm than with one of 1.6 cm, especially with higher yarn count —smaller metric number. Regarding interaction CD, the response time to convective heat increased with increasing weft density and more markedly with a cell size of 0.8 cm compared to one of 1.6 cm.
The response to conductive heat was additionally influenced by interactions AF, DG, EF, and EG (Figure 8). For interaction AF, increasing the number of layers from 2 to 4 increased the response time to a greater extent with a 1:1 warp-to-weft ratio than with a 2:1 ratio. In terms of DG, a cell size of 0.8 cm led to an increased response time, with this increase being greater with thicker (Nm 2/60) than with thinner (Nm 2/90) yarns. However, for a cell size of 1.6 cm, the response time was independent of the fabric metric number. Finally, switching from Y-shaped to square-shaped interlocking cells decreased the response time to a much greater extent with a 2:1 ratio than with a 1:1 ratio (EF interaction), and achieved the same with thicker yarns than with thinner yarns (EG interaction).
The response to radiative heat was also influenced by interaction BF. As can be seen from Figure 9, switching from a single material in the outer layer(s) to two materials increased the response time with a 2:1 warp-to-weft ratio but gets decreased with a 1:1 ratio.
Table 11 lists the optimum levels for the different factors. Analysis of these values reveals that A, C, E, and G were identical for all three level combinations.
Optimum factor levels for the individual response to each type of heat.
| Factor | Low | High | Convective | Conductive | Radiative |
|---|---|---|---|---|---|
| A | 2 | 4 | 4 | 4 | 4 |
| B | 1 | 2 | 1 | 1 | 2 |
| C | 28 | 40 | 40 | 4 | 40 |
| D | 0.8 | 1.6 | 1.6 | 0.8 | 0.8 |
| E | Y | o | Y | Y | Y |
| F | 1:1 | 2:1 | 1:1 | 1:1 | 2:1 |
| G | 2/60 | 2/90 | 2/60 | 2/60 | 2/60 |
Figure 10 shows the results of the convective heat test carried out on woven structures designed in accordance with these optimum values: sample 78 presents the optimal for convective heat, sample 70 for conductive heat, and 108 for radiative heat. The physical properties for these optimum fabrics are shown in Table 12.
Mechanical properties of optimum samples.
| Sample | Direction | Tensile testing | Tear test | Dimensional stability | Thickness (mm) | Areal weight (gr/m2) |
|---|---|---|---|---|---|---|
| Force max (N) | Force max (N) | After five washings (%) | ||||
| 70 | Warp | 974.00 | 194.30 | 4.41 | 1.23 | 287.2 |
| Weft | 988.40 | 192.80 | 4.79 | |||
| 78 | Warp | 936.70 | 210.30 | 3.74 | 1.31 | 287.8 |
| Weft | 971.00 | 200.20 | 4.01 | |||
| 104 | Warp | 995.10 | 168.30 | 2.41 | 1.11 | 305.6 |
| Weft | 1,024.60 | 181.70 | 3.33 |
Dealing simultaneously with the three types of response lead to the optimal combination of factors presented in Table 13, which maximizes the desirability function.
Optimum factor levels for the simultaneous response to the three types of heat.
| Factor | Low | High | Optimum |
|---|---|---|---|
| A | 2 | 4 | 4 |
| B | 1 | 2 | 1 |
| C | 28 | 40 | 40 |
| D | 0.8 | 1.6 | 1.6 |
| E | Y | o | Y |
| F | 1:1 | 2:1 | 1:1 |
| G | 2/60 | 2/90 | 2/60 |
5 CONCLUSIONS
The present work has examined the influence of weaving variables with a view to producing improved heat protective fabrics, which effectively respond to convective, conductive, and radiative heat. To this end, we assessed the effects of individual factors and their interactions. Performing experiments simultaneously with the three types of heat led to the identification of an optimal fabric structure. This structures is characterized by the use of four fabric layers, with a single material (meta-aramid) in the outer layer(s), a weft density of 40 picks/cm and Y-shaped interlocking cells of 1.6 cm in size, obtained with a 1:1 AR:CV-AR warp, weft ratio (50% AR: 50% CV-AR), and yarns of 2/60 metric number.
The results thus obtained allow the following conclusions to be drawn:
The fabrics with square air cells provided poorer heat protection than those with Y-shaped cells, due to the effect of the former on preventing free circulation of air between layers, and hence, the air temperature being more easily transferred as a result. This effect was more noticeable in thicker yarns.
For fabrics of equal weft density, arranging yarns in different layers resulted in improved protection thanks to the layer closest to the heat source being more distant from the measuring point.
As expected, thicker yarns provided a higher protection owing to the obvious increased amount of fireproof material in the fabric, especially AR yarns. Similarly, the increased number of picks led to the same conclusion.
Increasing layer number, weft density, interlocking cell size, and yarn thickness all efficiently hindered heat propagation.
The presence of aramid alone in the outer fabric layer(s) proved more heat protective than that of a mixture of yarns (aramid–viscose FR/aramid).
Layer number and the interaction of this factor with yarn count significantly influenced fabric response to the three types of heat. Thus, response times increased with increasing number of layers, especially at a higher yarn count.
The results of this study can be useful for the design of improved heat-technical protective clothing.
ACKNOWLEDGMENTS
The author H. Ventura is a Serra-Húnter fellow.
References
[1] Zhiying, C., Yanmin, W., Weiyuan, Z. (2010). Thermal protective performance and moisture transmission of firefighter protective clothing based on orthogonal design. Jounral of Industrial Textiles, 39(4), 347–356.10.1177/1528083709347126Search in Google Scholar
[2] Benisek, L., Edmondson, G. K., Phillips, W. A. (1979). Protective clothing—Evaluation of wool and other fabrics. Textile Research Journal, 49(4), 212–221.10.1177/004051757904900405Search in Google Scholar
[3] Chapman, A. C., Miller, G. (1980). Fibres, fabrics and finishes for FR workwear in Europe. Journal of Industrial Textiles, 10(1): 26–34.10.1177/152808378001000104Search in Google Scholar
[4] Gauthier, M. M., Deanin, R. D., Pope, C. J. (1981). Manmade fibres: Flame retardance and flame redardants. Polymer Plastics Technology and Engineering, 16(1), 1–39.10.1080/03602558108070013Search in Google Scholar
[5] Holcombe, B. V. (1983). The heat related properties of protective clothing fabrics. Fire Safety Journal, 6(2), 129–141.10.1016/0379-7112(83)90058-9Search in Google Scholar
[6] Lee Y. M., Barker R. L. (1987). Thermal protective performance of heat-resistant fabrics in various high intensity heat exposures. Textile Research Journal, 57(3), 123–132.10.1177/004051758705700301Search in Google Scholar
[7] Mehta, P. N. (1980). Engineered wool industrial protective clothing. Textile Research Journal, 50(3), 185–193.10.1177/004051758005000307Search in Google Scholar
[8] Perkins, R. M. (1979). Insulative values of single-layer fabrics for thermal protective clothing. Textile Research Journal, 49(4), 202–205.10.1177/004051757904900404Search in Google Scholar
[9] Sirvydas, P. A., Nadzeikienė, J., Milašius, R., Eičinas, J., Kerpauskas, P. (2006). The role of the textile layer in the garment package in suppressing transient heat exchange processes. Fibres Textiles East Europe, 14, 2(56), 55–58.Search in Google Scholar
[10] Ding, D., Tang, T., Song, G., McDonald, A. (2011). Characterizing the performance of a single-layer fabric system through a heat and mass transfer model – Part I: Heat and mass transfer model. Textile Research Journal, 81, 398–411.10.1177/0040517510388547Search in Google Scholar
[11] Shalev, I., Barker, R. L. (1983). Analysis of heat transfer characteristics of fabrics in an open flame exposure. Textile Research Journal, 53(8), 475–482.10.1177/004051758305300806Search in Google Scholar
[12] Shalev, I., Barker, R. L. (1984). Protective fabrics: A comparison of laboratory methods for evaluating thermal protective performance in convective/radiant exposures. Textile Research Journal, 54(10), 648–654.10.1177/004051758405401003Search in Google Scholar
[13] Abdel-Rehim, Z. S., Saad, M. M., El-Shakankery, M., Hanafy, I. (2006). Textile fabrics as thermal insulators. AUTEX Research Journal, 6(3), 148–161.10.1515/aut-2006-060305Search in Google Scholar
[14] Moo, Y., Barker, R. L. (1987). Thermal protective performance of heat-resistant fabrics in various high intensity heat exposures. Textile Research Journal, 57(3), 123–132.10.1177/004051758705700301Search in Google Scholar
[15] Mandal, S., Song, G., Ackerman, M., Paskaluk, S., Gholamreza, F. (2013). Characterization of textile fabrics under various thermal exposures. Textile Research Journal, 83(10), 1005–1019.10.1177/0040517512461707Search in Google Scholar
[16] Padaki, N. V., Alagirusamy, R., Deopura, B. L., Fangueiro, R. (2010). Studies on preform properties of multilayer interlocked woven structures using fabric geometrical factors. Journal of Industrial Textiles, 39(4), 327–346.10.1177/1528083709349885Search in Google Scholar
[17] Derringer, G. C., Suich, R. (1980). Simultaneous optimization of several responses. Journal of Quality Technology, 12(4), 214–219.10.1080/00224065.1980.11980968Search in Google Scholar
© 2021 Ferran Parés et al., published by Sciendo
This work is licensed under the Creative Commons Attribution 4.0 International License.
Articles in the same Issue
- Durable Wash-Resistant Antimicrobial Treatment of Knitted Fabrics
- Estimation of Seams in Paraglider Wing
- Conductive Heat Transfer Prediction of Plain Socks in Wet State
- Fabrication and Characterization of Fibrous Polycaprolactone Blended with Natural Green Tea Extracts Using Dual Solvent Systems
- Preliminary Experimental Investigation of Cut-Resistant Materials: A Biomimetic Perspective
- Effect of Lycra Weight Percent and Loop Length on Thermo-physiological Properties of Elastic Single Jersey Knitted Fabric
- Experimental Investigation of the Wettability of Protective Glove Materials: A Biomimetic Perspective
- Mechanical Properties of Composites Reinforced with Technical Embroidery Made of Flax Fibers
- Approach to Performance Rating of Retroreflective Textile Material Considering Production Technology and Reflector Size
- A Fabric-Based Integrated Sensor Glove System Recognizing Hand Gesture
- Influence of Multilayer Interlocked Fabrics Structure on Their Thermal Performance
- Texture Representation and Application of Colored Spun Fabric Using Uniform Three-Structure Descriptor
- Investigation of Twist Waves Distribution along Structurally Nonuniform Yarn
- Smart Textile for Building and Living
- Determination of Sewing Thread Consumption for 602, 605, and 607 Cover Stitches Using Geometrical and Multi-Linear Regression Models