Statistical Analysis of Standard Allowed Minute on Sewing Efficiency in Apparel Industry
-
Mulat Alubel Abtew
 ,
Annu Kumari
,
Annu Kumari

Abstract
Apparel industry is not only one of the oldest, largest, labor-intensive, and most global industries but also the typical “starter” industry for countries engaged in export-orientated industrialization. To achieve such dreams, the industry has looked over different inter-dependable factors while producing different products. In this study, an effort has been made to establish a correlation between standard allowed minutes (SAMs) and efficiency of sewing section using different variables, including production rate, number of workstations, and operation breakdown, having a differential impact on both the selected variables. All the empirical analyses were planned in a vertically integrated textile company called Almeda Textile Private Limited Company (PLC), Ethiopia, starting from the basic product category (such as V-neck shirt) up to complicated workwear including military clothing and federal police uniforms of Ethiopia. The Pearson correlation coefficient method was chosen to find the relationship between bivariate linearly scaled variables using Statistical Package for Social Science (SPSS) software. The expected outcome will help in identifying the type of correlation and its significant level as well as its impact on the overall productivity of the sewing section which eventually leads to fulfilling the mission of attaining sustainable production capacity of the mentioned vertically integrated manufacturing company.
1 Introduction
Standard allowed minute (SAM) or standard minute value (SMV) is used to measure the task or work content of a garment. It can be described as follows: when a normal operator can complete a task within the allowed time (minutes) at his 100% efficiency. For the past many decades, scientists, researchers, and apparel technicians did investigations on how much job has been allowed to do by following the standard method. According to the study, minute value has been defined for each movement needed to accomplish a job. SAM values for basic products, such as T-shirt, formal shirt, formal trouser, or jacket, can be estimated primarily to speed up the line balancing process. An estimated SAM helps in capacity planning of the factory, calculating the requirement of machinery and even helps to estimate CM (cut-and-make) costing of a garment. Like SAM, the efficiency of a production line/batch/section is one of the most important parameters for a factory. Daily line efficiency shows line performance. A cumulative data of every line which are running in the industry will give total production efficiency. Line output varies depending on the line efficiency. When a line performs at lower efficiency than the standard (100%), it will produce fewer units in a day compared to what line could make at 100% efficiency. However, the factory still spends the same amount of money for salary whether the line performs at 100% efficiency or less. Therefore, per unit cost will increase when the line performs at lower efficiency. To overcome this problem and enhance the overall production in the garment industry, an investigation of the correlation between SAM and production efficiency will provide fruitful results to enhance productivity.
2 Literature review
There was not a lot of work reported in the direction of correlation between two selected variables, whereas the background information of the research and review of the previous researches similar to the current study are presented in this section. SMV is a numerical value that represents the standard time of a process or operation in a standard environment for standard worker. SMV is calculated by adding the allowances to the basic time. There are many techniques that have been developed to establish SMV [1]. Bandara et al. suggested a novel approach for time management in the garment industry. They propose transparent numerical value based on the accepted standard time (SMV) for every operation, irrespective of the place and the person of the place of manufacture. They started their investigation by identifying the different internal and external factors that affect the desired SMV levels. This helps them to measure the relationship between firm economic performance and the SMV and to find out remedial measures to achieve desired SMV level. The study showed a positive relationship between firm economic performance and SMV. When a company can save 1 minute from a single product, it could gain high profit annually if other conditions are constant with time. The SMV has improved cycle time which enhances the employee performance as well as the economic performance of the company [2]. Efficiency signifies a level of performance that describes a process that uses the lowest amount of inputs to create the greatest amount of outputs. Efficiency relates to the use of all inputs in producing any given output, including personal time and energy. Efficiency is a measurable concept that can be defined by determining the ratio of useful output to total input. It minimizes the waste of resources such as physical materials, energy, and time, while successfully achieving the desired output [3]. Mohammad et al. studied the calculation of SMV of polo shirt. An experimental investigation for the distribution of SMV for each and every operation required for making a polo shirt provides a clear and detailed concept to determine line balancing, machine requirements, and manpower allocation for setting a definite target within a reasonable efficiency. They also investigated the effective layout model of polo shirt by using proper line balancing systems. Unnecessary and nonvalue-added operation, for example, manual thread-trimming process (normally operated manually by helper), was discarded by using auto trimmer installed along with the machine. The study shows that this balanced layout model has brought a better synchronization among man–machine and materials to increase the efficiency [4]. Rahman et al. studied the calculation of SMV of a T-shirt by determining the manpower and machine allocation for a particular target. An experimental investigation was carried out to determine the distribution of SMV for each and every operation required for making a T-shirt. Moreover, it also provides a clear and detailed concept to determine the proper line balancing along with machine requirements, manpower allocation, and operational sequence of the manufacturing process for setting a definite target within a reasonable efficiency. This study provides a detailed discussion of the distribution of SMV of a T-shirt by work study which will assist to minimize the SMV for having a better synchronization with man, machine, materials, and methods to achieve higher efficiency. A general overview of the efficient production method to make a T-shirt is given in this paper. To achieve better quality and cost-effective production, standard operation procedure (SOP) is followed. By following SOP, the unnecessary operations could be identified and waste is reduced. Moreover, the rejection rate will be gradually reduced to the tolerable level and even to zero values [5]. Bing et al. illustrate the formulas of deduction of knitted garment cutting time by doing correlation analysis with the help of Statistical Package for Social Science (SPSS) software after analyzing the relevant cutting time determinants. The research tried to predict the knitting garment cutting time as preliminary using the standard cutting operation time formula [6]. Hossain et al. tried to find out the relationship between the growth rate of the garment export and the macroeconomic variables and conducted three types of analyses, i.e., quantitative analysis, qualitative analysis, and beta concept. Quantitative analysis has covered graphical presentation and multiple regression analysis which only provides graphical presentation on an overall idea about the relationship between variables. In the case of regression analysis, one dependent variable (i.e., the growth rate of the garment industry) and seven independent variables (the growth rate of real gross domestic product [GDP], the unemployment rate, inflation rate, interest rate, level of the stock market, exchange rate) are used. Independent variables are variables that are expected to influence the dependent variable individually or in the combined conditions. For example, according to their different regression analyses, it has been observed that these independent variables affect the growth rate of garment export. Specifically, it has been found that about 70% variations in the growth rate of garment export were affected by these variables. Finally, they compute the individual effect through the developed equation and conclude that no individual variable affects garment export to a large extent. However, when they are combined, they can influence the growth rate of garment export. [7]. One of the researches tried to highlight the causes of various garment production problems through surveying different manufacturing industries. Based on the result, the production lines to tackle these problems that will help the top management for action and also improve the efficiency of the production were proposed [8]. Rajput et al. also investigated on improving the productivity and quality work through different techniques including time study, visual management, and work standard techniques. During investigation, first, the factors that affect the productivity and quality were identified. Then, correction actions were made to reduce such factors to achieve quality as well as the production in sewing line. They claimed that, through implementing the above-stated tools, the efficiency was significantly increased by 8.07% [9].
3 Methodology
The correlation between SAM and sewing efficiency was derived using IBM SPSS Statistics software using different variables such as a number of workstations used, operational breakdown, and daily production rate. To identify the relationship between selected variables, various garment styles were chosen depending upon their simplicity to complexity in terms of construction, which includes polo shirts for man and woman, Ethiopian federal/military shirt, basic shirt, and V-neck T-shirt. A vertically integrated manufacturing industry, Almeda Textile Private Limited Company (PLC), was chosen for the execution of this research. Table 1 summarizes the SAM and sewing efficiency values for 25 days (considered 1 month excluding Sundays and 1 day as a random holiday) for above-mentioned product ranges.
SAM and efficiency of various selected categories
| No. of days | Men's polo shirt | Women's polo shirt | Basic shirt | Federal/military shirt | V-neck shirt | |||||
|---|---|---|---|---|---|---|---|---|---|---|
 |  |  |  |  | ||||||
| Sewing efficiency (%) | SAM gained | Sewing efficiency (%) | SAM gained | Sewing efficiency | SAM gained | Sewing efficiency (%) | SAM gained | Sewing efficiency | SAM gained | |
| 1 | 54 | 31.27 | 49 | 33.70 | 33.3 | 14.27 | 25.76 | 90.24 | 57.5 | 6.54 |
| 2 | 52 | 32.06 | 45 | 36.88 | 27.2 | 17.50 | 32.78 | 70.90 | 65.3 | 5.77 |
| 3 | 44 | 37.80 | 48 | 34.60 | 33.2 | 14.30 | 42.77 | 54.35 | 66.1 | 5.70 |
| 4 | 45 | 36.85 | 39 | 42.72 | 36.3 | 13.09 | 40.99 | 56.70 | 63.9 | 5.89 |
| 5 | 41 | 41.14 | 43 | 38.54 | 43.0 | 11.06 | 44.53 | 52.21 | 61.9 | 6.08 |
| 6 | 59 | 28.35 | 53 | 31.41 | 33.8 | 14.08 | 44.84 | 51.84 | 61.7 | 6.10 |
| 7 | 56 | 29.78 | 52 | 31.54 | 33.8 | 14.06 | 49.49 | 46.97 | 60.9 | 6.19 |
| 8 | 43 | 39.22 | 53 | 31.41 | 40.3 | 11.79 | 51.19 | 45.41 | 64.7 | 5.82 |
| 9 | 52 | 32.24 | 60 | 27.67 | 38.5 | 12.33 | 54.20 | 42.89 | 66.6 | 5.65 |
| 10 | 54 | 31.27 | 48 | 34.72 | 23.7 | 20.06 | 55.70 | 41.73 | 74.8 | 5.03 |
| 11 | 48 | 34.76 | 36 | 45.60 | 21.5 | 22.11 | 57.16 | 40.66 | 56.5 | 6.66 |
| 12 | 47 | 35.45 | 46 | 35.65 | 20.8 | 22.80 | 56.70 | 41.00 | 64.6 | 5.83 |
| 13 | 48 | 34.73 | 48 | 34.41 | 25.8 | 18.45 | 57.68 | 40.30 | 74.2 | 5.07 |
| 14 | 63 | 26.62 | 44 | 37.63 | 29.7 | 16.02 | 56.70 | 41.00 | 76.2 | 4.94 |
| 15 | 57 | 29.27 | 39 | 42.89 | 27.3 | 17.41 | 59.38 | 39.14 | 80.4 | 4.68 |
| 16 | 64 | 26.28 | 38 | 43.50 | 29.1 | 16.31 | 55.03 | 42.24 | 76.2 | 4.94 |
| 17 | 64 | 26.16 | 35 | 47.25 | 25.3 | 18.75 | 55.70 | 41.73 | 80.4 | 4.68 |
| 18 | 56 | 30.14 | 36 | 46.32 | 26.1 | 18.24 | 56.70 | 41.00 | 78.2 | 4.81 |
| 19 | 63 | 26.74 | 43 | 38.65 | 26.3 | 18.04 | 58.36 | 39.83 | 78.2 | 4.82 |
| 20 | 47 | 35.43 | 45 | 36.68 | 29.6 | 16.05 | 57.68 | 40.30 | 76.2 | 4.94 |
| 21 | 46 | 36.14 | 47 | 35.05 | 30.1 | 15.77 | 58.02 | 40.07 | 78.7 | 4.78 |
| 22 | 50 | 33.79 | 45 | 36.72 | 29.1 | 16.31 | 56.31 | 41.28 | 78.9 | 4.77 |
| 23 | 57 | 29.56 | 44 | 37.39 | 25.3 | 18.75 | 59.75 | 38.91 | 85.8 | 4.38 |
| 24 | 59 | 28.21 | 46 | 35.91 | 27.5 | 17.26 | 60.80 | 38.23 | 76.2 | 4.94 |
| 25 | 60 | 27.89 | 52 | 31.63 | 25.8 | 18.45 | 60.80 | 38.23 | 65.2 | 5.77 |
SAM, standard allowed minute.
4 Results and discussion
The relationship between efficiency and SAM values for different product categories is discussed in the following sections. The pictures of the different products are shown in Appendix I. Pearson correlation coefficient was selected for correlation analysis after checking the scatter plot of the variables. All the interpretations were carried out at the 0.01 level (two-tailed). The total product categories as well as their overall relationship were analyzed individually. The illustration and interpretations obtained from SPSS software are also presented in each category.
4.1 Men's polo shirt
Mean and standard deviation values for men's polo shirt
| Variables | Descriptive statistics | N | |
|---|---|---|---|
| Mean | Standard deviation | ||
| SAM gained | 32.045 | 4.2948 | 25 |
| Sewing efficiency | 53.160 | 7.0278 | 25 |
SAM, standard allowed minute.
Pearson correlation coefficient of SAM and sewing efficiency of men's polo shirt
| Correlated variables | Correlations | ||
|---|---|---|---|
| SAM gained | Sewing efficiency | ||
| SAM gained | Pearson correlation | 1 | −0.991** |
| Sig. (two-tailed) | 0.000 | ||
| N | 25 | 25 | |
| Sewing efficiency | Pearson correlation | −0.991** | 1 |
| Sig. (two-tailed) | 0.000 | ||
| 25 | 25 | ||
- **
Correlation is significant at the 0.01 level (two-tailed).
SAM, standard allowed minute.
Figure 1 shows the highest value of sewing efficiency of men's polo shirt at 63%, and the corresponding SAM value was 26, which indicates the negative behavior of the variables.

SAM and sewing efficiency of men's polo shirt. SAM, standard allowed minute.
Rule of thumb was used to calculate the relationship between different variables:
where N represents the sample size. For men's polo shirt, the value of Pearson coefficient = −0.991, which gives an indication of the strong relationship among variables. The absolute value of r = 0.991 ≥ 2/√25 interprets the correlation between variables.
4.2 Women's polo shirt
Mean and standard deviation values for women's polo shirt
| Variables | Descriptive statistics | N | |
|---|---|---|---|
| Mean | Standard deviation | ||
| SAM gained | 37.139 | 5.1012 | 25 |
| Sewing efficiency | 45.360 | 6.0888 | 25 |
SAM, standard allowed minute.
Pearson correlation coefficient of SAM and sewing efficiency of women's polo shirt
| Correlated variables | Correlations | ||
|---|---|---|---|
| SAM gained | Sewing efficiency | ||
| SAM gained | Pearson correlation | 1 | −0.985** |
| Sig. (two-tailed) | 0.000 | ||
| N | 25 | 25 | |
| Sewing efficiency | Pearson correlation | −0.985** | 1 |
| Sig. (two-tailed) | 0.000 | ||
| 25 | 25 | ||
- **
Correlation is significant at the 0.01 level (two-tailed).
SAM, standard allowed minute.
Figure 2 indicates the SAM range from 25 to 50 and corresponding efficiency from 35% to 60%, which were nearer to men's polo shirt, due to almost similar styling of two products except for placket attachment. There was some sudden drop in SAM gained due to the learning curve of the workers. When we implemented the rule of thumb, |0.985| ≥ 0.4, which estimated the strong, negative relationship among variables.

SAM and sewing efficiency of women's polo shirt. SAM, standard allowed minute.
4.3 Basic shirt
Mean and standard deviation values for basic shirt
| Variables | Descriptive statistics | N | |
|---|---|---|---|
| Mean | Standard deviation | ||
| SAM gained | 16.530 | 2.9785 | 25 |
| Sewing efficiency | 29.700 | 5.6384 | 25 |
SAM, standard allowed minute.
Pearson correlation coefficient of SAM and sewing efficiency of basic shirt
| Correlated variables | Correlations | ||
|---|---|---|---|
| SAM gained | Sewing efficiency | ||
| SAM gained | Pearson correlation | 1 | −0.976** |
| Sig. (two-tailed) | 0.000 | ||
| N | 25 | 25 | |
| Sewing efficiency | Pearson correlation | −0.976** | 1 |
| Sig. (two-tailed) | 0.000 | ||
| 25 | 25 | ||
- **
Correlation is significant at the 0.01 level (two-tailed).
SAM, standard allowed minute.
Simplicity and repetitiveness of particular styling made it follow the pattern as shown in Figure 3. In addition, as summarized in Table 7, the Pearson correlation coefficient based on the rule of thumb (|0.976|≥0.4), a strong negative relationship does exist between variables.

SAM and sewing efficiency of basic shirt. SAM, standard allowed minute.
4.4 Federal/military shirt
Mean and standard deviation values for SAM and efficiency of federal/military shirt
| Variables | Descriptive statistics | N | |
|---|---|---|---|
| Mean | Standard deviation | ||
| Sewing efficiency | 61.851 | 15.6318 | 25 |
| SAM gained | 38.188 | 16.3353 | 25 |
SAM, standard allowed minute.
Pearson correlation coefficient of SAM and sewing efficiency of federal/military shirt
| Correlated variables | Correlations | ||
|---|---|---|---|
| Sewing efficiency | SAM gained | ||
| Sewing efficiency | Pearson correlation | 1 | −0.935** |
| Sig. (two-tailed) | 0.000 | ||
| N | 25 | 25 | |
| SAM gained | Pearson correlation | −0.935** | 1 |
| Sig. (two-tailed) | 0.000 | ||
| 25 | 25 | ||
- **
Correlation is significant at the 0.01 level (two-tailed).
SAM, standard allowed minute.
As summarized in Table 9, Pearson correlation coefficient r = −0.935; in this case, the value of absolute r is 0. 935, which is greater than 2/√25, i.e., 0.4. This indicated that the relationship does exist between the variables. Figure 4 and the negative value of the Pearson correlation coefficient value (Table 9) indicate that the SAM gained increases as the values for the efficiency is decreased. The highest value of SAM gained was 87.94 which gave the lowest efficiency of 24.25% in the initial 2–3 days. This can be attributed to the learning phase of the workers. The SAM gained values were found highest for the federal/military shirt due to the complexity of design which leads to an increase in a number of work stations.

SAM and sewing efficiency of federal/military shirt. SAM, standard allowed minute.
4.5 V-neck shirt
Mean and standard deviation values for SAM and efficiency of V-neck shirt
| Variables | Descriptive statistics | N | |
|---|---|---|---|
| Mean | Standard deviation | ||
| SAM gained | 5.390 | 0.6488 | 25 |
| Sewing efficiency | 70.782 | 8.3149 | 25 |
SAM, standard allowed minute.
Pearson correlation coefficient of SAM and sewing efficiency of V-neck shirt
| Correlated variables | Correlations | ||
|---|---|---|---|
| SAM gained | Sewing efficiency | ||
| SAM gained | Pearson correlation | 1 | −0.995** |
| Sig. (two-tailed) | 0.000 | ||
| N | 25 | 25 | |
| Sewing efficiency | Pearson correlation | −0.995** | 1 |
| Sig. (two-tailed) | 0.000 | ||
| 25 | 25 | ||
- **
Correlation is significant at the 0.01 level (two-tailed).
SAM, standard allowed minute.
In this comparison, there were strong, negative correlations between variables, verified with the rule of thumb (|0.995|≥0.4). As shown in Figure 5, the efficiency reached its peak (85%) among all product types due to less number of work stations used to construct a particular style.

SAM and sewing efficiency of V-neck shirt. SAM, standard allowed minute.
4.6 Combined product categories
Mean and standard deviation values for SAM and efficiency of all selected product categories
| Variables | Descriptive statistics | N | |
|---|---|---|---|
| Mean | Standard deviation | ||
| Sewing efficiency | 20.40 | 28.075 | 125 |
| SAM gained | 27.48 | 15.953 | 125 |
SAM, standard allowed minute.
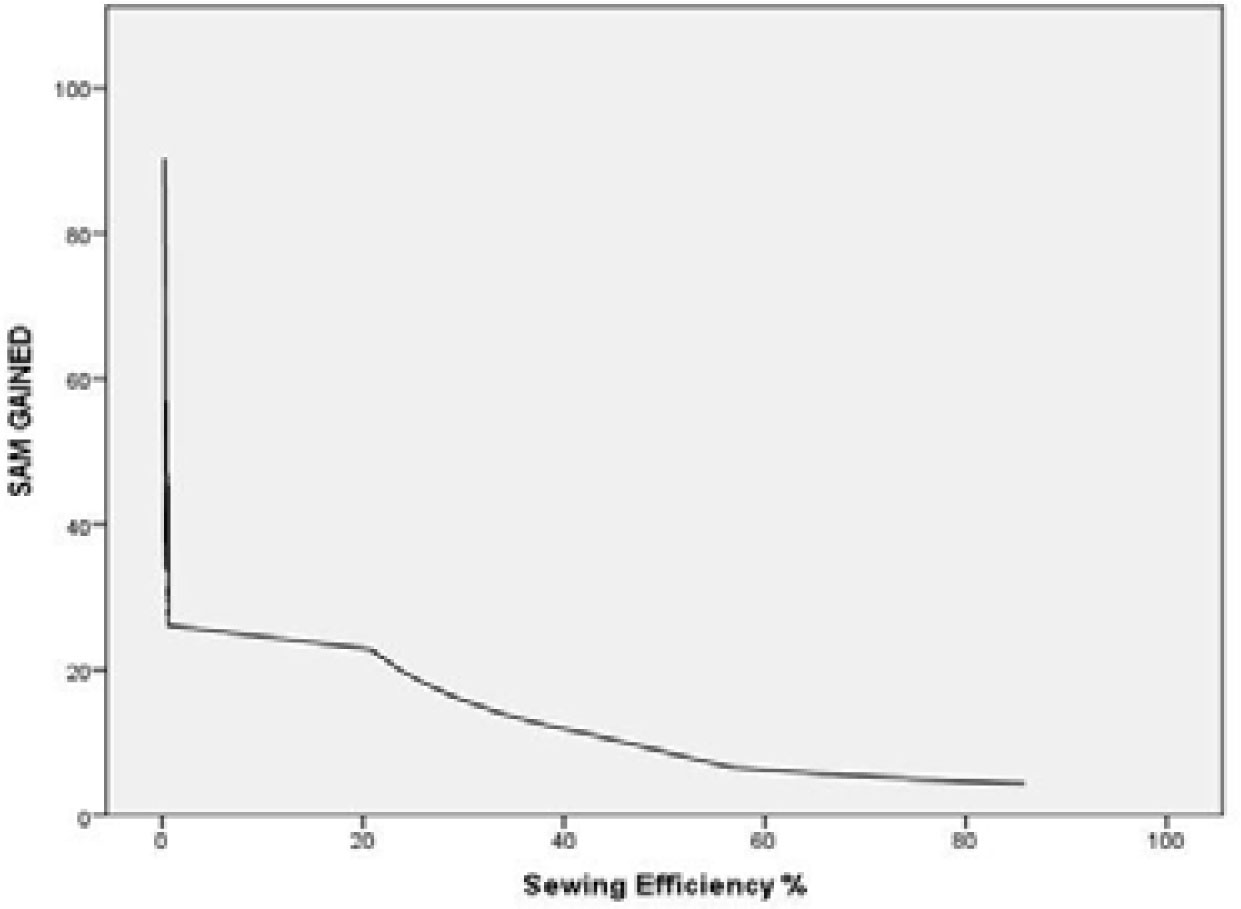
From Table 13, r = −0.853 signifies the medium and negative correlation between the variables. |0.853| ≥ 0.178 indicates that the relationship does exist between the variables. Therefore, it can be concluded that there exists a negative and strong correlation for selected categories. Moreover, Figure 6 denotes the overall SAM gained and their corresponding efficiency values for chosen products. The straight line represents no change in the efficiency initially at line setup time, except for simple products such as V-neck shirt and basic shirt. At SAM range from 4 to 25, efficiency keeps on increasing with respect to SAM values of various products. The upper limit of SAM is 90.24 for federal/military shirt and the lower limit is 4.38 for V-neck shirt due to the reason of sewing complexity for the styles as well as absenteeism of standard operators.
Pearson correlation coefficient of SAM and sewing efficiency of all selected product categories
| Correlated variables | Correlations | ||
|---|---|---|---|
| Sewing efficiency | SAM gained | ||
| Sewing efficiency | Pearson correlation | 1 | −0.853** |
| Sig. (two-tailed) | 0.000 | ||
| N | 125 | 125 | |
| SAM gained | Pearson correlation | −0.853** | 1 |
| Sig. (two-tailed) | 0.000 | ||
| 125 | 125 | ||
- **
Correlation is significant at the 0.01 level (two-tailed).
SAM, standard allowed minute.
Cumulative SAM and sewing efficiency of all selected product categories. SAM, standard allowed minute.
5 Conclusion
The formulated research addresses the relationship between SAM and sewing room efficiency, in which the relationship was strong and negative for individual product categories. The observed data indicate that the achieved sewing room efficiency was found higher for basic products such as V-neck and T-shirt and lowest for complicated garments such as federal/military shirt. The interpretation designates for “Almeda Textile PLC” in a need of more skilled labors for complicated designs. For collective product categories, a negative and strong correlation exists between SAM and efficiency. It was concluded that for labor-intensive industries, the complexity of the product designs becomes one of the major factors affecting productivity. Moreover, workers’ performance has played a role on the productivity of the garment. It was also evident that the selection of standard worker and performance were the key criteria for sustainable production capability.
Acknowledgment
The authors would like to thank Ethiopian Institute of Textile and Fashion Technology (EiTEX), Bahir Dar University, for supporting this research and the Third-phase Priority Academic Program Development of Jiangsu Higher Education Institutions (PAPD) for covering the publication fees.
References
[1] Salvendy, G. (2001). Handbook of Industrial Engineering. 1st edition, Wiley, New York, 2001.10.1002/9780470172339Search in Google Scholar
[2] Bandara, B. E. S., De Silva, D. A. M., Fernando, G. (2015). Role of Standard Minute Value in Export Processing: Will It Make Difference to the Firm Economic Performance. International Research Symposium on Engineering Advancements, SAITM, Malabe, Sri Lanka.Search in Google Scholar
[3] http://www.garmentsmerchandising.com/how-to-calculate-sam-in-garments-industry/Search in Google Scholar
[4] Mohammad, A.J., Md. Tanjim, H., Md. Mazharul, I., Moshiur, R., Prashanta, K. R. (2014). To Estimate the Standard Minute Value of a Polo-Shirt by Work Study. Global Journal of Researches in Engineering: Industrial Engineering, 15(2), Version1.0. 2015.Search in Google Scholar
[5] Habibur, R., Prashanta Kumar, R., Rezaul, K., Prodip Kumar, B. (2014). Effective Way to Estimate the Standard Minute Value (SMV) Of A T-Shirt By Work Study. European Scientific Journal, 10(30), ISSN: 1857 – 7881 (Print) e -ISSN 1857-7431, October 2014.Search in Google Scholar
[6] Gu, B.-F., Jin, R., Liu, G.-L. Apparel Production Capacity Prediction of Knitted Garments Cutting, pp 239–246.Search in Google Scholar
[7] Alamgir Hossain, S. K., Anwarul Isla, K. M. (2015). The Relationship of the Macroeconomic Variables with the Growth of Garment Industry in Bangladesh. Global Disclosure of Economics and Business, 4, pp 63–78.10.18034/gdeb.v4i1.153Search in Google Scholar
[8] Rahman, Md H., Amin, Md A., (2016). An Empirical Analysis of the Effective Factors of the Production Efficiency in the Garments Sector of Bangladesh. European Journal of Advances in Engineering and Technology, 3(3), 30–36Search in Google Scholar
[9] Rajput, D., Kakde, M., Chandurkar, P., Raichurka, P. P. (2018). Enhancing Efficiency and Productivity of Garment Industry by Using Different Techniques. International Journal on Textile Engineering and Processes, 4(1).Search in Google Scholar
© 2020 Mulat Alubel Abtew et al., published by Sciendo
This work is licensed under the Creative Commons Attribution 4.0 International License.
Articles in the same Issue
- Statistical Analysis of Standard Allowed Minute on Sewing Efficiency in Apparel Industry
- Study on the Relationship Between Structure Parameters and Filtration Performance of Polypropylene Meltblown Nonwovens
- Merging Footwear Design and Functionality
- Nonwovens: Global Trends in World Economy, European Foreign Trade, and Selected Case Studies from Poland and Asian Brics Countries
- Sewing Thread Consumption for Different Lockstitches of Class 300 Using Geometrical and Multi-Linear Regression Models
- Electrospinning of Chitosan Biopolymer and Polyethylene Oxide Blends
- Antibacterial Fibers Containing Nanosilica with Immobilized Silver Nanoparticles
- Influence of Structural Parameters of Nonwoven Geotextiles on Separation and Filtration in Road Construction
- Optimization of Dynamic Mechanical Properties of Knitted Barrier Meshes
- Influence of Ultraviolet Irradiation and Protease on Scale Structure of Alpaca Wool Fibers
- Influence of Woven Fabric Width and Human Body Types on the Fabric Efficiencies in the Apparel Manufacturing
- The Effect of Electric Field on Nanofibers Preparation in Cylindrical-Electrode-Assisted Solution Blowing Spinning
- Antibacterial Effect of Graphene and Graphene Oxide as a Potential Material for Fiber Finishes
- Investigation of the Influence of Technology Parameters and Thread Type on Embroidered Textile Element Quality
- The Hydrophobization of a Nanofiber Layer Using Low-Vacuum Plasma
- Review of Printed Fabric Pattern Segmentation Analysis and Application
- Influence of Technology Process on Responsiveness of Footwear Nonwovens
- Performance of Electrospun Polyvinylidene Fluoride Nanofibrous Membrane in Air Filtration