Simulated diagenesis of the iron-silica precipitates in banded iron formations
-
Isaac L. Hinz
 and
Jena E. Johnson
and
Jena E. Johnson

Abstract
Banded iron formations (BIF) are chemically precipitated sediments that can record Archean ocean geochemistry. BIFs are laminated silica- and iron-rich deposits that host a range of iron(II, III) minerals, including hematite, magnetite, siderite, greenalite, minnesotaite, and stilpnomelane. This diverse mineralogical assemblage reflects secondary mineralization reactions due to diagenesis and/or post-depositional alteration. While petrographic observations of BIFs sparingly contain the iron silicate greenalite, recent evidence of greenalite nanoparticles preserved in early-mineralizing BIF chert suggest this mineral was a primary phase in BIF progenitor sediments. Therefore, it is critical to investigate the formation and alteration of greenalite to constrain the Archean ocean environment and help unravel post-depositional processes. To examine how iron silicates precipitate and then crystallize and/or transform during diagenesis, we simulated these two processes under Archean ocean conditions. We first precipitated a poorly ordered Fe-rich serpentine with subsidiary ferrihydrite at neutral pH by performing in situ Fe(II) oxidation experiments at 25 °C in the presence of silica. Subjected to simulated diagenesis at 80 °C, the rudimentary Fe-phyllosilicate transformed into a crystalline phyllosilicate characterized as 30% cronstedtite and 70% greenalite accompanied by magnetite and persistent ferrihydrite. At temperatures ≤150 °C, we continued to observe ferrihydrite, increased magnetite formation, and elevated incorporation of Mg into the phyllosilicate as it further recrystallized into Mg-greenalite. Our findings demonstrate a possible formation mechanism of early silicates through partial Fe(II) oxidation and support petrographic observations that magnetite likely mineralizes during diagenesis. Additionally, we suggest that Mg contents in BIF iron phyllosilicates could serve as a tracer for diagenesis, with Mg signaling phyllosilicate-fluid interactions at elevated temperatures. Ultimately, our experiments help reveal how initial iron-silica coprecipitates are altered during diagenesis, providing novel insights into the interpretation of greenalite and magnetite in ancient BIF assemblages.
Introduction
Chemical sediments provide an archive of (bio)geochemical processes. The oceans on Archean (4.0–2.5 billion years ago, Ga) Earth were actively precipitating and depositing authigenic chemical sediments, which can therefore serve as a proxy for the ancient marine (bio)geochemistry and signals of the evolution of life (Derry and Jacobsen 1990). A prominent example of such sediments are the banded iron formation (BIF) deposits, laminated sedimentary deposits that contain at least 15% iron and commonly also host a high silica content (James 1954). BIFs provide the best record of ancient marine conditions in the Archean ocean, with their chemistry interpreted as reflecting an iron and silica rich system (Klein 2005; Bekker et al. 2014).
The presence of BIF deposits in ancient oceans requires a mechanism to initially induce chemical precipitation (Holland 1984). Minerals recorded in BIFs contain Fe(II) and Fe(III) with an average oxidation state of Fe2.4+ (Klein and Beukes 1992), indicative of a partially oxidative environment resulting from biotic and/or abiotic processes in Archean oceans and sediments. Extensive BIF deposition occurred in the Archean ocean, which had little to no molecular oxygen until the Great Oxygenation Event at ~2.3 Ga (Gumsley et al. 2017; Farquhar et al. 2011; Poulton et al. 2021; Johnson and Molnar 2019). Estimates place atmospheric O2 prior to this rise in oxygen as <1 ppm or less than ~10–5.7 atm (Pavlov and Kasting 2002; Farquhar et al. 2011). A popular hypothesis for the deposition of precursor BIF sediments invoked low levels of dissolved O2 in the ocean reacting with dissolved Fe2+ to consume marine oxygen and form insoluble Fe3+ precipitates such as ferric (oxyhydr)oxides (Cloud 1973; Bekker et al. 2014; Konhauser et al. 2017). Others have attributed the generation of BIF progenitor precipitates to anoxygenic Fe2+-oxidizing photosynthesis (Hartman 1984; Kappler et al. 2005; Konhauser et al. 2002) or reactions between Fe2+ and ultraviolet light (Cairns-Smith 1978; Braterman et al. 1983; Bekker et al. 2010).
To identify the potential processes responsible for their formation, the iron-rich muds and cherts in BIFs have been intensely investigated. However, the primary BIF sediments experienced physical and chemical alteration as they transformed into sedimentary rock through the process of diagenesis, and most of these rocks were then subject to subsequent post-depositional alteration, fluid flow, and metamorphism (Beukes 1984; Fischer and Knoll 2009; Trendall 2002). Consequently, none of the minerals in BIFs are considered the initial precipitates and BIF deposits are composed of a mineral mixture of chert, hematite, magnetite, iron-rich carbonates, and iron silicates at disequilibrium (Klein 2005; Bekker et al. 2014; Konhauser et al. 2017). This complexity has led to an ongoing debate to determine the most primary mineral(s) associated with BIFs, as only the original precipitates would accurately reflect Archean marine geochemistry and potentially biology.
The effects of diagenesis and later alteration complicates the detection of the initial amorphous and/or metasTable phases precipitated in Archean oceans, and competing hypotheses suggest two different original BIF precipitates. Earlier models, supplemented by numerous observations of BIFs, pointed to ferric oxides or hydroxides being the primary iron precipitate (James 1954; Cloud 1973; Klein and Beukes 1989; Beukes and Gutzmer 2008; Sun et al. 2015). However, recent studies examined early-mineralizing chert within BIFs that can serve as a barrier to diagenesis, preserving the early assemblage of minerals. These investigations discovered inclusions of iron-rich silicate nanoparticles and suggested these iron silicates were primary minerals from the Archean ocean (Muhling and Rasmussen 2020; Rasmussen et al. 2015; Rasmussen et al. 2019). Further characterization of the iron silicate nanoparticles concluded they contained undetecTable to <0.5 atomic% (at%) quantities of magnesium and ~10–25% Fe(III) (Johnson et al. 2018; Muhling and Rasmussen 2020). The primary silicates are thus within the solid solution space between greenalite [(Fe2+,Mg)3Si2O5(OH)4] and cronstedtite [(Fe2+,Fe3+,Mg)3(Si,Fe3+)2O5(OH)4], two serpentine group iron silicates with 7 Å lattice spacing.
These recent observations call for an understanding of the geochemical conditions and mechanism(s) required to form iron silicates under plausible Archean ocean conditions. Previous anoxic experiments conducted at low temperatures of 20–25 °C reported the formation of amorphous to poorly crystalline iron(II)-silica precipitates, proposed to be precursor silicates, when pH was ≥7.5 (Farmer et al. 1991; Tosca et al. 2016). The analyses performed on these iron-silica precipitates could not definitely conclude whether these precipitates were a heterogeneous mix of Fe(II)- and Si-rich phases or homogenous Fe(II)-silicates (Francisco et al. 2020). However, similar experiments in another study demonstrated that the initial Fe(II)-Si coprecipitates at pH 7.5 could be hydrothermally aged into greenalite-like phases with ~7 Å lattice spacing (Hinz et al. 2021). One concern relates to the relevance of these experiments since the pH of ≥7.5 used in these experiments was higher than the hypothesized pH of the Archean ocean, which was constrained to pH ~6.5–7.0 by two independent marine and atmospheric geochemical models (Halevy and Bachan 2017; Krissansen-Totton et al. 2018) and considerations of authigenic clay formation (Isson and Planavsky 2018). An additional issue with Fe(II)-silicate precipitation generating the initial BIF sediments is that this Fe(II)-silica saturation mechanism would not account for the low levels of Fe(III) detected in the BIF iron silicate inclusions.
To address whether ferric iron can in fact induce precipitation of iron silicates at a more plausible Archean ocean pH of 6.5–7.0, we previously examined the precipitate products resulting from the addition of low amounts of aqueous (aq) Fe(III) to ferrous iron- and silica-rich conditions (Hinz et al. 2021). We found that Fe(III) (aq) triggered the low-temperature precipitation of an amorphous iron- and silica-rich phase accompanied by rare layered silicate-like structures at these more relevant pH values. Earlier studies have simulated diagenesis by hydrothermally aging iron and/or magnesium and silica suspensions at ≥60 °C to promote the crystallization of silicates (Baldermann et al. 2014; Mizutani et al. 1991; Tosca et al. 2011). When we hydrothermally aged our Fe(II,III)-silica precipitates at 150 °C, we identified the crystalline products as ~7 Å iron phyllosilicates, similar to BIF greenalite but more magnesium-rich, along with additional carbonate green rust, magnetite, hematite, and magnesite (Hinz et al. 2021).
The highly oxidized and heterogeneous assemblage that we observed after Fe(III) (aq) additions and 150 °C aging motivated us to explore an alternative precipitation mechanism and hydrothermal aging scheme at several temperatures. In this study, we induced in situ partial Fe(II) oxidation at pH 7 in the presence of silica by bubbling low concentrations of oxygen gas into simulated Archean ocean conditions. The partially oxidized iron-silica precipitates that formed at room temperature (25 °C) aimed to recreate phases that formed in the Archean water column. To promote crystallization and simulate chemical reactions, we hydrothermally aged these precipitates over the typical diagenetic temperature interval of surface temperatures to 200 °C (Brenner et al. 1991; Siever 1986). Similar to previous experimental studies of silicate systems, we aged our initial iron-silica precipitates within anoxic, sealed vessels in sequential steps at 80 °C (Pignatelli et al. 2013; Vacher et al. 2019), 150 °C (Baldermann et al. 2014; Mizutani et al. 1991), and 220 °C (Janecky and Seyfried 1986) and compared these precipitates to low-temperature (25 °C) products. We measured solution chemistry over the course of the simulated diagenesis and characterized the resultant precipitates as they crystallized and transformed.
Methods
Experimental solution setup
All experiments originated from bulk uniform solutions prepared in 4 L wide mouth jugs at room temperature with 18.2 MΩ cm ultrapure water. The ultrapure water was boiled before being covered with aluminum foil and purged with pure N2 gas to deoxygenate the water. Next, the water was brought into a MBraun glovebox consisting of an N2 atmosphere (<0.1 ppm O2) where it was stirred uncapped for at least 72 h to release any residual oxygen in solution. All solid chemical reagents were weighed outside the glovebox before being transported into the glovebox to be dissolved in deoxygenated water used in experimentation.
We prepared a 3.6 L solution in duplicate where first sodium orthosilicate (Na4SiO4) was dissolved in the anoxic ultrapure water to a final concentration of 1.1 mM Si. Estimated dissolved silica in Archean seawater was expected to be between ~0.67 mM to an upper limit at amorphous SiO2 saturation of ~1.9 mM (Siever 1992; Maliva et al. 2005; Stefurak et al. 2015; Gunnarsson and Arnórsson 2000); we therefore chose an intermediate level between these constraints and below amorphous silica precipitation. The solution was stirred, and the pH was measured with a ThermoFisher Orion Star A221 pH meter outfitted with a Fisherbrand accuCap spear tipped capillary junction pH probe while being adjusted to pH 7 by dropwise additions of 1 M hydrochloric acid (HCl). The solution was continuously stirred in the glovebox for 24 h to allow for the depolymerization of the dissolved silica in solution (Dietzel 2000) before we added other Archean seawater salts.
Assuming similar salinity over time, our Archean solution (Table 1) had 400 mM sodium chloride and 7 mM potassium chloride, comparable to the modern ocean (Riley and Chester 1971). Archean ocean models have estimated ammonium to be 0.03–10 mM (Stüeken et al. 2016); therefore, we added 10 mM ammonium chloride at the upper end of this range as this reductant may help maintain reducing conditions. The magnesium content in Archean oceans has been estimated to be 10–30 mM (Jones et al. 2015), with processes associated with hydrothermal seawater-oceanic crust interactions decreasing dissolved magnesium in ocean water from today’s concentration of ~50 mM (Spencer and Hardie 1990; Halevy and Bachan 2017; Izawa et al. 2010). We used the lower estimate and added 10 mM magnesium chloride. A maximum concentration of ~2 mM Fe(II) in Archean oceans has been suggested to be constrained by the supersaturation of ferrous silicates (Jiang and Tosca 2019); we thus set Fe(II) to 1.1 mM.
Composition of recreated Archean seawater
| Chemical component, chemical formula | Concentration (mM) |
|---|---|
| Sodium chloride, NaCl | 400 |
| Sodium bicarbonate, NaHCO3 | 30 |
| Magnesium chloride hexahydrate, MgCl2·6H2O | 10 |
| Ammonium chloride, NH4Cl | 10 |
| Potassium chloride, KCl | 7 |
| Sodium orthosilicate, Na4SiO4 | 1.1 ± 0.08* |
| Ferrous chloride tetrahydrate, FeCl2·4H2O | 1.1 ± 0.09* |
| Total cation equivalents from salts (est. from acid/base) | 473.6 (500) |
| Total anion equivalents from salts (est. from acid/base) | 473.6 (480–490) |
Notes: Iron and silica concentrations shown as measured concentrations derived from colorimetric (ferrozine and silicomolybdate) assays where * denotes the standard deviation of the measurement.
Archean oceans have been estimated to contain 5–30 mM of dissolved inorganic carbon (DIC) (Blättler et al. 2017), and we assume initial pore fluids would have similar concentrations. Additionally, the presence of common organic buffers (HEPES and MOPS) has been shown to impact iron oxidation (Buchholz et al. 2011). Therefore, we added the highest estimate for bicarbonate, 30 mM (Table 1), to both maximize inorganic buffering and account for potential increases in DIC due to organic carbon respiration in the sediments (e.g., Heimann et al. 2010). See Online Materials[1] for more details.
We then mixed the solutions to homogenize any slight chemical differences before apportioning the solution into twelve 610 mL borosilicate glass bottles, wrapped in aluminum foil to prevent any possible ultraviolet (UV) photooxidation of Fe(II). Six of the newly sealed experiments remained in the glovebox to act as ferrous controls. The remaining six identical bottles were removed from the glovebox to be bubbled with low O2.
To partially oxidize the Fe(II) (aq) in situ under simulated Archean ocean conditions, six sealed experimental bottles were equilibrated with N2 mixed with 49.1 ± 0.9 ppm O2. Each solution was continuously bubbled with this gas mixture at 3 psi at 25 °C for 90 min while outgassing through a separate needle (expanded description in Online Materials[1]). The bottles were transported back into the glove-box and remained resting on their side wrapped in aluminum foil.
Initial Fe(II) oxidation and pH
The bubbled and control experiments were allowed to react and equilibrate horizontally in the glovebox at 25 °C. Each bottle was shaken horizontally three times a week to homogenize the solution. After 19 days, we observed that increases in precipitate quantity had stopped for >4 days and deemed that the Fe(II) (aq) had fully reacted with O2. We then measured the pH of each control and bubbled experiment (Table 2).
pH measurements of Parr vessel precipitates and overlaying solution for control and bubbled experiments for temperatures that ranged from 25–220 °C
| T (°C) | Time (days) | Bubbled (pH) | Control (pH) |
|---|---|---|---|
| 25 | 19 | 7.33 | 7.14 |
| 25 | 40 | 7.06 | 7.17 |
| 80 | 7 (26) | 6.74 | 6.92 |
| 150 | 7 (33) | 6.41 | 6.43 |
| 220 | 7 (40) | 5.85 | 7.65 |
Notes: Time column indicates days at listed temperature and total days in parentheses. Note pH measurements were taken after the solution was cooled to 25 °C to minimize temperature effects and the error for each pH measurement was ±0.02 pH units.
To measure the extent of Fe(II) oxidation [reported as Fe(III)/FeT], one of each of the bubbled and control experimental bottles were unsealed and completely acidified with anoxic 4 M HCl to a pH of 3 for >12 h, after which all visible precipitate was dissolved. Subsequently, the dissolved experimental solutions were analyzed by the ferrozine assay (Stookey 1970; Viollier et al. 2000) to determine the bulk Fe(III)/FeT (Table 3) after equilibration for 19 days at 25 °C. In addition, two precipitate subsamples from the bubbled experiments after 19 days at 25 °C (Fig. 1) were removed and washed three times between centrifuging. One subsample was acidified following the same protocol as described above to complete dissolution before being analyzed by the ferrozine assay (Table 4) while the other subsample was stored and later dissolved and analyzed for its Fe(II) content by the Wilson vanadate method (Online Materials[1] Tables S1 and S2); more details on these assays are below and in the Online Materials.

Time-temperature scheme for hydrothermal aging of control and bubbled experiments. The reaction with O2 and equilibrium period took place in borosilicate bottles denoted by the light gray region. Control and bubbled experiments were subsampled for pH and Fe(III)/FeT after 19 days at room temperature (star symbol). The remainder of material was portioned and transferred into anoxic Parr vessels for aging at 25, 80, 150, and 220 °C before being sampled and analyzed (filled circles).

(a) Plot of pH measurements from Parr vessel with precipitate and overlaying solution for control and bubbled experiments for temperatures that ranged from 25–220 °C. Note the uncertainty of the pH measurements and oven temperatures was ±0.02 pH units and ±0.4 °C, respectively. (b) The measured Fe(III)/FeT content of the acidified control precipitates and bubbled precipitates along with the calculated standard deviation from replicate measurements.
Summary of experimental results of Fe(II) and silica in initial solutions
| Condition | Measurement ± standard deviation |
|---|---|
| Silica in initial solution (mM) | 1.1 ± 0.08 |
| Fe(II) in initial solution (mM) | 1.1 ± 0.03 |
| Fe(III)/FeT (bulk) of acidified control after 19 days 25 °C | 0.07 ± 0.02 |
| Fe(III)/FeT (bulk) in acidified bubbled exp after 19 days 25 °C | 0.75 ± 0.05 |
Notes: The measured Fe(III)/FeT content for the acidified control and bubbled experiments (solution plus precipitate) after aging in a borosilicate bottle at 25 °C for 19 days.
The measured Fe(III)/FeT content by ferrozine and measured Fe(II)/g by vanadate assay of the acidified control and bubbled solid precipitate from conditions ranging 25–220 °C over 19–40 total days
| Condition | Fe(III)/FeT (ferrozine) | % Fe(II)/g (vanadate) |
|---|---|---|
| Control solids after 7 days 150 °C (33 days total) | 0.27 ± 0.9 | |
| Control solids after 7 days 220 °C (40 days total) | 0.32 ± 2 | |
| Bubbled solids after 19–21 days 25 °C | 0.48 ± 0.06 | 48.14 |
| Bubbled solids after 40 days 25 °C | 0.45 ± 1.8 | |
| Bubbled solids after 7 days 80 °C (26 days total) | 0.45 ± 2.5 | 55.85 |
| Bubbled solids after 7 days 150 °C (33 days total) | 0.51 ± 0.06 | 32.22 |
| Bubbled solids after 7 days 220 °C (40 days total) | 0.46 ± 2.4 | 27.92 |
Hydrothermal aging and subsampling
The remaining four control and four bubbled experiments were mixed to homogenize each condition’s solution. The solution, along with any precipitate present, was equally distributed in 15 mL increments into eight separate 22 mL stainless steel gas-tight Parr vessels fit with a PTFE gasket and anoxically sealed. Each bubbled vessel contained ~1–2 g of precipitate while the control solution had no apparent solids. One of the control and bubbled experiments remained sealed in a Parr vessel within the glovebox at 25 °C for the duration of simulated diagenesis (total of 40 days). Three control and three bubbled experiments in Parr vessels were taken out of the glovebox and placed into a Thermo Scientific Heratherm oven set at 80 °C to undergo hydrothermal aging.
After 7 additional days of hydrothermal aging at 80 °C, one of the control and bubbled Parr vessels were removed from the oven and transferred to the glovebox (Fig. 1). The hydrothermally aged 80 °C vessels were allowed to cool to 25 °C before a pH measurement of the solution was taken (Table 2). If a precipitate was present, the precipitate slurry was centrifuged three times and rinsed with anoxic water with a pH ± 0.1 of the measured solution value (Table 2) to limit pH-driven reactions after simulated diagenesis while removing excess salts prior to analysis. The precipitate was then subsampled for future analysis and stored in anoxically sealed biaxially-oriented polyethylene terephthalate (BoPET) bags within the glovebox at 25 °C. The oven temperature was increased to 150 °C for the remaining Parr vessels.
After 7 additional days at 150 °C, another control and bubbled Parr vessel were withdrawn from the oven and taken to the glovebox (Fig. 1). The experimental solutions were again cooled to 25 °C in the glovebox before the pH was measured (Table 2), and any precipitate was rinsed as described above and apportioned for future analysis. After this higher temperature, the control experiment appeared to contain ~0.1 g of precipitated material while the bubbled experiment had a very similar amount of material as the initial 25 °C starting amount. Finally, the oven temperature for the remaining two Parr vessels was increased to 220 °C.
After 7 additional days at 220 °C, the last remaining control and bubbled Parr vessels were transferred to the glovebox (Fig. 1). The solution pH was measured (Table 2), and the precipitate was rinsed and allocated for future analysis. The control and bubbled Parr vessels that remained in the glovebox for the entire 40 days at 25 °C were measured for pH (Table 2), and any precipitate was rinsed and subsampled for future analysis.
Using the Act2 program in Geochemist’s Workbench (Bethke 2007), we additionally created stability diagrams for Fe and Mg phases across pH (0–14) and redox space (redox potential, or Eh) to consider the thermodynamically predicted phases and the potential redox environments that our experimental precipitates experienced during hydrothermal aging.
Analytical Sample Preparation And Instrument Parameters
Iron(II/III) content of solids
Control and bubbled experiments that produced precipitates were acidified in the glovebox with anoxic 4 M HCl, vigorously shaken, and allowed to dissolve for >12 h, following suggestions by Porsch and Kappler (2011) and Braunschweig et al. (2012) to dissolve samples under anoxic conditions at low temperatures to prevent Fe(II) oxidation. However, we used 4 M HCl (instead of 1 M or 6 M HCl) to maintain consistency with the ferrozine assay (Viollier et al. 2000) and subsequently observed complete dissolution of our experimental solids. Dissolved precipitates were analyzed by the ferrozine assay from three subsamples from each experiment to determine the Fe(III)/FeT content (Stookey 1970; Viollier et al. 2000).
We additionally evaluated the Fe(II) content of our bubbled experiments following a modified version of the Wilson vanadate method to determine the percent Fe(II) in the samples using a titration-based method (Andrade et al. 2002). See the Online Materials[1] for more details.
X-ray diffraction (XRD)
A precipitate slurry was pipetted as 20 μL subsamples into Cole-Parmer Kapton tubes with an inner diameter of 1.46 mm and a 0.05 mm wall thickness. Kapton tubes filled with experimental precipitate were allowed to partially dry for 12 h in the glovebox before both ends of the Kapton tubes were heat sealed shut. The sealed Kapton tubes were protectively placed in 15 mL falcon tubes and heat sealed in BoPET bags prior to shipping. Samples were sent to McMaster Analytical X-ray Diffraction Facility (MAX) for XRD analysis using a Bruker D8 DISCOVER cobalt source tube (Co-XRD) with a DAVINCI.DESIGN diffractometer. The diffractometer was set at 35 kV and 45 mA, with a 1 mm slit and 1 mm collimator, with data collected on a VÅNTEC-500 area detector with a 20 cm working distance. Each sample scan included 4 frames (900 s per frame) at 3 separate sample areas over a 2θ range of 10–88°. The 2D frames were collected with DIFFRAC.MEASUREMENT Centre Version 6.5 software and patterns were integrated to 1D using DIFFRAC.EVA Version 4.2.
Transmission electron microscopy (TEM)
Freshly subsampled precipitates were diluted in anoxic water with a pH ±0.1 of the measured condition before pipetting 15 μL of diluted slurry onto lacey carbon coated 300-mesh Cu TEM grids. We allowed residual solution to evaporate prior to analysis, drying in the glovebox under anoxic conditions (<0.1 ppm O2), before storing the grids in TEM grid holders and anoxically heat sealing them in a BoPET bag. The BoPET bags were removed from the glovebox and shipped to Colorado School of Mines, Golden, Colorado, U.S.A. for analysis. Samples were examined on a Talos F200X at 200 keV for high-resolution imaging (HR-TEM) up to 0.12 nm, scanning transmission electron microscopy (STEM) imaging up to 0.16 nm, and Super-X window-less electron dispersive X-ray spectroscopy (EDS) analysis. Samples were imaged in high-angle annular dark-field (HAADF) to discern different phases. HR-TEM imaging was used to capture the crystal lattice spacing where the images were analyzed by fast Fourier transformation (FFT) and Inverse FFT (IFFT) using Gatan DigitalMicrograph software. Additional structural data of individual phases was recorded by selected area electron diffraction (SAED). Elemental data was captured by the Talos F200X Super-X EDS detector for a minimum of 10 min at each location. Bruker ESPRIT software Version 1.9 was used to analyze and quantify the EDS data by the Cliff-Lorimer method with a 1 × 2 binning. This method converts X-ray counts into raw elemental weight or atomic percent, yielding an accuracy of ±1–10% of the collected values. We analyzed representative areas of silicates and oxides to obtain their atomic ratios of cations by first averaging the data from the most isolated particles, then recalculating the oxygen atomic % using cation valence (ignoring any salt-related cations), and finally re-normalizing the data to 100%. We then took the atomic ratios of (Fe+Mg)/Si and Fe/(Fe+Mg) to gain insights into the silicate character. Image contrast and brightness were adjusted to optimize image clarity.
Results
Solution and precipitate chemical analysis
Over the course of this experimental set-up, we measured the pH and extent of iron oxidation in the control and bubbled experiments. The ferrous control experiment after 19 days at 25 °C had a measured pH of 7.14 (Table 2). This experiment had no observable precipitate but after fully acidifying the experimental solution to dissolve any minor solids or colloids, we determined it contained 0.07 Fe(III)/FeT in bulk (Table 3). After a total of 40 days, the 25 °C control had a measured pH of 7.17 (Fig. 2a; Table 2). This room temperature control had no visible color change and yielded no precipitate from which to obtain a Fe(III)/FeT precipitate measurement.
Increased hydrothermal temperatures can mimic diagenesis by either inducing higher-temperature reactions such as those that take place during sediment burial and/or simulating the effects of lower diagenetic temperatures over longer geologic time periods (Siever 1986). The control experiment that aged for an additional 7 days at 80 °C had a measured pH of 6.92 (Fig. 2a; Table 2). The 80 °C control continued not to display any color change in solution and did not produce a precipitate for Fe(III)/FeT measurement. The control experiment subject to an additional 7 days at 150 °C had a pH of 6.43 (Fig. 2a; Table 2). This 150 °C control did produce a minuscule amount of dark tan-green material that had 0.27 Fe(III)/FeT (Fig. 2b; Table 4). The control experiment aged for an additional 7 days at 220 °C was measured to have a pH of 7.65 (Fig. 2a; Table 2). This 220 °C control experiment precipitated a small amount of dark tan-green solid material with 0.32 Fe(III)/FeT (Fig. 2b; Table 4).
We induced partial in situ iron(II) oxidation by bubbling trace levels of O2 gas into Archean ocean solutions for a limited amount of time, and then simulated progressive diagenesis of the partially oxidized precipitates. After 19 days at 25 °C, the acidified and fully dissolved replicate bubbled experiment contained 0.75 Fe(III)/FeT in bulk (dissolved precipitate plus solution) (Table 3). This bubbled experimental solution had a pH of 7.33 and produced a green precipitate, suggesting a Fe(II-III) phase or phases (Velde 2003) (Table 2). Indeed, our ferrozine assay determined that this green precipitate contained 0.48 Fe(III)/FeT and the vanadate assay indicated it was composed of 48% Fe(II) per gram (Tables 4; Online Materials[1] Table S2). After an additional 21 days, and 40 days total, the bubbled experiment aged at 25 °C had a solution pH of 7.06 (Fig. 2a; Table 2) and still contained a green precipitate. When we harvested this low-temperature bubbled precipitate, it contained 0.45 Fe(III)/FeT (Fig. 2b; Table 4).
The bubbled experiment subject to aging at 80 °C for 7 additional days had a pH of 6.74 (Fig. 2a; Table 2) and continued to yield a green precipitate. This 80 °C solid was measured to similarly have 0.45 Fe(III)/FeT and 55.85% Fe(II) by mass (Fig. 2b; Table 4; Online Materials[1] Table S2). The bubbled experiment that was further aged at 150 °C had a measured pH of 6.41 (Fig. 2a; Table 2). This 150 °C experiment continued to display a green precipitate and the acidified solid subsample had 0.51 Fe(III)/FeT (Fig. 2b; Table 4). While the ratio of Fe(III)/FeT was similar, the % Fe(II) per gram dropped to 32.2% (Online Materials[1] Table S2). The bubbled experiment that was aged at 220 °C for an additional 7 days had a measured pH of 5.85 (Fig. 2a; Table 2). This bubbled 220 °C experiment produced a slightly darker green-black precipitate with 0.46 Fe(III)/FeT and 27.92% Fe(II)/g (Fig. 2b; Tables 4; Online Materials[1] Table S2).
Thermodynamically predicted mineral phases
The stability diagrams that we constructed, paired with the measured pH values at each step of the hydrothermal aging experiment (Table 2), generated a suite of predicted minerals depending on the redox environment (Eh), which was not directly measured. In the case of magnesium (Online Materials[1] Fig. S1), the thermodynamically sTable phase at pH ~7 and 25 °C or 80 °C was dissolved Mg. The solution pH after continued reaction was within the expanded magnesite stability field at 150 °C, but the higher pH after 220 °C reactions (pH 7.65) shifted the predicted Mg mineral product to a Mg serpentine phase like chrysotile or antigorite. For iron (Online Materials[1] Fig. S2), siderite or a ferric oxide like goethite should be sTable in the 25 °C experiment at pH ~7. At 80 °C, there is a small region of magnetite stability as well as the siderite and large goethite stability fields at the experimental pH of ~6.75. With increasing experimental temperature and dropping pH, the magnetite stability field grows while siderite’s sTable redox and pH space decreases. See Online Materials[1] for more details.
Bulk mineralogy: XRD and magnetic response
Control experiments at 150 and 220 °C did not produce enough precipitate for analysis by XRD. XRD measurements of bubbled precipitates yielded patterns consistent with several phases (Fig. 3). The bubbled experiment aged for 40 days at 25 °C produced a large and diffuse diffraction peak corresponding to the Kapton tube it was measured in but no other sharp diffraction peaks, suggesting an amorphous to minimally crystalline product (Fig. 3). One broad peak that occurred in the 25 °C precipitate and persisted through the higher-temperature aging treatments may be consistent with ferrihydrite. After 80 °C aging, the bubbled experiment contained weak diffraction peaks consistent with a serpentine group silicate such as greenalite or cronstedtite and a spinel group oxide like magnetite (Fig. 3). After the 150 °C treatment, bubbled experiments displayed a heightening of the peaks observed at 80 °C along with the formation of additional peaks corresponding to a serpentine group silicate and spinel group oxide (Fig. 3). The bubbled experiment subject to 220 °C aging showed a continued narrowing of the diffraction peaks for a spinel group oxide, reflecting an increase in crystal size and/or crystallinity (Fig. 3). However, the 220 °C experiment showed smaller and less sharp serpentine group peaks and only contained one putative ferrihydrite peak.
![Figure 3 Cobalt sourced XRD patterns from replicate bubbled experimental precipitates subject to simulated diagenesis at 25 °C (blue), 80 °C (green), 150 °C (black), and 220 °C (red). Plotted for comparison: blank kapton tube (K); 1:1 iron-silicates greenalite (G), [ Fe 3 2+ Si 2 O 5 (OH) 4 ] $\left[ \text{Fe}_{3}^{2+}\text{S}{{\text{i}}_{2}}{{\text{O}}_{5}}{{(\text{OH})}_{4}} \right]$ (from Guggenheim et al. 1982) and cronstedtite (C), [ ( Fe 2+ , Fe 3+ ) 3 ( Si 1 , Fe 3+ ) 2 O 5 (OH) 4 ] $\left[ {{\left( \text{F}{{\text{e}}^{2+}},\text{F}{{\text{e}}^{3+}} \right)}_{3}}{{\left( \text{S}{{\text{i}}_{1}},\text{F}{{\text{e}}^{3+}} \right)}_{2}}{{\text{O}}_{5}}{{(\text{OH})}_{4}} \right]$(Lab Standard, Caltech Mineralogical Collection); a spinel group iron-oxide, magnetite (M), [ Fe 2+ Fe 2 3+ O 4 ] $\left[ \text{F}{{\text{e}}^{2+}}\text{Fe}_{2}^{3+}{{\text{O}}_{4}} \right]$(from Haavik et al. 2000); and 6-line ferrihydrite (F) [ Fe 10 3+ O 14 (OH) 2 $\left[ \text{Fe}_{10}^{3+}{{\text{O}}_{14}}{{(\text{OH})}_{2}} \right.$(from Michel et al. 2007). Both the copper and cobalt two theta axes are plotted for comparison. The experimental and standard diffraction patterns were vertically offset for clarity.](/document/doi/10.2138/am-2022-8758/asset/graphic/j_am-2022-8758_fig_003.jpg)
Cobalt sourced XRD patterns from replicate bubbled experimental precipitates subject to simulated diagenesis at 25 °C (blue), 80 °C (green), 150 °C (black), and 220 °C (red). Plotted for comparison: blank kapton tube (K); 1:1 iron-silicates greenalite (G),
Control and bubbled experimental precipitates across the range of temperature displayed different degrees of magnetic attraction. The control 150 and 220 °C dark tan-green precipitates were both weakly to moderately attracted to the magnet (Figs. 4a and 4b). The bubbled green precipitate at 25 °C after a total of 40 days was not attracted to the magnet (Fig. 4c). However, after 7 days at 80 °C, the green precipitate was weakly attracted to the magnet (Fig. 4d). After an additional 7 days at 150 °C, the bubbled green precipitate was strongly attracted to the magnet (Fig. 4e). Seven days of aging at 220 °C produced the darkest green precipitate, which was the most attracted to a magnet compared to all our experimental samples (Fig. 4f).

The precipitate from the 150 °C control experiment had a tan color (a-left) and was moderately attracted to the magnet (a-right). The precipitate from the 220 °C control experiment continued to have a tan color (b-left) but only some particles appeared to be attracted to the magnet (b-right). The precipitate from the bubbled experiment after aging at 25 °C had a green color (c-top) and was not attracted to the magnet (c-bottom). The bubbled experiment harvested after aging at 80 °C was green (d-top) and was moderately attracted to the magnet (d-bottom). The bubbled 150 °C precipitate was dark green (e-top) and continued to be moderately attracted to the magnet (e-bottom). The bubbled 220 °C precipitate was darker green (f-top) and was highly attracted to the magnet (f-bottom)
Electron microscopy characterization
High-temperature control experiments. Unlike the 25 and 80 °C control experiments that did not produce a precipitate for analysis, after 7 days at 150 °C, the control contained a miniscule amount of tan precipitate (Fig. 5a). TEM imaging of the 150 °C control revealed abundant ~500 nm clusters composed of a multi-phase mixture: poorly formed tubular spindles, a faint, more amorphous globular phase, and well ordered crystals with a rod or lath morphology (Figs. 5b–5l). The tubular spindles were <10 nm wide and <50 nm long (Figs. 5c–5f). They were mainly composed of Mg (17 at%), Fe (variable but averaging 8.6 at%), Si (15.5 at%), and O (58 at%) (Fig. 5e), with an average (Fe+Mg)/Si = 1.7, reflecting a composition and morphology consistent with a Mg-Fe serpentine group (Table 5) (Falini et al. 2004). At higher resolution, we observed poorly layered particles with 3–5 layers that were <5 nm wide and <50 nm long and highly susceptible to beam damage (Fig. 5f). We measured the lattice spacing for one of these structures to be 6.9 Å while another structure had 7.2 Å layering (Fig. 5f). Together with the lattice spacing, we tentatively identified the tubular form as an iron-rich Mg-silicate in the serpentine group.

Tan precipitate harvested from control experiment after 7 days at 150 °C (a). Clumps of heterogeneous particles (b–c) included poorly formed tubular spindles (c–d) and faint poorly crystalline globular masses (d-arrows). Some of these particles were primarily composed of Mg-Si-Fe (e) (Table 5 and Online Materials[1] Table S3) and appeared to be layered structures with frayed edges with two particles showing 6.9 and 7.2 Å lattice spacings (f). Other globular particles did not show layering but had lattice spacings including 1.5 Å (f), 2.3 Å (g), and 2.5 Å (g-I). In other regions, we observed blunt-edged rods intermixed with masses of minute globules (h) with both containing Fe- and O-rich measured elemental chemistry (i–j; Table 5). Basal spacing of the blunt-edge rods was measured to be 6.2 Å (k), similar to another phase with a lathe-like morphology (l) with 3.2 and 6.1 Å lattice spacing (l-I and l-II). The polynanocrystalline SAED pattern from a region containing blunt-edged rods and lathes was most consistent with lepidocrocite (m).
Summary of the average elemental composition of the phases (in at% or as a ratio) at each experimental condition
| Average at% | Elemental ratios | |||||||
|---|---|---|---|---|---|---|---|---|
| Experimental condition | Fe | Mg | Si | Al | O | avg Fe/(Fe+Mg) | avg (Fe+Mg)/Si | range (Fe+Mg)/Si |
| Bubbled 25C Poorly layered | 19.94 | 2.00 | 17.91 | 0.96 | 59.19 | 0.91 | 1.23 | 1.06–1.34 |
| Bubbled 25C Mixed poorly crystalline oxides, layered, salts | 18.96 | 1.83 | 18.04 | 1.73 | 59.45 | 0.91 | n.a. | n.a. |
| Bubbled 80C Well-ordered layered | 27.70 | 1.61 | 12.94 | 1.03 | 56.73 | 0.95 | 2.27 | 2.11–2.43 |
| Bubbled 150C Well-ordered layered | 22.13 | 4.54 | 14.91 | 0.77 | 57.65 | 0.83 | 1.79 | 1.59–2.14 |
| Bubbled 220C Well-ordered layered | 16.22 | 10.02 | 15.23 | 0.87 | 58.01 | 0.62 | 1.72 | 1.6–1.85 |
| Bubbled 220C Spinel Group Oxide | 22.44 | 9.17 | 10.68 | 1.59 | 56.13 | 0.71 | n.a. | n.a. |
| Control 150C Poorly layered | 8.58 | 17.35 | 15.50 | 0.65 | 57.91 | 0.33 | 1.67 | 1.45–1.67 |
| Control 150C Iron Oxide Mass | 31.08 | 4.17 | 7.89 | 2.33 | 54.53 | 0.88 | n.a. | n.a. |
| Control 150C Iron Oxide Rods | 28.54 | 7.13 | 7.39 | 2.59 | 54.34 | 0.80 | n.a. | n.a. |
| Control 220C Well-ordered layered | 4.78 | 28.84 | 10.21 | 0.85 | 55.32 | 0.14 | 3.29 | 3.29 |
| Control 220C Spinel Group Oxide | 27.81 | 9.24 | 7.40 | 1.48 | 54.07 | 0.75 | n.a. | n.a. |
Note: Also see the raw EDS data for each experiment in Online Materials[1] Table S3.
In other regions of the 150 °C control, we identified two types of iron oxides. We observed a faint globular phase in lower magnification images (Fig. 5d, arrows) and identified lattice spacings of 1.5 Å (Fig. 5f adjacent to layered phase) as well as 2.3 and 2.5 Å (Figs. 5f and 5g). This poorly crystalline phase was often in an intimate mixture with a rod-like phase (Fig. 5h), but elemental chemistry mapping indicated this phase was primarily iron (31%) and oxygen (54.5%) (Figs. 5i and 5j; Table 5). These lattice spacings and elemental chemistry are similar to ferrihydrite, a poorly crystalline iron oxide that often forms early after iron is oxidized in neutral waters. Additionally, we imaged more crystalline blunt-edged rods, <20 nm wide and 100–150 nm long, in this sample (Figs. 5h and 5k). These rods had a lattice spacing of 6.2 Å (Figs. 5k–5l) and elemental analysis indicated that they were primarily composed of Fe (28.5 at%) and O (54.3 at%) (Figs. 6i–6j; Table 5), suggesting an iron oxide mineral. This iron oxide phase also exhibited a lath morphology ~20 nm wide and ~100 nm long (Fig. 6l) with a lattice spacing of 3.2 and 6.1 Å (Figs. 5l-I and 5l-II). Neither the blunt edged rods or laths were observed to be degraded by the electron beam during analysis. SAED on a region containing these blunted rods and laths produced a polynanocrystalline pattern (Fig. 5m) consistent with the iron oxide lepidocrocite.

Tan precipitate harvested from control experiment after aging for 7 days at 220 °C (a). Homogenous clumps composed of hollow tubes (b–d) and measured elemental chemistry (e). Viewing down the tube axis and along the profile of the tube we measured the lattice spacing to be 7.2 Å in both instances (f and g-I) and measured 4.3 Å at a different orientation (g-II). A globular phase was observed (h) with elemental chemistry rich in Fe and O (i). SAED of a region containing both the tubular and globular phase, respectively, produced a polynanocrystalline pattern consistent with a magnesium-silicate and planes for a spinel group phase (j).
The control experiment further aged at 220 °C for 7 additional days also contained a small amount of tan precipitate (Fig. 6a). TEM images of the 220 °C control experiment showed abundant ~100–200 nm long hollow tubes with 0.6–0.8 nm inner diameters and 2–2.8 nm outer diameters (Figs. 6b–6d and 6f–6g). The elemental chemistry of these tubular structures was primarily Mg (29 at%), Fe (5 at%), Si (10 at%), and O (55 at%), suggesting they were a magnesium silicate with possibly some Fe(III) substituted for Si (Fig. 6e; Table 5). Along the tube axis, we were able to capture two separate instances of 7.2 Å lattice spacing and higher order lattice planes of 3.6 Å (004) and 2.4 Å (006) (Figs. 6f and 6g-I). Another tube at a different orientation captured the 4.3 Å (111) lattice plane of this phase (Fig. 6g-II). SAED of the control 220 °C experiment on a broad region composed mostly of tubes produced diffraction halos, suggesting a poorly crystalline phase (Fig. 6j). This tubular phase had an elemental chemistry, lattice spacings, and SAED pattern consistent with a precursor form of the fibrous magnesium serpentine, chrysotile.
TEM analyses of the 220 °C control experiment also captured a ~100 nm wide globular phase (Fig. 6h). The elemental data of this phase indicated that it primarily contained Fe (28 at%) and O (54 at%) (Fig. 6h–6i; Table 5), suggesting an iron oxide. Additionally, the broad SAED of the 220 °C control experiment had distinct diffraction planes (manifesting as dots) that corresponded to the lattice spacings of 2.9 Å (220), 1.4 Å (440), and 1.0 Å (553) (Fig. 6j). These lattice planes captured by SAED in tandem with an elemental chemistry rich in iron and oxygen lead us to tentatively identify the globular phase as a spinel group iron oxide; notably, these lattice spacings align well with maghemite. With its globular morphology rather than the platelet morphology of the magnetite in the bubbled experiments (see below), it is possible that this phase was not magnetite but instead was a different spinel group oxide like maghemite.
Bubbled experiments: Iron oxide phases. We imaged the bubbled precipitates at temperatures 25–220 °C using TEM. All our bubbled experiments appeared to produce both a phyllosilicate phase (see below) and a poorly crystalline iron oxide phase, while experiments aged at >80 °C additionally contained a more crystalline iron oxide.
The subtle oxide phase observed in all the bubbled experiments appeared as a faint globular phase in the background matrix (Fig. 7). SAED on the 25 °C assemblage produced a diffuse halo pattern corresponding to 1.3, 1.5, and 2.6 Å lattice spacings (Fig. 8g). These diffuse SAED halos reflect the formation of a poorly crystalline phase, consistent with the lack of peaks by XRD (Fig. 3), but the spacings are typical of ferrihydrite. Using HR-TEM, we observed that the globular phase had a recurring lattice spacing of ~2.5–2.6 Å (Figs. 7c, 7e, 7g, and 7i). We also observed a ~1.6 Å spacing (Fig. 7g). EDS spectra that included this phase suggested it was rich in Fe, O, and Si (Table 5; Online Materials[1] Table S3). Together, we suggest our data points to Si-rich ferrihydrite, which has major spacings at 1.5, 1.6, 2.5,

Subtle globular phase observed in all bubbled experiments and tentatively identified as ferrihydrite. At 25 °C, TEM imaging captured a faint background, webbing-like phase (a-arrows) and SAED of the region showed diffuse halos corresponding to 1.3, 1.5, and 2.6 Å lattice spacings (b). HR-TEM and IFFT analysis of this phase identified a lattice spacing of 2.6 Å (c, c-I, c-II). Similarly, we observed a globular phase at 80 °C (d–e) with a major spacing at 2.5 and 2.6 Å (e-I, e-II). An image of the bubbled precipitate at 150 °C showed an aggregate of small globules (e–f) and analysis of this “background” phase showed 1.6 and 2.6 Å spacing (g-I, g-II). After 220 °C aging, TEM imaging continued to show faint round morphologies (h–i) with 2.6 Å lattice spacing (i-II).

After hydrothermal aging, we observed a plate-like phase that often had a triangular or polygonal shape, ultimately identified as magnetite. One TEM image of the 80 °C sample showed all three phases that we observed, including triangular platelets (a-arrows). This phase was also identified intermixed with layered structures (b) where we measured a 4.7 Å lattice fringe (c) and multiple FFT lattice spacings corresponding to a spinel group phase such as magnetite (c-I). We also observed a platelet phase after the 150 °C hydrothermal treatment (d-arrows, e) with 4.7 Å lattice spacing (f) where FFT confirmed the presence of lattice planes consistent with a spinel group mineral (f-I). Additionally, we obtained iron- and oxygen-rich elemental chemistry on a platelet phase after 220 °C aging (g) and measured 4.7 Å lattice spacing (h) and FFT lattice planes consistent with a spinel group identification (h-I). SAED of an area containing the platelets displayed polynanocrystalline halos at the lattice planes of a spinel group mineral (i).
and 2.6 Å in its 2-line and 6-line forms (Michel et al. 2007).
Starting at 80 °C and increasingly at higher temperatures, we also observed a more crystalline triangular or polygonal platelet phase in the bubbled experiments that we ultimately identified as magnetite (Fig. 8). TEM and HR-TEM analysis of the bubbled precipitates aged at 80, 150, and 220 °C captured ~50–100 nm wide platelets with a characteristic 4.7 Å basal spacing (Figs. 8c, 8f, and 8h) along with additional lattice planes by FFT (Figs. 8c-I, 8f-I, and 8h-I) corresponding to a spinel group phase such as magnetite. For example, after 150 °C aging, FFT on an area with platelets revealed lattice spacing planes of 4.8 Å (111), 2.4 Å (222), 1.6 Å (333), and 2.5 Å (311) (Fig. 8f-I), very similar to the spacings expected for spinel group phases. FFT analysis on a platelet-rich region after 220 °C aging (Fig. 8h-I) showed these same lattice spacings and additionally a spacing at 1.7 Å (422), which is also observed in spinels. We were able to obtain a SAED pattern of a platelet-rich region in this 220 °C aged sample as well (Fig. 8i), which was again consistent with a spinel group mineral like magnetite. We captured elemental data from a region containing the platelet phase and observed that it was mainly composed of Fe (22 at%), O (56 at%), and Si (11 at%) (Fig. 8g; Table 5). We attribute the higher-than-expected measurement of Si in this spinel group phase to be the result of adsorbed Si (Philippini et al. 2006). The lattice spacing of the platelet paired with the elemental chemistry rich in Fe and O, in addition to the strong magnetic reaction of the bubbled and hydrothermally aged precipitates (Figs. 4d–4f), was most consistent with identifying this platelet phase as magnetite.
Bubbled experiments: Silicate phase. Analysis of the 40 day old 25 °C precipitate revealed abundant poorly layered spindly particles that were ~2–4 nm wide and ~20 nm long (Fig. 9). EDS of the layered precipitates from three separate locations yielded a compositional range of 17.5–21 at% Fe, 17–19 at% Si, 1–3 at% Mg, 59–60 at% O (Figs. 9e–9g; Table 5). From this data, we calculated an average (Fe+Mg)/Si ratio of 1.2 for these poorly layered particles (Table 5). These structures were highly susceptible to beam damage, but we were able to capture four representative particles, each with a maximum of 3–4 layers that had an approximate lattice spacing of ~7.2–7.7 Å (Figs. 9h-I, 9h-II, 9i-I, and 9i-II) measured by IFFT. The observed morphological, structural, and elemental data suggested this phase was a Fe-rich incipient serpentine.

TEM-based observations of poorly layered structures from green precipitate (a) harvested from the bubbled experiment held at 25 °C for 40 days. We saw abundant particles with a spindly morphology in clusters (b–d) where we mapped and analyzed their elemental chemistry (e–g), finding the major elements were Fe, Si, and O with minor Mg. Note that the average compositions shown in f and g are from hand-drawn regions to pick out the layered particles, and the chemistry in g derives from the interior silicate-rich portion of the aggregate. The best captured particles exhibited a maximum of 3–4 layers (h–i) with an approximate basal spacing of ~7.2–7.7 Å determined by IFFT (h-I, h-II, i-I, and i-II).
In the bubbled experimental precipitate aged at 80 °C for seven additional days, TEM imaging revealed layered crystals with a variable degree of ordering (Fig. 10). We observed ~100 nm wide and ~300–700 nm long bladed structures and measured their lattice fringe at 7.2 Å (Figs. 10b–10e and 10h). TEM also revealed multiple instances of a triangular-trapezoidal form [Fig. 10b (arrows) and 10f–10g] where the well ordered regions had a 7.0 Å lattice fringe (Fig. 10j-I). The bladed and triangular-trapezoidal structures together exhibited an average elemental chemistry with low Mg (1.6 at%) and a range of (Fe+Mg)/Si of 2.11–2.43, consistent with an iron silicate within the cronstedtite-greenalite solid solution (Figs. 10d–10e and 10g; Table 5). The large remaining portion of the structure exhibited multiple crystal defects restricting the number of ordered layers (Figs. 10i–10j); however, we did measure a 7.2 Å lattice fringe in this region as well (Fig. 10i-I). SAED on an area containing the bladed and trapezoidal structures produced recurring diffraction planes congruous with a serpentine group silicate (Fig. 9k).

TEM analyses of green precipitate (a) harvested from the bubbled experiment after 7 days at 80 °C, focusing on the layered structures. We observed a heterogeneous mixture of morphologies, including well ordered blades (b–e) with the elemental chemistry maps shown for Fe, Si, Mg, and O (d) and average chemistry shown in e. There were also trapezoidal structures (b-arrows, f–g, i–j) with similar chemistry rich in Fe, Si, and O (chemistry shown from “caps” of structures). The blades showed a 7.2 Å lattice fringe (h), while the trapezoidal structure’s “body” (i) had frequent crystal defects (i-arrows) but still contained 7.2 Å lattice spacing (i-I). The well crystallized “caps” of the trapezoidal structure (j) had 7.0 and 2.1 Å lattice spacing (j-I and j-II) while SAED of a heterogeneous area similar to panel b produced recurring lattice planes consistent with a serpentine group phase (k).
TEM analysis of the bubbled sample at 150 °C for an additional 7 days displayed well ordered layered structures ~100–200 nm long and ~10–50 nm wide (Fig. 11b–11d). Using elemental data from three regions containing layered structures (Figs. 11e–11g), we calculated an average (Fe+Mg)/Si = 1.8 with a Mg content of 4.5 at% (Table 5). We measured 7.2–7.3 Å basal spacing in two separate particles from one image (Figs. 11h and 11h-I). In another instance, a well-ordered layered particle was in the proper orientation to capture both its basal lattice spacing of 7.1 Å (Fig. 11i) and 24 Å superlattice (Fig. 11i-I). Collectively, the TEM data demonstrated that these structures were greenalite-like minerals.
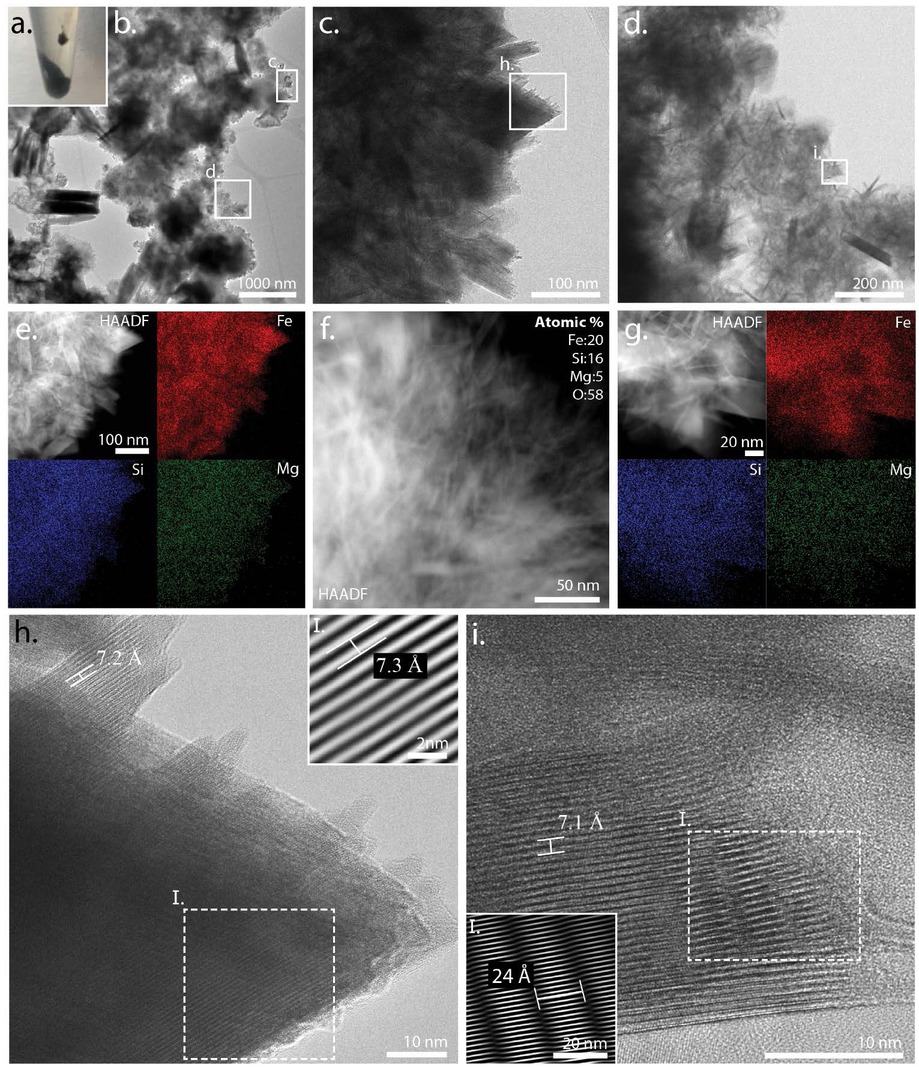
Layered phase observations from the dark green precipitate (a) harvested from the bubbled experiment after 7 days at 150 °C. TEM revealed a heterogeneous mixture of phases (b) including well-ordered blades (c–f) where the elemental chemistry of the layered blades indicated a phase rich in Fe and Si with around 5% Mg (e–g; Table 5). Lattice spacings of this layered phase were measured to be 7.2 Å (h) and 7.3 Å (h-I), with some particles showing not only the basal lattice spacing (001) 7.1 Å (i) but also a 24 Å superlattice modulation (i-I).
TEM of the bubbled experiment after 7 days at 220 °C revealed ~400 nm clusters of well-ordered layered structures that were ~20–60 nm wide and ~100 nm long (Fig. 12). In general, we observed fewer well-ordered layered structures at 220 °C compared to lower temperatures, but the structures were highly crystalline. We determined that the basal lattice spacing was 7.1 Å in two separate layered particles (Figs. 12c and 12f), with one of these particle orientations also capturing a ~21 Å superlattice (Fig. 12f-I). We also measured the elemental composition of these layered structures in two regions (Figs. 12d and 12g), and observed that the particles remained Fe- and Si-rich but the average Mg content had increased to 10% (Table 5). This data enabled us to calculate the average (Fe+Mg)/Si of 1.7 (Table 5). Collectively, the TEM data demonstrated that these structures were greenalite-like minerals.
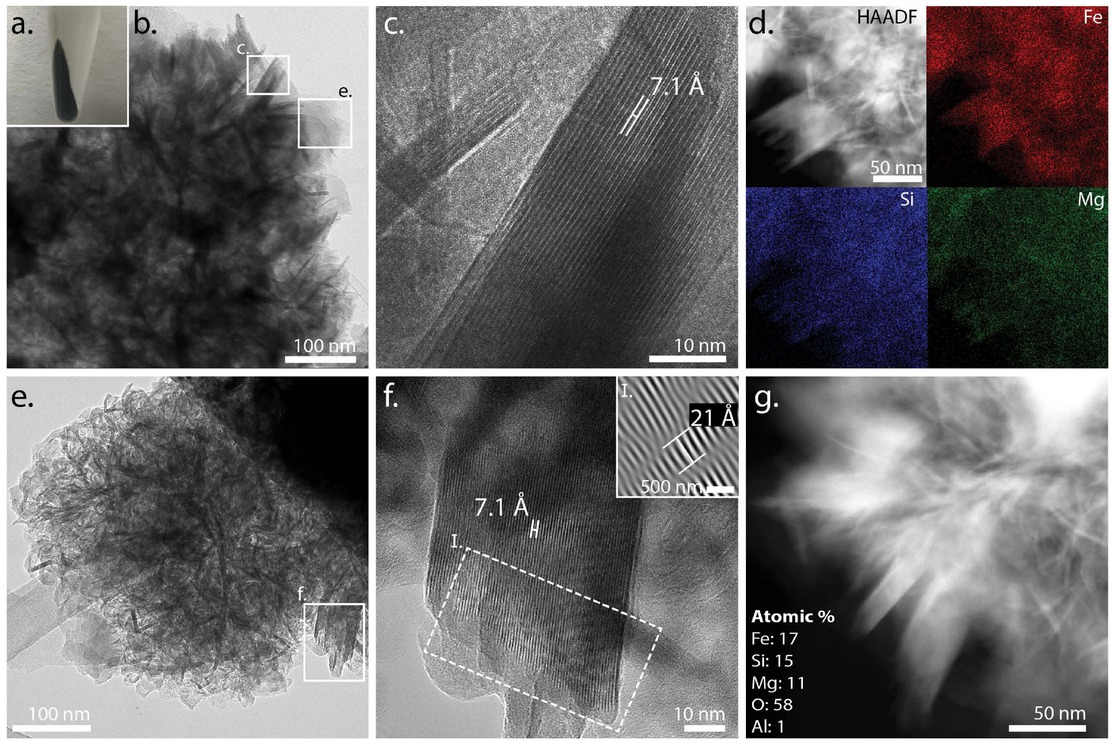
Layered structures in the bubbled experiment after 7 days at 220 °C, which yielded the darkest green-black precipitate (a). TEM revealed the heterogeneous phases (b) within this experiment that included well-ordered blades with a 7.1 Å lattice spacing (c) along with elemental chemistry rich in Fe, Si, and Mg (d). An additional example of this layered, bladed phase (e) showed a 7.1 Å d-spacing (001) with superlattice modulation of 21 Å (f and f-I), and similar elemental chemistry (g).
Synthesis of experimental results
Our ferrous control experiment set at pH 7 with 1:1 Fe:Si did not produce an observable precipitate from solution either at low temperature nor upon 80 °C hydrothermal aging. At 150 °C, we observed temperature-induced precipitation of an abundant but poorly ordered ~7 Å Mg(Fe)-silicate along with ferrihydrite and lepidocrocite (Fig. 5). There may also have been a magnetic mineral like magnetite in this assemblage since this assemblage showed a magnetic response (Fig. 4a). Additional aging at 220 °C of the ferrous control mainly produced chrysotile nanotubes and a spinel group iron-oxide that was potentially maghemite (Fig. 6). During hydrothermal aging, the ferrous solution decreased in pH as temperature increased and minerals precipitated. The 25 °C solution had a pH of 7.17, which decreased to pH 6.74 at 80 °C, and further decreased to pH 6.43 at 150 °C (Fig. 2a; Table 2). This decrease in pH can be attributed to the formation of an Fe(III) (hydr)oxide, such as the lepidocrocite and ferrihydrite that we observed. Additionally, the precipitation of silicate phases will take up hydroxide ions and release protons, also dropping the pH (Zolotov 2014).
Low-O2 bubbled experiments examined in situ Fe(II) oxidation at pH 7 in the presence of silica produced a partially oxidized [~45% Fe(III)/FeT and ~48% Fe(II)/g] precipitate (Fig. 2b). After 40 days at 25 °C, we characterized this low-temperature assemblage as abundant precursor Fe-rich serpentine and ancillary ferrihydrite (Figs. 7a–7c and 9). Aging these precipitates at 80 °C produced a well-layered iron silicate and magnetite alongside ferrihydrite (Figs. 7d, 7e, 8a–8c, and 10). Continued hydrothermal aging at 150 and 220 °C crystallized well-ordered greenalite with incorporated Mg, more magnetite, and some persistent ferrihydrite (Figs. 7f–7i, 8d-I, 11, and 12; Table 5). These higher-temperature assemblages also contained lower Fe(II), ~30% by mass compared to ~50% at ≤80 °C, although their Fe(III)/FeT ratio remained about the same (Table 4). With increasing temperature, the experimental solution pH decreased from a pH of 7.33 at 25 °C down to pH 5.85 at 220 °C (Fig. 2a; Table 2). The continued decrease in pH can be attributed to the formation and recrystallization of the iron silicate and magnetite phases, similar to the control experiments.
Discussion
Impacts of temperature on ferrous controls at circumneutral pH
Our ferrous experiments under simulated silica-rich Archean ocean conditions at pH 7 did not produce a precipitate at low temperature. Other studies with Archean-relevant Fe(II) and Si concentrations produced iron(II) silicates at 25 °C, but only when the pH was elevated to ≥7.5 (Tosca et al. 2016; Farmer et al. 1991; Hinz et al. 2021). During the Fe(II) hydrolysis process, silica inhibits Fe(II) polymerization, resulting in smaller clusters of octahedral Fe(II) and a kinetic barrier to precipitation (Doelsch et al. 2002; Francisco et al. 2020). Our observations of a lack of precipitation at ≤80 °C supports previous studies’ findings that a higher pH is required to induce iron(II) silicate formation under ferrous conditions at low temperature.
However, our ferrous experiment at 25 °C did contain a trace amount of Fe(III) [bulk Fe(III)/FeT = 0.07, Table 3], which would be expected to precipitate at circumneutral pH. The presence of any Fe(III) suggests there may have been slight O2 contamination or a trace Fe(III) impurity in all of our experiments. Even with this minor amount of Fe(III), the lack of precipitate in this experiment is surprising since Fe(III) is highly insoluble at circumneutral pH and readily precipitates as ferric oxides or Fe(II,III) phases from solution. Under these Fe, Si, and pH conditions, we suspect that Fe(III) aqueous complexes, such as
Increased temperatures can influence chemical processes and induce mineral precipitation, and our results showed precipitation in the control precipitates at 150 °C that preferentially incorporated the trace dissolved Fe(III). At this elevated temperature, the control precipitate contained 0.27 Fe(III)/FeT (Fig. 2b; Table 4). Indeed, we observed that Fe(III) oxides, ferrihydrite and lepidocrocite, formed at 150 °C under almost entirely ferrous conditions (Figs. 5d and 5h–5m). Soluble Fe(II) in the presence of poorly crystalline Fe(III) oxides like ferrihydrite is capable of catalyzing the reductive dissolution and secondary mineralization of more crystalline ferric oxides such as lepidocrocite or goethite (Burton et al. 2007; Cornell and Schwertmann 2003; Hansel et al. 2005; Nitschmann 1938; Pedersen et al. 2005). Therefore, we hypothesize that the higher 150 °C temperature promoted the precipitation of ferric oxides from trace dissolved Fe(III), and, in the presence of abundant Fe(II), these initial oxides partially recrystallized into the lepidocrocite that we observed.
Our observations of the ferrous control experiment aged at 150 °C also revealed the precipitation of a magnesium-rich silicate phase. While poorly ordered, the magnesium silicate with ~9 at% iron was notably the most abundant phase and manifested in distinctive tube-like structures with rarely captured 6.9–7.2 Å basal spacing (Figs. 5c–5f; Table 5). This spacing suggests that the control liquid precipitated a poorly formed serpentine group magnesium silicate with substantial incorporation of iron. Thermodynamic modeling indicates that chrysotile and antigorite, two types of serpentine group Mg silicates, are only sTable at pH ~7–7.5 and higher at 150 °C (Online Materials[1] Fig. S1c), suggesting there may be local regions of higher pH to promote precipitation of this observed phase despite the bulk solution pH (6.4, Table 2) being unfavorable for this silicate group.
After 220 °C aging, our ferrous control experiment was predominantly composed of chrysotile nanotubes and a globular iron oxide (Fig. 6). The widespread fibrous chrysotile at 220 °C suggests the transformation of the poorly formed 150 °C Mg-silicate to the more crystalline chrysotile mineral. The elemental analysis of the chrysotile nanotubes showed they included 5 at% Fe (Fig. 6e; Table 5). Chrysotile has been reported to host 2–3 wt% Fe (Bowes and Farrow 1997), where Fe(II) or Fe(III) are capable of being substituted into the octahedral site, but only Fe(III) can be incorporated into the tetrahedral site (Walter et al. 2019). The incorporation of Fe into the chrysotile structure could have been aided by dissolution-reprecipitation reactions during the crystallization of Mg silicates into chrysotile. These reactions mineralizing chrysotile and releasing OH groups likely also buffered the solution to sit within the chrysotile stability field, including raising the pH to the 7.65 that we measured in this experiment (Table 2; Fig. 2a; Online Materials[1] Fig. S1d) (Trittschack et al. 2014). There may have been substantial incorporation of Fe(III) into the chrysotile structure upon 220 °C aging, similar to what occurs during serpentinization (Evans 2008; Tutolo et al. 2019). Indeed, the Fe(III) content of the bulk precipitate increased from 27% at 150 °C to 32% at 220 °C. Alternatively, it is possible that most of the iron in chrysotile was Fe(II), and the majority of the measured 32% Fe(III) in solids was associated with the iron oxide.
In situ Fe(II) oxidation at circumneutral pH and 25 °C
Broadly, our trace O2 bubbling experiments highlight that in situ Fe(II) oxidation in the presence of silica produces an Fe-rich poorly ordered serpentine at pH 7 and 25 °C. The presence of a small proportion of Fe(III) under silica-rich conditions has been shown to induce precipitation of iron-rich solids, including silicate phases (Hinz et al. 2021). This low-Fe(III) trigger provides an alternative mechanism for the formation of precursor Fe-rich serpentine at low temperatures and the predicted lower pH of the Archean ocean. However, in our previous study, adding Fe(III) (aq) in the presence of silica at pH 7 and 25 °C produced mainly an amorphous phase with rare silicates, with a bulk iron redox state of 0.89 Fe(III)/FeT (Hinz et al. 2021). Yet here, in situ Fe(II) oxidation at pH 7 induced the formation of a more ferrous assemblage that was 48% Fe(II)/g and contained approximately equimolar Fe(II) and Fe(III), with more abundant Fe-rich precursor silicate phases alongside ferrihydrite at 25 °C (Figs. 7a–7c and 9; Table 4).
Similar to the control experiments, our results from bubbled experiments suggested that there was additional Fe(III) dissolved in the solution. The acidified 25 °C bubbled solution-precipitate combination contained much higher Fe(III), measuring 0.75 Fe(III)/FeT, compared to the 0.48 Fe(III)/FeT in solids (Tables 3 and 4). This higher bulk measurement possibly reflects that a portion of the Fe(III) was in Fe(III) aqueous complexes, such as Fe(III)-Si,
Products from simulated diagenesis of partially oxidized iron-silica precipitates
In tandem, the bulk redox measurements of the solids suggest that there was substantial dissolution-reprecipitation during the hydrothermal aging incubations. Mineral crystallization often involves a precursor metasTable or amorphous phase dissolving as a more crystalline phase precipitates (Ruiz-Agudo et al. 2017; DeYoreo et al. 2015, 2022). The % Fe(II)/g measurements, which show a ~20% drop between 80 and 150 °C (Table 4), indicate there was a dissolution of at least some of the previously precipitated Fe(II) between these temperatures. However, the unchanging Fe(III)/FeT (Table 4) suggest that a similar proportion of Fe(III) also dissolved during 80 to 150 °C recrystallization and/or transformation. While our TEM data shows that a portion of the Fe(II) recrystallized in more ordered phyllosilicate and magnetite phases, some of the Fe(III) appears to have remained in ferrihydrite since we observed ferrihydrite at all temperatures (Fig. 7). At minimum, a fraction of the initial ferrihydrite was resistant to reactions with dissolved Fe(II) and/or transformation to other iron oxides as is typically seen (Huang et al. 2021) and as we observed in our control experiments. Adsorbed silica may have protected some ferrihydrite from further reactions even up to 220 °C, consistent with other experiments that found Si-rich ferrihydrite does not transform to secondary phases until >500 °C (Rzepa et al. 2016; Campbell et al. 2002). Additionally, the presence of bicarbonate buffer can impede the secondary transformation of ferrihydrite, potentially through bicarbonate forming aqueous complexes with Fe(II) or by adsorbing to ferrihydrite (Hansel et al. 2005).
While iron-rich silicates were present under all hydrothermal conditions (more on their transformations below), the appearance of magnetite at 80 °C and higher temperatures (Fig. 8) revealed that this Fe(II,III) oxide was a secondary phase that mineralized during the simulated diagenetic conditions. The increase in magnetite crystallization with higher temperatures was denoted by sharpened peaks in the XRD patterns (Fig. 3), TEM observations (Fig. 8), and strengthening magnetic attraction (Figs. 4d–4f). Magnetite most likely formed due to reactions between Fe(II) and ferrihydrite, in a known process when there is sufficient Fe(II) to adsorb to the ferrihydrite and induce transformation into magnetite (Tronc et al. 1992; Hansel et al. 2003, 2005). Presumably a portion of the 25 °C ferrihydrite was not as protected by adsorbed silica or bicarbonate and was able to adsorb and react with dissolved Fe(II). However, an alternative (or additional) mechanism to form magnetite could stem from initial Fe(II,III) phyllosilicates relinquishing ferric iron to form more ferrous silicates and magnetite, similar to reactions described by Zolotov (2014) and potentially explaining the deterioration of greenalite-like XRD peaks between 150 and 220 °C (Fig. 3).
Effects of simulated diagenesis on Fe(II,III) silicates
After in situ Fe(II) oxidation at 25 °C, the initial precursor iron silicates crystallized into a well ordered iron serpentine phase upon hydrothermal aging (Fig. 13). To identify and understand the identity and extent of crystallization of iron phyllosilicates, we must examine their observed characteristics. The structural measurements, including the 7 Å basal spacing, of the silicate products in bubbled experiments indicated they were serpentine group silicates, which are composed of alternating silica tetrahedral layers and metal-bound octahedral layers. The chemistry we observed in bubbled silicate products at all temperatures indicated that the principal metal ion was Fe, pointing to a serpentine group iron silicate, either Fe(II) greenalite or Fe(II,III) cronstedtite. One way to differentiate cronstedtite from greenalite stems from the fact that the Fe(II) in greenalite has a misfit between the tetrahedral and octahedral layers, resulting in a modulated structure (Guggenheim et al. 1982; Guggenheim and Eggleton 1998). This superlattice structure of greenalite has a ~23 Å modulation (Guggenheim et al. 1982; Guggenheim and Bailey 1989; Guggenheim and Eggleton 1998; Rasmussen et al. 2021; Johnson et al. 2018), in contrast to the ~17 Å superlattice periodicity of the Mn(II) serpentine end-member caryopilite and the 33–38 Å modulation of the Mg serpentine antigorite (Guggenheim et al. 1982; Capitani and Mellini 2004). Conversely, the Fe(III) within the cronstedtite structure has a smaller ionic radius than Fe(II) or Mg. The Fe(III) substitution for silica at the tetrahedral site stabilizes the layered configuration and restricts structural modulation; therefore, the ~23 Å superlattice is not observed in cronstedtite (Caruso and Chernosky 1979; Wicks and O’Hanley 2018; Hybler et al. 2000). Additionally, the Fe(III) substitution at the silica tetrahedra site in cronstedtite increases its ideal (Fe+Mg)/Si ratio to 4 compared to 1.5 for greenalite, providing an additional way to identify the iron serpentine mineralogy.

Compilation of the layered phase observed in bubbled experiments at temperatures 25, 80, 150, and 220 °C. At 25 °C, we observed spindly particles (a) with a maximum of 4 layers (a-I) measured as having an approximate lattice spacing of 7.7 Å by IFFT (a-II) with FFT only showing the basal d-spacing (001) (a-III). Cluster of poorly layered particles in HAADF (a-IV) shows Mg distribution and content on average (a-V). At 80 °C, we observed well-ordered particles (b) with extensive layering (b-I) with a lattice fringe of 7.2 Å as measured by IFFT (b-II) and showing multiple lattice planes by FFT (b-III). Region with well-ordered layered blades in HAADF (b-IV) and Mg distribution and average content (b-V). We observed similar well-ordered particles at 150 °C (c) with extensive layering (c-I) where the lattice fringe was 7.1 Å by IFFT (c-II) and displayed recurring lattice planes by FFT (c-III). Collection of well-ordered particles in HAADF (c-IV) alongside Mg distribution and content (c-V). At 220 °C, we continued to observe a well-ordered layered phase (d and d-I) with a measured lattice fringe of 7.1 Å by IFFT (d-II) and recurring lattice planes by FFT (d-III). Collection of well-ordered particles in HAADF (d-IV) and Mg distribution and content (d-V).
We can thus place the experimental silicates at various temperatures along the greenalite-cronstedtite solid solution, as well as infer their Fe(III) content, by their measured (Fe+Mg)/Si ratio. To characterize the composition of the silicates and where they fall along the cronstedtite-greenalite solid solution, we used the defined formulas for both end-members, greenalite with possible Mg substitution [(Fe2+,Mg)3Si2O5(OH)4] and cronstedtite with possible Mg substitution [(Fe2+,Fe3+,Mg)3(Si,Fe3+)2O5(OH)4], and compared the (Fe+Mg)/Si ratio of our experimental products against the idealized ratios from mineral formulas. Mg-containing greenalite (Fe2+,Mg)3Si2O5(OH)4 would have a (Fe+Mg)/Si ratio of 1.5, while Mg-containing cronstedtite (Fe2+,Fe3+,Mg)3(Si,Fe3+)2 O5(OH)4 would have a ratio of 4. The silicate precipitated at 25 °C had an (Fe+Mg)/Si of 1.2, below the theoretical (Fe+Mg)/Si ratio for greenalite of 1.5 due to its elevated Si content (Table 5). This higher Si content in the initial, poorly ordered form of iron silicates was similarly observed in prior studies (Tosca et al. 2016; Hinz et al. 2021).
At 80 °C, we observed the crystallization of a 7 Å iron silicate (Figs. 10c, 10e, and 10h; Table 5) with much lower relative Si, averaging a (Fe+Mg)/Si of 2.3, which falls between cronstedtite and greenalite. Additionally, the 80 °C phyllosilicate displayed a pseudo-triangular morphology and lacked any indication of a superlattice despite being well crystallized [Fig. 10b (arrows), 10f, and 10j], consistent with observations from similar cronstedtite formation studies (Pignatelli et al. 2013; Vacher et al. 2019). Based on the defined end-member formulas, the bubbled 80 °C layered precipitate with (Fe+Mg)/Si of ~2.3 was characterized as a 30% cronstedtite and 70% greenalite solid solution (Table 5). Assuming all the measured Fe+Mg was Fe(II) or Fe(III), which is not too inaccurate considering this sample only contained 1.6 at% Mg on average, and assuming that this Fe was equally split between the two redox states, our calculated proportion of cronstedtite would suggest that this 80 °C crystallized phyllosilicate contained approximately 15% Fe(III).
Therefore, there appears to be a transition from a high-Si iron silicate at low temperatures to a crystalline phase within the solid solution between Fe(II) greenalite and Fe(II,III) cronstedtite at 80 °C. Intriguingly, the ΔG°formation for cronstedtite has been found to be favorable at temperatures <120 °C, high Fe/Si ratios, and circumneutral pH, similar to our experimental conditions (Zolotov 2014; Pignatelli et al. 2013, 2014; Vacher et al. 2019). The thermodynamic stability field for cronstedtite under our solution conditions shrinks between 25 and 80 °C, with the redox and pH space filled largely by magnetite (Online Materials[1] Figs. S2a and S2b). These stability field predictions may support a transformation of initial poorly ordered Fe(II,III) silicate, i.e., a precursor cronstedtite-greenalite, into magnetite. Yet the pH of our experimental solutions was lower than the pH range of the stability field of cronstedtite, and our observations of ferrihydrite—a precursor of goethite—would suggest that the redox environment was more oxidizing than the highly reducing conditions required by cronstedtite or greenalite (Online Materials[1] Figs. S2a and S2b). These contradictions suggest that our experimental precipitates formed in heterogeneous microenvironments where pH and the redox state (commonly measured as Eh) were variable. The differences between the thermodynamic predictions and our observations also suggest that the kinetics of these precipitation and crystallization processes determine the solid assemblage, even after 7 days of 80 °C hydrothermal aging.
In contrast to lower-temperature silicates, additional recrystallization and mineralization at higher temperatures (150–220 °C) aging produced an iron phyllosilicate characteristic of the greenalite end-member. In the abundant layered forms, we continued to observe 7 Å spacing typical of a serpentine group silicate (Figs. 11h–11i, 12c, and 12f). Yet the layered phase at these temperatures exhibited a 21–24 Å superlattice (Figs. 11i-I and 12f-I) and (Fe+Mg)/Si of 1.7–1.8 (Table 5), close to ideal greenalite and not congruent with cronstedtite. Our results thus indicate that cronstedtite was not present in experiments ≥150 C°, supporting the thermodynamic predictions (Online Materials[1] Fig. S2) and the hypothesis that cronstedtite does not form at higher temperatures (Vacher et al. 2019). Instead, we suggest the more Fe(III)-rich cronstedtite-greenalite that initially crystallized at 80 °C dissolved and partially reprecipitated into a more end-member Fe(II) greenalite at ≥150 °C. With the narrowing stability field for greenalite, we again speculate that local environments persisted—perhaps buffered by the initial silicates—where higher pH and more reducing redox conditions enabled the continued presence of greenalite. However, we note that the greenalite appeared less abundant in both TEM imaging at 220 °C and in the sample’s XRD pattern, perhaps suggesting that greenalite had indeed partially dissolved or transformed.
Not only did the higher-temperature aging result in greenalite mineralization, but we observed an increasing incorporation of Mg in the layered silicate. While the phyllosilicate had minimal magnesium at 25–80 °C (~1.5–2 at% Mg), Mg increased to 4.5 at% at 150 °C and 10 at% at 220 °C (Fig. 13; Table 5). As there was only trace Mg in the lower temperature precipitates, this incorporated magnesium almost certainly originated from the solution, which contained 10 mM Mg to be analogous to Archean seawater. The large extent of Mg incorporation into the silicate was comparable to the 11–15 at% Mg in 150 °C aged experimental iron silicates either formed under ferrous conditions at pH 7.5 or triggered by a small amount of ferric iron at pH 6.5–7 (Hinz et al. 2021).
Our simulated diagenesis experiments suggest that, similar to today (Berg et al. 2019; Sun et al. 2016), a sink for magnesium in Archean time may have been in the Mg enrichment of silicates during sedimentary diagenesis and burial. For example, studies of the Amazon delta sediments have shown that Mg is incorporated in secondary silicate clays during simulated and observed diagenesis (Michalopoulos and Aller 1995; Rude and Aller 1989). The process of clay mineralization in the sediments, also known as “reverse weathering” or clay authigenesis, is supported by the uptake of Mg in much of today’s marine sediments and concomitant depletion of Mg in pore waters (Sayles 1979; Gieskes 1975; Sun et al. 2016).
This precipitation and/or incorporation of Mg during high-temperature recrystallization is also reminiscent of the behavior of Mg in hydrothermal vent systems and the flanks of mid-ocean ridges, where Mg is largely removed from heated circulating seawater to form Mg-silicate phases (German and Seyfried 2014; Mottl and Wheat 1994). Experiments simulating this seawater-basalt interaction at 250–290 °C observed the precipitation of the Mg aluminosilicate saponite (Voigt et al. 2020). In our experiments, Mg likely remained dissolved until sufficiently high temperatures because of the very sTable Mg hydration complex (Hostetler and Christ 1968; Sayles and Fyfe 1973) and then the Mg partitioned into the iron silicate as its kinetic barriers to mineralization were overcome by increased temperature. Notably, our observation of increasing Mg with continued aqueous alteration also follows the pattern of Mg enrichment during the aqueous alteration inferred in carbonaceous CM chondrites (Suttle et al. 2021; McSween 1979; Tomeoka et al. 1989; Howard et al. 2011) and increasing Mg in serpentines during serpentinization alteration reactions (e.g., Evans 2008; Beard et al. 2009). Our experimental results therefore support the hypothesis that Mg will exchange for Fe with progressive alteration, following the chondrite alteration model of McSween (1979) and Tomeoka et al. (1989).
Implications
This study demonstrates that iron phyllosilicates will precipitate under simulated Archean ocean conditions as a result of in situ Fe(II) oxidation. We showed that in situ Fe(II) oxidation in the presence of silica at pH 7 can precipitate poorly ordered iron-rich phyllosilicates with a very low Mg content at 25 °C. At 80 °C, these precipitates crystallized into low-Mg iron phyllosilicates in the solid solution between greenalite and cronstedtite. These 80 °C iron silicate nanoparticles appeared remarkably similar to inclusions in early-forming BIF chert that are composed of low-Fe(III) greenalite with negligible Mg (Rasmussen et al. 2019; Johnson et al. 2018). With increasing temperature (to simulate further diagenesis), our experimental phyllosilicates transformed into a more greenalite-like mineral with less Fe(III) but considerably more Mg. In contrast, the low (<0.5 at%) Mg content of iron phyllosilicate inclusions in BIF cherts suggests that they were likely formed under low temperatures, then preserved and isolated in chert, restricting further reaction with Mg-containing seawater.
In the context of the BIF rock record, our observations could also provide insights into how diagenesis in the presence of Mg-rich fluids affects the crystallization and transformation of other BIF iron silicates as well. Broader scale BIF studies of iron silicates (greenalite, minnesotaite, and stilpnomelane) that are not preserved in chert can have a large range of Mg content (0.6–6.7 wt% MgO) within the silicate phases (Klein 1974, 2005; Floran and Papike 1978). Our data would suggest the more elevated (>~2 at%) levels of Mg in these silicates derived from the continued higher-temperature alteration of the initial BIF sediments without the isolation provided by early-mineralizing chert. Consistent with this idea, observations of the silicate-bearing facies collected from separate localities with different degrees of BIF diagenesis were measured to have different Fe:Mg ratios (Floran and Papike 1978).
The formation of magnetite that we observed after the simulated diagenesis of iron silicates at high temperatures of ≥150 °C illuminates how BIF sediments may be expected to transform into secondary minerals. Magnetite is ubiquitous in BIF facies, but its origin is not well understood (Klein 2005). Previous petrographic studies of BIFs have shown that most, if not all, of the magnetite in these formations is a relatively late-formed mineral (Goodwin 1956; LaBerge 1964; French 1968, 1973; Han 1982; Kaufman et al. 1990; Kaufman 1996; Beukes and Gutzmer 2008; Rasmussen and Muhling 2018). Magnetite in BIF deposits thus most likely represents diagenetic and/or post-depositional alteration, obscuring the primary mineral(s) from which the magnetite derived. Intriguingly, petrographic observations support magnetite replacing early iron silicate granules (French 1968; Klein 1974; Floran and Papike 1978; Rasmussen and Muhling 2018). We demonstrated that the simulated diagenesis of Fe(II,III) silicates and ferrihydrite at ≥80 °C produces magnetite (Fig. 8). These experiments thus suggest that iron-rich silicate phases are a possible precursor to diagenetic magnetite in BIFs, potentially providing experimental evidence for petrographic observations of iron silicates altering to magnetite.
Other experimental studies have also indicated that magnetite is a secondary mineral that forms during diagenesis. Magnetite can be formed as a product of microbial Fe(III) respiration (Lovley et al. 1987), a process that is hypothesized to occur in BIF sediments (e.g., Walker 1984; Konhauser et al. 2005; Fischer and Knoll 2009). While few studies have simulated burial diagenesis of BIFs, Posth et al. (2013) subjected ferrihydrite and glucose to 14 days of 170 °C and 1200 bars to investigate the diagenetic transformation of Fe(III) oxides and microbial biomass. These experiments also produced magnetite, which they linked to organic carbon-induced reduction of the ferric iron, except when the ferrihydrite was silica-coated. Our results suggest alternative pathways exist to form magnetite during diagenesis: hydrothermally aging mixed Fe(II,III) precipitates and/or Fe(III) phases in the presence of aqueous Fe(II) additionally form magnetite in a process unrelated to organic carbon. Moreover, silica was present in our solutions in the same concentration as ferrous iron; therefore, it appears that silica does not always prevent the formation of magnetite during high-temperature mineralization.
Our simulated diagenesis experiments, therefore, demonstrate the effects of diagenesis on iron silicates, with clear changes to the Fe(III) and Mg content, and ultimately provide support for a secondary origin of magnetite and guidance on how to interpret the magnesium content in iron-rich silicates in the BIF record.
Data Statement
Raw data associated with this publication can be found at https://doi.org/10.5281/zenodo.8173213.
Funding statement: We acknowledge funding from NASA Exobiology (J.E.J., Award 80NSSC18K1060) and NSF Geobiology and Low-Temperature Geochemistry (J.E.J., Award 2142509) that supported this work.
Acknowledgments
We are grateful to Ben Tutolo, Aude Picard, AE Warren Huff, and our lab group for their helpful feedback on this manuscript. We especially thank David Diercks (Colorado School of Mines, Golden, Colorado, U.S.A.) for assistance with TEM imaging and analyses and Victoria Jarvis (McMaster University, Hamilton, Ontario, Canada) for performing the Co-XRD measurements.
References Cited
Amonette, J.E. and Scott, A.D. (1991) Determination of ferrous iron in non-refractory silicate minerals: 1. An improved semi-micro oxidimetric method. Chemical Geology, 92, 329–338.Search in Google Scholar
Andrade, S., Hypolito, R., Ulbrich, H.G.J., and Silva, M.L. (2002) Iron(II) oxide determination in rocks and minerals. Chemical Geology, 182, 85–89, https://doi.org/10.1016/S0009-2541(01)00274-1.Search in Google Scholar
Baldermann, A., Dohrmann, R., Kaufhold, S., Nickel, C., Letofsky-Papst, I., and Dietzel, M. (2014) The Fe-Mg-saponite solid solution series—A hydrothermal synthesis study. Clay Minerals, 49, 391–415, https://doi.org/10.1180/claymin.2014.049.3.04.Search in Google Scholar
Beard, J.S., Frost, R.B., Fryer, P., McCaig, A., Searle, R., Ildefonse, B., Zinin, P., and Sharma, S.K. (2009) Onset and progression of serpentinization and magnetite formation in olivine-rich troctolite from IODP Hole U1309D. Journal of Petrology, 50, 387–403, https://doi.org/10.1093/petrology/egp004.Search in Google Scholar
Bekker, A., Slack, J.F., Planavsky, N., Krapez, B., Hofmann, A., Konhauser, K.O., and Rouxel, O.J. (2010) Iron formation: The sedimentary product of a complex interplay among mantle, tectonic, oceanic, and biospheric processes. Economic Geology and the Bulletin of the Society of Economic Geologists, 105, 467–508, https://doi.org/10.2113/gsecongeo.105.3.467.Search in Google Scholar
Bekker, A., Planavsky, N.J., Krapež, B., Rasmussen, B., Hofmann, A., Slack, J.F., Rouxel, O.J., and Konhauser, K.O. (2014) Iron formations: Their origins and implications for ancient seawater chemistry. In H.D. Holland and K.K. Turekian, Treatise on Geochemistry, 9, 561–628. Elsevier.Search in Google Scholar
Berg, R.D., Solomon, E.A., and Teng, F.Z. (2019) The role of marine sediment diagenesis in the modern oceanic magnesium cycle. Nature Communications, 10, 4371, https://doi.org/10.1038/s41467-019-12322-2.Search in Google Scholar
Bethke, C.M. (2007) Geochemical and Biogeochemical Reaction Modeling, 2nd ed., 564 p. Cambridge University Press.Search in Google Scholar
Beukes, N.J. (1984) Sedimentology of the Kuruman and Griquatown Iron-formations, Transvaal Supergroup, Griqualand West, South Africa. Precambrian Research, 24, 47–84, https://doi.org/10.1016/0301-9268(84)90069-X.Search in Google Scholar
Beukes, N.J. and Gutzmer, J. (2008) Origin and Paleoenvironmental significance of major iron formations at the Archean-Paleoproterozoic boundary. In S. Hagemann, C.A. Rosière, J. Gutzmer, and N.J. Beukes, Eds., Banded Iron Formation-Related High-Grade Iron Ore. Society of Economic Geologists.Search in Google Scholar
Blättler, C.L., Kump, L.R., Fischer, W.W., Paris, G., Kasbohm, J.J., and Higgins, J.A. (2017) Constraints on ocean carbonate chemistry and pCO2 in the Archaean and Palaeoproterozoic. Nature Geoscience, 10, 41–45, https://doi.org/10.1038/ngeo2844.Search in Google Scholar
Bowes, D.R. and Farrow, C.M. (1997) Major and trace element compositions of the UICC standard asbestos samples. American Journal of Industrial Medicine, 32, 592–594, https://doi.org/10.1002/(SICI)1097-0274(199712)32:6<592:AID-AJIM3>3.0.CO;2-S.Search in Google Scholar
Braterman, P.S., Cairns-Smith, A.G., and Sloper, R.W. (1983) Photo-oxidation of hydrated Fe2+ significance for banded iron formations. Nature, 303, 163–164, https://doi.org/10.1038/303163a0.Search in Google Scholar
Braunschweig, J., Bosch, J., Heister, K., Kuebeck, C., and Meckenstock, R.U. (2012) Reevaluation of colorimetric iron determination methods commonly used in geomicrobiology. Journal of Microbiological Methods, 89, 41–48, https://doi.org/10.1016/j.mimet.2012.01.021.Search in Google Scholar
Brenner, R.L., Ludvigson, G.A., Scal, R., and Dogen, A.U. (1991) Digenetic modeling of siliciclastic systems; status report. Kansas State Geological Survey, 233, 123–137.Search in Google Scholar
Buchholz, A., Laskov, C., and Haderlein, S.B. (2011) Effects of Zwitterionic buffers on sorption of ferrous iron at goethite and its oxidation by CCl4. Environmental Science & Technology, 45, 3355–3360, https://doi.org/10.1021/es103172c.Search in Google Scholar
Burton, E.D., Bush, R.T., Sullivan, L.A., and Mitchell, D.R.G. (2007) Reductive transformation of iron and sulfur in schwertmannite-rich accumulations associated with acidified coastal lowlands. Geochimica et Cosmochimica Acta, 71, 4456–4473, https://doi.org/10.1016/j.gca.2007.07.007.Search in Google Scholar
Cairns-Smith, A.G. (1978) Precambrian solution photochemistry, inverse segregation, and banded iron formations. Nature, 276, 807–808, https://doi.org/10.1038/276807a0.Search in Google Scholar
Campbell, A.S., Schwertmann, U., Stanjek, H., Friedl, J., Kyek, A., and Campbell, P.A. (2002) Si Incorporation into Hematite by Heating Si-Ferrihydrite. Langmuir, 18, 7804–7809, https://doi.org/10.1021/la011741w.Search in Google Scholar
Capitani, G. and Mellini, M. (2004) The modulated crystal structure of antigorite: The m = 17 polysome. American Mineralogist, 89, 147–158, https://doi.org/10.2138/am-2004-0117.Search in Google Scholar
Caruso, L.J. and Chernosky, J.V. (1979) The stability of lizardite. Canadian Mineralogist, 17, 757–769.Search in Google Scholar
Cloud, P. (1973) Paleoecological significance of the banded iron-formation. Economic Geology and the Bulletin of the Society of Economic Geologists, 68, 1135–1143, https://doi.org/10.2113/gsecongeo.68.7.1135.Search in Google Scholar
Cornell, R.M. and Schwertmann, U. (2003) The Iron Oxides: Structure, Properties, Reactions, Occurences and Uses, 1st ed., 703 p. Wiley.Search in Google Scholar
De Yoreo, J.J., Gilbert, P.U.P.A., Sommerdijk, N.A.J.M., Penn, R.L., Whitelam, S., Joester, D., Zhang, H., Rimer, J.D., Navrotsky, A., Banfield, J.F., and others. (2015) Crystallization by particle attachment in synthetic, biogenic, and geologic environments. Science, 349, aaa6760, https://doi.org/10.1126/science.aaa6760.Search in Google Scholar
De Yoreo, J.J., Nakouzi, E., Jin, B., Chun, J., and Mundy, C.J. (2022) Spiers Memorial Lecture: Assembly-based pathways of crystallization. Faraday Discussions, 235, 9–35, https://doi.org/10.1039/D2FD00061J.Search in Google Scholar
Derry, L.A. and Jacobsen, S.B. (1990) The chemical evolution of Precambrian seawater: Evidence from REEs in banded iron formations. Geochimica et Cosmochimica Acta, 54, 2965–2977, https://doi.org/10.1016/0016-7037(90)90114-Z.Search in Google Scholar
Dietzel, M. (2000) Dissolution of silicates and the stability of polysilicic acid. Geochimica et Cosmochimica Acta, 64, 3275–3281, https://doi.org/10.1016/S0016-7037(00)00426-9.Search in Google Scholar
Doelsch, E., Rose, J., Masion, A., Bottero, J.Y., Nahon, D., and Bertsch, P.M. (2002) Hydrolysis of iron(II) chloride under anoxic conditions and influence of SiO4 ligands. Langmuir, 18, 4292–4299, https://doi.org/10.1021/la011605r.Search in Google Scholar
Doelsch, E., Masion, A., Rose, J., Stone, W.E.E., Bottero, J.Y., Bertsch, P.M. (2003) Chemistry and structure of colloids obtained by hydrolysis of Fe(III) in the presence of SiO4 ligands. Colloids and Surfaces A: Physicochemical and Engineering Aspects, 217, 121–128.Search in Google Scholar
Evans, B.W. (2008) Control of the products of serpentinization by Fe2+Mg–1 exchange potential of olivine and orthopyroxene. Journal of Petrology, 49, 1873–1887, https://doi.org/10.1093/petrology/egn050.Search in Google Scholar
Falini, G., Foresti, E., Gazzano, M., Gualtieri, A.F., Leoni, M., Lesci, I.G., and Roveri, N. (2004) Tubular-shaped stoichiometric chrysotile nanocrystals. Chemistry (Weinheim an der Bergstrasse, Germany), 10, 3043–3049.Search in Google Scholar
Farmer, V.C., Krishnamurti, G.S.R., and Huang, P.M. (1991) Synthetic allophane and layer-silicate formation in SiO2-Al2O3-FeO-Fe2O3-MgO systems at 23 °C and 89 °C in a calcareous environment. Clays and Clay Minerals, 39, 561–570, https://doi.org/10.1346/CCMN.1991.0390601.Search in Google Scholar
Farquhar, J., Zerkle, A.L., and Bekker, A. (2011) Geological constraints on the origin of oxygenic photosynthesis. Photosynthesis Research, 107, 11–36, https://doi.org/10.1007/s11120-010-9594-0.Search in Google Scholar
Fischer, W.W. and Knoll, A.H. (2009) An iron shuttle for deepwater silica in Late Archean and early Paleoproterozoic iron formation. Geological Society of America Bulletin, 121, 222–235.Search in Google Scholar
Floran, R.J. and Papike, J.J. (1978) Mineralogy and petrology of the Gunflint Iron Formation, Minnesota-Ontario: Correlation of compositional and assemblage variations at low to moderate grade. Journal of Petrology, 19, 215–288, https://doi.org/10.1093/petrology/19.2.215.Search in Google Scholar
Francisco, P.C.M., Mitsui, S., Ishidera, T., Tachi, Y., Doi, R., and Shiwaku, H. (2020) Interaction of FeII and Si under anoxic and reducing conditions: Structural characteristics of ferrous silicate co-precipitates. Geochimica et Cosmochimica Acta, 270, 1–20, https://doi.org/10.1016/j.gca.2019.11.009.Search in Google Scholar
French, B.M. (1968) Progressive contact metamorphism of the Biwabik Iron Formation, Mesabi Range, Minnesota. Minnesota Geologic Survey, 64, 103.Search in Google Scholar
French, B.M. (1973) Mineral assemblages in diagenetic and low-grade metamorphic iron-formation. Economic Geology and the Bulletin of the Society of Economic Geologists, 68, 1063–1074, https://doi.org/10.2113/gsecongeo.68.7.1063.Search in Google Scholar
German, C.R. and Seyfried, W.E. (2014) Hydrothermal processes. In H.D. Holland and K.K. Turekian, Eds., Treatise on Geochemistry, 2nd edition, 191–233. Elsevier.Search in Google Scholar
Gieskes, J.M. (1975) Chemistry of interstitial waters of marine sediments. Annual Review of Earth and Planetary Sciences, 3, 433–453, https://doi.org/10.1146/annurev.ea.03.050175.002245.Search in Google Scholar
Goodwin, A.M. (1956) Facies relations in the Gunflint iron formation. Economic Geology and the Bulletin of the Society of Economic Geologists, 51, 565–595, https://doi.org/10.2113/gsecongeo.51.6.565.Search in Google Scholar
Guggenheim, S. and Bailey, S.W. (1989) An occurrence of a modulated serpentine related to the greenalite-caryopilite series. American Mineralogist, 74, 637–641.Search in Google Scholar
Guggenheim, S. and Eggleton, R.A. (1998) Modulated crystal structures of greenalite and caryopilite: A system with a long range, in-plane structural disorder in the tetrahedral sheet. Canadian Mineralogist, 36, 163–179.Search in Google Scholar
Guggenheim, S., Bailey, S.W., Eggleton, R.A., and Wilkes, P. (1982) Structural aspects of greenalite and related minerals. Canadian Mineralogist, 20, 1–18.Search in Google Scholar
Gumsley, A.P., Chamberlain, K.R., Bleeker, W., Söderlund, U., de Kock, M.O., Lars-son, E.R., and Bekker, A. (2017) Timing and tempo of the Great Oxidation Event. Proceedings of the National Academy of Sciences, 114, 1811–1816, https://doi.org/10.1073/pnas.1608824114.Search in Google Scholar
Gunnarsson, I. and Arnórsson, S. (2000) Amorphous silica solubility and the thermodynamic properties of H4SiO°4 in the range of 0° to 350 °C at Psat. Geochimica et Cosmochimica Acta, 64, 2295–2307, https://doi.org/10.1016/S0016-7037(99)00426-3.Search in Google Scholar
Haavik, C., Stølen, S., Fjellvåg, H., Hanfland, M., and Häusermann, D. (2000) Equation of state of magnetite and its high-pressure modification: Thermodynamics of the Fe-O system at high pressure. American Mineralogist, 85, 514–523, https://doi.org/10.2138/am-2000-0413.Search in Google Scholar
Halevy, I. and Bachan, A. (2017) The geologic history of seawater pH. Science, 355, 1069–1071, https://doi.org/10.1126/science.aal4151.Search in Google Scholar
Han, T.M. (1982) Iron fonnations of Precambrian Age: Hematite-magnetite relationships in some Proterozoic iron deposits—A microscopic observation. In G.C. Amstutz, G. Frenzel, C. Kluth, G. Moh, A. Wauschkuhn, R.A. Zimmermann, and A. Goresy, Eds., Ore Genesis 451–459. Springer-Verlag.Search in Google Scholar
Hansel, C.M., Benner, S.G., Neiss, J., Dohnalkova, A., Kukkadapu, R.K., and Fendorf, S. (2003) Secondary mineralization pathways induced by dissimilatory iron reduction of ferrihydrite under advective flow. Geochimica et Cosmochimica Acta, 67, 2977–2992, https://doi.org/10.1016/S0016-7037(03)00276-X.Search in Google Scholar
Hansel, C.M., Benner, S.G., and Fendorf, S. (2005) Competing Fe (II)-induced mineralization pathways of ferrihydrite. Environmental Science & Technology, 39, 7147–7153, https://doi.org/10.1021/es050666z.Search in Google Scholar
Hartman, H. (1984) The evolution of photosynthesis and microbial mats: A speculation on the banded iron formations. In Y. Cohen, R.W. Castenholz, and H.O. Halvorson, Eds., Microbial Mats: Stromatolites, 449–453. Alan R Liss.Search in Google Scholar
Heimann, A., Johnson, C.M., Beard, B.L., Valley, J.W., Roden, E.E., Spicuzza, M.J., and Beukes, N.J. (2010) Fe, C, and O isotope compositions of banded iron formation carbonates demonstrate a major role for dissimilatory iron reduction in ~2.5 Ga marine environments. Earth and Planetary Science Letters, 294, 8–18, https://doi.org/10.1016/j.epsl.2010.02.015.Search in Google Scholar
Hinz, I.L., Nims, C., Theuer, S., Templeton, A.S., and Johnson, J.E. (2021) Ferric iron triggers greenalite formation in simulated Archean seawater. Geology, 49, 905–910, https://doi.org/10.1130/G48495.1.Search in Google Scholar
Holland, H.D. (1984) The Chemical Evolution of the Atmosphere and Oceans, 598 p. Princeton University Press.Search in Google Scholar
Hostetler, P.B. and Christ, C.L. (1968) Studies in the system MgO-SiO2-CO2-H2O(l): The activity-product constant of chrysotile. Geochimica et Cosmochimica Acta, 32, 485–497, https://doi.org/10.1016/0016-7037(68)90041-0.Search in Google Scholar
Howard, K.T., Benedix, G.K., Bland, P.A., and Cressey, G. (2011) Modal mineralogy of CM chondrites by X-ray diffraction (PSD-XRD): Part 2. Degree, nature and settings of aqueous alteration. Geochimica et Cosmochimica Acta, 75, 2735–2751, https://doi.org/10.1016/j.gca.2011.02.021.Search in Google Scholar
Huang, J., Jones, A., Waite, T.D., Chen, Y., Huang, X., Rosso, K.M., Kappler, A., Mansor, M., Tratnyek, P.G., and Zhang, H. (2021) Fe(II) Redox chemistry in the environment. Chemical Reviews, 121, 8161–8233, https://doi.org/10.1021/acs.chemrev.0c01286.Search in Google Scholar
Hybler, J., Petricek, A., Durovic, I.S., and Smrcok, L. (2000) Refinement of the crystal structure of cronstedtite-1T. Clays and Clay Minerals, 48, 331–338, https://doi.org/10.1346/CCMN.2000.0480304.Search in Google Scholar
Isson, T.T. and Planavsky, N.J. (2018) Reverse weathering as a long-term stabilizer of marine pH and planetary climate. Nature, 560, 471–475, https://doi.org/10.1038/s41586-018-0408-4.Search in Google Scholar
Izawa, M.R.M., Nesbitt, H.W., MacRae, N.D., and Hoffman, E.L. (2010) Composition and evolution of the early oceans: Evidence from the Tagish Lake meteorite. Earth and Planetary Science Letters, 298, 443–449, https://doi.org/10.1016/j.epsl.2010.08.026.Search in Google Scholar
James, H.L. (1954) Sedimentary facies of iron-formation. Economic Geology and the Bulletin of the Society of Economic Geologists, 49, 235–293, https://doi.org/10.2113/gsecongeo.49.3.235.Search in Google Scholar
Janecky, D.R. and Seyfried, W.E. Jr. (1986) Hydrothermal serpentinization of peridotite within the ocean crust: Experimental investigations of mineralogy and major element chemistry. Geochimica et Cosmochimica Acta, 50, 1357–1378, https://doi.org/10.1016/0016-7037(86)90311-X.Search in Google Scholar
Jiang, C.Z. and Tosca, N.J. (2019) Fe(II)-carbonate precipitation kinetics and the chemistry of anoxic ferruginous seawater. Earth and Planetary Science Letters, 506, 231–242, https://doi.org/10.1016/j.epsl.2018.11.010.Search in Google Scholar
Johnson, J.E. and Molnar, P.H. (2019) Widespread and persistent deposition of iron formations for two billion years. Geophysical Research Letters, 46, 3327–3339, https://doi.org/10.1029/2019GL081970.Search in Google Scholar
Johnson, J.E., Muhling, J.R., Cosmidis, J., Rasmussen, B., and Templeton, A. S. (2018) Low-Fe(III) greenalite was a primary mineral from neoarchean oceans. Geophysical Research Letters, 45, 3182–3192, https://doi.org/10.1002/2017GL076311.Search in Google Scholar
Jones, C., Nomosatryo, S., Crowe, S.A., Bjerrum, C.J., and Canfield, D.E. (2015) Iron oxides, divalent cations, silica, and the early earth phosphorus crisis. Geology, 43, 135–138, https://doi.org/10.1130/G36044.1.Search in Google Scholar
Kappler, A., Pasquero, C., Konhauser, K.O., and Newman, D.K. (2005) Deposition of banded iron formations by anoxygenic phototrophic Fe(II)-oxidizing bacteria. Geology, 33, 865, https://doi.org/10.1130/G21658.1.Search in Google Scholar
Kaufman, A.J. (1996) Geochemical and mineralogic effects of contact metamorphism on banded iron-formation: An example from the Transvaal Basin, South Africa. Precambrian Research, 79, 171–194, https://doi.org/10.1016/0301-9268(95)00093-3.Search in Google Scholar
Kaufman, A.J., Hayes, J.M., and Klein, C. (1990) Primary and diagenetic controls of isotopic compositions of iron-formation carbonates. Geochimica et Cosmochimica Acta, 54, 3461–3473, https://doi.org/10.1016/0016-7037(90)90298-Y.Search in Google Scholar
Kinsela, A.S., Jones, A.M., Bligh, M.W., Pham, A.N., Collins, R.N., Harrison, J.J., Wilsher, K.L., Payne, T. E., and Waite, T.D. (2016) Influence of Dissolved Silicate on Rates of Fe(II) Oxidation. Environmental Science & Technology, 50, 11663–11671, https://doi.org/10.1021/acs.est.6b03015.Search in Google Scholar
Klein, C. (1974) Greenalite, stilpnomenlane, minnesotaite, crocidolite and carbonates in a very low-grade metamorphic Precambrian iron-formation. Canadian Mineralogist, 12, 475–498.Search in Google Scholar
Klein, C. (2005) Some Precambrian banded iron-formations (BIFs) from around the world: Their age, geologic setting, mineralogy, metamorphism, geochemistry, and origins. American Mineralogist, 90, 1473–1499, https://doi.org/10.2138/am.2005.1871.Search in Google Scholar
Klein, C. and Beukes, N.J. (1989) Geochemistry and sedimentology of a facies transition from limestone to iron-formation deposition in the early Proterozoic Transvaal Supergroup, South Africa. Economic Geology and the Bulletin of the Society of Economic Geologists, 84, 1733–1774, https://doi.org/10.2113/gsecongeo.84.7.1733.Search in Google Scholar
Klein, C. and Beukes, N.J. (1992) Models for iron-formation deposition. Cambridge University Press, 147–151.Search in Google Scholar
Konhauser, K.O., Hamade, T., Raiswell, R., Morris, R.C., Grant Ferris, F., Southam, G., and Canfield, D.E. (2002) Could bacteria have formed the Precambrian banded iron formations? Geology, 30, 1079, https://doi.org/10.1130/0091-7613(2002)030<1079:CBHFTP>2.0.CO;2.Search in Google Scholar
Konhauser, K.O., Newman, D.K., and Kappler, A. (2005) The potential significance of microbial Fe(III) reduction during deposition of Precambrian banded iron formations. Geobiology, 3, 167–177, https://doi.org/10.1111/j.1472-4669.2005.00055.x.Search in Google Scholar
Konhauser, K.O., Planavsky, N.J., Hardisty, D.S., Robbins, L.J., Warchola, T.J., Haugaard, R., Lalonde, S.V., Partin, C.A., Oonk, P.B.H., Tsikos, H., and others. (2017) Iron formations: A global record of Neoarchaean to Palaeoproterozoic environmental history. Earth-Science Reviews, 172, 140–177, https://doi.org/10.1016/j.earscirev.2017.06.012.Search in Google Scholar
Krissansen-Totton, J., Arney, G.N., and Catling, D.C. (2018) Constraining the climate and ocean pH of the early Earth with a geological carbon cycle model. Proceedings of the National Academy of Sciences, 115, 4105–4110, https://doi.org/10.1073/pnas. 1721296115.Search in Google Scholar
LaBerge, G.L. (1964) Development of Magnetite in Iron-Formations of the Lake Superior Region. Economic Geology and the Bulletin of the Society of Economic Geologists, 59, 1313–1342, https://doi.org/10.2113/gsecongeo.59.7.1313.Search in Google Scholar
Lovley, D.R., Stolz, J.F., Nord, G.L. Jr., and Phillips, E.J.P. (1987) Anaerobic production of magnetite by a dissimilatory iron-reducing microorganism. Nature, 330, 252–254, https://doi.org/10.1038/330252a0.Search in Google Scholar
Maliva, R.G., Knoll, A.H., and Simonson, B.M. (2005) Secular change in the Precambrian silica cycle: Insights from chert petrology. Geological Society of America Bulletin, 117, 835, https://doi.org/10.1130/B25555.1.Search in Google Scholar
McSween, H.Y. Jr. (1979) Are Carbonaceous Chondrites Primitive or Processed? A Review. Reviews of Geophysics, 17, 1059–1078, https://doi.org/10.1029/RG017i005p01059.Search in Google Scholar
Michalopoulos, P. and Aller, R.C. (1995) Rapid clay mineral formation in amazon delta sediments: Reverse weathering and oceanic elemental cycles. Science, 270, 614–617, https://doi.org/10.1126/science.270.5236.614.Search in Google Scholar
Michel, F.M., Ehm, L., Antao, S.M., Lee, P.L., Chupas, P.J., Liu, G., Strongin, D.R., Schoonen, M.A.A., Phillips, B.L., and Parise, J.B. (2007) The structure of ferrihydrite, a nanocrystalline material. Science, 316, 1726–1729, https://doi.org/10.1126/science. 1142525.Search in Google Scholar
Mizutani, T., Fukushima, Y., Okada, A., Kamigaito, O., and Kobayashi, T. (1991) Synthesis of 1:1 and 2:1 iron phyllosilicates and characterization of their iron state by Mössbauer spectroscopy. Clays and Clay Minerals, 39, 381–386, https://doi.org/10.1346/CCMN.1991.0390407.Search in Google Scholar
Mottl, M.J. and Wheat, C.G. (1994) Hydrothermal circulation through mid-ocean ridge flanks: Fluxes of heat and magnesium. Geochimica et Cosmochimica Acta, 58, 2225–2237, https://doi.org/10.1016/0016-7037(94)90007-8.Search in Google Scholar
Muhling, J.R. and Rasmussen, B. (2020) Widespread deposition of greenalite to form banded iron formations before the Great Oxidation Event. Precambrian Research, 339, 105619, https://doi.org/10.1016/j.precamres.2020.105619.Search in Google Scholar
Nitschmann, H. (1938) Reaktionslenkung durch Keime. Beobachtungen bei der Oxydation von Eisen in Eisen(II)-sulfatlösung. Helvetica Chimica Acta, 21, 1609–1618, https://doi.org/10.1002/hlca.193802101197.Search in Google Scholar
Pavlov, A.A. and Kasting, J.F. (2002) Mass-independent fractionation of sulfur isotopes in Archean sediments: Strong evidence for an anoxic Archean atmosphere. Astrobiology, 2, 27–41, https://doi.org/10.1089/153110702753621321.Search in Google Scholar
Pedersen, H.D., Postma, D., Jakobsen, R., and Larsen, O. (2005) Fast transformation of iron oxyhydroxides by the catalytic action of aqueous Fe(II). Geochimica et Cosmochimica Acta, 69, 3967–3977, https://doi.org/10.1016/j.gca.2005.03.016.Search in Google Scholar
Persson, I. (2018) Ferric chloride complexes in aqueous solution: An EXAFS Study. Journal of Solution Chemistry, 47, 797–805, https://doi.org/10.1007/s10953-018-0756-6.Search in Google Scholar
Philippini, V., Naveau, A., Catalette, H., and Leclercq, S. (2006) Sorption of silicon of magnetite and other corrosion products of iron. Journal of Nuclear Materials, 348, 60–69, https://doi.org/10.1016/j.jnucmat.2005.09.002.Search in Google Scholar
Pignatelli, I., Mugnaioli, E., Hybler, J., Mosser-Ruck, R., Cathelineau, M., and Michau, N. (2013) A multi-technique characterization of cronstedtite synthesized by iron-clay interaction in a step-by-step cooling procedure. Clays and Clay Minerals, 61, 277–289, https://doi.org/10.1346/CCMN.2013.0610408.Search in Google Scholar
Pignatelli, I., Bourdelle, F., Bartier, D., Mosser-Ruck, R., Truche, L., Mugnaioli, E., and Michau, N. (2014) Iron-clay interactions: Detailed study of the mineralogical transformation of claystone with emphasis on the formation of iron-rich T-O phyllosilicates in a step-by-step cooling experiment from 90 °C to 40 °C. Chemical Geology, 387, 1–11, https://doi.org/10.1016/j.chemgeo.2014.08.010.Search in Google Scholar
Pokrovski, G.S., Schott, J., Farges, F., and Hazemann, J.-L. (2003) Iron (III)-silica interactions in aqueous solution: Insights from X-ray absorption fine structure spectroscopy. Geochimica et Cosmochimica Acta, 67, 3559–3573,Search in Google Scholar
Porsch, K. and Kappler, A. (2011) FeII oxidation by molecular O2 during HCl extraction. Environmental Chemistry, 8, 190–197, https://doi.org/10.1071/EN10125.Search in Google Scholar
Posth, N.R., Köhler, I., Swanner, E.D., Schröder, C., Wellmann, E., Binder, B., Konhauser, K.O., Neumann, U., Berthold, C., Nowak, M., and Kappler, A. (. (2013) Simulating Precambrian banded iron formation diagenesis. Chemical Geology, 362, 66–73, https://doi.org/10.1016/j.chemgeo.2013.05.031.Search in Google Scholar
Poulton, S.W., Bekker, A., Cumming, V.M., Zerkle, A.L., Canfield, D.E., and Johnston, D.T. (2021) A 200-million-year delay in permanent atmospheric oxygenation. Nature, 592, 232–236, https://doi.org/10.1038/s41586-021-03393-7.Search in Google Scholar
Rasmussen, B. and Muhling, J.R. (2018) Making magnetite late again: Evidence for widespread magnetite growth by thermal decomposition of siderite in Hamersley banded iron formations. Precambrian Research, 306, 64–93, https://doi.org/10.1016/j.precamres.2017.12.017.Search in Google Scholar
Rasmussen, B., Krapež, B., and Muhling, J.R. (2015) Seafloor silicification and hardground development during deposition of 2.5 Ga banded iron formations. Geology, 43, 235–238, https://doi.org/10.1130/G36363.1.Search in Google Scholar
Rasmussen, B., Muhling, J.R., Tosca, N.J., and Tsikos, H. (2019) Evidence for anoxic shallow oceans at 2.45 Ga: Implications for the rise of oxygenic photosynthesis. Geology, 47, 622–626, https://doi.org/10.1130/G46162.1.Search in Google Scholar
Rasmussen, B., Muhling, J.R., and Fischer, W.W. (2021) Greenalite nanoparticles in alkaline vent plumes as templates for the origin of life. Astrobiology, 21, 246–259, https://doi.org/10.1089/ast.2020.2270.Search in Google Scholar
Riley, J.P. and Chester, R. (1971) Introduction to Marine Chemistry, 465 p. Academic Press.Search in Google Scholar
Rude, P.D. and Aller, R.C., and the Peter D. Rude (2), Robert C. Aller. (1989) Early diagenetic alteration of lateritic particle coatings in Amazon continental shelf sediment. Journal of Sedimentary Research, 59, 704–716, https://doi.org/10.1306/212F9052-2B24-11D7-8648000102C1865D.Search in Google Scholar
Ruiz-Agudo, E., Putnis, C.V., and Rodríguez-Navarro, C. (2017) Reactions between minerals and aqueous solutions. In W. Heinrich and R. Abart, Eds., Mineral reaction kinetics: Microstructures, textures, chemical and isotopic signatures, vol. 16, Chapter 13, p. 419–467. European Mineralogical Union and Mineralogical Society of Great Britain and Ireland.Search in Google Scholar
Rzepa, G., Pieczara, G., Gaweł, A., Tomczyk, A., and Zalecki, R. (2016) The influence of silicate on transformation pathways of synthetic 2-line ferrihydrite. Journal of Thermal Analysis and Calorimetry, 125, 407–421, https://doi.org/10.1007/s10973-016-5345-6.Search in Google Scholar
Sayles, F.L. (1979) The composition and diagenesis of interstitial solutions—I. Fluxes across the seawater-sediment interface in the Atlantic Ocean. Geochimica et Cosmochimica Acta, 43, 527–545, https://doi.org/10.1016/0016-7037(79)90163-7.Search in Google Scholar
Sayles, F.L. and Fyfe, W.S. (1973) The crystallization of magnesite from aqueous solution. Geochimica et Cosmochimica Acta, 37, 87–99, https://doi.org/10.1016/0016-7037(73)90246-9.Search in Google Scholar
Siever, R. (1986) Burial diagenesis of sandstones. U.S. Geological Survey Bulletin, 1578, 237–248.Search in Google Scholar
Siever, R. (1992) The silica cycle in the Precambrian. Geochimica et Cosmochimica Acta, 56, 3265–3272, https://doi.org/10.1016/0016-7037(92)90303-Z.Search in Google Scholar
Spencer, R.J. and Hardie, L.A. (1990) Control of seawater composition by mixing of river waters and mid-ocean ridge hydrothermal brines. The Geochemical Society, 2, 409–419.Search in Google Scholar
Stefánsson, A. (2007) Iron (III) hydrolysis and solubility at 25 °C. Environmental Science & Technology, 41, 6117–6123, https://doi.org/10.1021/es070174h.Search in Google Scholar
Stefurak, E.J.T., Lowe, D.R., Zentner, D., and Fischer, W.W. (2015) Sedimentology and geochemistry of Archean silica granules. Geological Society of America Bulletin, 127, 1090–1107, https://doi.org/10.1130/B31181.1.Search in Google Scholar
Stookey, L.L. (1970) Ferrozine—A new spectrophotometric reagent for iron. Analytical Chemistry, 42, 779–781, https://doi.org/10.1021/ac60289a016.Search in Google Scholar
Stüeken, E.E., Kipp, M.A., Koehler, M.C., and Buick, R. (2016) The evolution of Earth’s biogeochemical nitrogen cycle. Earth-Science Reviews, 160, 220–239, https://doi.org/10.1016/j.earscirev.2016.07.007.Search in Google Scholar
Sun, S., Konhauser, K.O., Kappler, A., and Li, Y.-L. (2015) Primary hematite in Neoarchean to Paleoproterozoic oceans. Geological Society of America Bulletin, 127, 850–861, https://doi.org/10.1130/B31122.1.Search in Google Scholar
Sun, X., Higgins, J., and Turchyn, A.V. (2016) Diffusive cation fluxes in deep-sea sediments and insight into the global geochemical cycles of calcium, magnesium, sodium and potassium. Marine Geology, 373, 64–77, https://doi.org/10.1016/j.margeo.2015.12.011.Search in Google Scholar
Suttle, M.D., King, A.J., Schofield, P.F., Bates, H., and Russell, S. S. (2021) The aqueous alteration of CM chondrites, a review. Geochimica et Cosmochimica Acta, 299, 219–256, https://doi.org/10.1016/j.gca.2021.01.014.Search in Google Scholar
Tomeoka, K., McSween, H.Y., and Buseck, P.R. (1989) Mineralogical alteration of CM carbonaceous chondrites: A review. Proceedings of the NIPR Symposium on Antarctic Meteorites, 2, 221–234.Search in Google Scholar
Tosca, N.J., Macdonald, F.A., Strauss, J.V., Johnston, D.T., and Knoll, A.H. (2011) Sedimentary talc in Neoproterozoic carbonate successions. Earth and Planetary Science Letters, 306, 11–22, https://doi.org/10.1016/j.epsl.2011.03.041.Search in Google Scholar
Tosca, N.J., Guggenheim, S., and Pufahl, P.K. (2016) An authigenic origin for Precambrian greenalite: Implications for iron formation and the chemistry of ancient seawater. Geological Society of America Bulletin, 128, 511–530, https://doi.org/10.1130/B31339.1.Search in Google Scholar
Trendall, A.F. (2002) The significance of iron-formation in the Precambrian stratigraphic record. In W. Altermann and P.L. Corcoran, Eds., Precambrian Sedimentary Environments, 33–66. Blackwell Publishing Ltd.Search in Google Scholar
Trittschack, R., Grobety, B., and Brodard, P. (2014) Kinetics of the chrysotile and brucite dehydroxylation reaction: A combined non-isothermal/isothermal thermogravimetric analysis and high-temperature X-ray powder diffraction study. Physics and Chemistry of Minerals, 41, 197–214, https://doi.org/10.1007/s00269-013-0638-9.Search in Google Scholar
Tronc, E., Belleville, P., Jolivet, J.P., and Livage, J. (1992) Transformation of ferric hydroxide into spinel by iron(II) adsorption. Langmuir, 8, 313–319, https://doi.org/10.1021/la00037a057.Search in Google Scholar
Tutolo, B.M., Evans, B.W., and Kuehner, S.M. (2019) Serpentine-hisingerite solid solution in altered ferroan peridotite and olivine gabbro. Minerals, 9, 47, https://doi.org/10.3390/min9010047.Search in Google Scholar
Vacher, L.G., Truche, L., Faure, F., Tissandier, L., Mosser-Ruck, R., and Marrocchi, Y. (2019) Deciphering the conditions of tochilinite and cronstedtite formation in CM chondrites from low temperature hydrothermal experiments. Meteoritics & Planetary Science, 54, 1870–1889, https://doi.org/10.1111/maps.13317.Search in Google Scholar
Velde, B. (2003) Green clay minerals. Treatise on Geochemistry, 7, 309–324, https://doi.org/10.1016/B0-08-043751-6/07090-0.Search in Google Scholar
Viollier, E., Inglett, P.W., Hunter, K., Roychoudhury, A.N., and Van Cappellen, P. (2000) The ferrozine method revisited: Fe(II)/Fe(III) determination in natural waters. Applied Geochemistry, 15, 785–790, https://doi.org/10.1016/S0883-2927(99)00097-9.Search in Google Scholar
Voigt, M., Pearce, C.R., Fries, D.M., Baldermann, A., and Oelkers, E.H. (2020) Magnesium isotope fractionation during hydrothermal seawater-basalt interaction. Geochimica et Cosmochimica Acta, 272, 21–35, https://doi.org/10.1016/j.gca.2019.12.026.Search in Google Scholar
Walker, J.C.G. (1984) Suboxic diagenesis in banded iron formations. Nature, 309, 340–342, https://doi.org/10.1038/309340a0.Search in Google Scholar
Walter, M., Schenkeveld, W.D.C., Reissner, M., Gille, L., and Kraemer, S.M. (2019) The effect of pH and biogenic ligands on the weathering of chrysotile asbestos: The pivotal role of tetrahedral Fe in dissolution kinetics and radical formation. Chemistry (Weinheim an der Bergstrasse, Germany), 25, 3286–3300, https://doi.org/10.1002/chem.201804319.Search in Google Scholar
Wicks, F. J. and O’Hanley, D.S. (2018) Serpentine minerals: Structures and petrology. In S.W. Bailey, Ed., Hydrous Phyllosilicates, Chapter 5, p. 91–168. De Gruyter. https://doi.org/10.1515/9781501508998-010.Search in Google Scholar
Wilson, A.D. (1955) A new method for the determination of ferrous iron in rocks and minerals. Bulletin of the Geological Survey of Great Britain, 9, 56–58.Search in Google Scholar
Zolotov, M.Y. (2014) Formation of brucite and cronstedtite-bearing mineral assemblages on Ceres. Icarus, 228, 13–26, https://doi.org/10.1016/j.icarus.2013.09.020.Search in Google Scholar
© 2023 Isaac L. Hinz, Leanne Rossi, Chi Ma, and Jena E. Johnson, published by Mineralogical Society of America
This work is licensed under the Creative Commons Attribution-NonCommercial-NoDerivatives 4.0 International License.
Articles in the same Issue
- Fluorine-rich mafic lower crust in the southern Rocky Mountains: The role of pre-enrichment in generating fluorine-rich silicic magmas and porphyry Mo deposits
- Apatite in brachinites: Insights into thermal history and halogen evolution
- A high-pressure structural transition of norsethite-type BaFe(CO3)2: Comparison with BaMg(CO3)2 and BaMn(CO3)2
- An evolutionary system of mineralogy, Part VII: The evolution of the igneous minerals (>2500 Ma)
- Oriented secondary magnetite micro-inclusions in plagioclase from oceanic gabbro
- A multi-methodological study of the bastnäsite-synchysite polysomatic series: Tips and tricks of polysome identification and the origin of syntactic intergrowths
- Petrogenesis of Chang’E-5 mare basalts: Clues from the trace elements in plagioclase
- Experimental investigation of trace element partitioning between amphibole and alkali basaltic melt: Toward a more general partitioning model with implications for amphibole fractionation at deep crustal levels
- Grain-scale zircon Hf isotope heterogeneity inherited from sediment-metasomatized mantle: Geochemical and Nd-Hf-Pb-O isotopic constraints on Early Cretaceous intrusions in central Lhasa Terrane, Tibetan Plateau
- Mechanism and kinetics of the pseudomorphic replacement of anhydrite by calcium phosphate phases at hydrothermal conditions
- Vacancy infilling during the crystallization of Fe-deficient hematite: An in situ synchrotron X-ray diffraction study of non-classical crystal growth
- Simulated diagenesis of the iron-silica precipitates in banded iron formations
- Wave vector and field vector orientation dependence of Fe K pre-edge X-ray absorption features in clinopyroxenes
- Structure and compressibility of Fe-bearing Al-phase D
- Synthesis of boehmite-type GaOOH: A new polymorph of Ga oxyhydroxide and geochemical implications
- Scheelite U-Pb geochronology and trace element geochemistry fingerprint W mineralization in the giant Zhuxi W deposit, South China
- A rare sekaninaite occurrence in the Nenana Coal Basin, Alaska Range, Alaska
- Slyudyankaite, Na28Ca4(Si24Al24O96)(SO4)6(S6)1/3(CO2)·2H2O, a new sodalite-group mineral from the Malo-Bystrinskoe lazurite deposit, Baikal Lake area, Russia
- Ruizhongite, (Ag2□)Pb3Ge2S8, a thiogermanate mineral from the Wusihe Pb-Zn deposit, Sichuan Province, Southwest China