Ternary magnetic silica–graphene oxide composite for remediation of textile dyes from aqueous environment and real samples
-
Ameen Ahmed Saleh Al-Makhathi
 and
Adnan Khan
and
Adnan Khan

Abstract
Inadequate wastewater treatment infrastructure is a substantial worldwide concern, with implications for both the environment and public health. Specifically, the discharge of industrial effluents containing organic pollutants such as dyes represents a significant challenge due to their hazardous characteristics. Among these dyes, Bromophenol Blue (BPB) and Malachite green (MG) are extensively utilized in the industrial sector, contributing to environmental deterioration. In the current study, ternary-magnetic-silicate–graphene oxide [Fe3O4@SiO2–GO] was synthesized using the co-precipitation method and applied for the treatment of wastewater containing BPB and MG dyes. The point of zero charge and surface area of the adsorbent was estimated to be 5.7 and 253.8 m2 g−1, respectively. Energy dispersive X-ray was performed and the presence of iron, silicon, carbon, and oxygen was confirmed. The XRD analysis of GO, Fe3O4, and ternary Fe3O4@SiO2–GO composites were also performed to confirm the crystallinity of the composite. The SEM analysis showed a rough morphology with sheet-like appearance. The ternary composite was then applied for the adsorption of BPB and MG dyes. The maximum adsorption capacity for BPB and MG was 97.35 mg/g and 92.63 mg/g at pH 3 and 5, respectively. The results of the kinetics analysis showed that the pseudo-second-order kinetics model best explained the adsorption data for MG dye while pseudo-first-order kinetics for the BPB dyes. While the data best fitted the Langmuir adsorption isotherm with R 2 values of 0.994 and 0.998 for BPB and MG, respectively. These results demonstrate that Fe3O4@SiO2–GO serves as a promising adsorbent for the efficient removal of Bromophenol Blue (BPB) and Malachite Green (MG) from environmental water samples. Additionally, this adsorbent is environmentally friendly and chemically benign, and it can be reused efficiently for up to five cycles.
1 Introduction
Environmental pollution, primarily attributed to the contamination of drinking water sources, represents a pervasive and critical issue affecting more than one-third of the global population, giving rise to immediate and severe health concerns. The principal culprits contributing to water pollution encompass industrial facilities, sewage treatment plants, and various agricultural practices ( 1, 2, 3, 4 ). It is noteworthy that diverse industries, including textiles, paints, chemicals, cosmetics, leather production, pharmaceuticals, and food manufacturing, release intricate organic chemicals into aquatic environments ( 5 , 6 ). These organic pollutants, characterized by their resistance to biodegradation and propensity for carcinogenic properties, cast a shadow of concern over both aquatic ecosystems and human health ( 7, 8, 9 ).
Within the industrial landscape, the textile sector stands out as a prominent contributor to the generation of liquid effluents, primarily due to its extensive reliance on synthetic dyes ( 10, 11, 12, 13 ). To meet the ever-increasing demands of consumers for a wide spectrum of vibrant and long-lasting colors, textile industries often favor synthetic dyes over their natural counterparts ( 14 , 15 ). These synthetic dyes fall into categories such as cationic (basic dyes), anionic (reactive, acid, or direct dyes), and non-ionic dyes ( 16, 17, 18 ). When released into water bodies, these dyes have the potential to disrupt delicate ecosystems and pose health risks to human populations ( 19, 20, 21 ).
Efforts to mitigate the impact of dye contamination in wastewater involve a variety of methods encompassing adsorption, chemical treatments, and biological approaches ( 22, 23, 24, 25 ). Among these, carbon nanomaterials like graphene oxide (GO) have garnered significant attention for their effectiveness in dye removal due to their cost-effectiveness and environmental friendliness ( 26, 27, 28 ). Additionally, magnetic nanoparticles, particularly magnetite, have been the subject of extensive research within the field of wastewater treatment ( 29 ).
Silica, known for its high surface area and excellent chemical stability, serves as the backbone of these nanoparticles. Graphene oxide, on the other hand, contributes its exceptional mechanical strength, large surface area, and the presence of numerous functional groups that enhance the adsorption capacity. The addition of magnetic properties to these nanoparticles, often through the incorporation of iron oxide nanoparticles, imparts the ability to be easily manipulated and separated from aqueous solutions using external magnetic fields, making their recovery and reusability highly convenient ( 30, 31, 32, 33 ).
The primary objective of this study is to create a composite material by combining graphene oxide (GO) with Fe3O4@SiO2 using a rapid and efficient synthesis method. By harnessing the magnetic properties of Fe3O4, this hybrid material serves as a recoverable adsorbent, enabling the removal of specific cationic and anionic dyes from surrounding fluids. To quantify the concentration of these dyes, a UV spectrophotometer was employed. The research extensively investigated and fine-tuned various factors that influence the efficiency of dye removal. Furthermore, the study delved into the thermodynamics and kinetics of the adsorption process to assess its rate and feasibility. Additionally, the research explored the regeneration of these magnetic graphene oxide composites and their potential for subsequent reuse, demonstrating a comprehensive approach to addressing dye contamination challenges. As per our knowledge, this is the very first piece of work reporting the degradation of toxic dyes using composite.
2 Experimental
2.1 Reagents and chemicals
High-purity analytical grade chemicals were obtained for the current experiment and were used without any additional purification. Powdered graphite was sourced from AVONCHEM, while (NaNO3), (KMnO4), (98 % H2SO4), methanol, and ethanol were procured from SIGMA-ALDRICH. (NH4OH), (KNO3), (CaCl2), (MgCO3), (Na3PO4), (35 % HCl), (35 % NH3), (35 % N2H4·H2O), (35 % H2O2), (FeSO4·7H2O), and (FeCl3·6H2O) were obtained from Haq Chemicals Pakistan. (>99 % H3PO4) used in the experiment was supplied by BDH Lab Inc., and sodium hydroxide (NaOH), (H3BO3), (CH₃COOH), (Na2SiO3), bromophenol blue dye, & Malachite-Green dye had been purchased via “SIGMA-ALDRICH”.
2.2 Instrumentation
Specified tools were used to carry out each measurement in this study. A UV-visible spectrophotometer with matching quartz cells that measure 1 cm in length was one of these tools (Optima SP-3000 Plus, Tokyo, Japan). An analog pH meter (model 7020, Kent Industrial Measurement Ltd., Electronic Instrument Ltd., Chertsey Survey, England), an orbital shaker (model OS-340C, Digi system Laboratory Instrument, Inc., Taiwan, China), a thermostatically controlled water bath (Yu Jia, Hangzhou, China), a magnetic stirrer (model MS 300Hs MI Sung Scientific Co. Ltd., Korea), an ultrasonicator (model DGH.9202, China), and an electro-thermal with constant temperature drying oven (DGH.9202, China) were employed throughout the course of this research.
2.3 Preparation of ternary composite
2.3.1 Synthesis of GO (graphene oxide)
Graphene oxide was synthesized using a modified Hummers’ procedure ( 34 ). Firstly, a solution comprising 2.5 g of sodium nitrate (NaNO3) dissolved in 100 mL of accumulated sulphuric acid (H2SO4) was prepared. Following this, 3 g of graphite powder were introduced into the solution. The mixture was then situated in an “ice bath” for 20 min to maintain a temperature below 10 °C. Next, 0.5 g of KMnO4 was added to the solution. Upon the emergence of a green coloration, an additional 8 g of KMnO4 were introduced, and the mixture was stirred for approximately 90 min.
The solution was swirled for 24 h at ambient temperature after the ice bath had been eliminated. In this process, 100 mL of distilled water, heated to a temperature exceeding 90 °C, were gradually added drop by drop to the mixture while ensuring thorough mixing. Once the distilled water was fully incorporated into the reaction mixture, 10 mL of H2O2 were slowly introduced, resulting in the formation of a yellow-coloured solution. Subsequently, the solution underwent neutralization through a series of distilled water washes, followed by centrifugation, and was finally desiccated in an oven at 60 °C.
2.3.2 Preparation of magnetic nanoparticles (MNPs)
The synthesis of “Fe3O4” particles followed a “co-precipitation” technique as described in the literature ( 35 , 36 ). In accordance with the procedure, “800 mL” of ploughed water was utilized to dilute (6.3 g) of FeCl3·6H2O and (4.2 g) of “FeSO4·7H2O”. This solution was then stirred for “30” min at “80 °C”, resulting in a lucid orange coloured solution.
To achieve a pH of 10, “35 %” ammonia solution was slowly added to the mixture under N2 gas region, causing the “Fe3O4” effectuate to turn “black”. Afterwards 20 min of agitation at 90 °C, the precipitates were subjected to washing with ethanol and ploughed water; ensue by dessicating in an oven set at 60 °C.
2.3.3 Synthesis of binary silica-coated magnetic (Fe3O4@SiO2) composite
The binary silica-coated magnetic composite was synthesized as per the reported literature ( 37 ). The process commenced by dispersing 1 g of Fe3O4 in 80 mL of ploughed water. This dispersion was then subjected to homogenization in a supersonic bath for 30 min. Following that, the pH level was adjusted to six by adding 15 mL of Na2SiO3 solution and some drops of HCl. The mixture underwent an additional 4 h of sonication.
Subsequently, the silica-coated nanoparticles were detached from the solution using an extrinsic magnet. These dual-component nanoparticles, known as “Fe3O4@SiO2”, were meticulously cleansed, desiccated, crushed, and subsequently stored for future usage ( 38 ).
2.3.4 Synthesis of ternary silica–magnetic graphene oxide (Fe3O4@SiO2–GO) composite
The “Fe3O4@SiO2–GO” composite was synthesized following the technique described in the literature, with a few modifications ( 39 ). Briefly, (2 g) of binary Fe3O4@SiO2 nanoparticles were subjected to sonication in “200 mL” of ploughed water. Subsequently, 500 mL of a 0.5 mg per mL GO solution was added to this mixture. Following “30” min of “sonication” the resulting binary “Fe3O4@SiO2” graphene nano-composite, was thoroughly water-washed. It was then left to dry for a period of 12 h in an “oven” at a “temperature” of 60 °C (as illustrated in Figure 1).
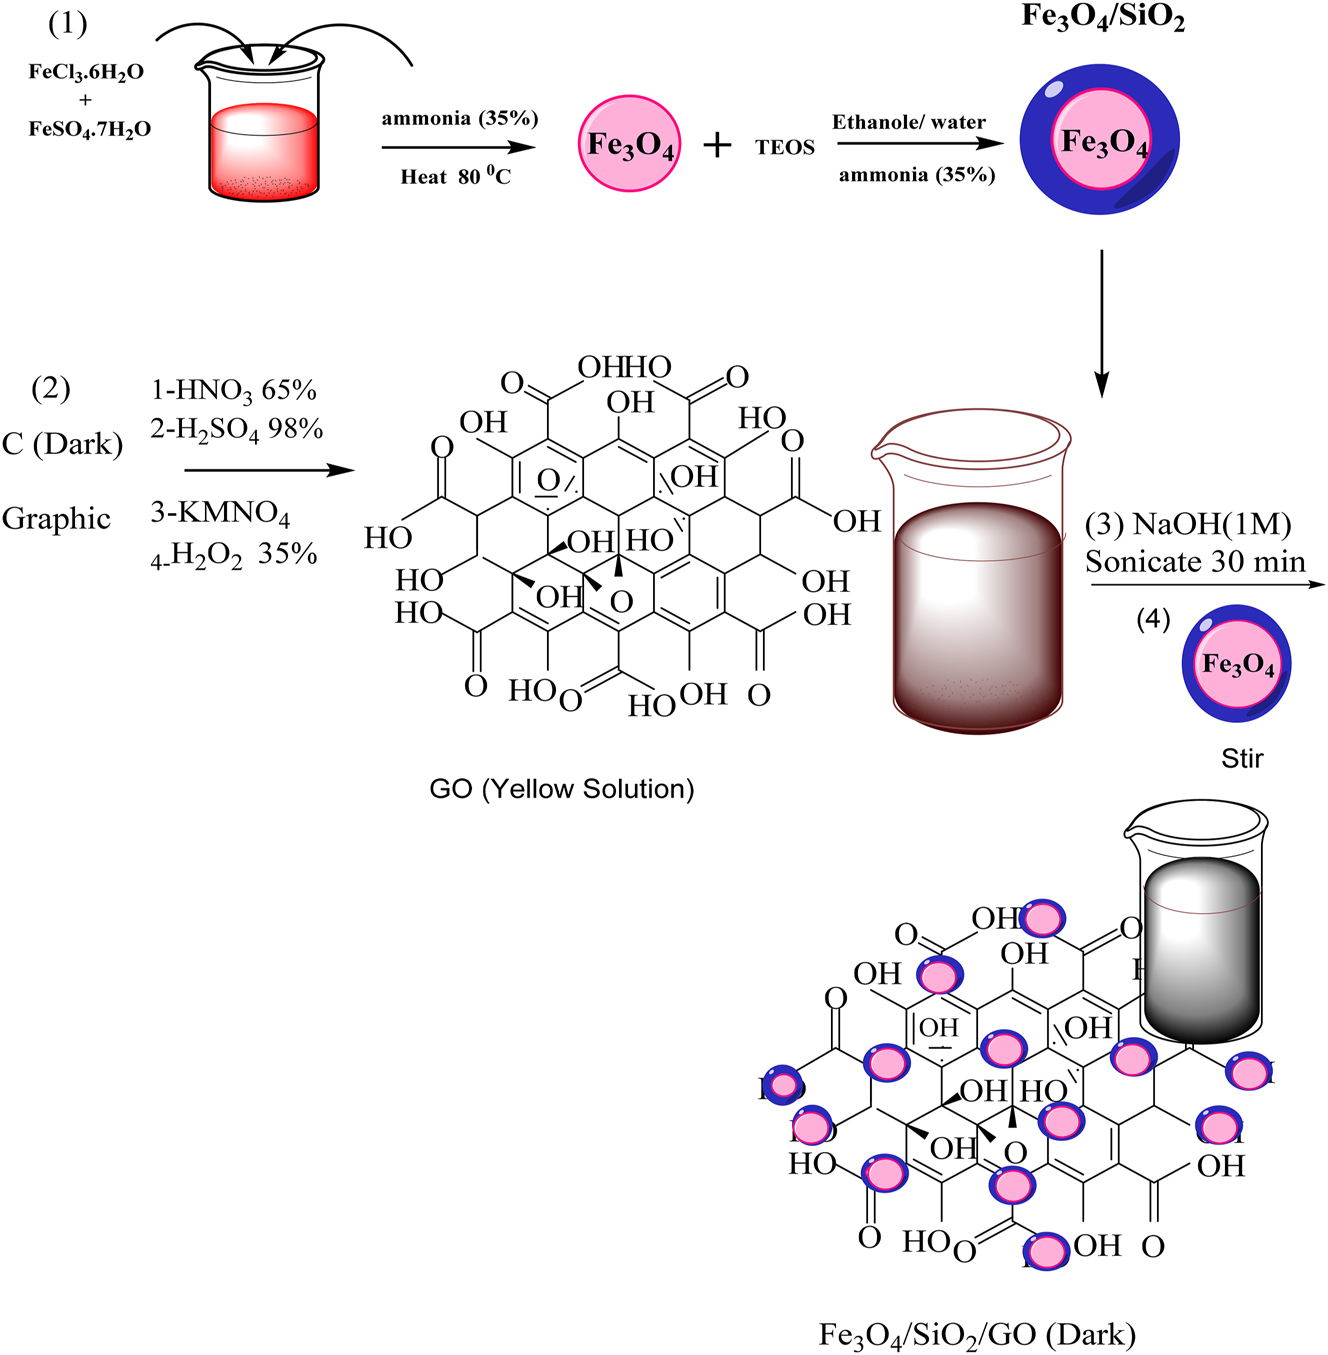
Synthesis route for the synthesis of binary Fe3O4@SiO2 and Fe3O4@ SiO2–GO ternary nanocomposite.
2.4 Characterization
The determination of functional groups was carried out utilizng “FT-IR” (spectrum two Perkin Elmer, United Kingdom). “Elemental” investigation and examination of the “surface” structure of “Fe3O4”, “Fe3O4@SiO2, and Fe3O4@SiO2–GO composites were conducted using “EDX” (model JSM – 5910, JEOL microscope, Japan). “Crystallinity” was assessed through “XRD” (JEOL model JDX – 9C, Japan) at ambient temperature, employing monochromatic Cu-Kα radiation (λ = 1.54 Å) at a potential of “4 × 10⁴ V” and a current of “0.03 A” within a “2θ” range of “0” to “70°”, with a scanning rate of 1.03°/min. “Textural” characteristics of the nano-composite were investigated through SEM using the JSM – 5910, JEOL microscope (Tokyo, Japan). Utilizing the Surface Area Analyzer “NOVA2200e” Quanta chrome, USA, N2 adsorption or desorption at “77.4 K” was used to calculate the “BET” surface area of both modified and unmodified fuller’s earth. The approach described in the literary study was used to find the point of “zero” charge.
The composite surface area was quantitatively measured using titrimetric method. First Sodium thiosulphate and iodine solution were prepared and standardized. Then Fe3O4@SiO2–GO (0.05 g) and 10 mL of standard iodine solution were added to a titration flask and agitated for “30” min with a “magnetic” stirrer. Following stirring, it was dissolved up to “50 mL” and left alone for 30 min. Aft half an hour, the solution was “filtered” utilizing filter paper. “10 mL” of this strain was then removed and placed in another flask, titrated with standardized “thiosulfate” solution to ascertain the amount of un-absorbed “iodine” utilizing “starch” as an indicant. The following equation is used to calculate surface area ( 40 ).
where, 253.80 = I 2 (iodine) (1 mol) superficial area, “V 1” is the volume of I 2, while “C i” and “C f” is the iodine amount “before” and “after” adsorption.
NaOH (0.05 M), HCl (0.05 M), and NaNO3 (0.1 M) solutions were produced, and these solutions were used to compute the PZC. To a 100 mL beaker, NaNO3 was introduced in 25 mL portions. The flasks were agitated on an orbital shaker for 24 h at 120 rmp after the composites’ pH had been altered (0.05 g) using NaOH and HCl solutions. A graph comparing the initial and final pHs of each solution was made after 24 h of measurement.
2.5 Adsorption tests
For “adsorption” examinations, a “batch” adsorption procedure was utilized to remove BPB and MG from the aqueous environment using Fe3O4@SiO2–GO. To do this, an adsorbent composed of Fe3O4@SiO2–GO was substituted to a periodicity of “conical” flasks. These flasks were filled with a standard BPB and MG solution that was kept at a constant pH between 2 and 10 for the pH research. On an orbital shaker, these flasks were shaken at 250 rpm.
The adsorbent was then separated using an extraneous “magnet”, and the sample solution was examined for un-adsorbed BPB/MG utilizing a UV-visible “spectrophotometer” (T60UV, China). The percentage of “sorption” and the “sorption capacity” (q e) were determined by subtracting the “initial” concentration (C i) from the equilibrium concentration (C e) of BPB/MG, as per the equations provided below Eqs. (2) and (3) ( 41 ):
where “V” is the “volume” of the solution in mL, and “M” is the mass/weight of the “sorbent” in grams.
To explore the impact of pH on the adsorption of “BPB/MG” onto “Fe3O4@SiO2–GO”, a known amount of Fe3O4@SiO2–GO was introduced into individual flasks containing standard BPB/MG solutions. The pH levels were adjusted within the range of 3–11 using Britton–Robinson buffer. After agitating the solutions, a magnet was employed to isolate the Fe3O4@SiO2–GO, and subsequent analysis of the solutions was conducted to ascertain the concentration of BPB/MG that remained unabsorbed.
In order to analyse how the amount of the “adsorbent” Fe3O4@SiO2–GO affects the adsorption of BPB/MG, tests were conducted with varying weights of Fe3O4@SiO2–GO, ranging from (0.05 to 0.3 g). These different weights of the adsorbent were added to separate flasks containing BPB/MG solutions at the optimal pH. The mixtures were then agitated until they reached equilibrium. Subsequently, a powerful magnet was used to separate the Fe3O4@SiO2–GO, and the solutions were analysed to determine the concentration of BPB/MG that had not been adsorbed.
To investigate how the concentration of BPB/MG affects the adsorption process, different dye concentrations ranging from 8 μg/ml to 36 μg/ml were introduced into separate flasks containing the optimal amount of adsorbent. We also adjusted the pH and agitated the mixtures using an “orbital” shaker.
For the dynamic examination, Fe3O4@SiO2–GO was added to a noted amount of BPB/MG solution in distinct “flasks” under optimal situations. These mixtures were allowed to reach equilibrium over different time intervals ranging from 10 to 120 min afterward the Fe3O4@SiO2–GO was separated and analysed the solutions to determine the concentration of BPB/MG that hadn’t been adsorbed. The known isotherms were applied to the “data” and calculated the outcomes.
In the thermodynamical examination, the surface assimilation experiments were conducted at various temperatures, ranging from 30 to 100 °C, while maintaining optimal circonstances. Different thermodynamic characteristics were calculated, including “ΔH°”, “ΔG°”, and “ΔS°”, utilizing the “Van’t Hoff equation”. Each parameter was studied in triplicate for accuracy.
2.6 Desorption tests
To assess the potential for reusing the adsorbent material, desorption study was conducted. In this study, experiments were conducted using a known concentration of BPB/MG. Once adsorption equilibrium was reached, the surface-assimilative material was detached from the solution utilizing a “magnet”.
Subsequently, the separated adsorbent was reintroduced into desorption solvent, consisting of a mixture of 5 mL methanol/ethanol, and stirred at a velocity of 200 rate per minute for a duration of “30” min. Following this, the adsorbent was once again separated from the solvent utilizing an extraneous “magnet”, and the quantity of BPB/MG remaining in the solution was measured. The % age of desorption was then measured using the provided equation (4).
In this equation, “M D” represents the initial concentration of BPB/MG “adsorbed” onto the composite material, while “M A” represents the amount of BPB/MG that was desorbed from the composite during the desorption process.
After the “desorption” Procedure, the adsorbent was thoroughly cleaned with distilled water, dessicated, and subsequently reutilzed for the adsorption of BPB/MG. This entire cycle of adsorption and desorption was repeated a total of five times. After each cycle, the percentage of desorption and the recyclability of the adsorbent were measured to evaluate its performance.
2.7 Sample application
In this research, the synthesized Fe3O4@SiO2–GO was also put to practical use by using it to remove BPB/MG from real samples. To achieve this, three different types of real samples were collected: “tap” water from the ICS (Institute of Chemical Sciences) at the Peshawar University, dye wastewater from “Board” Bazaar in Peshawar, and industrialized wastewater from “Hayatabad”, Peshawar. These samples were transported to the research lab and subjected to filtration through a 7–10 μm filter to remove delayed solids. Then, prepared standardized solutions of BPB/MG in mixed form, with concentrations ranging from 1 to 10 μg, and dissolved them to 5 mL using the individual “water” samples. These diluted solutions were analysed using the proposed method.
3 Results and discussion
3.1 Characterization of Fe3O4@SiO2–GO composite
The “Fe3O4@SiO2–GO” composite was synthesized and subjected to a series of tests to validate its preparation and analyse the superficial characteristics and constitution of the Fe3O4@SiO2–GO particles.
3.1.1 FT-IR analysis
FT-IR (Fourier-transform infrared) investigation was conducted to affirm the fabrication of the nano-composite material and identify the various “functional” groups involved in interactions (Figure 2a–c). In the FTIR spectra of “Fe3O4” nanoparticles, distinct “peaks” at 584 cm−1 and 3375 cm−1 were observed, related to the expansion of the Fe–O–Fe bonds and the O–H bonds, severally.
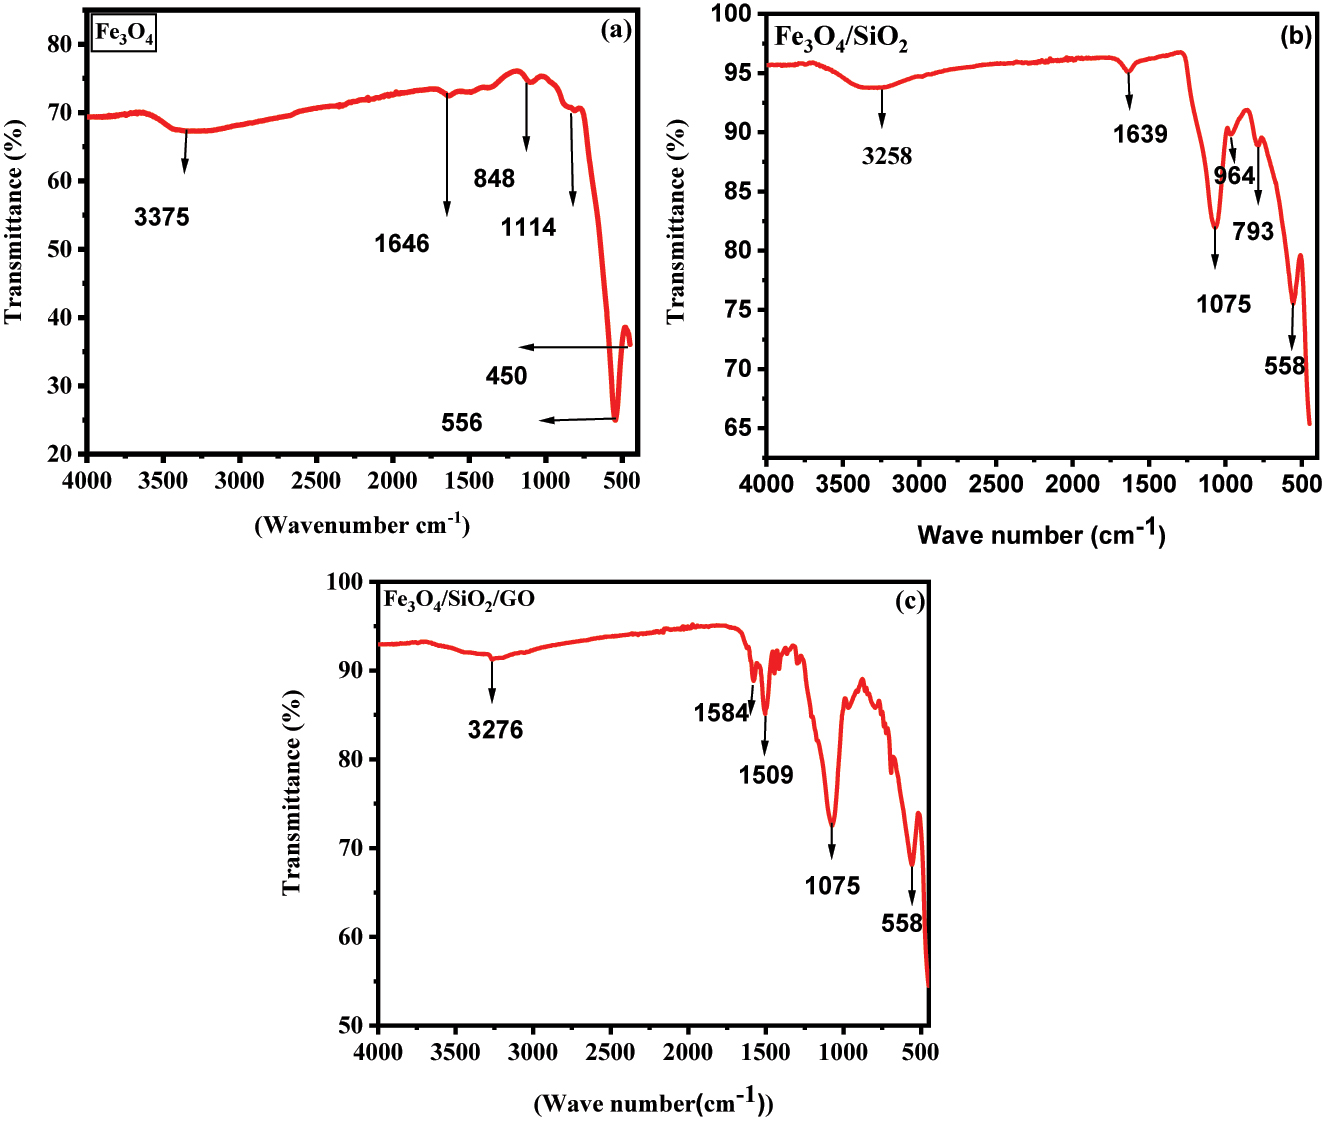
FT-IR spectra of “magnetic” nanocomposites (a), “binary” “Fe3O4@SiO2” nano-composites (b), and “ternary” “Fe3O4@SiO2–GO” nano-composites (c).
When examining the FTIR spectra of Fe3O4@SiO2 nanoparticles, peaks at 668 cm−1, 1075–1819 cm−1, and 3268 cm−1 were evident. These peaks were attributed to the expanding “vibrations” of “Fe–O–Fe” bonds, “Si–O–Si” bonds, and O–H bonds, severally. These findings provide strong evidence for the flourishing encapsulation of “silica” on the surface of Fe3O4 nanoparticles.
Analysis of the composite spectrum revealed notable peaks at 558 cm−1, 1070 cm−1, 1509–1584 cm−1, and 3278 cm−1. These peaks were associated with the stretching of “Fe–O–Fe” bonds, “C–O–C” bond expansion of “ether”, “C–O” bond expansion of “carbonyl” groups, “C=C/C–C” vibrations, and “O–H” bond expansion, severally. Importantly, the presence of the identical “Fe–O” and “O–H” peaks in the composite spectrum confirms the successful loading of Fe3O4@SiO2 onto the graphene oxide (GO) substrate.
3.1.2 SEM investigation
In Figure 3, “SEM” micrographs are presented to illustrate the characteristics of the materials. Figure 3a demonstrates that the Fe3O4 nanoparticles exhibit a less spherical texture, primarily due to their tendency to re-aggregate rapidly upon dispersion in an igneous solution. On the other hand, in Figure 3b, the Fe3O4@SiO2 nanoparticles display a comparatively more spherical texture, indicating improved dispersion and resistance to re-aggregation upon dispersion in an aqueous solution. This observation suggests that the silica SiO2 coating effectively prevents the re-aggregation of Fe3O4 nanoparticles. Finally, Figure 3c depicts a uniform distribution of Fe3O4/SiO2 nanoparticles across a graphene oxide sheet.
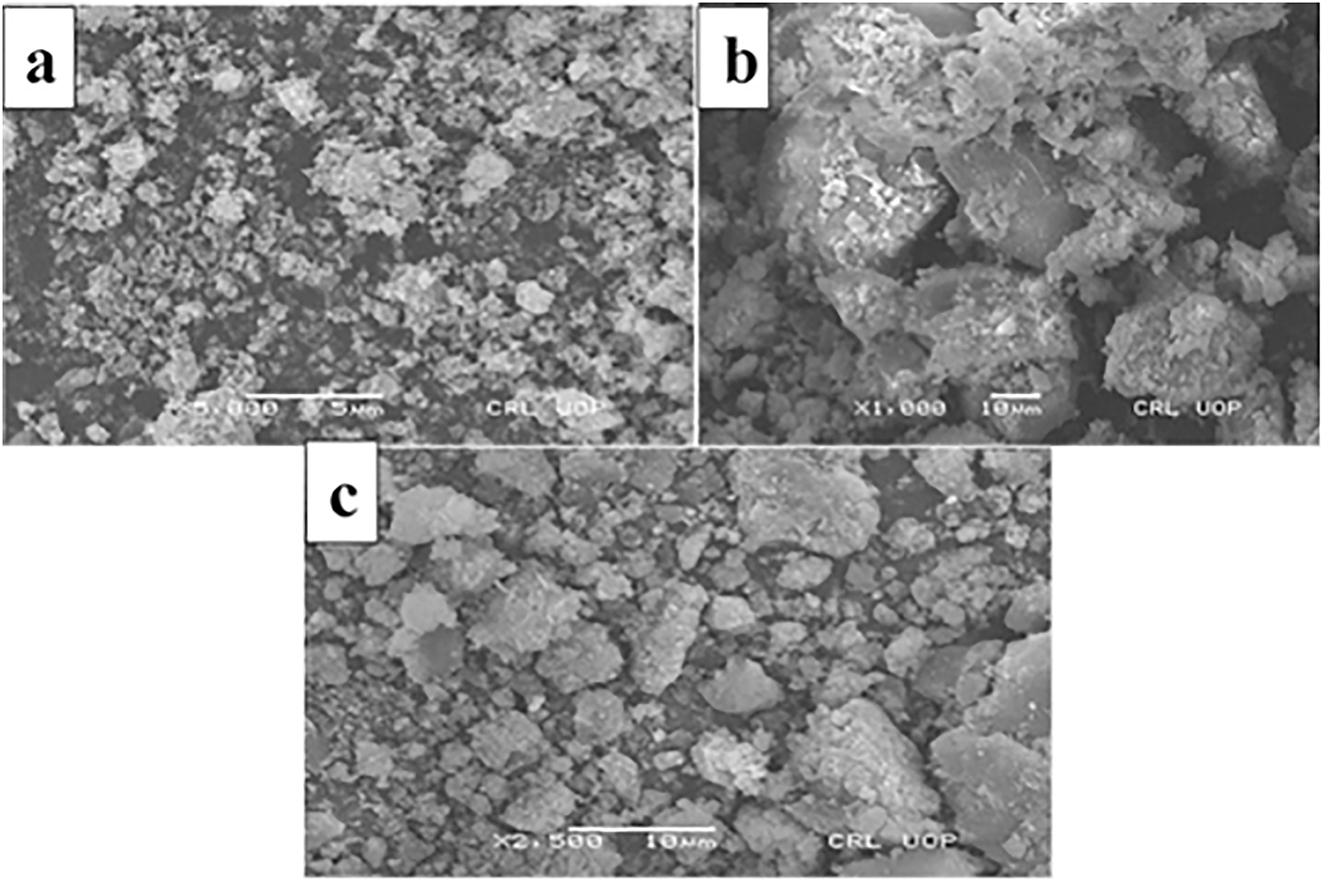
SEM micrograph of “magnetic” nano-comosites (a), “binary” “Fe3O4/SiO2” nano-composites (b), and “ternary” “Fe3O4/SiO2–GO” nano-composites (c).
3.1.3 EDX investigation
Examination of the composition of elements was done employing (EDX) investigation, as depicted in Figure 4. The analysis of Fe3O4 revealed that it comprises 68.33 % iron and 28.13 % oxygen by weight. When examining Fe3O4/SiO2 nanoparticles, the composition comprised 47.88 % iron, 24.51 % oxygen, and 24.31 % silicon by weight. The presence of the silicon peak in the EDX spectrum confirmed the eminent synthesis of SiO2.
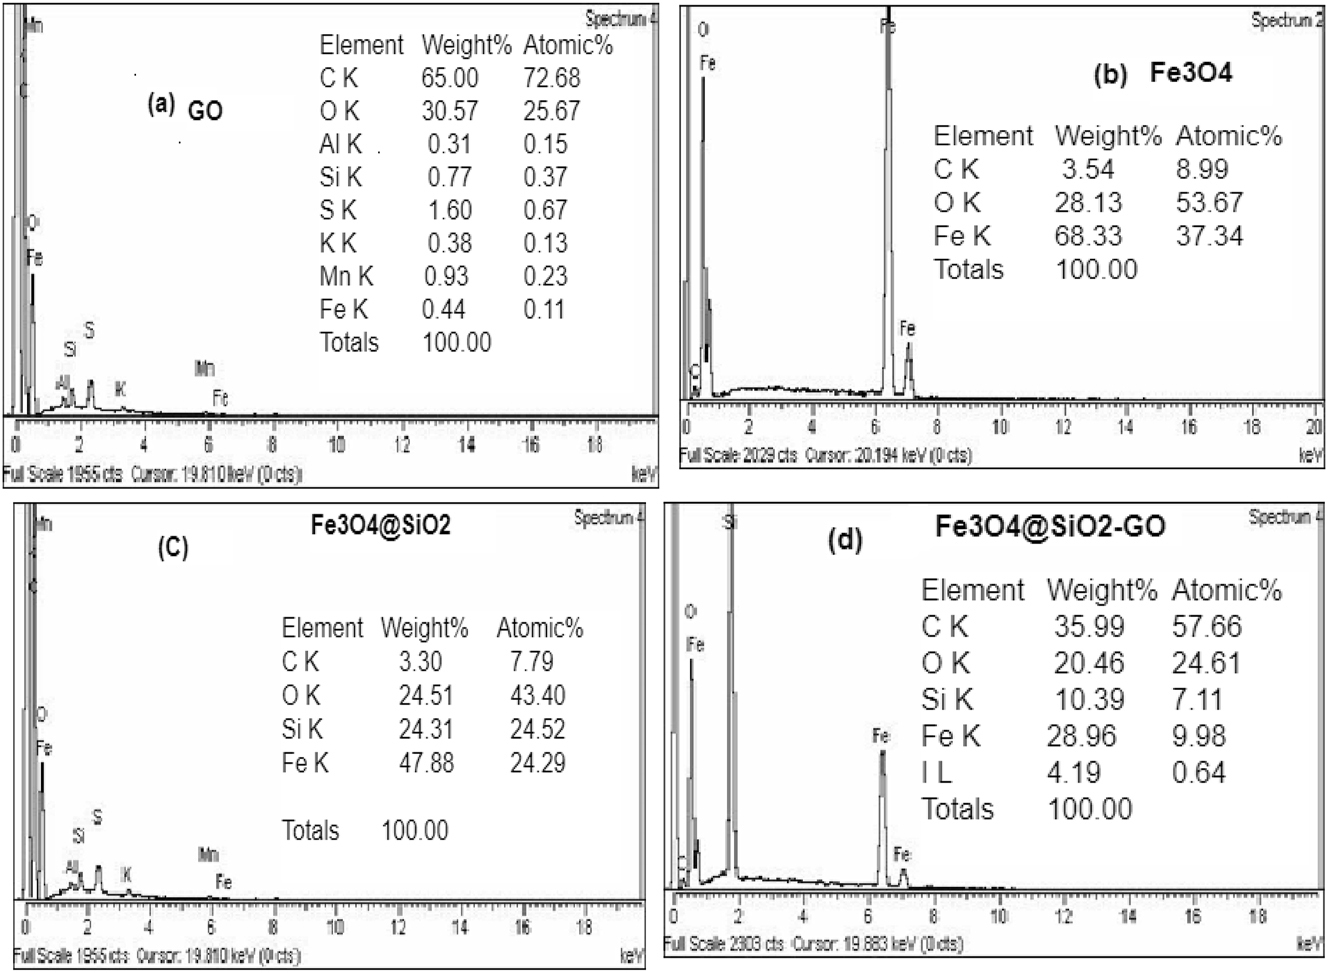
“EDX” spectra of GO (a), “magnetic” nano-composites (b), “binary” “Fe3O4/SiO2” nano-composites (c), and “ternary” “Fe3O4/SiO2–GO” nano-composites (d).
In the case of the final Fe3O4@SiO2–GO composite, the EDX analysis indicated a composition of 28.96 % iron, 10.39 % silicon, 20.46 % oxygen, and 35.99 % C by mass. The increased C % age signifies the eminent preparation of the Fe3O4@ SiO2–GO composite. Furthermore, this composition breakdown revealed that the carbon content attributable to graphene oxide (GO) accounted for 32.69 % of the composite, enhancing the adsorption capacity for BPB/MG.
3.1.4 XRD analysis
One of the best methods for determining whether intercalation occurs in “Fe3O4@SiO2–GO” particles is XRD. Figure 5a–c depicts the X-ray diffraction patterns of “Fe3O4”, “binary” “Fe3O4@SiO2”, and “ternary” “Fe3O4@SiO2–GO”. The distinctive “Fe3O4” peaks at 2 = 30.1, 35.5, 43.1, 53.5, and 62.7 with the indices (220), (311), (400), (422), (511) and (440) are shown in Figure 5a–c. The finding of the similar series of recognisable peaks for Fe3O4@SiO2 and Fe3O4@SiO2–GO served as evidence of the persistence of the crystalline phase of Fe3O4 nano-particles after silica coating and surface GO. Broad diffraction peaks at 22.3 are present in Fe3O4@SiO2 and Fe3O4@SiO2–GO, which is a feature of amorphous SiO2. The peaks do not noticeably alter after covering GO, in contrast to the Fe3O4@SiO2 microspheres, which may be a result of the thinness of the shell GO layer.
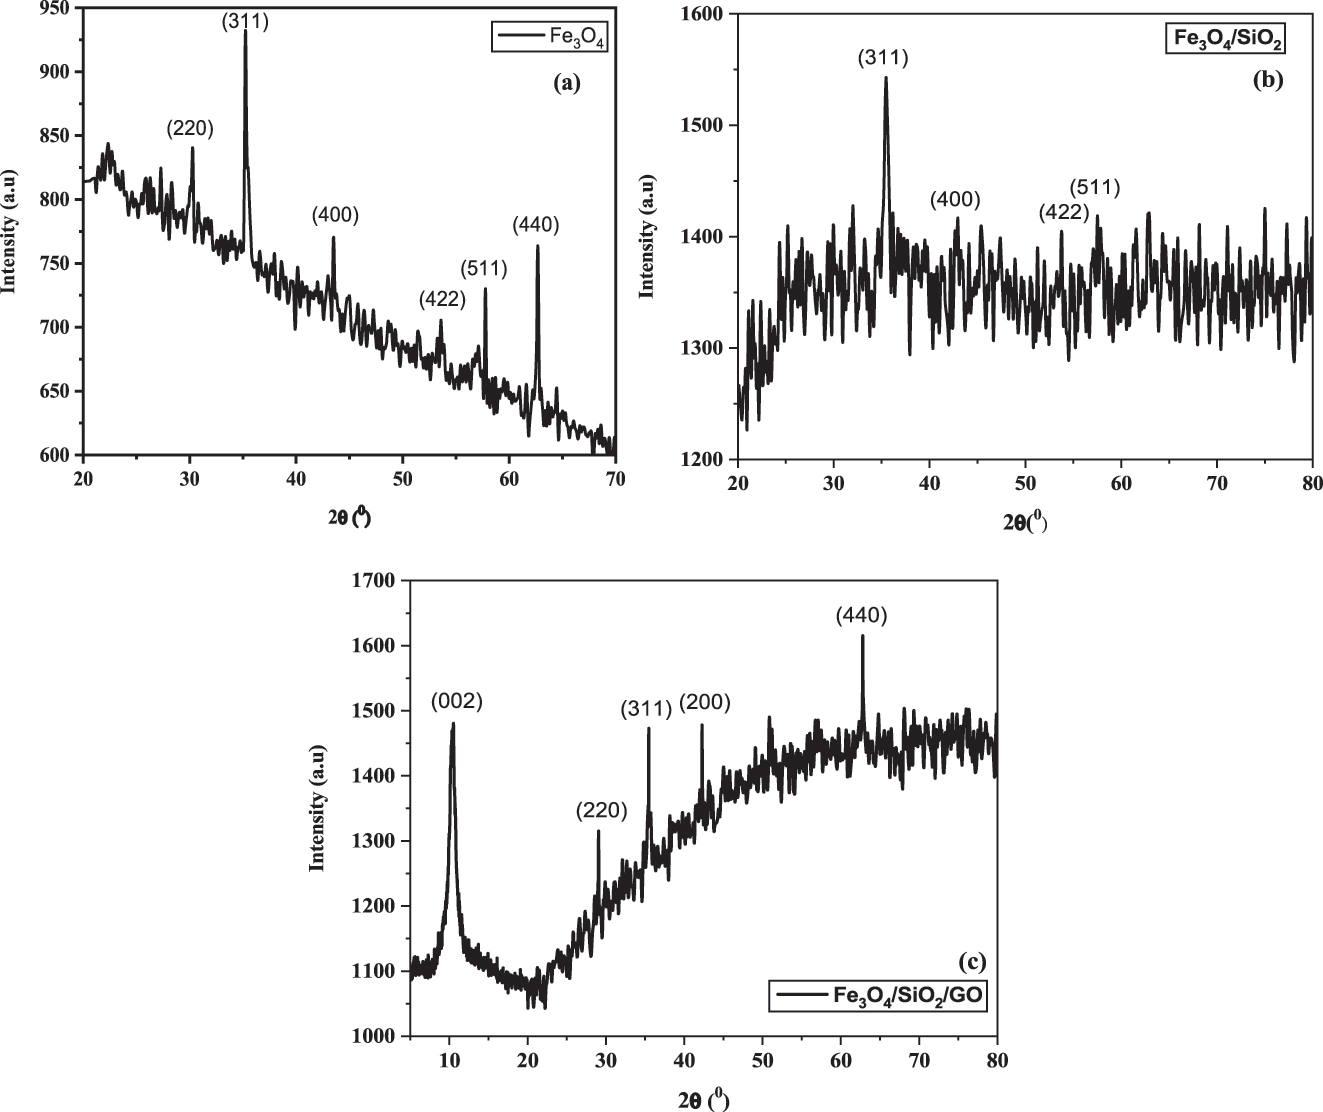
X-ray diffraction pattern for “magnetic” nano-composites (a), “binary” “Fe3O4@SiO2” nano-composites (b) and “ternary” “Fe3O4@SiO2–GO” nano-composites (c).
3.2 Adsorption examination
3.2.1 Influence of pH”
In the study of adsorption, the “pH” of the solution plays a momentous function as it influences the superficial “charge” of the surface-assimilative material and can also impact the dissociation of the analyse. To get a best knowing of the surface assimilation “mechanism”, researchers determined the point of 0 charge using a “potentiometric” method ( 40 ). The calculated “PZC” value for the material referred to as Fe3O4@SiO2–GO was found to be 5.7. This finding indicates that the surface of the Fe3O4@SiO2–GO composite will carry a (+tive) charge when the solution “pH” is below “6”, and it will bear a negative charge when the pH of the solution exceeds 6.
According to Figure 6a, the adsorption of bromophenol blue, an anionic dye, onto Fe3O4@SiO2–GO was investigated at different pH values. The outcomes demonstrated that the higher surface assimilation efficiency (85 %) occurred at “pH” 3.0. As the PH aaccumulated from 4 to 10 the sorption efficiency reduced. This behaviour can be attributed to the separation of “anionic” dyes in an igneous solution, leading to negatively charged SO3 groups on the dyes. In acidic solutions (low pH), the “positively” charged surface of the Fe3O4@SiO2–GO nanocomposite favoured the electrostatic interaction with the “negatively” charged SO3 groups, facilitating the surface assimilation of the anionic dyes.
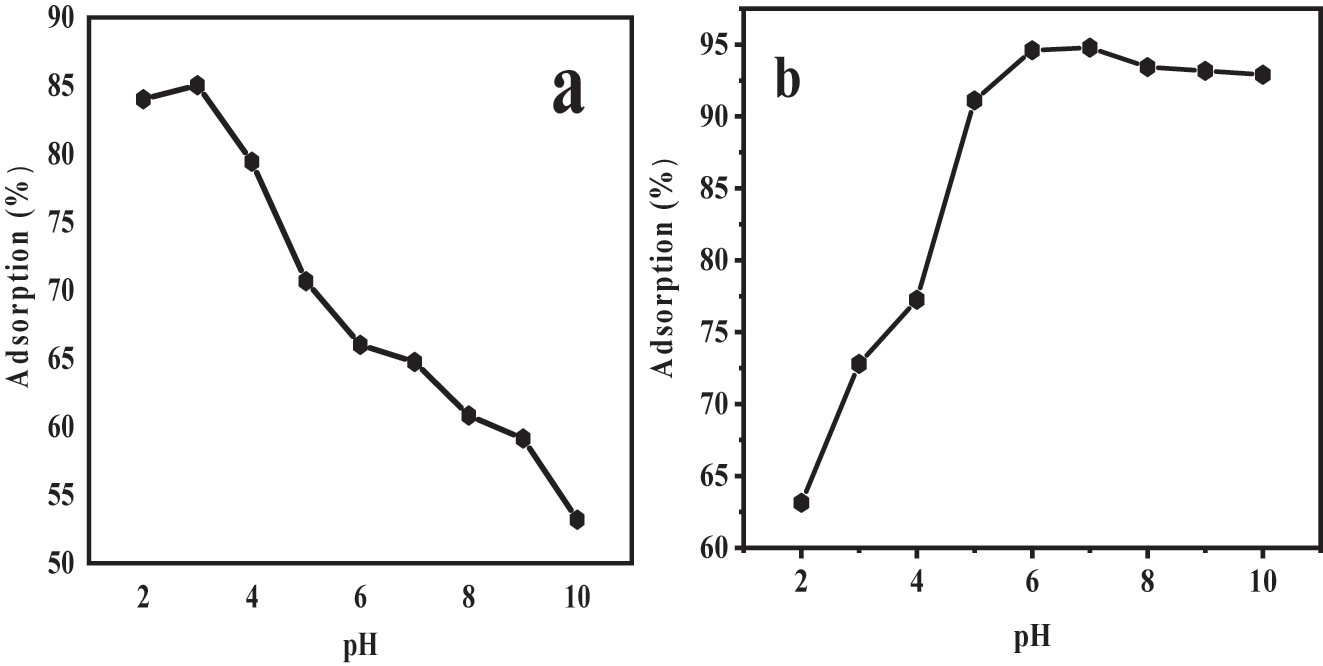
(a) Influence of pH on BPB dye surface assimilation using Fe3O4@SiO2–GO (b) influence of “pH” on “MG” dye surface assimilation using Fe3O4@SiO2–GO.
Figure 6b presents the results of the surface assimilation of “MG”, a “cationic” dye, onto Fe3O4@SiO2–GO at various “pH” levels ranging from “2 to 10”. It was observed that as the pH increased to pH “7”, both the surface assimilation capability and “clearance” % age increased. This suggests that the surface assimilation of cationic MG dye was favoured at near-neutral pH conditions.
The reason behind this pH-dependent behaviour lies in the changes in the surface charges of the Fe3O4@SiO2–GO nanocomposite. At low pH (acidic conditions), the nanocomposite surface becomes excessively protonated, resulting in a positive charge. This excess of positive charges hinders the constricting of “cationic” “MG” ions to the nano-composite surface, leading to decreased adsorption efficiency. On the other hand, at near-neutral pH (pH 7), the nanocomposite’s surface carries a more −ive charge, facilitating significant electro-static interactions with the cationic MG dye and increasing the adsorption capacity ( 38, 39, 40 ).
3.2.2 Influence of dosage of adsorbent
The effects of Fe3O4@SiO2–GO dose on the adsorption of Bromophenol Blue (BPB) dye. The aim was to find the supreme surface assimilation capability of “Fe3O4@SiO2–GO” for this specific dye.
Figure 7a likely illustrates the % of “BPB” dye “adsorbed” at various concentrations of “Fe3O4@SiO2–GO”, ranging from 0.02 g to 0.3 g. The graph shows that as the adsorbent dosage (amount of Fe3O4@SiO2–GO) increased, the percentage of BPB dye adsorbed also increased. This trend is expected because a higher dosage of adsorbent provides more active sites and a larger surface area for the dye molecules to interact with, leading to increased adsorption effectiveness ( 41 ).
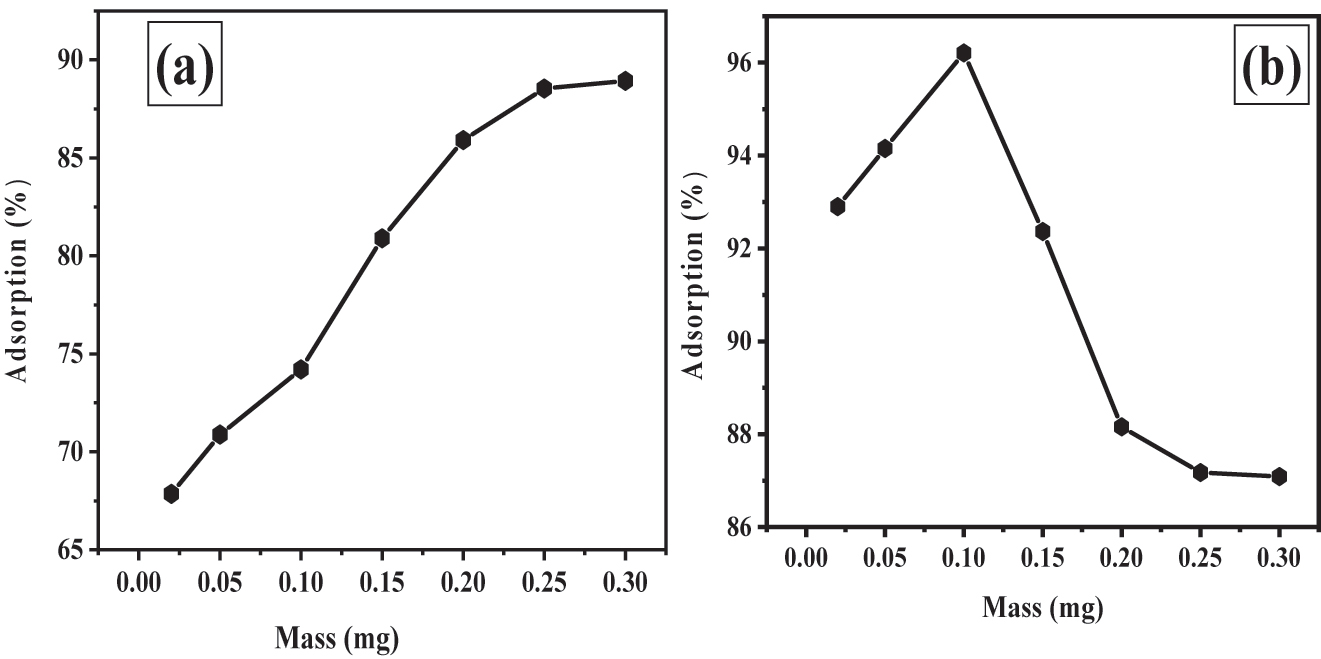
(a) influence of “Fe3O4@SiO2–GO” quantity on surface assimilation of BPB dye adsorption using Fe3O4@SiO2–GO (b) influence of “Fe3O4@SiO2–GO” amount on surface assimilation of MG dye adsorption using Fe3O4@SiO2–GO.
However, the graph also indicates that there is a point of diminishing returns. Beyond a certain dosage (0.3 g in this case), further increases in adsorbent dosage do not significantly enhance the percentage of BPB dye adsorbed. This suggests that at a certain point, the available active sites become saturated, and adding more adsorbent does not lead to proportionate increases in adsorption.
Based on these results, the researchers determined that 0.25 g of Fe3O4@SiO2–GO was the ideal adsorbent dosage. At this dosage, the adsorption effectiveness was maximized, and adding more adsorbent did not offer substantial benefits in terms of increasing the percentage of BPB dye adsorbed ( 42 , 43 ).
In Figure 7b, investigated the effect of Fe3O4@SiO2–GO dosage on the surface assimilation capability of malachite green (MG) dye. The concentration of malachite green was kept constant at 200 µg (micrograms) throughout the study. The purpose was to determine the optimal dosage of the Fe3O4@SiO2–GO sorbent material for maximum dismissal of MG from the solution.
According to the outcomes presented in Figure 7b as the dose of the Fe3O4@SiO2–GO surface-assimilative material was exaggerated from 0.02 to 0.1 g, the % of dye dismissal also increased. This means that high amounts of the surface-assimilative material led to better removal of malachite green from the solution. The reason behind this improvement is that higher concentrations of the adsorbent provide more available exchangeable sites or surface area for the malachite green molecules to interact with and get adsorbed onto.
The study found that the optimal percentage for removing MG from the solution was achieved at a dosage of 0.1 g of Fe3O4@SiO2–GO. At this dosage, they were able to achieve a high percentage of dye removal, specifically 96.21 %. However, interestingly, after reaching this optimum dosage, the percentage of colour removal started to decline as they increased the dosage of the adsorbent further.
The reason for the decline in the surface assimilation ratio at dosages higher than the optimum (0.1 g) is explained by the phenomenon of “overpopulation” of adsorbent particles. When a large amount of adsorbent is added, the adsorption sites may become overcrowded and lead to an overlap of adsorption sites. As a result, the efficiency of dye dismissal decreases because the dye molecules may not have enough available tracts on the surface-assimilative material surface to interact with.
To avoid the negative effects of overpopulation and ensure efficient adsorption, it is concluded that (0.1 g) of Fe3O4@SiO2–GO should be used as the “optimum” dosage for the “adsorption” of “MG” from the given solution ( 44 ).
3.2.3 Influence of contact time
The impact oftime on the surface assimilation of BPB dye onto “Fe3O4@SiO2–GO” was investigated over a range of 30–80 min, with intervals of 10 min, and the outcomes are presented in Figure 8. Time is a crucial operational factor as it influences the efficiency of BPB dye removal from an aqueous solution.
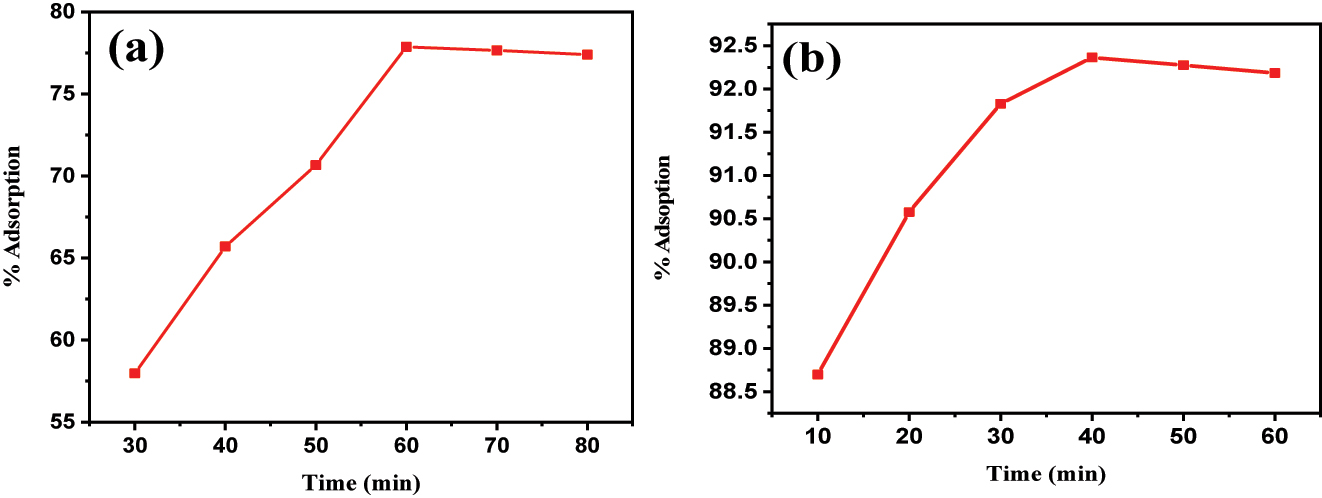
(a) impact of time on BPB dye surface assimilation using Fe3O4@SiO2–GO; (b) impact of time on MG dye surface assimilation using “Fe3O4@SiO2–GO”.
The findings indicated that exploding the time up to “60” minutes significantly improved the evacuation of “BPB” dye at all “temperatures” studied. However, beyond 60 min, the percentage of dye adsorbed remained more or less constant. This observation suggests that there were a substantial number of uninhabited superficial tracts available for adsorption during the initial levels of the treatment time, leading to a rapid increase in adsorption efficiency. As the contact time continued to increase beyond 60 min, the availability of unoccupied surface sites decreased, resulting in the adsorption efficiency reaching a plateau. At this point, the adsorption process achieved a state of counterbalance, where the number of dye molecules “adsorbed” became balanced with the number of desorbed molecules from the surface.
Figure 8b illustrates the impact of “time” on the surface assimilation of MG dye on “Fe3O4@SiO2–GO”. Consequently, the surface assimilation method followed a distinct pattern over time. Initially, during the first 40 min of contact time, there is a fast surface assimilation of malachite green dye onto the Fe3O4@SiO2–GO surface-assimilative material. This rapid adsorption can be attributed to the abundance of untenanted “sites” available on the surface of the surface-assimilative material. As the contact time increases, more dye molecules are being captured and bound to these vacant sites, leading to the initial fast adsorption rate ( 45 ).
However, as the time progresses the amount of available empty tracts on the adsorbents surface decreases. This is because the dye molecules are occupying these sites, and fewer unoccupied sites are left for further adsorption. Consequently, the rate of adsorption slows down, and the system enters a phase of relatively steady adsorption. During this phase, the adsorption rate becomes more gradual as fewer free sites are accessible for new dye molecules to bind ( 46 ).
As the adsorption continues, the surface of the adsorbent gradually becomes filled with adsorbed malachite green molecules. Eventually, the system reaches a state of saturation adsorption, where almost all accessible surface assimilation tracts are tenanted by dye molecules. At this point, the adsorption process comes to a halt because there are no more unoccupied sites left for additional adsorption ( 47 ).
It’s important to note that after reaching saturation adsorption, desorption can begin to occur. Desorption involves the release of previously adsorbed dye molecules from the surface of the surface-assimilative material back into the solution. This can result from various factors such as changes in temperature, pH, or other environmental conditions. Desorption can lead to a drop-off in the amount of absorbed dye on the adsorbent’s surface, and the system may stretch a kinetic counterbalance where the charge per unit of surface assimilation equals the charge per unit of “desorption” ( 48 ).
3.2.4 Impact of concentration
The impact of dye amount on the Fe3O4@SiO2–GO for both BPB and MG dyes was also analysed. It was observed that an increment in dye amount has an elevating effect on the surface assimilation capability of Fe3O4@SiO2–GO (Figure 9a and b). Supreme adsorption susceptibility was obtained at 600 μg for both BPB and MG dyes. First off, more dye molecules are accessible to interact with the surface of the Fe3O4@SiO2–GO when the dye amount in the solution is higher. This indicates a greater probability of dye molecules interacting with and being bound by the adsorbent’s active sites. As a result, an increment in dye concentration causes the available surface assimilation sites to be used more effectively, hence increasing the adsorption capacity. Second, provided other variables like temperature and surface area remain constant, the adsorption capacity can be directly proportional to the amount of the solute in the solution, according to the Langmuir adsorption isotherm, which is frequently used to explain adsorption processes. This suggests that, up until a saturation point, more dye molecules can be “adsorbed” onto the adsorbent surface at higher dye concentrations. This phenomenon explains why adsorption capacity is increased when dye concentration is raised. In conclusion, the principles described by adsorption isotherms and the enhanced availability of dye molecules for interaction with the adsorbent’s surface are principally responsible for elevation insurface assimilation capability with elevating dye amount for dyes like BPB and MG ( 46, 47, 48 ).
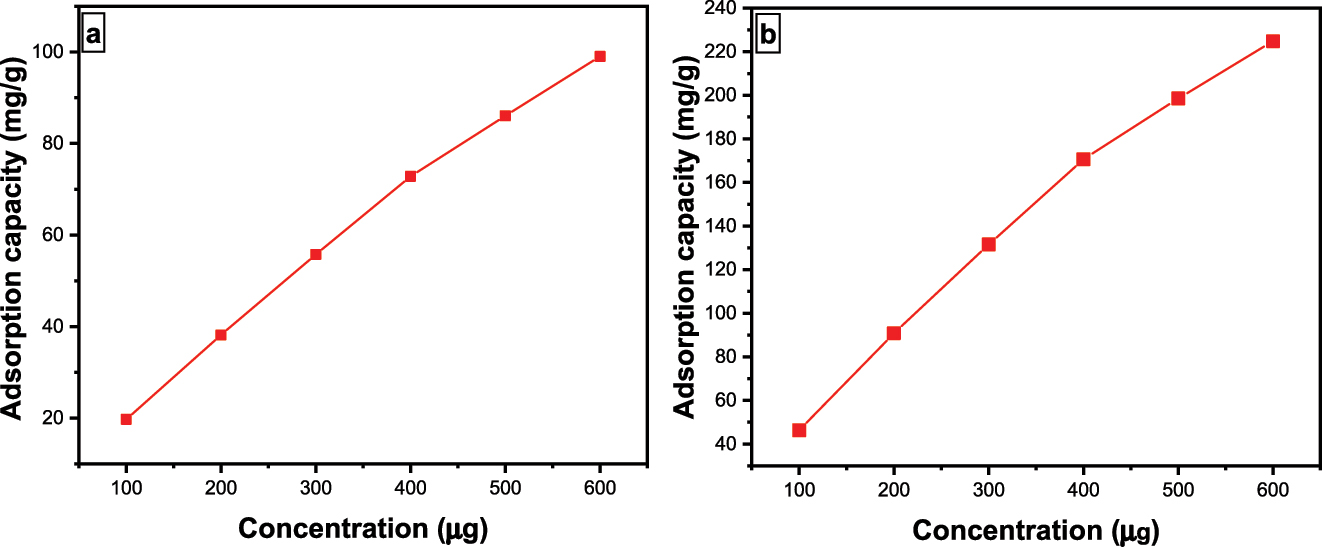
(a) impact of amount on BPB dye surface assimilation using Fe3O4@SiO2–GO; (b) impact of amount on MG dye surface assimilation utilizing Fe3O4@SiO2–GO.
3.2.5 Effect of temperature
The surface assimilation of BPB and MG onto “Fe3O4@SiO2–GO” is influenced by temperature. The experimental data, as represented in Figure 10a and b, shows that the concentration of adsorption falls significantly as the temperature rises from 30 to 100 °C, even at the optimal pH conditions.
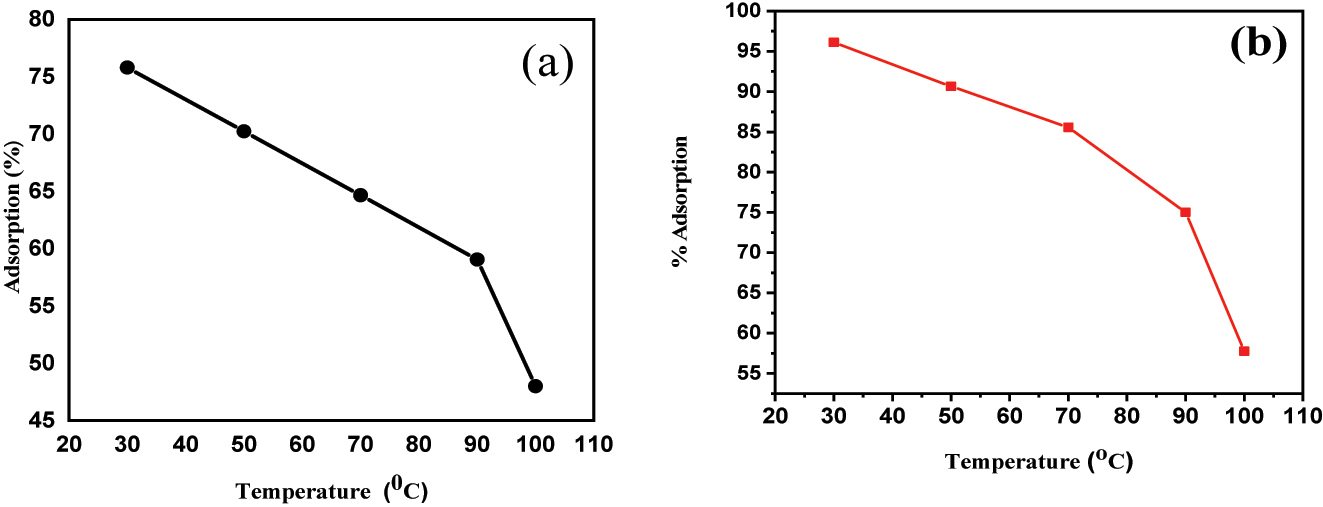
(a) impact of “temperature” on BPB dye adsorption using Fe3O4@SiO2–GO; (b) impact of “temperature” on “MG” dye surface assimilation using Fe3O4@SiO2–GO.
The proposed explanation for this phenomenon is related to hydrogen bonding, which is responsible for the adsorption process. At lower temperatures, hydrogen bonding between the adsorbed molecules and the adsorbent surface Fe3O4@SiO2–GO is strong, facilitating the adsorption process. However, as the temperature rises, the thermal energy increases, leading to the weakening or breaking of hydrogen bonds between the adsorbate and adsorbent ( 49 ).
As a result of weakened hydrogen bonding, the adsorption capacity decreases at higher temperatures, leading to a reduced amount of adsorption. This decrease in adsorption at elevated temperatures can be detrimental if the adsorption process is intended for environmental remediation or other practical applications.
The experimental findings indicate that the surface assimilation of “BPB” and “MG” dyes onto “Fe3O4@SiO2–GO” is an exothermic process, which means it releases heat. This exothermic adsorption process is favoured by lower temperatures.
As the “temperature” rises, the exothermal “nature” of the surface assimilation procedure becomes less favourable. Higher temperatures provide more thermal energy to the system, leading to the weakening or breaking of the hydrogen bonds between the dyes and the adsorbent surface Fe3O4@SiO2–GO. Consequently, the amount of dyes adsorbed decreases as the “temperature” increases, and the adsorption susceptibility of the surface-assimilative material diminishes ( 50 ).
3.3 Adsorption kinetics analysis
The mathematical expressions for the pseudo first order and pseudo second order models are bestowed by equations (5) and (6) severally:
here, q e represents the concentration of “BPB” and “MG” adsorbed at counterbalance or the surface assimilation capability, while “q t” is the concentration of “BPB” adsorbed at any given “time” (in minutes). “K 1” and “K 2” are the “rate” constants for the pseudo first order and pseudo second order kinetics, severally.
Figure 11a and b display “linear” plots for pseudo first order “p-FO” and pseudo second order “p1-SO” kinetics, severally. Table 1 presents the calculated values for conditions such as “K 1”, “K 2”, “q e”, and “R 2” derived from these “graphs”. The “R 2” value indicates that the “p-FO” kinetic/dynamic model (R 2 = 0.990) provides a better fit for the adsorption data of BPB onto Fe3O4–SiO2–GO compared to the p-SO kinetic (R 2 = 0.987).
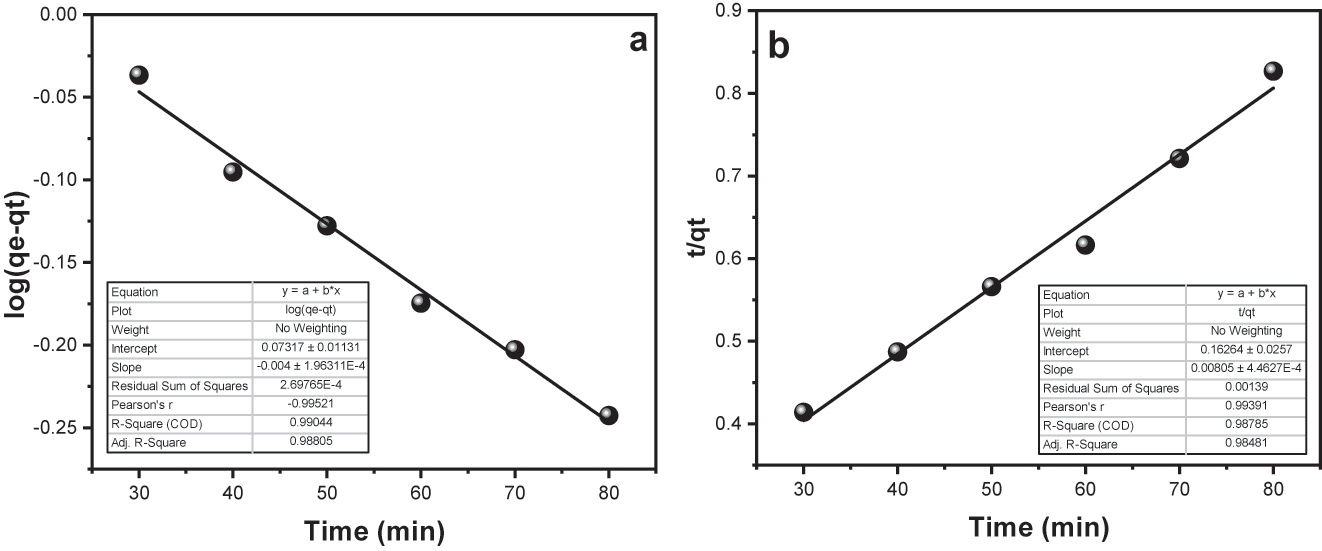
(a) Pseudo first order plot for surface assimilation of BPB onto Fe3O4@SiO2–G; (b) Pseudo second order plot for surface assimilation of BPB onto Fe3O4@SiO2–GO.
Kinetic conditons computed from various models.
| “Kinetic models” | “Parameters” | “Values” | |
|---|---|---|---|
| BPB | MG | ||
| Experimental | “q e (exp) (mg/g)” | 97.3450 | 92.630 |
| Pseudo first order model | “k 1 (min−1)” | 0.094 | 0.670 |
| “q e (mg/g)” | 508.862 | 6.468 | |
| “R 2” | 0.9904 | 0.99 | |
| Pseudo second order model | “k 2 (min−1)” | 0.00039 | 0.023 |
| “q e (mg/g)” | 125 | 93.458 | |
| “R 2” | 0.987 | 0.999 | |
The computed “q e” values for “p-FO” and “p-SO” kinetic models are 508.8620 mg per g and 125.0 mg per g, severally, while the experimental “q e” obtained is 97.3450 mg per g. The close concordance between the computed and experimental “q e” values farther assist the superiority of the pseudo second order kinetics in describing the surface assimilation process ( 51 ).
Figure 12a and b illustrate the corresponding plots, and Table 1 provides the invariant values of “K 1”, “K 2”, “R 2”, and “q e” traced from the slopes and points of the “linear” plots. For the pseudo first order kinetic model and the pseudo second order kinetic model, the R 2 values were determined as 0.9904 and 0.999, respectively.
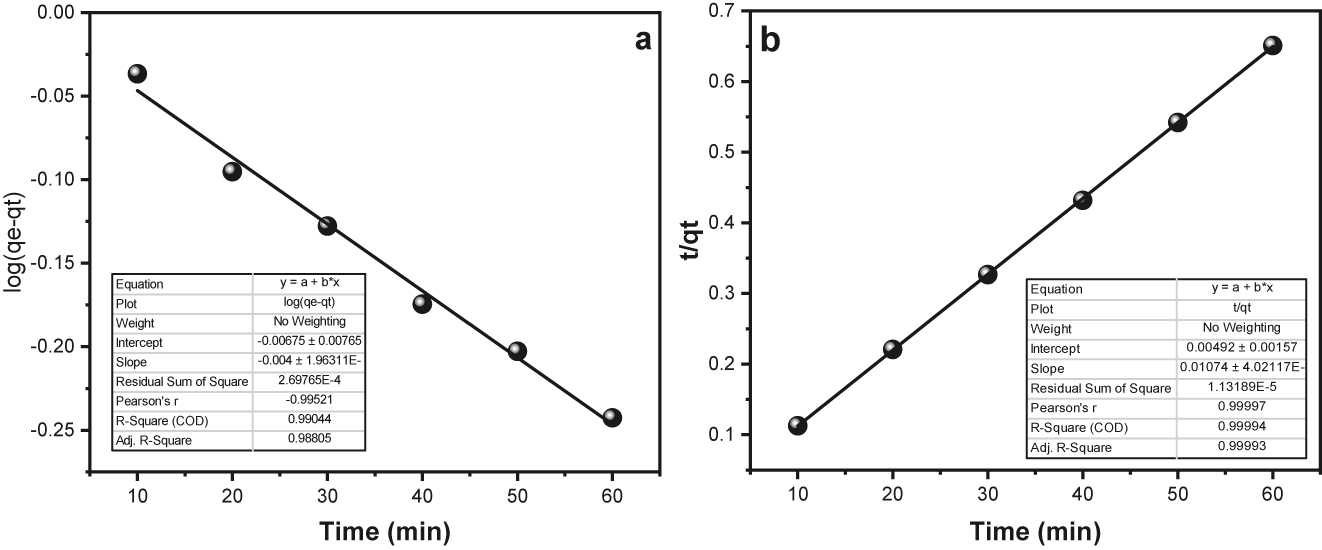
(a) Pseudo first order “plot” for surface assimilation of MG onto “Fe3O4@SiO2–GO”; (b) Pseudo second order “plot” for surface assimilation of MG onto “Fe3O4@SiO2–GO”.
The pseudo second order kinetic model is found to “best” symbolize the surface assimilation process for MG, as evidenced by the R 2 values, which show a good fit to the data. For the pseudo first order kinetic model and the pseudo second order kinetic model, the calculated “q e” values are 6.4680 mg per g and 93.4580 mg per g, severally. The computed “q e” value of the pseudo second order kinetic model is in higher concordance with the experimental “q e” value of 92.630 mg per g. So, the pseudo second order kinetic model provides an accurate description of how MG is absorbed in this context ( 52 ).
3.4 Adsorption isotherm
For isotherm research, two “isotherm” models, the “Langmuir” and “Freundlich” isotherms, were chosen.
The “Langmuir” (7) and Freundlich ‘isotherm (8) linear forms are presented below;
where “C
e” is the counterbalance amount (mg/L), “K
L” is the surface assimilation energy accompanying “Langmuir” constant, “a
L” is the “Langmuir” constant associated with bonding strength (L/mg), “n” is the surface assimilation strength accompanying Freundlich constant, and “
In Figure 13a, you can see straight-line graphs that represent the Fruendlich isotherm. In Figure 13b, there are graphs for the Langmuir isotherm, which describes how BPB sticks to Fe3O4/SiO2/GO. While Figure 14a and b represents the Fruendlich isotherm and Langmuir isotherm respectively for the MG adsorption. The values for “a L”, “K L”, “Qo”, “K F”, “N”, “1/n”, and “R 2” are listed in Table 2.
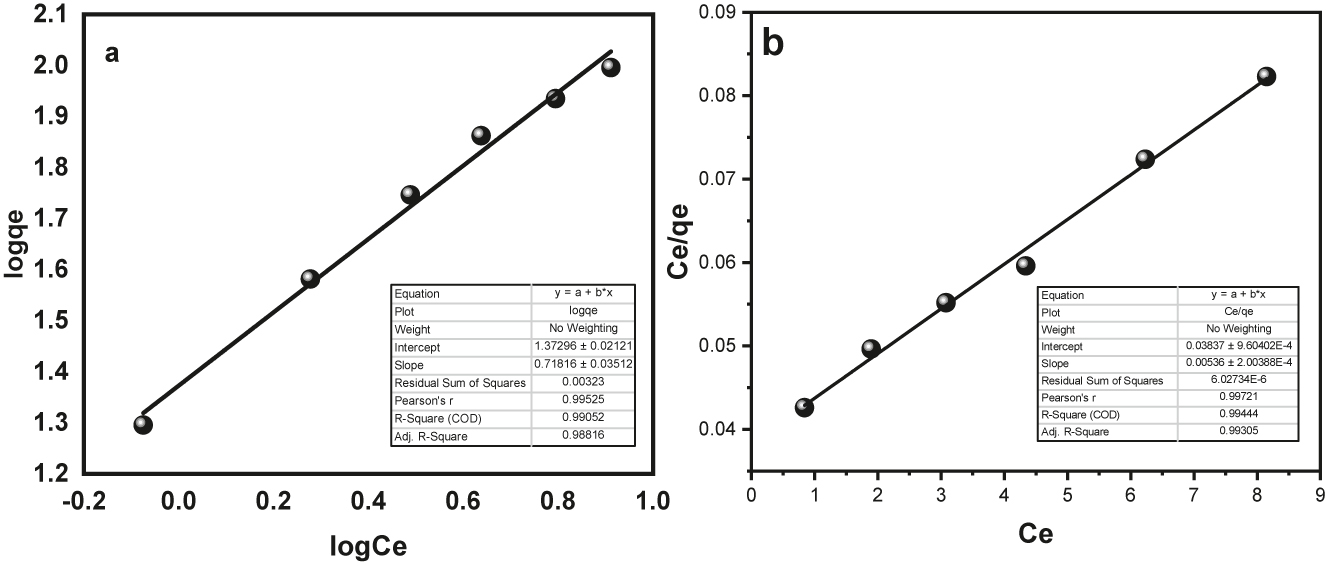
(a) Fruendlich isotherm for BPB dye adsorption onto Fe3O4@SiO2–GO (b) Langmuir isotherm for BPB dye adsorption onto Fe3O4@SiO2–GO.
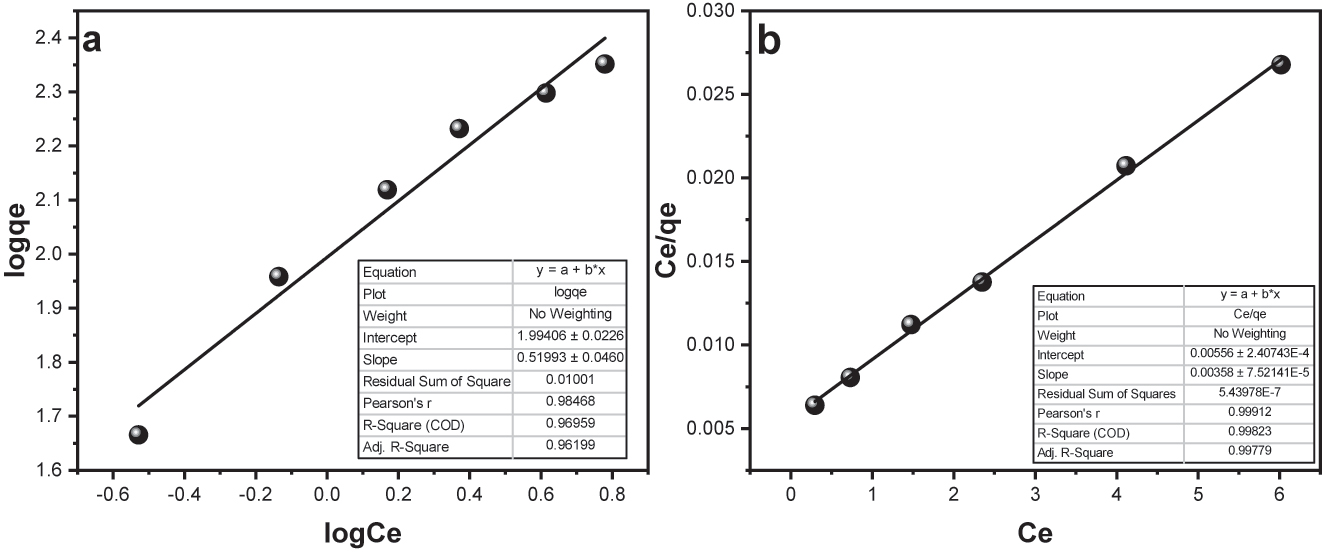
(a) Fruendlich isotherm for MG dye adsorption onto “Fe3O4@SiO2–GO” (b) Langmuir isotherm for MG dye surface assimilation onto Fe3O4@SiO2–GO.
“Isotherm” constant for surface assimilation of “BPB” and “MG”.
| “Isotherm” | “Parameters” | “Values” | |
|---|---|---|---|
| BPB | MG | ||
| “Langmuir” | “a L (mg g−1)” | 0.1410 | 0.64290 |
| “K L (L g−1)” | 26.0420 | 178.57140 | |
| “Q° (mg g−1)” | 185.1850 | 277.7780 | |
| “R 2” | 0.9940 | 0.9980 | |
| “Freundlich” | “K F (mg g−1)” | 23.5990 | 98.627950 |
| “N” | 1.3930 | 1.92310 | |
| “1/n” | 0.7180 | 0.520 | |
| “R 2” | 0.9900 | 0.9690 | |
By looking at the R 2 values, we can tell that the Langmuir ‘isotherm (R = 0.994) fits the information really well, in comparison to the Freundlich ‘isotherm (R 2 = 0.990) for BPB adsorption. This means that the Langmuir model is a great “fit” for the surface assimilation data, indicating that the “surface” of “Fe3O4@SiO2–GO” is even and the adsorption happens in a single layer on it. In case of MG adsorption, the R 2 values obtained for Fruendlich isotherm and Langmuir isotherm were 0.969 and 0.998 respectively. Hence, the data best fitted the “Langmuir” surface assimilation ‘isotherm for the MG adsorption also indicating the single layer surface adsorption phenomenon ( 54 ).
3.5 Adsorption thermodynamics
On the thermodynamic front, a comprehensive understanding of BPB and MG sorption can be constructed by analysing “thermodynamic” conditions like standardized “Gibbs free energy alteration” ΔG°, standardized “enthalpy” alteration ΔH°, and standardized entropy alteration ΔS°. These parameters afford insights into the thermodynamic feasibility, energy exchange, and randomness alteration associated with the endothermic and exothermic sorption events of BPB and MG onto the substrate’s surface.
The “Van’t Hoff’ equation (Table 3) was utilized to calculate the “thermodynamic” conditions “ΔH”, “ΔS”, and “ΔG” from the “van’t Hoff’ plot Figures 15 and 16. These equations are as follows:
where “K D” is the “distribution” constant while “T” is the “temperature” in “K”
“K D” = distribution constant
“q e” = counterbalance quantity of BPB and MG
“C e” = counterbalance amount (μg per mL)
“T” = temperature in “K”
“Thermodynamic” examination for “BPB” and “MG”.
| Temp. (K) | “ΔG°” (kJ/mol) | ΔH° (kJ/mol) | ΔS° (kJ/K/mol) | |||
|---|---|---|---|---|---|---|
| “BPB” | “M G” | “BPB” | “M G” | “BPB” | “M G” | |
| 303.0 | −7.4930 | −9.630 | −14.827 | −15.709 | −23.691 | −19.045 |
| 323 | −7.226 | −9.78 | ||||
| 343 | −6.949 | −9.70 | ||||
| 363 | −6.635 | −8.75 | ||||
| 373 | −5.434 | −8.21 | ||||
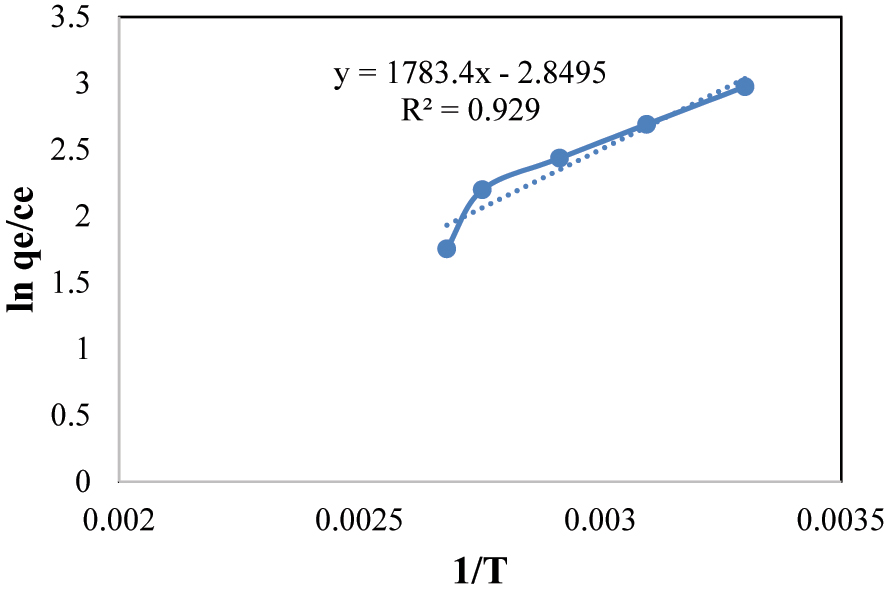
“Van’t Hoff’ plot for thermodynamic study of BPB.
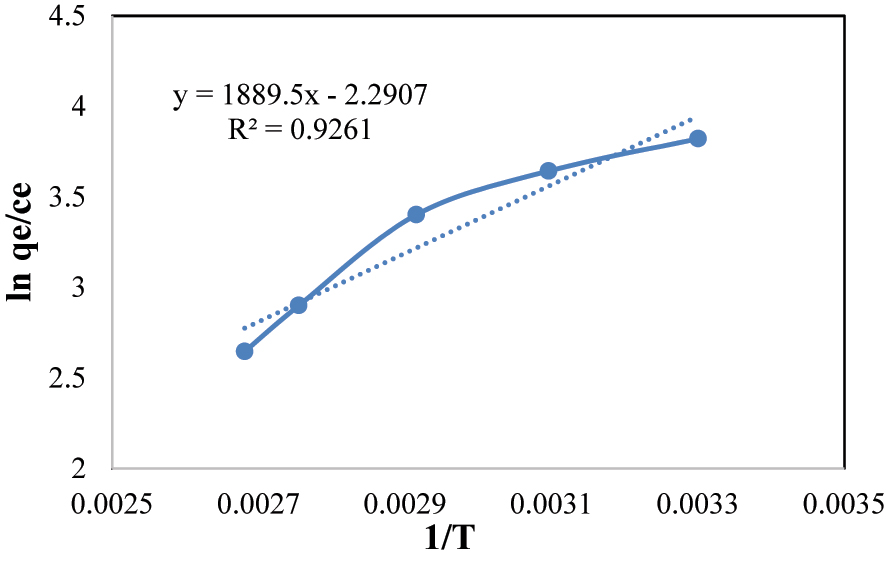
“Van’t Hoff’ plot for thermodynamic study of MG.
The determination of a negative standard “enthalpy” alteration (ΔH) substantiates the exothermic ‘nature of the surface assimilation process involving BPB and MG. This observation aligns with thermodynamic expectations, pointing that “energy” is discharged during the surface assimilation event. The calculated negative value of the standard “Gibbs free energy” alteration (ΔG) is indicative of the spontaneity of the surface assimilation phenomenon. Moreover, the notable augmentation of ΔG° with increasing temperature is suggestive of an improved adsorption performance of BPB and MG onto the Fe3O4@SiO2–GO composite, particularly under conditions of lower temperature ( 55 , 56 ).
The obtained negative value for the standard entropy change (ΔS°) is indicative of a decrease in randomness following the adsorption of BPB and MG onto the @SiO2@GO composite. This outcome signifies a transition towards a more ordered configuration, potentially due to specific “interactions” between the adsorbate molecules and the composite’s surface.
In light of these findings, it is evident that the Fe3O4@SiO2–GO composite exhibits a pronounced affinity for BPB and MG, attributed to the thermodynamic factors elucidated. The collective observations suggest that the composite holds promise as an efficient surface-assimilative material for the dismissal of BPB and MG from igneous solutions ( 57 ).
3.6 Desorption and regeneration studies
The ability to regenerate an adsorbent is a crucial aspect when assessing its performance and cost-effectiveness, especially in the context of increasing demands in wastewater treatment systems. In this study, the researchers also explored the potential for regeneration and reuse of the adsorbent material. They evaluated the regenerated adsorbent’s effectiveness by conducting periodic adsorption and desorption processes of BPB/MG under the optimized conditions for BPB/MG adsorption.
For desorption of BPB/MG from the composite material, the researchers used methanol and ethanol as eluents and subjected them to stirring at 200 rpm for 30 min. This choice was made because BPB/MG is readily soluble in polar organic solvents. The results showed a BPB recovery of 88.02 % and an MG recovery of 98.93 % when using 5 mL of methanol. Additionally, a BPB recovery of 92.34 % and an MG recovery of 98.90 % were achieved with 5 mL of ethanol (Figures 17 and 18).
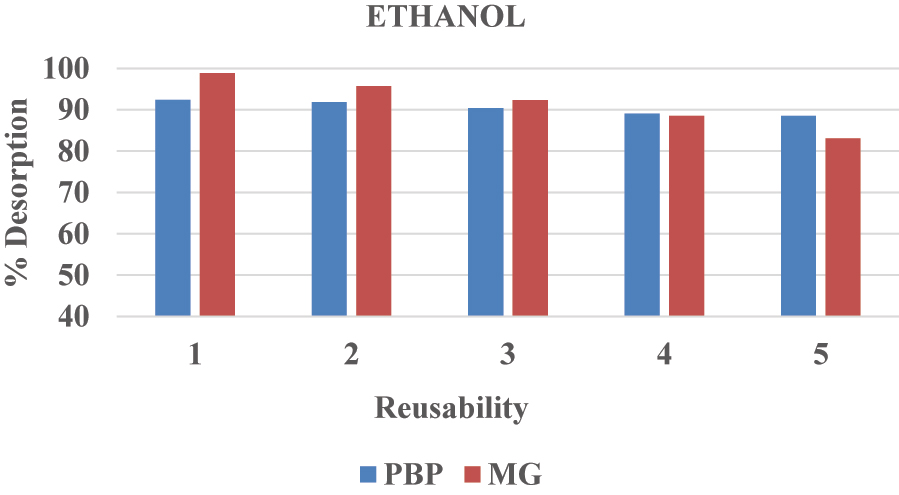
Desorption studies for BPB and MG dyes in ethanol.
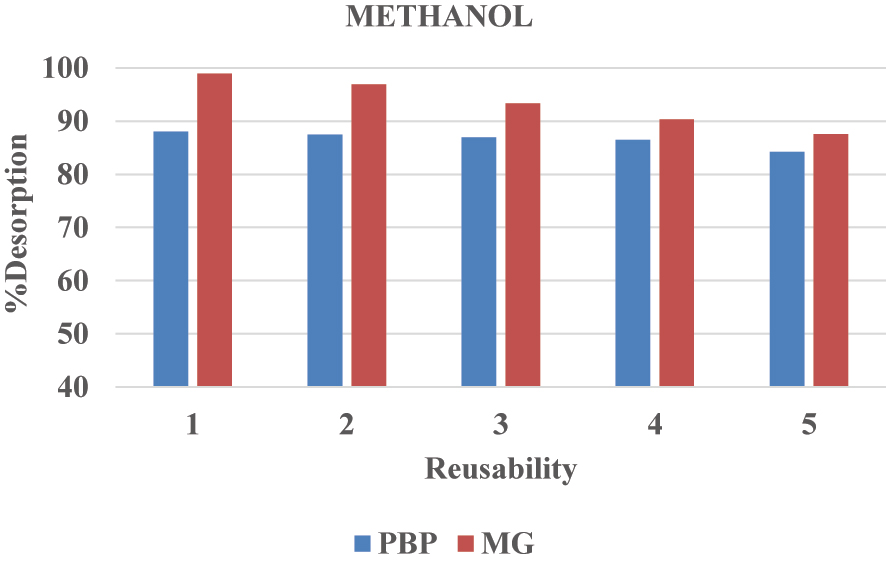
Desorption studies for BPB and MG dyes in methanol.
Following the desorption process, the surface-assimilative material was washed with “methanol” or “ethanol” and then with distilled water. This reproduced nano-composite material was subjected to five cycles of “adsorption–desorption” methods to assess its “reusability” and “constancy”. Notably, when using ethanol as the desorption solvent, the adsorption of BPB decreased from 92.02 % to 88.50 %, and MG from 98.90 % to 83.07 % over repeated cycles. Similarly, when using methanol, the adsorption of BPB decreased from 88.02 % to 84.18 % and MG from 98.93 % to 87.56 %, indicating a reduction in adsorption capacity with successive cycles ( 58 ).
3.7 Sample applications
Various water samples, including lab tap water, dye wastewater, and industrial wastewater, were intentionally contaminated with BPB and MG at amounts ranging from 0.25 to 1.0 µg per mL. These water samples were then subjected to the surface assimilation and extraction procedures utilizing the newly projected technique. The outcomes presented in Table 4 indicate that the recuperation ranged from 93.33 % to 95.86 % for BPB and 95.44 %–96.88 % for MG in the case of pointed “tap” water samples.
Various actual samples and retrieval (%) of “BPB” and “MG”.
| Actual sample | Pointed concentration (µg/ml) | BPB | MG | ||
|---|---|---|---|---|---|
| Recovery (%) | % RSD | Recovery (%) | % RSD | ||
| Tape water | 0.25 | 93.33 | 1.04 | 95.44 | 3.44 |
| 0.5 | 95.40 | 3.58 | 95.60 | 1.04 | |
| 1.0 | 95.86 | 1.46 | 96.88 | 2.96 | |
| Wastewater from dyes | 0.25 | 94.94 | 3.58 | 97.32 | 1.11 |
| 0.5 | 95.50 | 1.64 | 90.77 | 1.90 | |
| 1.0 | 100.13 | 2.23 | 93.95 | 0.81 | |
| Industrial wastewater | 0.25 | 92.64 | 0.76 | 85.56 | 3.31 |
| 0.5 | 97.71 | 2.01 | 91.89 | 1.46 | |
| 1.0 | 93.35 | 1.91 | 93.88 | 0.76 | |
Likewise, when looking at dye wastewater, the recovery rates ranged from 94.94 % to 100.13 % for BPB and from 90.77 % to 97.32 % for MG. Additionally, in the case of industrial wastewater, the recovery rates were observed to be within the range of 92.64 %–97.71 % for BPB and 85.56 %–93.88 % for MG. These findings collectively demonstrate that the proposed adsorbent material is highly effective in adsorbing and extracting BPB and MG from real environmental samples, suggesting its suitability for practical applications in pollutant removal and extraction processes ( 59 , 60 ).
4 Conclusions
In this study, Fe3O4@SiO2–GO was synthesized and employed as an surface-assimilative material for the dismissal of BPB and MG from igneous solutions. The surface assimilation experiments demonstrated that various factors such as pH, time, the quantity of Fe3O4@SiO2–GO, temperature, and the initial concentrations of BPB and MG had a significant impact on the surface assimilation process of these compounds from water samples.
The findings demonstrated that the surface assimilation of these compounds preceded a pseudo second order kinetic model and adhered to the “Langmuir” ‘isotherm, with extremum surface assimilation capacities (Q°) of 97.35 mg per g for BPB and 92.63 mg per g for MG. These outcomes suggest that the “adsorbent” surface is “homogeneous”, enabling the mono-layer surface assimilation of BPB and MG. Furthermore, the thermodynamic analysis indicated that the surface assimilation of BPB and MG is exothermic and spontaneous.
Notably, the magnetic properties of Fe3O4@SiO2–GO allowed for efficient magnetic separation, rendering the surface assimilation method speedy and expedient. Collectively, the outcomes affirm that the prepared surface-assimilative material exhibits excellent surface assimilation susceptibility for the dismissal and pre-concentration of BPB and MG. Moreover, it is environmentally friendly and cost-effective, making it a promising option for practical applications.
-
Research ethics: Not applicable.
-
Author contributions: The authors have accepted responsibility for the entire content of this manuscript and approved its submission.
-
Competing interests: The authors state no conflict of interest.
-
Research funding: None declared.
-
Data availability: Not applicable.
References
1. Ukaogo, P. O., Ewuzie, U., Onwuka, C. V. Environmental Pollution: Causes, Effects, and the Remedies. In Microorganisms for Sustainable Environment and Health; Elsevier, 2020; pp. 419–429.10.1016/B978-0-12-819001-2.00021-8Search in Google Scholar
2. Ghaffari, A., Tehrani, M. S., Husain, S. W., Anbia, M., Azar, P. A. Adsorption of Chlorophenols from Aqueous Solution over Amino-Modified Ordered Nanoporous Silica Materials. J. Nanostructure Chem. 2014, 4, 1–10; https://doi.org/10.1007/s40097-014-0114-1.Search in Google Scholar
3. Tubić, A., Lončarski, M., Maletić, S., Molnar Jazić, J., Watson, M., Tričković, J., Agbaba, J. Significance of Chlorinated Phenols Adsorption on Plastics and Bioplastics during Water Treatment. Water 2019, 11(11), 2358; https://doi.org/10.3390/w11112358.Search in Google Scholar
4. Liu, Z., Qin, Q., Hu, Z., Yan, L., Ieong, U. I., Xu, Y. Adsorption of Chlorophenols on Polyethylene Terephthalate Microplastics from Aqueous Environments: kinetics, Mechanisms and Influencing Factors. Environ. Pollut. 2020, 265, 114926; https://doi.org/10.1016/j.envpol.2020.114926.Search in Google Scholar PubMed
5. Pareek, P., Dave, H., Ledwani, L. Microwave Assisted Modification of Graphene Oxide: characterization and Application for Adsorptive Removal of Cationic Dye. Mater. Today: Proc. 2021, 43, 3277–3285; https://doi.org/10.1016/j.matpr.2021.01.956.Search in Google Scholar
6. Martinez, J. L. Environmental Pollution by Antibiotics and by Antibiotic Resistance Determinants. Environ. Pollut. 2009, 157(11), 2893–2902; https://doi.org/10.1016/j.envpol.2009.05.051.Search in Google Scholar PubMed
7. Bharathi, K., Ramesh, S. Removal of Dyes Using Agricultural Waste as Low-Cost Adsorbents: a Review. Appl. Water Sci. 2013, 3, 773–790; https://doi.org/10.1007/s13201-013-0117-y.Search in Google Scholar
8. Ghaly, A. E., Ananthashankar, R., Alhattab, M., Ramakrishnan, V. V. Production, Characterization and Treatment of Textile Effluents: a Critical Review. J. Chem. Eng. Process Technol. 2014, 5(1), 1–19.Search in Google Scholar
9. Eren, E. Adsorption Performance and Mechanism in Binding of Azo Dye by Raw Bentonite. Clean: Soil, Air, Water 2010, 38(8), 758–763; https://doi.org/10.1002/clen.201000060.Search in Google Scholar
10. Anirudhan, T., Ramachandran, M. Adsorptive Removal of Basic Dyes from Aqueous Solutions by Surfactant Modified Bentonite Clay (Organoclay): Kinetic and Competitive Adsorption Isotherm. Process Saf. Environ. Prot. 2015, 95, 215–225; https://doi.org/10.1016/j.psep.2015.03.003.Search in Google Scholar
11. Oussalah, A., Boukerroui, A., Aichour, A., Djellouli, B. Cationic and Anionic Dyes Removal by Low-Cost Hybrid Alginate/natural Bentonite Composite Beads: Adsorption and Reusability Studies. Int. J. Biol. Macromol. 2019, 124, 854–862; https://doi.org/10.1016/j.ijbiomac.2018.11.197.Search in Google Scholar PubMed
12. Oluwole, O. G. Removal of textile dyes from aqueous solutions using clay minerals and agricultural waste (carica papaya seeds); Brunel University London: London, 2020.Search in Google Scholar
13. Khaleque, M. A., Ahammed, S. S., Khan, S. A., Islam, M. E., Alam, M. S. Efficient Removal of Reactive Dyes from Industrial Wastewater by Peanut Husk. IOSR J. Environ. Sci. Toxicol. Food Technol. 2018, 12, 24–28.Search in Google Scholar
14. Ayodhya, D., Veerabhadram, G. A Review on Recent Advances in Photodegradation of Dyes Using Doped and Heterojunction Based Semiconductor Metal Sulfide Nanostructures for Environmental Protection. Mater. Today Energy 2018, 9, 83–113; https://doi.org/10.1016/j.mtener.2018.05.007.Search in Google Scholar
15. Zhou, Y., Lu, J., Liu, Y. Recent Advances for Dyes Removal Using Novel Adsorbents: a Review. Environ. Pollut. 2019, 252, 352–365; https://doi.org/10.1016/j.envpol.2019.05.072.Search in Google Scholar PubMed
16. Sharma, J., Sharma, S., Soni, V. Classification and Impact of Synthetic Textile Dyes on Aquatic Flora: a Review. Reg. Stud. Mar. Sci. 2021, 45, 101802; https://doi.org/10.1016/j.rsma.2021.101802.Search in Google Scholar
17. Yagub, M. T., Sen, T. K., Afroze, S., Ang, H. Dye and its Removal from Aqueous Solution by Adsorption: a Review. Adv. Colloid Interface Sci. 2014, 209, 172–184; https://doi.org/10.1016/j.cis.2014.04.002.Search in Google Scholar PubMed
18. Tripathi, N. Cationic and Anionic Dye Adsorption by Agricultural Solid Wastes: a Comprehensive Review. J. Appl. Chem. 2013, 5, 91–108; https://doi.org/10.9790/5736-5391108.Search in Google Scholar
19. Alhujaily, A., Yu, H., Zhang, X. Adsorptive Removal of Anionic Dyes from Aqueous Solutions Using Spent Mushroom Waste. Appl. Water Sci. 2020, 10(7), 1–12; https://doi.org/10.1007/s13201-020-01268-2.Search in Google Scholar
20. Attallah, O. A., Al-Ghobashy, M. A., Nebsen, M., Salem, M. Y. Removal of Cationic and Anionic Dyes from Aqueous Solution with Magnetite/Pectin and Magnetite/Silica/Pectin Hybrid Nanocomposites: Kinetic, Isotherm and Mechanism Analysis. RSC Adv. 2016, 6(14), 11461–11480; https://doi.org/10.1039/c5ra23452b.Search in Google Scholar
21. Noreen, H., Iqbal, J., Arshad, A., Faryal, R., Ata-ur-Rahman, Khattak, R. Sunlight Induced Catalytic Degradation of Bromophenol Blue and Antibacterial Performance of Graphene Nanoplatelets/polypyrrole Nanocomposites. J. Solid State Chem. 2019, 275, 141–148; https://doi.org/10.1016/j.jssc.2019.03.045.Search in Google Scholar
22. Xiao, X., Sun, Y., Sun, W., Shen, H., Zheng, H., Xu, Y., Zhao, J., Wu, H., Liu, C. Advanced Treatment of Actual Textile Dye Wastewater by Fenton-Flocculation Process. Can. J. Chem. Eng. 2017, 95(7), 1245–1252; https://doi.org/10.1002/cjce.22752.Search in Google Scholar
23. Soares, P. A., Souza, R., Soler, J., Silva, T. F., Souza, S. M. G. U., Boaventura, R. A., Vilar, V. J. Remediation of a Synthetic Textile Wastewater from Polyester-Cotton Dyeing Combining Biological and Photochemical Oxidation Processes. Sep. Purif. Technol. 2017, 172, 450–462; https://doi.org/10.1016/j.seppur.2016.08.036.Search in Google Scholar
24. Kadam, A. A., Lade, H. S., Patil, S. M., Govindwar, S. P. Low Cost CaCl2 Pretreatment of Sugarcane Bagasse for Enhancement of Textile Dyes Adsorption and Subsequent Biodegradation of Adsorbed Dyes Under Solid State Fermentation. Bioresour. Technol. 2013, 132, 276–284; https://doi.org/10.1016/j.biortech.2013.01.059.Search in Google Scholar PubMed
25. Nourmoradi, H., Zabihollahi, S., Pourzamani, H. Removal of a Common Textile Dye, Navy Blue (NB), from Aqueous Solutions by Combined Process of Coagulation–Flocculation Followed by Adsorption. Desalination Water Treat. 2016, 57(11), 5200–5211; https://doi.org/10.1080/19443994.2014.1003102.Search in Google Scholar
26. Piaskowski, K., Świderska-Dąbrowska, R., Zarzycki, P. K. Dye Removal from Water and Wastewater Using Various Physical, Chemical, and Biological Processes. J. AOAC Int. 2018, 101(5), 1371–1384; https://doi.org/10.5740/jaoacint.18-0051.Search in Google Scholar PubMed
27. Smith, A. T., LaChance, A. M., Zeng, S., Liu, B., Sun, L. Synthesis, Properties, and Applications of Graphene Oxide/reduced Graphene Oxide and Their Nanocomposites. Nano Mater. Sci. 2019, 1(1), 31–47; https://doi.org/10.1016/j.nanoms.2019.02.004.Search in Google Scholar
28. Ray, S. C. Application and Uses of Graphene Oxide and Reduced Graphene Oxide. Appl. Graph. Graph Oxide Nanomater. 2015, 6(8), 39–55; https://doi.org/10.1016/b978-0-323-37521-4.00002-9.Search in Google Scholar
29. Ahmadi, M., Ghoorchian, A., Dashtian, K., Kamalabadi, M., Madrakian, T., Afkhami, A. Application of Magnetic Nanomaterials in Electroanalytical Methods: a Review. Talanta 2021, 225, 121974; https://doi.org/10.1016/j.talanta.2020.121974.Search in Google Scholar PubMed
30. Zhou, Q., Li, J., Wang, M., Zhao, D. Iron-based Magnetic Nanomaterials and Their Environmental Applications. Crit. Rev. Environ. Sci. Technol. 2016, 46(8), 783–826; https://doi.org/10.1080/10643389.2016.1160815.Search in Google Scholar
31. Gómez-Pastora, J., Bringas, E., Ortiz, I. Recent Progress and Future Challenges on the Use of High Performance Magnetic Nano-Adsorbents in Environmental Applications. Chem. Eng. J. 2014, 256, 187–204; https://doi.org/10.1016/j.cej.2014.06.119.Search in Google Scholar
32. Di, S., Ning, T., Yu, J., Chen, P., Yu, H., Wang, J., Yang, H., Zhu, S. Recent Advances and Applications of Magnetic Nanomaterials in Environmental Sample Analysis. TrAC, Trends Anal. Chem. 2020, 126, 115864; https://doi.org/10.1016/j.trac.2020.115864.Search in Google Scholar
33. Almakhathi, A. A., Zeeshan, M., Shah, J., Jan, M. R. Simultaneous Removal and Extraction of Bisphenol A and 4-Tert-Butylphenol from Water Samples Using Magnetic Chitosan Particles. Front. Mater. 2022, 9, 786581; https://doi.org/10.3389/fmats.2022.786581.Search in Google Scholar
34. Khan, A., Wang, J., Li, J., Wang, X., Chen, Z., Alsaedi, A., Hayat, T., Chen, Y., Wang, X. The Role of Graphene Oxide and Graphene Oxide-Based Nanomaterials in the Removal of Pharmaceuticals from Aqueous Media: a Review. Environ. Sci. Pollut. Res. 2017, 24, 7938–7958; https://doi.org/10.1007/s11356-017-8388-8.Search in Google Scholar PubMed
35. Shah, J., Jan, M. R., Khan, M., Amir, S. Removal and Recovery of Cadmium from Aqueous Solutions Using Magnetic Nanoparticle-Modified Sawdust: Kinetics and Adsorption Isotherm Studies. Desalin. Water Treat. 2016, 57(21), 9736–9744; https://doi.org/10.1080/19443994.2015.1030777.Search in Google Scholar
36. Shah, J., Jan, M. R., Zeeshan, M., Iqbal, M. Removal and Extraction of Para-Nitrophenol from Aqueous Samples Using Graphene Magnetic Nanocomposite. Arabian J. Sci. Eng. 2017, 42, 4465–4472; https://doi.org/10.1007/s13369-017-2713-x.Search in Google Scholar
37. Wang, R., Wang, X., Xi, X., Hu, R., Jiang, G. Preparation and Photocatalytic Activity of Magnetic Fe3O4/SiO2/TiO2 Composites. Adv. Mater. Sci. Eng. 2012, 2012, 1–8; https://doi.org/10.1155/2012/409379.Search in Google Scholar
38. Iqbal, M., Shah, J., Jan, M. R., Zeeshan, M. Mixed Hemimicelles Dispersive Solid Phase Extraction Using Polyaniline Coated Magnetic Nanoparticles for Chlorophenols from Water Samples. J. Inorg. Organomet. Polym. Mater. 2020, 30, 1430–1437; https://doi.org/10.1007/s10904-019-01249-2.Search in Google Scholar
39. Zeeshan, M., Shah, J., Jan, M. R., Iqbal, M. Removal of Bisphenol-A from Aqueous Samples Using Graphene Oxide Assimilated Magnetic Silica Polyaniline Composite. J. Inorg. Organomet. Polym. Mater. 2021, 31, 2073–2082; https://doi.org/10.1007/s10904-021-01937-y.Search in Google Scholar
40. Shah, J., Jan, M. R., Jamil, S., Haq, A. U. Magnetic Particles Precipitated onto Wheat Husk for Removal of Methyl Blue from Aqueous Solution. Toxicol. Environ. Chem. 2014, 96(2), 218–226; https://doi.org/10.1080/02772248.2014.929690.Search in Google Scholar
41. Khan, H., Iram, Gul, K., Ara, B., Khan, A., Ali, N., Ali, N., Bilal, M. Adsorptive Removal of Acrylic Acid from the Aqueous Environment Using Raw and Chemically Modified Alumina: Batch Adsorption, Kinetic, Equilibrium and Thermodynamic Studies. J. Environ. Chem. Eng. 2020, 8(4), 103927; https://doi.org/10.1016/j.jece.2020.103927.Search in Google Scholar
42. Han, Y., Tao, J., Khan, A., Ullah, R., Ali, N., Ali, N., Malik, S., Yu, C., Yang, Y., Bilal, M. Design and Fabrication of Chitosan Cross-Linked Bismuth Sulfide Nanoparticles-Based Robust Nano-Biocatalytic System for Sequestration and Mitigation of Malignant Mercury Toxicant in River Water Samples. Environ. Res. 2022, 113978; https://doi.org/10.1016/j.envres.2022.113978.Search in Google Scholar PubMed
43. Zhang, S., Malik, S., Ali, N., Khan, A., Bilal, M., Rasool, K. Covalent and non-covalent functionalized nanomaterials for environmental restoration. Top. Curr. Chem. 2022, 380(6), 1–113.10.1007/s41061-022-00405-6Search in Google Scholar PubMed PubMed Central
44. Ara, B., Malik, S., Saba, H., Khan, H., Amir, S., Zia, T. U. H., Taube, P. S., Gul, K. Photocatalytic Degradation of Textile Dyes Laden Industrial Wastewater Using Fabricated Bismuth Ferrite Coated Nickel/nickel Oxide Foam. Z. Phys. Chem. 2023, 237(10), 1483–1503; https://doi.org/10.1515/zpch-2023-0297.Search in Google Scholar
45. Zhang, S., Khan, A., Ali, N., Malik, S., Khan, H., Ali, N., Iqbal, H. M., Bilal, M. Designing, Characterization, and Evaluation of Chitosan-Zinc Selenide Nanoparticles for Visible-Light-Induced Degradation of Tartrazine and Sunset Yellow Dyes. Environ. Res. 2022, 213, 113722; https://doi.org/10.1016/j.envres.2022.113722.Search in Google Scholar PubMed
46. Han, Y., Tao, J., Khan, A., Khan, A., Ali, N., Malik, S., Yu, C., Yang, Y., Jesionowski, T., Bilal, M. Development of Reusable Chitosan-Supported Nickel Sulfide Microspheres for Environmentally Friendlier and Efficient Bio-Sorptive Decontamination of Mercury Toxicant. Environ. Sci. Pollut. Res. 2023, 30(16), 47077–47089; https://doi.org/10.1007/s11356-022-24563-8.Search in Google Scholar PubMed
47. Khan, A., Malik, S., Ali, N., Bilal, M., Yang, Y., Akhter, M. S., Cao, Z., Ye, W., Iqbal, H. M. Nanobiosorbents: basic Principles, Synthesis, and Application for Contaminants Removal. In Nano-Biosorbents for Decontamination of Water, Air, and Soil Pollution; Elsevier: Oxford, UK., 2022; pp. 45–59.10.1016/B978-0-323-90912-9.00003-4Search in Google Scholar
48. Malik, S., Khan, A., Khan, H., Rahman, G., Ali, N., Khan, S., Sotomayor, M. D. P. T. Biomimetic electrochemical sensors based on core-shell imprinted polymers for targeted sunset yellow estimation in environmental samples. Biosensors 2023, 13(4), 429; https://doi.org/10.3390/bios13040429.Search in Google Scholar PubMed PubMed Central
49. Han, Y., Tao, J., Khan, A., Ullah, R., Ali, N., Ali, N., Malik, S., Yu, C., Yang, Y., Bilal, M. Design and Fabrication of Chitosan Cross-Linked Bismuth Sulfide Nanoparticles for Sequestration of Mercury in River Water Samples. Environ. Res. 2022, 215, 113978; https://doi.org/10.1016/j.envres.2022.113978.Search in Google Scholar PubMed
50. Zhang, S., Vanessa, C., Khan, A., Ali, N., Malik, S., Shah, S., Bilal, M., Yang, Y., Akhter, M. S., Iqbal, H. M. Prospecting Cellulose Fibre-Reinforced Composite Membranes for Sustainable Remediation and Mitigation of Emerging Contaminants. Chemosphere 2022, 305, 135291; https://doi.org/10.1016/j.chemosphere.2022.135291.Search in Google Scholar PubMed
51. Qian, G., Duanmu, C., Ali, N., Khan, A., Malik, S., Yang, Y., Bilal, M. Hazardous Wastes, Adverse Impacts, and Management Strategies: A Way Forward to Environmental Sustainability. Environ. Dev. Sustain. 2021, 24, 1–26.10.1007/s10668-021-01867-2Search in Google Scholar
52. Malik, S., Khan, A., Rahman, G., Ali, N., Khan, H., Khan, S., Sotomayor, M. D. Core-shell Magnetic Molecularly Imprinted Polymer for Selective Recognition and Detection of Sunset Yellow in Aqueous Environment and Real Samples. Environ. Res. 2022, 212, 113209; https://doi.org/10.1016/j.envres.2022.113209.Search in Google Scholar PubMed
53. Zhang, S., Khan, A., Ali, N., Malik, S., Khan, H., Ali, N., Iqbal, H. M., Bilal, M. Designing, Characterization, and Evaluation of Chitosan-Zinc Selenide Nanoparticles for Visible-Light-Induced Degradation of Tartrazine and Sunset Yellow Dyes. Environ. Res. 2022, 213, 113722; https://doi.org/10.1016/j.envres.2022.113722.Search in Google Scholar
54. Khorasani, A. C., Shojaosadati, S. A. Magnetic Pectin-Chlorella Vulgaris Biosorbent for the Adsorption of Dyes. J. Environ. Chem. Eng. 2019, 7(3), 103062; https://doi.org/10.1016/j.jece.2019.103062.Search in Google Scholar
55. Shen, T., Mao, S., Ding, F., Han, T., Gao, M. Selective Adsorption of Cationic/anionic Tritoluene Dyes on Functionalized Amorphous Silica: a Mechanistic Correlation between the Precursor, Modifier and Adsorbate. Colloids Surf., A 2021, 618, 126435; https://doi.org/10.1016/j.colsurfa.2021.126435.Search in Google Scholar
56. Alorabi, A. Q., Hassan, M. S., Azizi, M. Fe3O4-CuO-activated Carbon Composite as an Efficient Adsorbent for Bromophenol Blue Dye Removal from Aqueous Solutions. Arabian J. Chem. 2020, 13(11), 8080–8091; https://doi.org/10.1016/j.arabjc.2020.09.039.Search in Google Scholar
57. Liu, Y., Huang, Y., Xiao, A., Qiu, H., Liu, L. Preparation nanocomposite of magnetic and its adsorption Fe3/MIL-88A properties for bromophenol blue dye in aqueous solution. Appl. Behav. Nanomater. Water Treat. 2019, 139–151.10.3390/nano9010051Search in Google Scholar PubMed PubMed Central
58. Akpomie, K. G., Conradie, J. Biogenic and Chemically Synthesized Solanum Tuberosum Peel–Silver Nanoparticle Hybrid for the Ultrasonic Aided Adsorption of Bromophenol Blue Dye. Sci. Rep. 2020, 10(1), 17094; https://doi.org/10.1038/s41598-020-74254-y.Search in Google Scholar PubMed PubMed Central
59. Hassen, J., Ayfan, A. H., Joudah, M. T. Determination of the optimal adsorbent for bromophenol blue dye: adsorption from aqueous solution. Egypt. J. Chem. 2022, 65(131), 645–651.Search in Google Scholar
60. Naboulsi, A., El Himri, M., Gharibi, E. K., El Haddad, M. Study of Adsorption Mechanism of Malachite Green (MG) and Basic Yellow 28 (BY28) onto Smectite Rich Natural Clays (Ghassoul) Using DFT/B3LYP and DOE/FFD. Surf. Interfaces. 2022, 33, 102227; https://doi.org/10.1016/j.surfin.2022.102227.Search in Google Scholar
© 2023 the author(s), published by De Gruyter, Berlin/Boston
This work is licensed under the Creative Commons Attribution 4.0 International License.
Articles in the same Issue
- Frontmatter
- Original Papers
- Climate resilience plastic degradation potential of Pseudomonas putida isolated from the soil of plastic waste dumping sites to reduce GHG emissions
- Agricultural waste upcycling into improved production of triacyl glycerol acyl hydrolases
- Computational investigations of different iron oxide–coronene nanoclusters: a DFT study
- Fabrication, characterization, photocatalytic and biological performances of Mn/ZnO–SiO2 and ZnO–SiO2/PVA based ternary nanocomposites
- Ternary magnetic silica–graphene oxide composite for remediation of textile dyes from aqueous environment and real samples
- Biofabrication of silver nanoparticles using diallyl sulphide (DAS) and comparison of cytotoxic potential of DAS-AgNPs and Kodaikanal Hill garlic in human cervical cancer
- Green synthesis of AgNPs from leaves extract of Saliva Sclarea, their characterization, antibacterial activity, and catalytic reduction ability
- Effect of bead mill dispermat system with specific surfactants on organic pigments