Protective effect of (±)-gossypol through modulation of VEGF and apoptosis in mice bearing Ehrlich’s solid carcinoma
-
Gönül Ulus
 ,
Gürkan Yigitturk
,
Gürkan Yigitturk


Abstract
This study aimed to demonstrate the protective effect of the racemic form of gossypol ((±)-gossypol) on Ehrlich’s solid carcinoma (ESC) model as a syngeneic breast cancer model. In the study, solid tumors developed in 100 % of BALB/c mice in the tumor control group, no tumor development was observed in the group treated with (±)-gossypol prior to tumor cell implantation, and tumor formation was determined as 28.6 % in the post-implantation gossypol treatment group. (±)-Gossypol treatment significantly reduced VEGF expression, indicating a potent anti-angiogenic effect. In the tumor control group, VEGF expression was observed to be markedly intense and extensively distributed across the tumor tissue. Conversely, in the post-implantation gossypol treatment group, VEGF expression was assessed to be significantly lower in comparison to the tumor control group. Administration of (±)-gossypol (40 mg/kg/day ip) for five consecutive days was well tolerated, with no observable signs of systemic toxicity, such as >5 % weight loss or behavioral abnormalities on mice. These findings revealed that (±)-gossypol, in addition to its tumor suppressive effect, can inhibit pro-angiogenic effects of Ehrlich’s ascites carcinoma (EAC) cells and have a protective effect in breast cancer.
1 Introduction
Gossypol is a lipid-soluble polyphenolic compound primarily found in cotton plants (Gossypium sp.). The potential of gossypol as an antitumor agent has been explored in various cancers, including breast cancer, lung cancer, colon cancer, bladder cancer, chronic myeloid leukemia, and pancreatic cancer by targeting MDM2, VEGFR, Bcl-2, and p53 [1], [2], [3], [4], [5]. Angiogenesis, the process through which new blood vessels form from pre-existing ones, is a critical factor in both normal physiological processes and pathological conditions such as cancer, diabetic retinopathy, and rheumatoid arthritis [6]. Inhibiting angiogenesis is a key strategy in the treatment of various solid tumors [7]. Gossypol exerts these effects by interfering with key signaling pathways involved in angiogenesis, including the vascular endothelial growth factor (VEGF) pathway, which plays a pivotal role in blood vessel formation [8]. VEGF, commonly known as VEGF-A, is the most typical regulator in tumor angiogenesis and a mitogen that is specific to endothelial cells and is generated by tumor cells, playing a crucial role in the angiogenesis associated with tumors. Thus, VEGF and its specific receptors (VEGFRs) are identified as the most promising targets for anti-angiogenic cancer therapies [7]. Studies have indicated that gossypol possesses the ability to inhibit angiogenesis, potentially offering therapeutic benefits in preventing the growth of tumors and the spread of cancer [1], [9], [10], [11]. The anticancer mechanism of gossypol is linked to its ability to induce apoptosis via the suppression by VEGF of proteins in the Bcl-2 (anti-apoptotic downstream protein) family that prevents apoptosis [11]. It is identified as a BH3-mimetic inhibitor that acts on pro-apoptotic Bcl-2 family proteins, including Bcl-2, Bcl-xL, and Mcl-1, to trigger apoptosis in cancer [12], [13], [14].
Gossypol is isolated from cottonseed in the form of a racemic mixture ((±)-gossypol). However, it exhibits atropisomerism and it exists as two enantiomers (1R form levogossypol (−) and 1S form dextrogossypol (+)) because of restricted rotation around the binaphthyl bond [9]. It is determined that the bioactivity of (−)-gossypol (AT-101) is more biologically active than (+)-gossypol or racemic gossypol in several biological evaluation experiments [10], 11], 15], 16]. Although there are many different treatment doses of gossypol (5–40 mg/kg) in the literature, the maximum tolerated dosage of (−)-gossypol (for AT-101) in cancer treatment was determined as 40 mg/day [10], 17]. However, (−)-gossypol is more slowly eliminated and significantly more toxic to monogastric animals [18]. On the contrary, in clinical trials for patients with malignant gliomas, and metastatic adrenal cancer, the racemic form of gossypol was found to be well tolerated [19], 20]. Therefore, the use of gossypol in medicine is constrained as a potential pharmacological agent, primarily because of its limited therapeutic dose range, the danger of causing permanent irreversible sterility, and the risk of hypokalemia [11], 16], 21]. This predicament has led to a multitude of studies aimed at reducing the associated side effects and toxicity of gossypol, as well as the identification and development of new derivative molecules with fewer adverse effects and lower toxicity levels [11], 16].
The anticancer efficacy on breast cancer of 10 mg/kg/day of (−)-gossypol has been studied in vivo xenograft models using human breast cancer cells (MCF-7, MDA-MB-231, MDA-MB-468, ZR-75-1, and T47D) [1], 11]. Although the activity in xenograft tumor model predicts clinical response, it is not necessarily true for particular disease indications. Because one major disadvantage of subcutaneous xenograft tumor models is that the microenvironment of the implanted tumor does not reproduce the environment in which the tumor grows [22]. Therefore, syngeneic models have some advantages due to representative of the tumor’s microenvironment [23], 24]. Tumor microenvironment (TME) is a critical factor in cancer progression, metastasis, and response to treatment. Syngeneic tumors transplanted into immunocompetent mice are readily available and provide reproducible results for cancer research. Ehrlich’s solid carcinoma (ESC) is a well-established syngeneic mouse tumor model commonly used in cancer research. This model is important for clarifying controversial scientific issues, serving as links between in vitro and in vivo findings [25]. Because Ehrlich tumors is a spontaneous mammary adenocarcinoma in female mice and TME of the tumor provides several advantages for understanding the complex interactions between tumor cells and their surrounding stroma. ESC tumors exhibit significant angiogenesis which is a hallmark of tumor growth. The TME in ESC models allows for studying angiogenesis in a controlled environment and testing anti-angiogenic therapies. In addition, Ehrlich tumors (acidic or solid) have characteristics that are very close to human breast cancer cells, representing a hormone-positive breast cancer [25]. Also, this carcinoma shows sensitivity to anticancer treatments, rendering it an important model for the examination of potential cancer therapies and drugs [26], 27].
Although many studies have been conducted on the anticancer effect of gossypol to date, it is seen that these studies were carried out with the more biologically active form of gossypol, (−)-gossypol. In addition to this, in the only study that revealed the effect of gossypol in mice injected Ehrlich’s ascites carcinoma (EAC) cells in acid form, no solid tumors were created and only the survival rates and body weights of the animals were measured [28]. However, it is understood that studies with the racemic form of gossypol, which has been shown to be less toxic, are limited in the current literature. For these reasons, the aim of the present study was to demonstrate the protective effect of the racemic form of gossypol on Ehrlich’s solid carcinoma model as a syngeneic breast cancer model.
2 Materials and methods
2.1 Chemicals
(±) Gossypol ([±]-2,20-bis[8-formyl-1,6,7-trihydroxy-5-isopropyl-3-methylnaphthalene]) (Cas no:303-45-7) and suramin (suramine sodium salt, Cas no:129-46-4) were purchased from Sigma-Aldrich Corporation (St. Louis, MO, USA). Biotinylated secondary antibody and streptavidin conjugated horse radish peroxidase (Thermo Scientific Cas no: 85-9043) were purchased from Zymed Laboratories. All chemicals used in the experiment were analytical grade.
2.2 Animals
The experiment was approved by the Ege University Local Ethical Committee for Animal Experiments (24.02.2012; no 2012-032). All procedures were carried according to the Ethical guidelines for investigations of experimental pain in conscious animals [29]. BALB/c albino female mice (6–8 weeks/20–25 g) were obtained from KOBAY Experimental Animal AŞ (Ankara) and housed in steel cages at a temperature-controlled environment (22.0 ± 2.0 °C), where relative humidity was set at 45–65 % with 12 h light/dark cycles at Ege University ARGEFAR. Food and water were available ad libitum and were changed daily and cage hygiene was carried out regularly. The animals were observed daily, and body weights were measured before and during the study.
2.3 Preparation of Ehrlich’s ascites carcinoma (EAC) cells
EAC is a spontaneous adenocarcinoma in mice. It can be transmitted between mice by serial intraperitoneal (ip) passages [30]. When ascitic fluid containing tumor cells is injected into animals intraperitoneally and subcutaneously, EAC develops in liquid or solid form. EAC cells were supplied by Istanbul University, Faculty of Veterinarian (Istanbul-Turkey). The cells were maintained in a BALB/c albino mouse by intraperitoneal transplantation. Seven days after EAC cells implantation, an ascetic fluid was withdrawn under aseptic conditions from tumor-bearing a mouse by needle aspiration from peritoneal cavity. The cells were suspended in phosphate buffered saline (PBS) so that each 0.1 ml contains 2.5 × 10⁶ cells. Cells were counted under a microscope with a hemocytometer.
2.4 Experimental Ehrlich’s solid carcinoma (ESC) model
In the study, animals were randomly divided into five groups (n = 7) to determine the protective and therapeutic efficacy of gossypol. EAC cells (2.5 × 10⁶ cells/ml PBS) were subcutaneously (s.c.) injected as 0.3 ml into the right flank of BALB/c mice to induce a solid carcinoma [31]. The groups are as follows;
Group 1 (Negative control group): Mice were administered with 500 μL of saline (0.9 % NaCl) i.p. once every day for 5 days (n = 7).
Group 2 (Tumor control group): EAC cells were s.c. injected into mice (n = 7).
Group 3 (Positive control group): EAC cells were s.c. injected into mice. On day 3 post inoculation of cells, mice were administered with 10 mg/kg suramin sodium salt i.p. once every day for 5 days (n = 7).
Group 4 (pre-implantation Gossypol treatment group): Mice were administered with 40 mg/kg (±) Gossypol i.p. for 5 days before EAC cells were s.c. injected into mice (n = 7).
Group 5 (post-implantation Gossypol treatment group): EAC cells were s.c. injected into mice. On day 3 post inoculation of cells, mice were administered with 40 mg/kg (±) Gossypol i.p. once every day for 5 days (n = 7).
The tumor development was evaluated by palpation method. On day 14, mice were sacrificed by taking blood from the heart under ketamine (80 mg/kg) and xylazine (10 mg/kg) combined anesthesia, and tumors were excised from all animals, and measured with a caliper and, the tumor volume was calculated using the formula [32];
where V(mm3) is the tumor volume in mm3, a = length, b = width of the tumors.
Then, tumors were weighed and fixed in 10 % neutral buffered formalin for histochemical and immunohistochemical investigations.
2.4.1 Hematological analysis
The hematological analysis was performed by VetScan HM5 device for 15 parameters (White blood cell-WBC, lymphocyte-LYM, monocyte-MON, neutrophil-NEU, med blood cell-RBC, hemoglobin-HGB, hemotocrit-HCT, mean cellular volume-MCV, mean cellular hemoglobin-MCH, mean cellular hemoglobin concentration-MCHC, red cell distribution width-RDWc, thrombocyte-PLT, platelet count in blood-PCT, mean platelet volume-MPV, platelet distribution width -PDWc).
2.4.2 Biochemical analysis
The biochemical analysis was performed with blood serum on VetScan VS2 device with “Comprehensive Diagnostic Kit” and “Mammalian Liver Profile Kit” including 16 parameters (Total protein-TP, albumin-ALB, globulin-GLOB, glucose-GLU, alanine aminotransferase-ALT, amylase-AMY, gamma-glutamyl transferase-GGT, alkaline phosphatase-ALP, total bilirubin- TBIL, total cholesterol-TCHOL, creatinine-CRE, blood urea nitrogen-BUN, calcium-Ca, sodium-Na, potassium-K, inorganic phosphate-IP).
2.4.3 Histochemical and immunohistochemical (IHC) examinations
Tumor tissues were removed from each animal and collected in falcon tubes. After washing 2 times with PBS, the tissues were kept in 4 % paraformaldehyde for one night and subjected to a series of increasing degrees of alcohol and left to air dry. Dried samples were passed through xylol 3 times for 30 min until they became transparent. Paraffin-infused samples were kept in an oven at 58 °C for one night. The paraffin was renewed and waited for 2 h. This process was repeated two times, respectively. Then, the tissues were embedded in paraffin and routine hematoxylin-eosin staining was performed on 5-μm sections taken from paraffin blocks. The images were taken and examined under the microscopy (BX5, Olympus, Tokyo, Japan) [33].
For IHC examination, histological sections were incubated with 3 % H2O2 (Sigma-Aldrich) for 10 min to eliminate endogenous standard activity and blocked with Super Block for 20 min at room temperature. Subsequently, sections were incubated with primary antibodies directed against vascular endothelial growth factor (VEGF) (sc-7269, Santa Cruz Biotechnology) overnight at 4 °C in a humid chamber. All antibodies were diluted in a 1:100 ratio. Sections were then incubated with biotinylated secondary antibody and then with streptavidin conjugated to horse radish peroxidase for 30 min each. Next, DAB chromogen + substrate (UltraTek HRP Anti-Polyvalent (DAB) Staining System, ScyTec Inc.) was applied on slides and then counterstained with Mayer’s hematoxylin (Sigma-Aldrich). Detection of apoptosis in tumor tissue was demonstrated by the Promega cat G7360 with “DeadEnd™ Colorimetric Apoptosis Detection System (TUNEL) System”. Sections were fixed in 4 % paraformaldehyde and incubated for 25 min at room temperature. Subsequently, samples were washed in PBS and permeabilized with 20 μg/mL Proteinase K solution per slide. Sections were then incubated with the reaction mixture containing biotinylated nucleotide and terminal deoxynucleotidyl transferase (rTdT) for 60 min at 37 °C. At the end of the period, the slides were washed with sodium chloride-sodium citrate buffer (SSC) and PBS buffer. Streptavidin HRP (horseradish peroxidase) was added to each slide and incubated for 30 min at room temperature. The slides were then stained with a diaminobenzidine (DAB) system and examined for the presence of apoptotic cells [34].
2.4.4 Statistical analysis
Statistical analyses of data were performed using SPSS software version 25.0 (IBM Corp., Armonk, New York, USA). The variables were investigated using Kolmogorov–Simirnov test to determine whether they are normally distributed. One-way analysis of variance (ANOVA) followed by LSD test was used for comparison between the groups of experimental ESC model. Data were expressed as the mean ± standard deviation (SD). Values of p ≤ 0.05 were regarded as statistically significant.
3 Results
3.1 Total body weights
During the study, weight losses not exceeding 20 % of the initial weights were noted (Table 1), whereas no deaths were observed in the experimental groups. Statistically significant decreases were noted with respect to the body weights in post-implantation gossypol treatment groups when compared to the control (p < 0.05).
Total body weight values of animals in experimental groups starting from day 0 to 14.
| Treatment groups | Total body weights (g) (mean ± SD) | Increase % | ||
|---|---|---|---|---|
| Day 0 | Day 7 | Day 14 | ||
| Negative control (0.9 % NaCl) | 22.39 ± 3.13 | 25.60 ± 3.80 | 26.86 ± 2.11 | 19.14 |
| Tumor control | 23.85 ± 3.41 | 24.97 ± 3.45 | 25.38 ± 1.84 | 9.29 |
| Positive control (10 mg/kg suramin) | 24.19 ± 1.67 | 25.59 ± 1.27 | 27.40 ± 1.04 | 16.85 |
| Pre-imp. gossypol treatment | 23.06 ± 2.61 | 22.26 ± 2.52 | 23.56 ± 1.19* | 2.16* |
| Post-imp. gossypol treatment | 23.24 ± 1.66 | 24.49 ± 3.17 | 22.91 ± 1.57* | −1.79* |
| F | 0.965 | 2.643 | 4.063 | 4.574 |
| P | 0.441 | 0.053 | 0.016 | 0.007 |
-
*Statistically significant from the negative control group (p < 0.05).
3.2 Tumor formation
In the experimental study, solid tumors were successfully created with EAC cells in the tumor control group and tumor formation was observed as 100 % in all mice in the group. While no tumor formation occurred in the pre-implantation gossypol treatment group, tumor formation was determined as 28.6 % in the post-implantation gossypol treatment group (Table 2).
Tumor measurement results. Data was expressed as the mean ± SD.
| Treatment groups | Weight (g) | Length (mm) | Width (mm) | Volume (mm3) | Tumor formation (%) |
|---|---|---|---|---|---|
| Negative control (0.9 % NaCl) | – | – | – | – | 0 |
| Tumor control | 0.23 ± 0.037 | 1.13 ± 0.25 | 0.89 ± 0.14 | 0.61 ± 0.19 | 100.0 |
| Positive control (10 mg/kg suramin) | 0.29 ± 0.040 | 1.28 ± 0.37 | 0.85 ± 0.10 | 0.54 ± 0.23 | 57.1 |
| Pre-imp. gossypol treatment | – | – | – | – | 0 |
| Post- imp. gossypol treatment | 0.19 ± 0.060 | 1.43 ± 0.57 | 1.18 ± 0.32 | 0.93 ± 0.56 | 28.6 |
3.3 Hematological and biochemical analysis
Biochemical and hematological parameters were evaluated on the blood taken from the mice in the experimental groups at the beginning and the end of the study (Table 3 and 4). Total protein (TP) is an important determinant of metabolic homeostasis due to proteins found in all components of cells. Considering the control group and the reference values of the specified breeds (Loeb and Quimby, 1999), it was observed that TP and ALB, indicators of general physical conditions, were within reference values for animals in all experimental groups and the general health status of the animals were found to be good. Nevertheless, the hepatic system indicators, GGT and TBIL were at normal ranges in the experimental groups. In addition, when renal system indicators (BUN, CRE, and IP), vascular system (TCHOL), and bone system indicators (Ca, IP) were evaluated, the application groups showed values compatible with the control group and the reference values. AMY levels at the end of the study were significantly high in tumor control, positive control and post-implantation gossypol treatment groups compared to levels at the beginning on the study, which generally indicates cancer.
Biochemical analysis values of animals. Data was expressed as the mean ± SD.
| Biochemical parameters | Groups | |||||||||
|---|---|---|---|---|---|---|---|---|---|---|
| Negative control (0.9 % NaCl) | Tumor control | Positive control (10 mg/kg suramin) | Pre-imp. gossypol treatment | Post-imp. gossypol treatment | ||||||
| Day 0 | Day 14 | Day 0 | Day 14 | Day 0 | Day 14 | Day 0 | Day 14 | Day 0 | Day 14 | |
| TP (g/dL) | 5.95 ± 0.35 | 4.95 ± 0.07 | 5.60 ± 0.98 | 4.75 ± 0.49 | 5.70 ± 0.42 | 5.00 ± 0.28 | 5.25 ± 0.02 | 5.40 ± 0.42 | 5.20 ± 0.42 | 5.45 ± 0.21 |
| ALB (g/dL) | 4.15 ± 0.21 | 3.15 ± 0.21 | 4.15 ± 0.21 | 3.10 ± 0.56 | 4.25 ± 0.07 | 3.30 ± 0.14 | 3.25 ± 0.35 | 2.50 ± 0.70 | 4.35 ± 0.07 | 3.65 ± 0.07 |
| GLOB (g/dL) | 2.65 ± 0.63 | 1.80 ± 0.28 | 2.80 ± 0.56 | 1.65 ± 0.07 | 3.00 ± 0.56 | 1.65 ± 0.07 | 1.65 ± 0.21 | 2.85 ± 0.35 | 3.05 ± 0.35 | 1.85 ± 0.21 |
| ALP (u/L) | 89.50 ± 9.19 | 95.00 ± 2.82 | 82.00 ± 2.82 | 53.50 ± 28.99 | 79.00 ± 7.07 | 96.00 ± 21.21 | 76.50 ± 3.53 | 45.00 ± 8.48 | 84.00 ± 1.41 | 91.00 ± 1.41 |
| ALT (u/L) | 64.00 ± 19.79 | 73.00 ± 2.82 | 66.00 ± 1.41 | 46.50 ± 3.53 | 46.00 ± 5.65 | 39.50 ± 2.12 | 55.00 ± 7.01 | 29.50 ± 6.36 | 63.00 ± 5.65 | 56.50 ± 4.94 |
| AMY (u/L) | 764.00 ± 50.91 | 793.50 ± 9.19 | 670.0 ± 45.25 | 960.00 ± 46.66* | 833.00 ± 178.19 | 1077.50 ± 33.23* | 783.50 ± 23.33 | 865.00 ± 145.66 | 719.50 ± 36.06 | 996.50 ± 136.47* |
| TBIL (mg/dL) | 0.25 ± 021 | 0.50 ± 0.01 | 0.35 ± 0.07 | 0.50 ± 0.01 | 0.30 ± 0.01 | 0.50 ± 0.01 | 0.35 ± 0.07 | 0.40 ± 0.01 | 0.35 ± 0.07 | 0.40 ± 0.01 |
| BUN (mg/dL) | 15.50 ± 3.54 | 21.00 ± 1.41 | 11.50 ± 2.12 | 18.50 ± 0.70 | 15.50 ± 0.70 | 21.00 ± 0.01 | 11.50 ± 0.70 | 25.00 ± 1.41 | 11.00 ± 1.41 | 24.50 ± 0.70 |
| Ca (mg/dL) | 9.40 ± 0.84 | 10.35 ± 0.07 | 9.80 ± 0.42 | 9.70 ± 0.28 | 9.85 ± 0.49 | 9.40 ± 0.01 | 10.55 ± 0.07 | 10.50 ± 0.01 | 9.95 ± 1.48 | 9.85 ± 0.77 |
| Phos (mg/dL) | 8.30 ± 0.98 | 9.90 ± 0.14 | 8.50 ± 2.68 | 6.75 ± 1.34 | 8.65 ± 0.77 | 7.55 ± 0.35 | 7.65 ± 0.07 | 7.90 ± 1.41 | 8.60 ± 2.40 | 8.70 ± 0.42 |
| Cre (mg/dL) | 0.30 ± 0.14 | 0.20 ± 0.01 | 0.30 ± 0.01 | 0.20 ± 0.01 | 0.20 ± 0.01 | 0.20 ± 0.01 | 0.30 ± 0.01 | 0.20 ± 0.01 | 0.30 ± 0.07 | 0.20 ± 0.01 |
| GLU (mg/dL) | 215.50 ± 6.36 | 251.00 ± 1.31 | 174.50 ± 34.6 | 211.00 ± 28.28 | 214.00 ± 18.38 | 239.50 ± 10.60 | 259.50 ± 55.86 | 189.50 ± 10.60 | 172.50 ± 24.74 | 238.00 ± 2.82 |
| Na (mmol/L) | 137.00 ± 1.41 | 146.00 ± 1.41 | 132.50 ± 0.70 | 145.00 ± 0.01 | 214.00 ± 18.38 | 143.50 ± 0.70 | 134.50 ± 6.36 | 145.50 ± 0.70 | 138.50 ± 0.70 | 147.00 ± 1.41 |
| K (mmol/L) | 5.90 ± 0.14 | 4.90 ± 042 | 4.60 ± 0.42 | 4.70 ± 0.28 | 7.80 ± 2.26 | 4.95 ± 0.35 | 6.95 ± 0.49 | 5.60 ± 0.42 | 4.45 ± 2.21 | 5.40 ± 0.14 |
-
*Statistically significant from the level at the beginning of the study (p < 0.05).
Hematological analysis values of animals. Data was expressed as the mean ± SD.
| Hematological parameters | Groups | |||||||||
|---|---|---|---|---|---|---|---|---|---|---|
| Negative control (0.9 % NaCl) | Tumor control | Positive control (10 mg/kg suramin) | Pre-imp. gossypol treatment | Post-imp. gossypol treatment | ||||||
| Day 0 | Day 14 | Day 0 | Day 14 | Day 0 | Day 14 | Day 0 | Day 14 | Day 0 | Day 14 | |
| WBC (109 h/L) | 9.00 ± 0.88 | 7.95 ± 0.62 | 8.44 ± 2.02 | 10.75 ± 0.16 | 9.13 ± 0.57 | 8.84 ± 3.16 | 9.62 ± 3.47 | 3.27 ± 4.10 | 8.58 ± 2.17 | 7.94 ± 0.28 |
| LYM (109 h/L) | 6.81 ± 0.43 | 4.31 ± 0.79 | 5.60 ± 2.12 | 5.59 ± 1.34 | 6.64 ± 0.73 | 4.45 ± 0.05 | 4.45 ± 0.07 | 2.37 ± 2.37 | 4.21 ± 0.35 | 3.57 ± 0.74 |
| MON (109 h/L) | 0.25 ± 0.11 | 0.12 ± 0.09 | 0.14 ± 0.02 | 0.72 ± 0.42* | 0.31 ± 0.23 | 0.25 ± 0.13 | 0.47 ± 0.02 | 0.09 ± 0.01 | 0.26 ± 0.02 | 0.08 ± 0.02 |
| NEU (109 h/L) | 0.59 ± 0.13 | 2.91 ± 0.64 | 1.31 ± 1.31 | 4.35 ± 1.13 | 0.54 ± 0.03 | 3.92 ± 3.10 | 2.21 ± 0.13 | 0.76 ± 0.94 | 2.54 ± 0.66 | 5.04 ± 0.67 |
| RBC (1012 h/L) | 8.08 ± 1.72 | 8.46 ± 0.43 | 7.19 ± 0.46 | 8.54 ± 0.83 | 8.27 ± 0.95 | 8.08 ± 0.46 | 7.66 ± 0.31 | 6.01 ± 4.22 | 7.50 ± 0.22 | 7.87 ± 0.17 |
| HGB (g/L) | 14.33 ± 0.32 | 13.90 ± 0.71 | 14.65 ± 0.67 | 13.70 ± 1.84 | 13.21 ± 0.43 | 27.40 ± 20.49 | 14.33 ± 2.03 | 9.55 ± 7.14 | 15.14 ± 1.18 | 13.15 ± 1.48 |
| HCT (%) | 37.54 ± 1.37 | 41.90 ± 1.14 | 36.88 ± 2.52 | 38.70 ± 4.93 | 34.16 ± 2.47 | 38.25 ± 3.18 | 42.43 ± 1.56 | 28.51 ± 20.01 | 39.89 ± 2.50 | 38.29 ± 3.83 |
| MCV (fl) | 46.50 ± 0.70 | 49.50 ± 3.54 | 50.50 ± 3.54 | 45.00 ± 1.41 | 45.00 ± 0.10 | 48.50 ± 2.12 | 49.50 ± 3.53 | 47.00 ± 0.01 | 49.00 ± 1.41 | 47.50 ± 4.94 |
| MCH (pg) | 12.65 ± 0.21 | 16.45 ± 0.07 | 11.85 ± 1.20 | 16.10 ± 0.56 | 12.60 ± 0.10 | 16.60 ± 0.14 | 11.05 ± 0.07 | 15.50 ± 0.89 | 11.00 ± 001 | 15.65 ± 0.77 |
| MCHC (g/dL) | 30.00 ± 0.71 | 33.25 ± 2.47 | 27.90 ± 1.98 | 35.55 ± 0.21 | 29.51 ± 2.28 | 43.20 ± 14.28 | 28.10 ± 0.70 | 32.70 ± 2.12 | 27.50 ± 3.39 | 35.10 ± 1.55 |
| RDWc (%) | 18.30 ± 0.14 | 18.90 ± 0.56 | 18.90 ± 0.42 | 18.10 ± 0.85 | 17.65 ± 0.77 | 18.35 ± 0.07 | 18.55 ± 0.91 | 18.95 ± 1.20 | 18.80 ± 0.70 | 18.75 ± 0.49 |
| PLT (109 cell/L) | 280.00 ± 14.14 | 322.50 ± 14.85 | 280.00 ± 28.28 | 588.00 ± 50.91* | 308.00 ± 82.02 | 463.00 ± 42.26* | 325.00 ± 7.07 | 391.00 ± 12.72 | 325.00 ± 35.35 | 905.00 ± 21.21* |
| PCT (%) | 0.13 ± 0.11 | 0.37 ± 0.10 | 0.11 ± 0.11 | 0.19 ± 0.07 | 0.20 ± 0.15 | 0.30 ± 0.23 | 0.20 ± 0.04 | 0.30 ± 0.40 | 0.17 ± 0.02 | 0.18 ± 0.10 |
| MPV (fl) | 7.60 ± 0.56 | 6.30 ± 0.56 | 7.55 ± 0.91 | 6.05 ± 0.07 | 6.90 ± 0.28 | 7.45 ± 1.76 | 8.20 ± 0.84 | 6.60 ± 0.28 | 7.00 ± 1.83 | 6.97 ± 0.24 |
| PDWc (%) | 35.70 ± 1.69 | 29.35 ± 0.35 | 39.45 ± 0.35 | 29.05 ± 0.77 | 34.30±,40 | 35.35 ± 8.84 | 31.90 ± 0.56 | 32.10 ± 3.53 | 34.50 ± 1.62 | 31.70 ± 0.70 |
-
*Statistically significant from the level at the beginning of the study (p < 0.05).
When the initial and final hematological values of the experimental groups were examined, no statistically significant difference was observed in the hematological values in the negative control groups and pre-implantation gossypol treatment group while statistically significant increases were detected in the PLT value in the tumor control, positive control, and post-implantation gossypol treatment group.
3.4 Histological findings
Tumor tissue sections were evaluated with routine histological parameters by H&E staining and the experimental groups were compared in terms of tumor tissue prevalence and density, inflammation, and vascular densities. Tissue sections in the tumor control group show quite dense (compact) and widespread tumor tissue. In addition, dense inflammation, abundant, and hemorrhagic vessels are observed in the group. In the positive control group tumor tissue sections, tumor tissue is observed with considerably reduced density and prevalence. Moreover, vascular structures and inflammation are observed to be considerably reduced. In the post-imp. gossypol treatment group tumor tissue, less dense and less widespread than the tumor control group, but more dense and more widespread tumor tissue was observed than the positive control group. Less vessels and inflammation were observed than the tumor control group and denser than the positive control group (Figure 1).
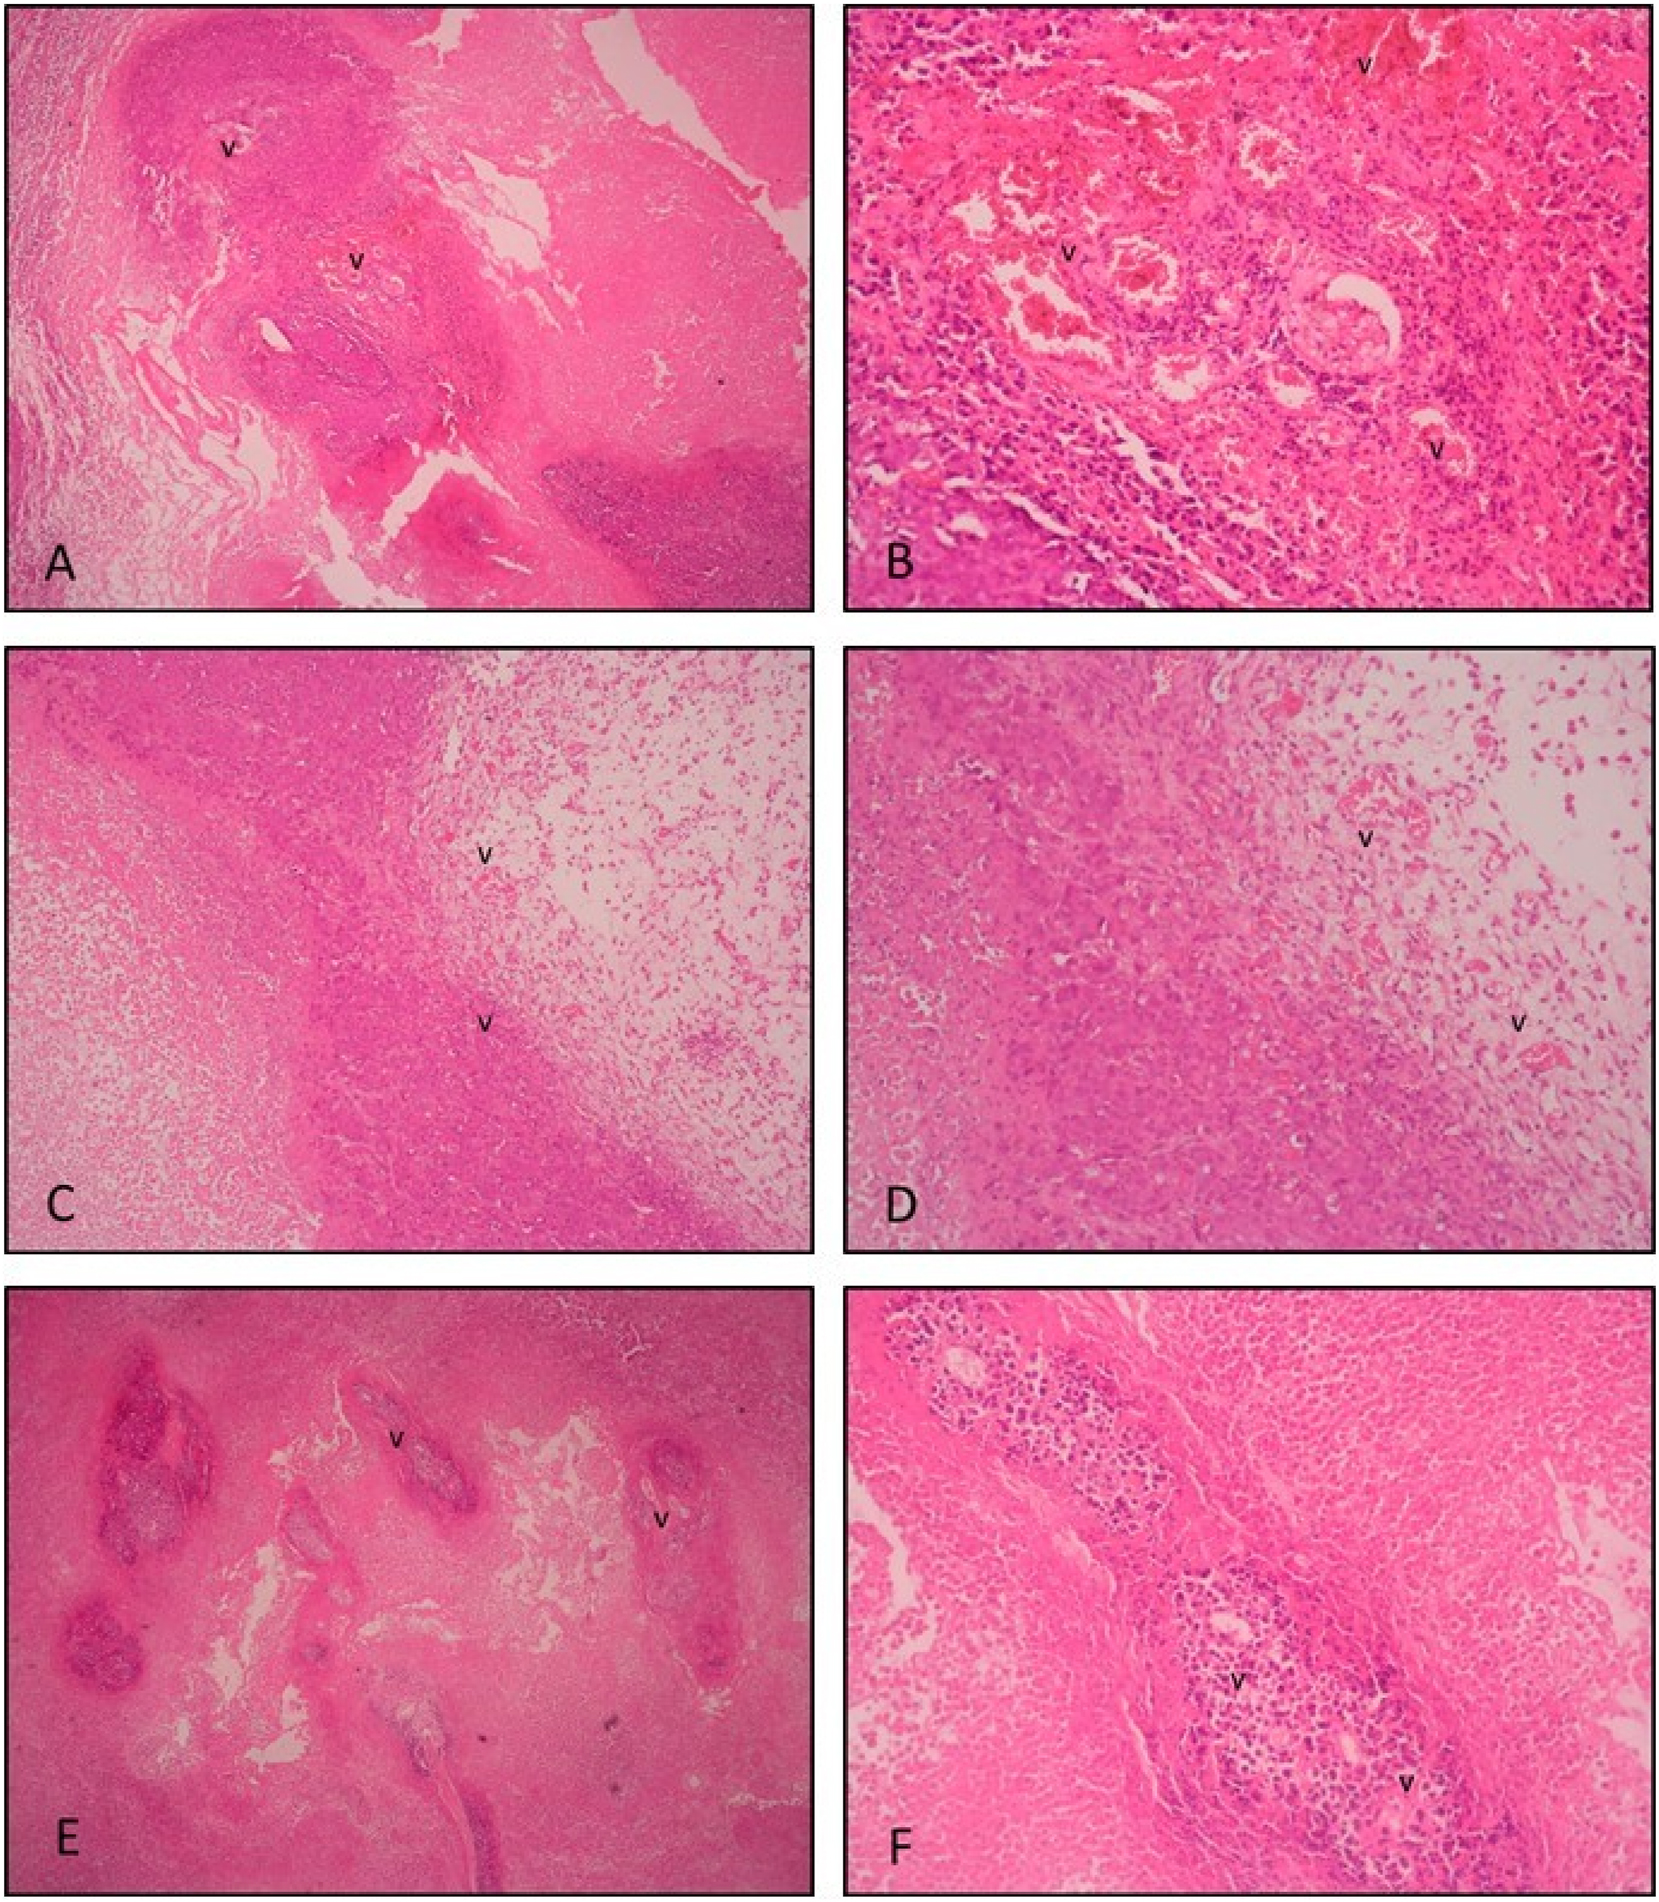
H&E staining. Histological section of tumor tissue in the tumor control group; (A ×4, B ×20 magnification). Extensive inflammation and numerous hemorrhagic vessels are observed within and around the highly compacted tumor tissue. Histological sections of tumor tissue in the positive control (10 mg/kg suramin treatment) group; (C ×4, D ×20 magnification). Fewer vessels and inflammatory cells are seen within the decreased noncompact tumor tissue and surrounding stromal tissue compared to the tumor control group. Histological sections of tumor tissue in the post-implantation gossypol treatment group; (E ×4, F ×20 magnification). Less extensive compact tumor tissue is seen compared to the tumor control group. Fewer vessels and reduced inflammation are seen. v: vessel.
TUNEL stained tumor tissue sections were evaluated in terms of general apoptotic parameters. A very small number of apoptotic cells were observed in tumor tissue sections of the tumor control group. In positive control group tumor tissue sections, apoptotic cells were observed in a considerably higher amount compared to the tumor control group. When the histological sections of the tumor tissue of the post-implantation gossypol treatment group were examined, more apoptotic cells were observed compared to the tumor control group, while fewer apoptotic cells were stained compared to the positive control group (Figure 2).
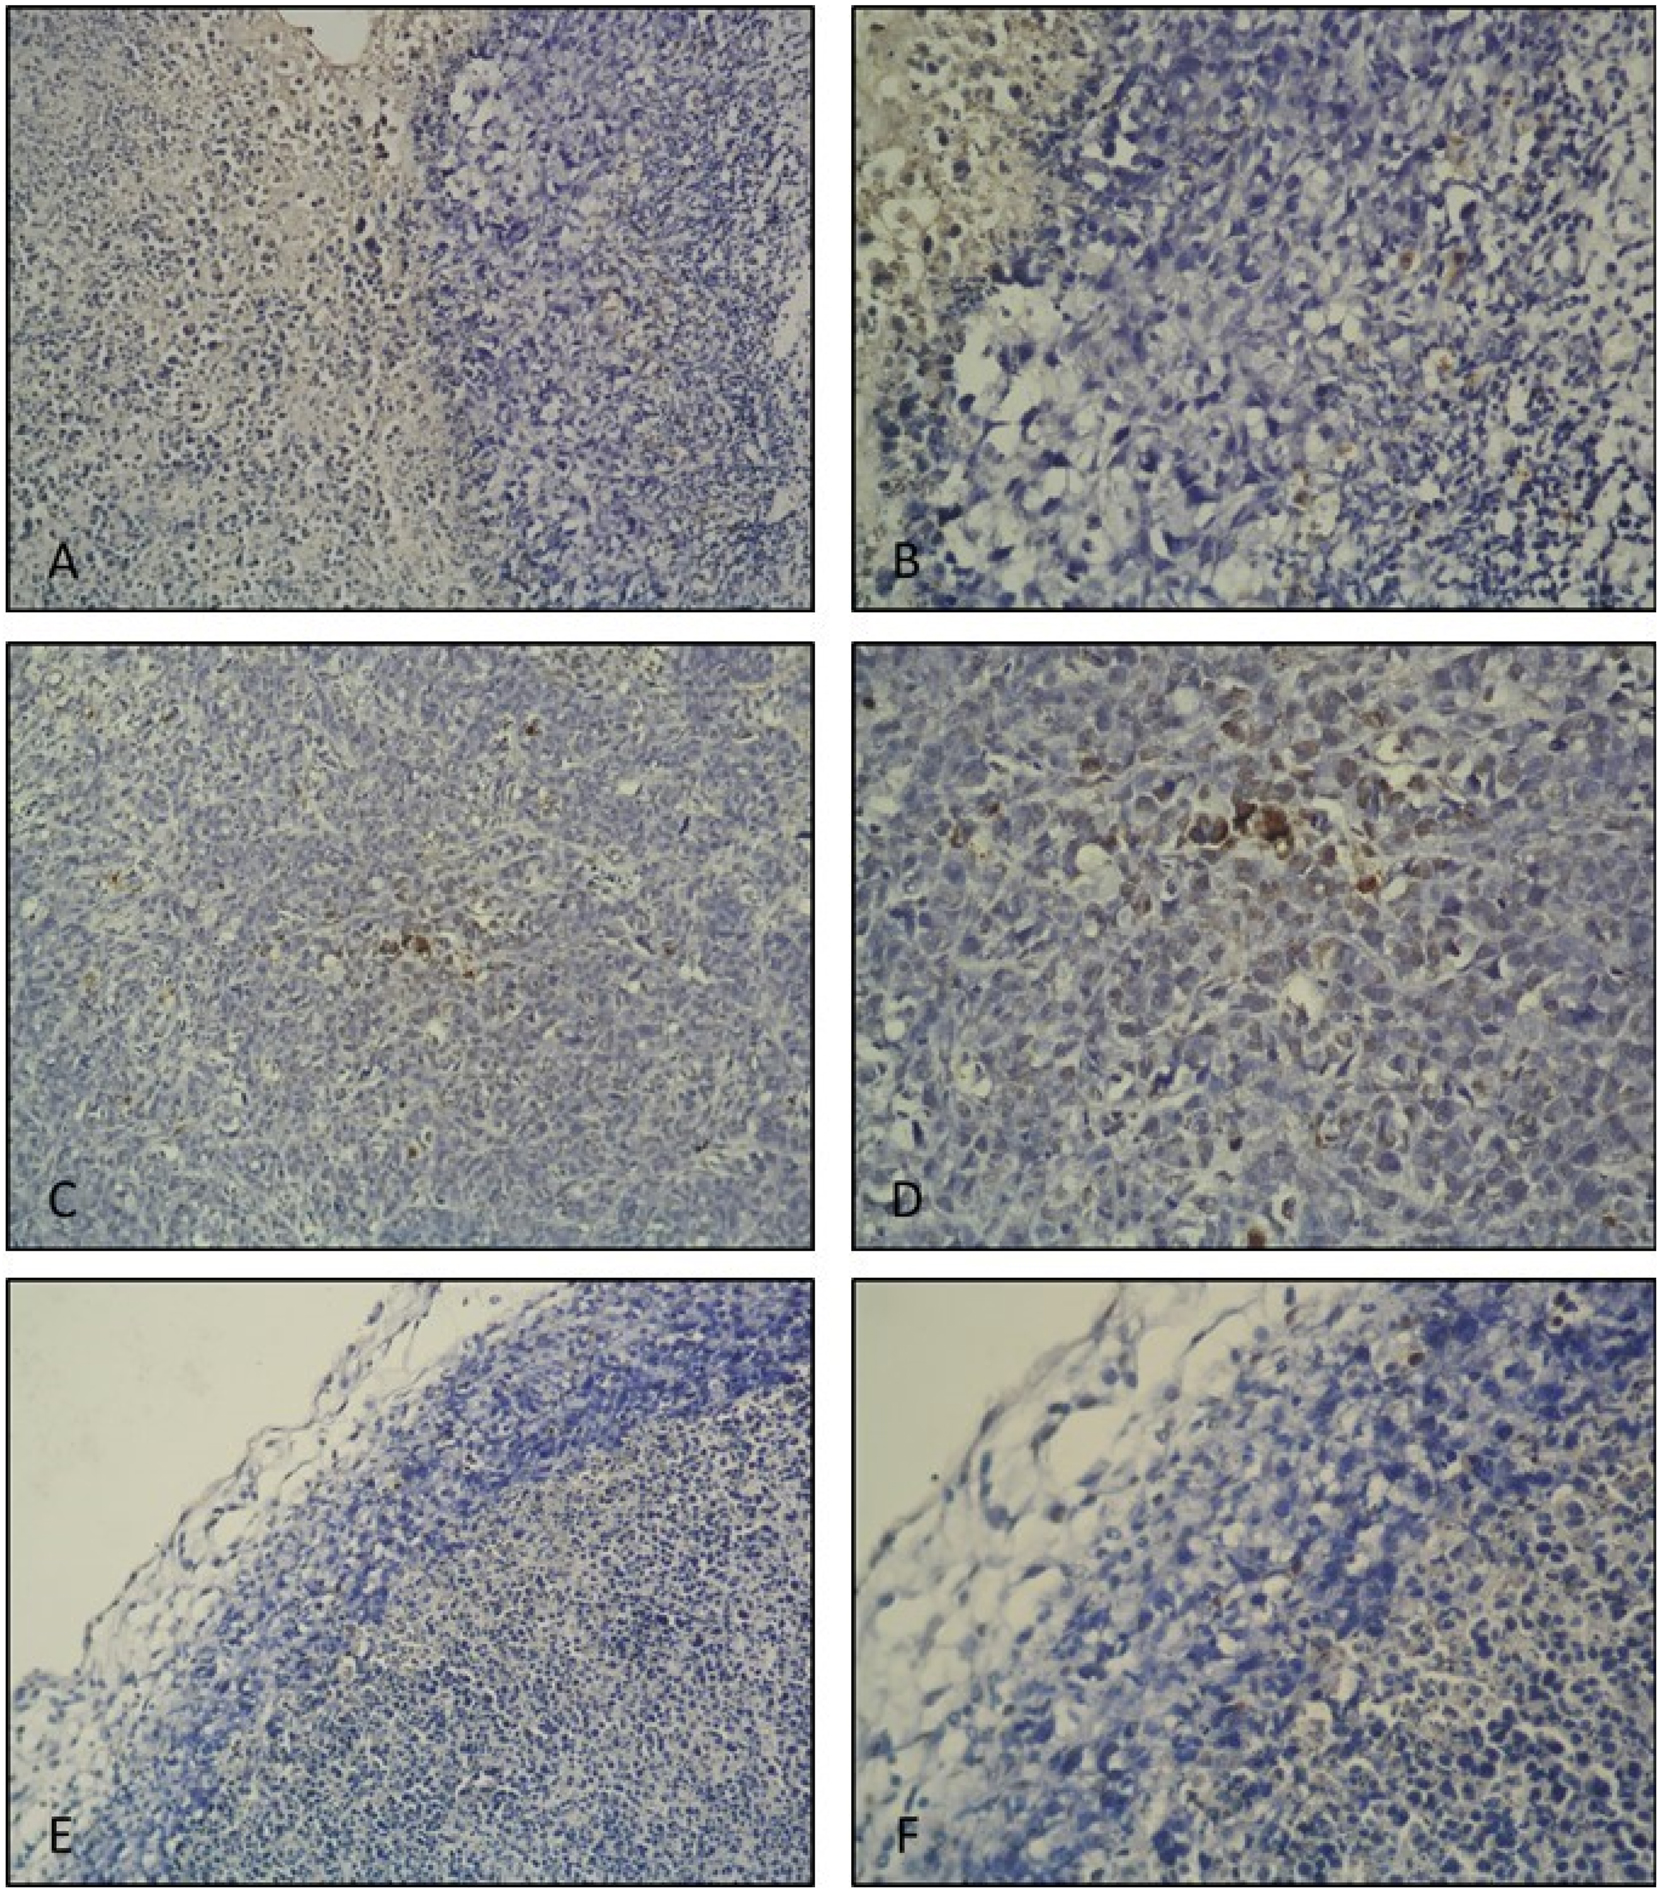
TUNEL IHC staining. Tumor control group tumor tissue histological section; (A ×20, B ×40 magnification). Very few apoptotic cells are seen. Positive control (10 mg/kg suramin treatment) group tumor tissue histological section; (C ×20, D ×40 magnification). Apoptotic cells are observed densely within the tumor tissue. Post-implantation gossypol treatment group tumor tissue histological section; (E ×20, F ×40 magnification). Apoptotic cells are observed.
In the tumor control group, VEGF expression was observed to be quite intense and widespread in the tumor tissue. In the positive control group, decreased VEGF expression was observed in the tumor tissue compared to the control group. In the post-implantation gossypol treatment group, VEGF expression was also evaluated to be significantly decreased compared to the control group. When compared to the positive control group, VEGF expression was observed to be relatively higher in the post-implantation gossypol treatment group (Figure 3).
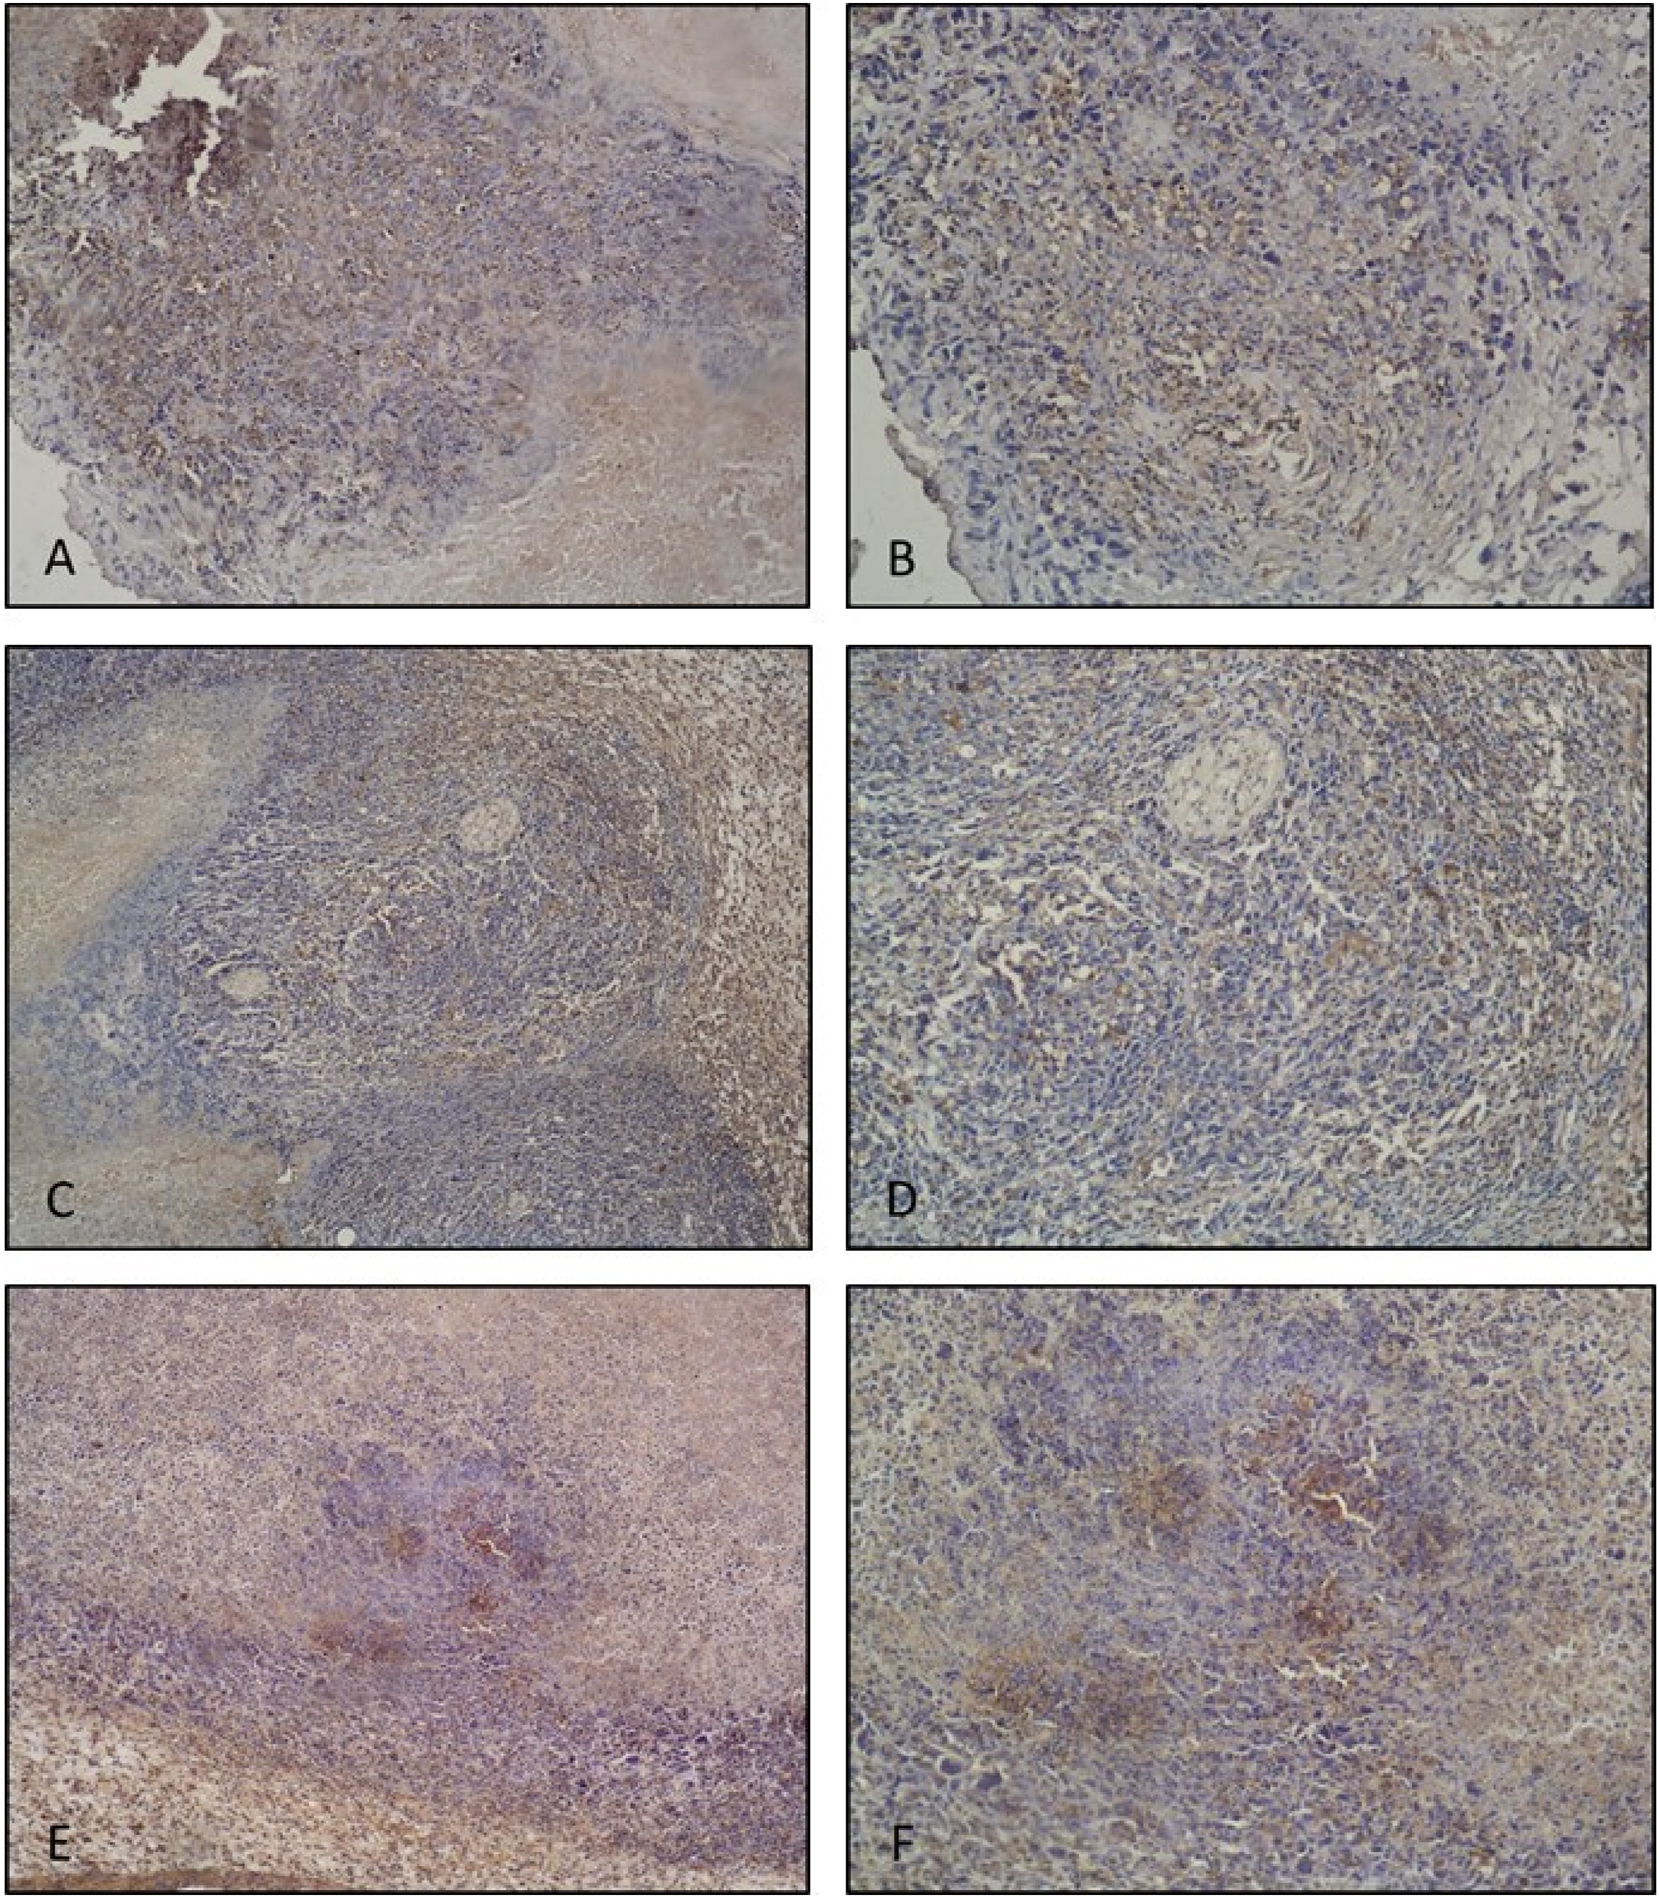
VEGF IHC staining. Tumor control group tumor tissue histological sections; (A ×10, B ×20 magnification). Quite intense and widespread VEGF expressions are observed. Positive control (10 mg/kg suramin treatment) group tumor tissue histological section; (C ×10, D ×20 magnification). Decreased VEGF expression is observed compared to the tumor control group. Post-implantation gossypol treatment group tumor tissue histological section; (E ×10, F ×20 magnification). Decreased VEGF expression is observed compared to the tumor control group.
4 Discussion
Estrogen and progesterone are the two hormones associated with breast cancer. The prognosis of this cancer includes estrogen receptor (ER), progesterone receptor (PR), and ERBB2 (or HER2) receptor [35]. According to the National Cancer Institute, approximately 80 % in women and 90 % in men of breast cancers are ER-positive. Solely 1 % of breast cancers are PR-positive but ER-negative. If the cancer has either or both receptors, it is known as hormone-positive breast cancer [36]. Since breast cancer is the most common cancer worldwide and responsible for many deaths, especially among women, in vitro and in vivo models are of great importance in research against this cancer [25]. Ehrlich tumor originated from mouse breast tissue is one of these models, especially for hormone-positive breast cancer. This model is very suitable for pre-clinical and translational studies of breast cancer and is a relevant tool for improving our understanding of the pathogenesis of breast cancer and investigating the tumor microenvironment, side effects of therapies, and new treatment options [26], 27].
The present study revealed anti-angiogenic and apoptotic potentials of (±)-gossypol on ESC experimental model. It has been shown immunohistochemically that the antiangiogenic effect of (±)-gossypol is due to a decrease in VEGF expression and that its anti-tumoral effect is linked to its ability to induce apoptosis. It is known that gossypol inhibits anti-apoptotic Bcl-2-regulated VEGF expression in tumor angiogenesis [11]. As a BH3-mimetic agent, gossypol is capable of binding to the BH3 domain of proteins within the Bcl-2 family. Studies have demonstrated that Bcl-2 has a direct interaction with the human apurinic/apyrimidinic endonuclease 1 (APE1) as a base excision repair enzyme through its BH domains and gossypol inhibits the repair activity of APE1 [37], 38]. Functional impairment of APE1 in mammalian cells induces apoptosis and inhibits cell proliferation. Considering these findings, our study showed that the racemic form of gossypol had a similar effect as (−)-gossypol. In our previous study, it was shown that (±)-gossypol inhibited cell viability, cell migration, and tube formation of endothelial cells in vitro human umbilical cord endothelial cells (HUVEC) cells [39]. In addition to this, in ovo CAM assay, one of the most widely used tests for studying angiogenesis, results presented that (±)-gossypol has a dose-dependent anti-angiogenic effect. With this study, our in vitro findings were supported by in vivo.
In our experimental study, solid tumors were successfully created with EAC cells on all mice of the tumor control group (tumor formation was 100 %). Tumor formation was observed as 57.1 % in the positive control (suramin treatment) group. On the other hand, while no tumor formation occurred in the pre-implantation gossypol treatment group, tumor formation was determined as 28.6 % in the post-implantation gossypol treatment group. These findings showed that gossypol, in addition to its tumor suppressive activity, can inhibit pro-angiogenic effects of EAC cells and have a protective effect. Similarly, Xiong et al., (2017) showed that gossypol suppressed the growth of xenograft tumors by 50.6 % in the MCF-7 model and by 53.0 % in the MDA-MB-468 model, relative to the control tumors, and it simultaneously inhibited VEGF production [1].
Regulation of angiogenesis plays a crucial role in the treatment of various diseases. Both pro- and antiangiogenic therapies are grounded in recent advancements in understanding the molecular mechanisms behind blood vessel formation, as well as findings from animal studies [40]. Angiogenesis involves the coordination of various cellular processes, all of which are regulated by a complex network of intracellular signaling pathways, as well as interactions between cells and the extracellular matrix. Most clinical therapies and numerous preclinical investigations focus on VEGF and its related downstream pathways [11], 16]. Among the many angiogenic factors, VEGF-A is crucial factor for initiating and regulating vascular growth and patterning [41]. In particular, the responses of endothelial cells to VEGF are modulated by other receptors and interacting molecules. The interaction between VEGF and matrix proteins is considered significant for the angiogenic switch, which facilitates the transition from hyperplastic to malignant tumor development and alters the vasculature’s susceptibility to specific chemotherapeutic agents. In our study, to investigate the inhibitory impact of (±)-gossypol on angiogenesis, immunohistochemical analysis utilizing anti-VEGF antibodies was performed on tumor sections. The findings revealed that (±)-gossypol markedly reduced VEGF expression and significantly contributes to the inhibition of neovascularization. In the tumor control group, the expression of VEGF was observed to be markedly intense and extensively distributed throughout the tumor tissue. Conversely, in the post-implantation gossypol treatment group, VEGF expression was assessed to be significantly lower in comparison to the control group. In our study, findings from the H&E staining analysis revealed that, in comparison to the tumor control groups, the groups receiving (±)-gossypol treatment showed a decrease in the density and spread of tumor tissue, as well as a reduction in the number of blood vessels. The results of TUNEL staining conducted on tumor tissue sections to assess general apoptotic parameters indicated a higher number of apoptotic cells in the group treated with gossypol post-implantation, in comparison to the tumor control group.
When biochemical and hematological parameters were evaluated on the blood of mice in the experimental groups at the beginning and the end of our study it was observed that indicators (TP, ALB) of general physical conditions for animals in all groups were within reference values presented by Loeb and Quimby (1999) [42] and the general health status of the animals were found to be good. However, AMY levels, which indicate cancer, at the end of the study significantly high in tumor control, positive control and post-implantation gossypol treatment groups compared to levels at the beginning of the study. Also, PLT levels at the end of the study are significantly high in tumor control, positive control and post-implantation gossypol treatment groups compared to levels at the beginning of the study. Monitoring biochemical and hematological values within normal ranges in the pre-implantation gossypol treatment group revealed that (±)-gossypol had a protective effect on cancer and at the same time did not show toxicity on physiological status. Also, (±)-gossypol administered to mice at a dose of 40 mg/kg/day ip for 5 days was well tolerated, showing no significant signs of toxicity such as weight loss greater than 5 % or lethargy.
5 Conclusions
In our study, we demonstrated the effects of (±)-gossypol on EAC and the study has confirmed that (±)-gossypol, when applied in vivo, possesses notable anti-tumoral and anti-angiogenic capabilities. While no tumor formation occurred in the pre-implantation gossypol treatment group, tumor formation was determined as 28.6 % in the post-implantation gossypol treatment group. Immunohistochemical analyses showed (±)-gossypol treatment markedly reduced VEGF expression and significantly contributed to the inhibition of neovascularization on tumor. These findings revealed that (±)-gossypol, in addition to its tumor suppressive activity, can inhibit pro-angiogenic effects of EAC cells and have a protective effect. Anti-VEGF treatments are already widely used in patients; however, recent clinical findings have highlighted significant side effects and off-target impacts, especially during prolonged treatment. By regulating the angiogenic process, phenolic compounds offer potential therapeutic benefits, particularly in preventing or slowing the progression of diseases characterized by pathological angiogenesis [43], 44]. However, the balance between promoting and inhibiting angiogenesis must be carefully controlled, as over-inhibition could impair wound healing or tissue regeneration. Therefore, further studies are essential to understand the precise mechanisms through which phenolic compounds regulate angiogenesis and to develop strategies for their clinical use in angiogenesis-related diseases.
-
Research ethics: The experiment was approved by the Ege University Local Ethical Committee for Animal Experiments (24.02.2012; no. 2012-032). All procedures were carried according to the Ethical guidelines for investigations of experimental pain in conscious animals (Zimmerman, 1983).
-
Informed consent: Not applicable.
-
Author contributions: GU and CKK performed the experimental study. GY and AY performed histochemical and immunohistochemical analyses. ATK interpreted data. NUKY designed the study, performed the statistical analysis, interpreted data and wrote the manuscript. All authors reviewed the manuscript.
-
Use of Large Language Models, AI and Machine Learning Tools: None declared.
-
Conflict of interest: On behalf of all authors, the corresponding author states that there is no conflict of interest.
-
Research funding: This study was supported by Ege University, Scientific Research Foundation (Project number is 2011-FEN-006).
-
Data availability: The datasets generated during and/or analyzed during the current study are available from the corresponding author on request.
References
1. Xiong, J, Li, J, Yang, Q, Wang, J, Su, T, Zhou, S. Gossypol has anti-cancer effects by dual-targeting MDM2 and VEGF in human breast cancer. Breast Cancer Res 2017;19:27. https://doi.org/10.1186/s13058-017-0818-5.Suche in Google Scholar PubMed PubMed Central
2. Wang, Y, Lai, H, Fan, X, Luo, L, Duan, F, Jiang, Z, et al.. Gossypol inhibits non-small cell lung cancer cells proliferation by targeting EGFRL858R/T790M. Front Pharmacol 2018;9:728. https://doi.org/10.3389/fphar.2018.00728.Suche in Google Scholar PubMed PubMed Central
3. Kim, HY, Lee, BI, Jeon, JH, Kim, DK, Kang, S-G, Shim, J-K, et al.. Gossypol suppresses growth of temozolomide-resistant glioblastoma tumor spheres. Biomolecules 2019;9:595. https://doi.org/10.3390/biom9100595.Suche in Google Scholar PubMed PubMed Central
4. Cao, H, Sethumadhavan, K, Cao, F, Wang, TTY. Gossypol decreased cell viability and down-regulated the expression of a number of genes in human colon cancer cells. Sci Rep 2021;11:5922. https://doi.org/10.1038/s41598-021-84970-8.Suche in Google Scholar PubMed PubMed Central
5. Lee, S, Hong, E, Jo, E, Kim, ZH, Yim, KJ, Woo, SH, et al.. Gossypol induces apoptosis of human pancreatic cancer cells via CHOP/endoplasmic reticulum stress signaling pathway. J Microbiol Biotechnol 2022;32:645–56. https://doi.org/10.4014/jmb.2110.10019.Suche in Google Scholar PubMed PubMed Central
6. Liu, ZL, Chen, HH, Zheng, LL, Sun, LP, Shi, L. Angiogenic signaling pathways and anti-angiogenic therapy for cancer. Sig Transduct Target Ther 2023;8:198. https://doi.org/10.1038/s41392-023-01460-1.Suche in Google Scholar PubMed PubMed Central
7. Huang, C, Li, H, Xu, Y, Xu, C, Sun, H, Li, Z, et al.. BICC1 drives pancreatic cancer progression by inducing VEGF-independent angiogenesis. Signal Transduct Target Ther 2023;8:271. https://doi.org/10.1038/s41392-023-01478-5.Suche in Google Scholar PubMed PubMed Central
8. Pang, X, Wu, Y, Wu, Y, Lu, B, Chen, J, Wang, J, et al.. (-)-Gossypol suppresses the growth of human prostate cancer xenografts via modulating VEGF signaling-mediated angiogenesis. Mol Cancer Ther 2011;10:795–805. https://doi.org/10.1158/1535-7163.Suche in Google Scholar
9. Keshmiri-Neghab, H, Goliaei, B. Therapeutic potential of gossypol: an overview. Pharm Biol 2014;52:124–8. https://doi.org/10.3109/13880209.2013.832776.Suche in Google Scholar PubMed
10. Liu, H, Zhang, R, Zhang, D, Zhang, C, Zhang, Z, Fu, X, et al.. Cyclic RGD-decorated liposomal gossypol AT-101 targeting for enhanced antitumor effect. Int J Nanomedicine 2022;17:227–44. https://doi.org/10.2147/IJN.S341824.Suche in Google Scholar PubMed PubMed Central
11. Paunovic, D, Rajkovic, J, Novakovic, R, Grujic-Milanovic, J, Mekky, RH, Popa, D, et al.. The potential roles of gossypol as anticancer agent: advances and future directions. Chin Med 2023;18:163. https://doi.org/10.1186/s13020-023-00869-8.Suche in Google Scholar PubMed PubMed Central
12. Dash, R, Azab, B, Quinn, BA, Shen, X, Wang, XY, Das, SK, et al.. Apogossypol derivative BI-97C1 (sabutoclax) targeting Mcl-1 sensitizes prostate cancer cells to mda-7/IL-24-mediated toxicity. Proc Natl Acad Sci USA 2011;108:8785–90. https://doi.org/10.1073/pnas.1100769108.Suche in Google Scholar PubMed PubMed Central
13. Jin, L, Chen, Y, Mu, X, Lian, Q, Deng, H, Ge, R. Phosphoproteomic analysis of gossypol-induced apoptosis in ovarian cancer cell line. HOC1a. Biomed Res Int 2014;2014:123482. https://doi.org/10.1155/2014/123482.Suche in Google Scholar PubMed PubMed Central
14. Adedokun, KA, Imodoye, SO, Bello, IO, Lanihun, AA, Bello, IO. Chapter 18 - therapeutic potentials of medicinal plants and significance of computational tools in anti-cancer drug discovery. In: Egbuna, C, Rudrapal, M, Tijjani, H, editors. Drug discovery update, phytochemistry, computational tools and databases in drug discovery. Kyiv, Ukraine: Elsevier; 2023:393–455 pp.10.1016/B978-0-323-90593-0.00017-4Suche in Google Scholar
15. Zeng, Y, Ma, J, Xu, L, Wu, D. Natural product gossypol and its derivatives in precision cancer medicine. Curr Med Chem 2019;26:1849–73. https://doi.org/10.2174/0929867324666170523123655.Suche in Google Scholar PubMed
16. Pal, D, Sahu, P, Sethi, G, Wallace, CE, Bishayee, A. Gossypol and its natural derivatives: multitargeted phytochemicals as potential drug candidates for oncologic diseases. Pharmaceutics 2022;14:2624. https://doi.org/10.3390/pharmaceutics14122624.Suche in Google Scholar PubMed PubMed Central
17. Renner, O, Mayer, M, Leischner, C, Burkard, M, Berger, A, Lauer, UM, et al.. Systematic review of gossypol/AT-101 in cancer clinical trials. Pharmaceuticals (Basel) 2022;15:144. https://doi.org/10.3390/ph15020144.Suche in Google Scholar PubMed PubMed Central
18. Gadelha, IC, Fonseca, NB, Oloris, SC, Melo, MM, Soto-Blanco, B. Gossypol toxicity from cottonseed products. Sci World J 2014:231635. https://doi.org/10.1155/2014/231635.Suche in Google Scholar PubMed PubMed Central
19. Bushunow, P, Reidenberg, MM, Wasenko, J, Winfield, J, Lorenzo, B, Lemke, S, et al.. Gossypol treatment of recurrent adult malignant gliomas. J Neuro Oncol 1999;43:79–86.10.1023/A:1006267902186Suche in Google Scholar PubMed
20. Flack, MR, Pyle, RG, Mullen, NM, Lorenzo, B, Wu, YW, Knazek, RA, et al.. Oral gossypol in the treatment of metastatic adrenal cancer. J Clin Endocrinol Metab 1993;76:1019–24. https://doi.org/10.1210/jcem.76.4.8473376.Suche in Google Scholar PubMed
21. Kim, IC, Waller, DP, Fong, HH. Inhibition of LDH-X by gossypol optical isomers. J Andrology 1985;6:344–7. https://doi.org/10.1002/j.1939-4640.1985.tb03290.x.Suche in Google Scholar PubMed
22. Varna, M, Bertheau, P, Legrès, LG. Tumor microenvironment in human tumor xenografted mouse models. J Anal Oncol 2014;3:159–66. https://doi.org/10.6000/1927-7229.2014.03.03.6.Suche in Google Scholar
23. Ireson, CR, Alavijeh, MS, Palmer, AM, Fowler, ER, Jones, HJ. The role of mouse tumour models in the discovery and development of anticancer drugs. Br J Cancer 2019;121:101–8. https://doi.org/10.1038/s41416-019-0495-5.Suche in Google Scholar PubMed PubMed Central
24. Zeng, Z, Wong, CJ, Yang, L, Ouardaoui, N, Li, D, Zhang, W, et al.. TISMO: Syngeneic mouse tumor database to model tumor immunity and immunotherapy response. Nucleic Acids Res 2022;50:D1391–D13https://doi.org/10.1093/nar/gkab804.Suche in Google Scholar PubMed PubMed Central
25. Radulski, DR, Stipp, MC, Galindo, CM, Acco, A. Features and applications of Ehrlich tumor model in cancer studies: a literature review. Transl Breast Cancer Res 2023;4:22. https://doi.org/10.21037/tbcr-23-32.Suche in Google Scholar PubMed PubMed Central
26. Ceylan, D, Aksoy, A, Ertekin, T, Yay, AH, Nisari, M, Karatoprak, GŞ, et al.. The effects of gilaburu (viburnum opulus) juice on experimentally induced Ehrlich ascites tumor in mice. J Cancer Res Ther 2018;14:314–20. https://doi.org/10.4103/0973-1482.181173.Suche in Google Scholar PubMed
27. Sant’Ana, PGDS, Lima, WG, Lopes, GFM, Oliveira, SE, Costa, GAFD, Lima, LARDS, et al.. Ocimum basilicum L. (basil) presents pro-apoptotic activity in an Ehrlich’s experimental tumor murine model. Acta Cir Bras 2024;39:e393924. https://doi.org/10.1590/acb393924.Suche in Google Scholar PubMed PubMed Central
28. Tso, WW. Gossypol inhibits Ehrlich ascites tumor cell proliferation. Cancer Lett 1984;24:257–61. https://doi.org/10.1016/0304-3835(84)90021-1.Suche in Google Scholar PubMed
29. Zimmermann, M. Ethical guidelines for investigations of experimental pain in conscious animals. Pain 1983;16:109–10. https://doi.org/10.1016/0304-3959(83)90201-4.Suche in Google Scholar PubMed
30. Jaganathan, SK, Mondhe, D, Wani, ZA, Pal, HC, Mandal, M. Effect of honey and eugenol on Ehrlich ascites and solid carcinoma. J Biomed Biotechnol 2010:989163. https://doi.org/10.1155/2010/989163.Suche in Google Scholar PubMed PubMed Central
31. Ulukaya, E, Ari, F, Dimas, K, Ikitimur, EI, Guney, E, Yilmaz, VT. Anti-cancer activity of a novel palladium (II) complex on human breast cancer cells in vitro and in vivo. Eur J Med Chem 2011;46:4957–63. https://doi.org/10.1016/j.ejmech.2011.07.055.Suche in Google Scholar PubMed
32. Abdin, AA, Soliman, NA, Saied, EM. Effect of propranolol on IL-10, visfatin, Hsp70, iNOS, TLR2, and survivin in amelioration of tumor progression and survival in solid Ehrlich carcinoma-bearing mice. Pharmacol Rep 2014;66:1114–21. https://doi.org/10.1016/j.pharep.2014.07.010.Suche in Google Scholar PubMed
33. Yigitturk, G, Acara, AC, Erbas, O, Oltulu, F, Yavasoglu, NUK, Uysal, A, et al.. The antioxidant role of agomelatine and gallic acid on oxidative stress in STZ induced type I diabetic rat testes. Biomed Pharmacother 2017;87:240–6. https://doi.org/10.1016/j.biopha.2016.12.102.Suche in Google Scholar PubMed
34. Bolat, D, Oltulu, F, Uysal, A, Kose, T, Gunlusoy, B, Yigitturk, G, et al.. Effects of losartan on experimental varicocele-induced testicular germ cell apoptosis. Andrologia 2016;48:840–6. https://doi.org/10.1111/and.12638.Suche in Google Scholar PubMed
35. Wei, S. Hormone receptors in breast cancer: an update on the uncommon subtypes. Pathol Res Pract 2023;250:154791. https://doi.org/10.1016/j.prp.2023.154791.Suche in Google Scholar PubMed
36. Giannakeas, V. Single hormone receptor–positive breast cancer–signal or noise? JAMA Netw Open 2020;3:e1918176. https://doi.org/10.1001/jamanetworkopen.2019.18176.Suche in Google Scholar PubMed
37. Zhao, J, Gao, F, Zhang, Y, Wei, K, Liu, Y, Deng, X. Bcl2 inhibits a basic site repair by down-regulating APE1 endonuclease activity. J Biol Chem 2008;283:9925–32. https://doi.org/10.1074/jbc.m708345200.Suche in Google Scholar PubMed PubMed Central
38. Qian, C, Li, M, Sui, J, Ren, T, Li, Z, Zhang, L, et al.. Identification of a novel potential antitumor activity of gossypol as an APE1/Ref-1 inhibitor. Drug Des Devel Ther 2014;8:485–96. https://doi.org/10.2147/DDDT.S62963.Suche in Google Scholar PubMed PubMed Central
39. Ulus, G, Koparal, AT, Baysal, K, Yetik Anacak, G, Nü, KY. The anti-angiogenic potential of (±) gossypol in comparison to suramin. Cytotechnology 2018;70:1537–50. https://doi.org/10.1007/s10616-018-0247-z.Suche in Google Scholar PubMed PubMed Central
40. Rust, R, Gantner, C, Schwab, ME. Pro- and antiangiogenic therapies: current status and clinical implications. FASEB J 2019;33:34–48. https://doi.org/10.1096/fj.201800640rr.Suche in Google Scholar PubMed
41. Chen, TT, Luque, A, Lee, S, Anderson, SM, Segura, T, Iruela-Arispe, ML. Anchorage of VEGF to the extracellular matrix conveys differential signaling responses to endothelial cells. J Cell Biol 2010;188:595–609. https://doi.org/10.1083/jcb.200906044.Suche in Google Scholar PubMed PubMed Central
42. Loeb, WF, Quimby, F. The clinical chemistry of laboratory animals, 2nd ed. CRC Press; 1999. https://www.taylorfrancis.com/books/9781420091144.Suche in Google Scholar
43. Azevedo, T, Ferreira, T, Peña-Corona, SI, Cortes, H, Silva-Reis, R, da Costa, RMG, et al.. Natural products-based antiangiogenic agents: new frontiers in cancer therapy. Food Front 2024;5:2423–66. https://doi.org/10.1002/fft2.466.Suche in Google Scholar
44. Marrero, AD, Quesada, AR, Martínez-Poveda, B, Medina, MÁ. Anti-cancer, anti-angiogenic, and anti-atherogenic potential of key phenolic compounds from virgin olive oil. Nutrients 2024;16:1283. https://doi.org/10.3390/nu16091283.Suche in Google Scholar PubMed PubMed Central
© 2025 the author(s), published by De Gruyter, Berlin/Boston
This work is licensed under the Creative Commons Attribution 4.0 International License.