A highly selective and sensitive fluorescent sensor based on a 1,8-naphthalimide with a Schiff base function for Hg2+ in aqueous media
-
Kaiyi Li


Abstract
A new fluorescent sensor, N-allyl-4-[(2-(3-methoxysalicylaldimino)ethylamino]-1,8-naphthalimide (HL), for Hg2+ has been developed where the Schiff base substituent acts as a recognition group. This sensor shows a large Stokes shift of 3535–4042 cm−1 and a general fluorescence quantum yield of 0.05, 249–0.11, 866 in organic solvents of different polarity as expected. It also exhibits highly selective and a sensitive response to Hg2+ (ФHg+HL/ФHL = 2.28) over other metal ions (Na+, K+, Ca2+, Mg2+, Al3+, Pb2+, Fe3+, Ni2+, Zn2+, Cu2+, Ag+, Co2+, Cr3+, Mn2+ and Cd2+) in solution (DMF/Tris-HCl buffer, 1:1, v/v, pH = 7.2). The Hg2+-induced fluorescence enhancement at 526 nm is proportional to the concentration of Hg2+ in the range of 0.5–4.0 µm with a detection limit of 0.18 µm. Based on the fluorescence titration and a Job’s plot analysis, the metal-to-ligand ratio of the complex is 2:1 with a binding constant of 1.56 × 10¹² m−1.
1 Introduction
Mercury is a common toxic heavy metal and a major environmental pollutant [1], [2], [3]. Generally, Hg2+ ions can be found in the effluents from chemical industry and agricultural activities for mining, iron sheet cleaning, leather tanning, electroplating, metal finishing and other industries [4], [5], [6], [7]. Even worse so, they can even be converted into organic derivatives which accumulate in the food chains, making them more dangerous owing to their high affinity for thiol groups in proteins and enzyme [8, 9]. Even exposure to very low concentration levels (5 μg L−1) can also cause serious health problems including damaging of the human heart, kidneys, stomach, and intestines [10], [11], [12], [13], whereas, exposure to high concentration levels (above 200 μg L−1) can cause severe damage of the central nervous, respiratory, gastrointestinal, and immune systems [14], [15], [16], [17]. Thereby, there is a strong appeal for the exploration of reliable and simple techniques for Hg2+ detection, favoring both environmental protection and human health.
Nowadays, fluorescence spectroscopy has become a powerful analytic method for sensing and determining metal ions because of its simplicity and high sensitivity, among which fluorescent sensor technology is believed to be an attractive and easy-to-go detection method owing to its low need for instrumental implementation and sample pretreatment [18], [19], [20], [21], [22], [23], [24], [25]. 1,8-Naphthalimide derivatives with high stability, large Stokes shift, high quantum yield and easily-modified properties have been widely applied in fluorescent sensors for metal cations.
In previous work, a series of fluorescent sensors based on 1,8-naphthalimide units to efficiently detect harmful and polluting anions and cations have been synthesized [26], [27], [28], [29], [30], [31], [32], [33], [34], [35], [36], [37], [38]. Guided by the above results and considerations, herein, a kind of “turn-on” fluorescent sensor HL with a 1,8-naphthalimide moiety as the chromophore and a Schiff base unit as the recognition group for Hg2+ ions detection has been designed, synthesized and characterized. In addition, the photophysical characteristics and the sensor ability of HL for monitoring of Hg2+ ions have been further investigated.
2 Experimental
2.1 Materials and methods
All chemicals and solvents used in the synthesis were obtained from commercial sources and applied without further purification. Dilute hydrochloric acid or sodium hydroxide were used for adjusting pH values. Britton–Robinson buffer was prepared with 40 mm acetic acid, boric acid and phosphoric acid. Tris-HCl buffer (pH = 7.2) was prepared using double distilled water. The metal cation sources, NaNO3, KNO3, CaCl2, MgSO4, AlCl3, Pb(NO3)2, Fe(NO3)3·9H2O, Ni(NO3)2·6H2O, Zn(NO3)2·6H2O, Cu(NO3)2·5H2O, Hg(NO3)2·H2O, AgNO3, Co(NO3)2·6H2O, Cr(NO3)3·9H2O, 50%Mn(NO3)2, Cd(NO3)2·H2O were analytical reagent grade and were dissolved by using double distilled water.
C, H and N elemental analyses were determined using a Carlo Erba 1106 elemental analyzer. 1H NMR spectra and 13C NMR spectra were obtained with a Varian VR300 MHz spectrometer with TMS as internal standard. Electrospray ionization mass spectra (ESI-MS) were obtained on a Bruker micrOTOF-Q system. The IR spectra were recorded in the 4000–400 cm−1 region with a Nicolet FT-VERTEX 70 spectrometer using KBr pellets. Electronic spectra were recorded on a LabTech UV Bluestar spectrophotometer. Fluorescence spectra were recorded with an F-7000 FL spectrophotometer, which had been subjected to absorbance normalization. The pH values were measured with a Delta 320 pH meter. The melting points were measured in a X-4 microscopic melting point apparatus. TLC was performed on silica gel, Fluka F60 254, 20 × 20, 0.2 mm. All the detections were carried out at T = 25 °C.
2.2 Synthesis and characterization of HL
The detailed synthetic procedure of HL is shown in Scheme 1. The intermediate products 1–2 were prepared according to the procedure previously reported [39, 40]. The mixture of N-allyl-4-(2-aminoethyl)amino-1,8-naphthalimide (2) (1 g, 3.4 mmol), 0.77 g (5.1 mmol) 3-methoxysalicylaldehyde and 40 mL of ethanol was heated to 80 °C for 4 h. After the mixture was cooled to room temperature, the precipitate produced was filtered, washed with ethanol and dried to give 1.2 g of final product N-allyl-4-(ethylenediamine-3-methoxysalicylidene)-1,8-naphthalimide Schiff base (HL). The progress of the reaction was monitored by TLC (the TLC eluent being dichloromethane–acetone = 1:1, Rf = 0.5). Yield: 1.2 g, 83%; m. p. 175–176 °C. – IR (KBr pellet, cm−1): ν = 1694(s), 1645(s), 1633(m), 1584(s), 1474(s), 1340(m), 778(m), 668(m) – UV/Vis (DMF): λ = 271, 341, 437 nm – ESI-MS (C25H23N3O4): m/z = 428.28 [M−1]−. – 1H NMR (400 MHz, DMSO-d6): δ = 8.65 (d, 1H, J = 8.4 Hz, Ar-OH), 8.53 (s, 1H, –N=CHAr), 8.42 (d, 1H, J = 7.2 Hz, Ar-H), 8.25 (d, 1H, J = 8.4 Hz, Ar-H), 7.67 (t, 2H, J = 15.6 Hz, Ar-H), 7.01 (d, 1H, J = 8 Hz, Ph-H), 6.96 (d, 2H, J = 7.6 Hz, Ph-H), 6.91 (d, 1H, J = 8.8 Hz, Ar-H), 6.77 (t, 1H, J = 15.6 Hz, Ar-NH), 5.88–5.96 (m, 1H, allyl-H), 5.06–5.11 (m, 2H, allyl-H), 4.62 (d, 2H, J = 4.4 Hz, allyl-CH2), 3.95 (t, 2H, J = 10.8 Hz, NH-CH2), 3.75 (s, 2H, N-CH2), 3.77 (s, 3H, Ph-OCH3) ppm. – 13C NMR (400 MHz, DMSO-d6): δ = 167.06, 163.34, 162.69, 151.67, 150.47, 148.00, 134.10, 133.23, 130.66, 129.37, 128.46, 124.28, 123.12, 121.27, 120.14, 118.29, 117.54, 116.72, 114.77, 107.80, 104.09, 56.14, 55.71, 43.38, 41.24 ppm. – Elemental analysis for C25H23N3O4 (429.48): calcd. C 69.92, H 5.41, N 9.78; found C 69.90, H 5.43, N 9.79% (See Supplemental Figures S1–S3 in the Supporting Information available online).

The synthetic route leading to HL and the structures of the intermediates and of the product.
3 Results and discussion
The designed sensor HL was synthesized by three steps and was characterized by 1HNMR, 13CNMR, UV/Vis, and IR spectroscopy and mass spectrometry, as well as by elemental analysis. The spectral and elemental analysis data are in good agreement with the proposed chemical structures.
3.1 Photophysical characteristics of HL
The ability of HL to emit absorbed light energy is characterized quantitatively by the quantum yield of fluorescence ФF. The fluorescence quantum yield has been calculated according to equation (1) using N-butyl-4-n-butylamino-naphthalimide (ФF = 0.81 in ethanol) as a standard. Herein, Фref is the emission quantum yield of the standard, Aref and Asample represent the absorbance of the standard and the sample at the excited wavelength, respectively, while Sref and Ssample are the integrated emission band areas of the standard and the sample, respectively, and nref and nsample are the solvent refractive indeces of the standard and sample, respectively [41].
The photophysical properties of the substituted 1,8-naphthalimides are known to depend mainly on the polarization of their chromophoric system [42]. Light absorption in this molecule generates a charge transfer interaction between the substituents at C-4 position and the imide carbonyl groups. The photophysical characteristics of HL were investigated in DMF, acetonitrile, tetrahydrofuran and dichloromethane solution. Moreover, the Stokes shift (νA–νF) is an important parameter for fluorescent compounds that indicates the difference in the properties and structure of the fluorophore between the ground state S0, and the first exited state S1. The Stokes shift (cm−1) has been calculated by the equation (2) [43, 44]. The absorption (λA) and fluorescence (λF) maxima, the extinction coefficient (ε), the Stokes shift (νA–νF), and quantum fluorescence yield (ФF) of HL are presented in Table 1.
Photophysical properties of HL in organic solvents with different polarity.
| Solvent | λA (nm) | ε (m−1 cm−1) | λF (nm) | νA–νF (cm−1) | Ф F |
|---|---|---|---|---|---|
| DMF | 437 | 24,885 | 523 | 3762 | 0.05249 |
| Acetonitrile | 429 | 12,541 | 519 | 4042 | 0.09136 |
| Tetrahydrofuran | 425 | 12,618 | 504 | 3688 | 0.10601 |
| Dichloromethane | 422 | 11,338 | 496 | 3535 | 0.11866 |
From the data in Table 1, it can be seen that the fluorescence quantum yield ФF of HL in polar solvents is lower than in non-polar solvents. This fact can be explained by the photoinduced electron transfer process, which is favored in polar solvents while the fluorescence emission is lower [45]. The Stokes shift values for HL under study were in the 3535–4042 cm−1 region. It appears that the Stokes shift values depend on the media, and that they are larger in the case of polar solvents when hydrogen bond formation or dipole-dipole interactions are favored in comparison to non-polar media, which is in a good accordance with other investigations on 1,8-naphthalimide derivatives [46, 47]. HL shows an absorption band with maximum range of about 422–437 nm that is typical for 1,8-naphthalimides substituted in C-4 position with alkylamines. The respective fluorescence maxima appear in the range 496–523 nm. The molar extinction coefficient (ε) of HL under study in the long-wavelength band of the absorption spectra ranges from 11,338 to 24,885 cm−1, meaning that ε is larger in polar solvents. In summary, the polarity of the organic solvents is of great importance for the photophysical properties of HL under study and especially for the quantum fluorescence yield and the Stokes shift.
3.2 Investigation of the pH effect on the sensing performance of HL
As the pH of a system is considered to have a significant influence on the performance of a sensor, the spectroscopic characters of HL were investigated in the pH range 1.81–11.82 (Britton–Robison/DMF buffer, 1:1, v/v). As seen from Figure 1, the fluorescence intensity of HL is relatively stable in the range of pH from 5.72 to 9.15, implying that the performance of HL is actually pH-independent in this range, meaning that the design of the sensor is reasonable. All subsequent experiments were performed in solution at pH 7.2.

Fluorescence behavior of HL in solution (Britton–Robison/DMF buffer, 1:1, v/v) at different pH values (excitation at 430 nm, T = 25 °C).
3.3 Selectivity and interference investigation of HL
High selectivity for a specific analyte in the presence of competing species is another important feature of a sensor. The signaling fluorescence properties of HL (10 µm) in the presence of various metal cations (Na+, K+, Ca2+, Mg2+, Al3+, Pb2+, Fe3+, Ni2+, Zn2+, Cu2+, Hg2+, Ag+, Co2+, Cr3+, Mn2+ and Cd2+) were investigated in solution (DMF/Tris-HCl buffer, 1:1, v/v, pH = 7.2). The fluorescence changes of HL are depicted in Figure 2a. It is found that among the various transition metal ions only Hg2+ causes a significant fluorescence enhancement of HL (ФHg+HL/ФHL = 2.28) with the emission maximum at 526 nm. These results indicate that HL could act as a highly selective fluorescence sensor for Hg2+ in the aqueous medium (pH = 7.2). To validate the higher selectivity of HL for Hg2+ relative to other metal ions, fluorescence competitive experiments of Hg2+ with other metal cations (Na+, K+, Ca2+, Mg2+, Al3+, Pb2+, Fe3+, Ni2+, Zn2+, Cu2+, Ag+, Co2+, Cr3+, Mn2+ and Cd2+) were investigated in solution (DMF/Tris-HCl buffer, 1:1, v/v, pH = 7.2) and their fluorescence intensities were recorded. As shown in Figure 2b, when excited at 430 nm, the fluorescence intensity of other coexisting ions shows a similar pattern to that with only Hg2+, indicating that the HL–Hg2+ system was hardly affected by these coexistent ions. According to the above results, HL is a reliable highly selective sensor for Hg2+ in solution (DMF/Tris-HCl buffer, 1:1, v/v, pH = 7.2) with high binding affinity, suggesting the potential for wider use in practical applications.

(a) Fluorescence spectra of HL (10 μm) in solution (DMF/Tris-HCl buffer, 1:1, v/v, pH = 7.2) towards Na+, K+, Ca2+, Mg2+, Al3+, Pb2+, Fe3+, Ni2+, Zn2+, Cu2+, Hg2+, Ag+, Co2+, Cr3+, Mn2+, and Cd2+ (2 eq) with an excitation at 430 nm. (b) Competitive experiments in the compound HL + Hg2+ system with interfering metal ions at 526 nm.
3.4 Fluorescence titration of HL towards Hg2+
In order to obtain insight into the binding properties of HL (10 µm) with Hg2+, fluorescence titration experiments were carried out at various concentrations of Hg2+ in solution (DMF/Tris-HCl buffer, 1:1, v/v, pH = 7.2) at room temperature (Figure 3a). Upon addition of increasing amounts of Hg2+, the fluorescence intensity of HL gradually increased. When the amount of Hg2+ added was about 5 × 10⁻⁶ m, the fluorescence intensity approached a maximum. As more Hg2+ was titrated, the fluorescence intensity showed negligible changes. No shifts of the emission spectra with increasing Hg2+ concentration was observed, which indicated that there was no integration of the fluorophore and receptor in the excited state. The nonlinear curve fitting of the fluorescence titration gives a 2:1 stoichiometric ratio between HL and Hg2+ (Figure 3b). The association constant is determined by the Benesi-Hildebrand equation [48, 49]:
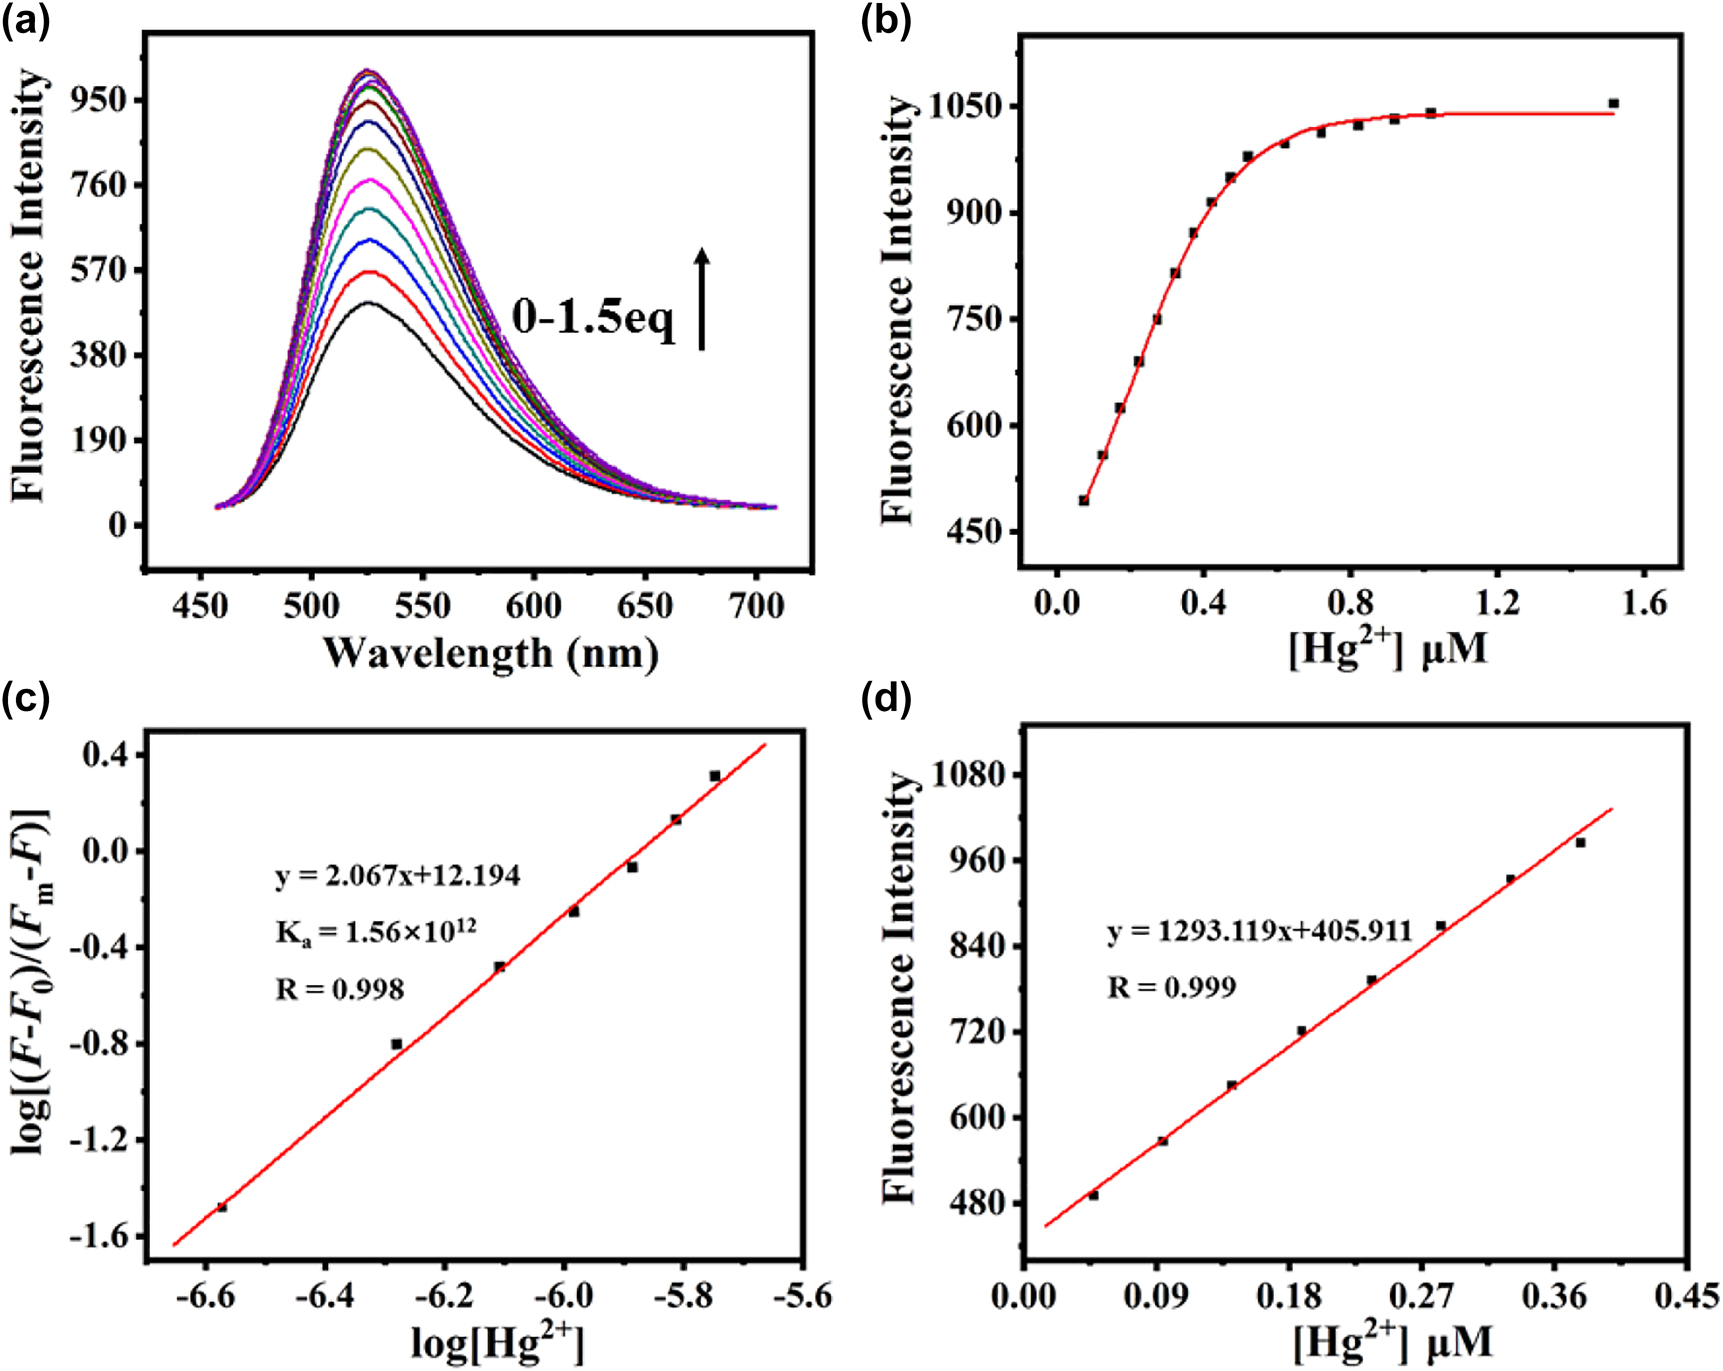
(a) Fluorescence titration spectra of HL with Hg2+ (0–1.5 eq) in solution (DMF/Tris-HCl buffer, 1:1, v/v, pH = 7.2) at room temperature with an excitation at 430 nm. (b) Fitting of the fluorescence titration curve of HL in solution (DMF/Tris-HCl buffer, 1:1, v/v, pH = 7.2). (c) Benesie–Hildebrand linear analysis plots of HL at different Hg2+ concentration. (d) Curve of fluorescence intensity at 526 nm of HL (1 × 10⁻⁵ m) versus increasing concentrations of Hg2+ (0.5–4.0 μm).
Herein, F is the fluorescence intensity at 526 nm at any given Hg2+ concentration, F0 is the fluorescence intensity at 526 nm in the absence of Hg2+, and Fm is the maximum fluorescence intensity at 526 nm in the presence of Hg2+ in solution, and n is the stoichiometric mole ratio, which is 2 in this case. From the fluorescence titration of Hg2+ ion, the association constant for L and Hg2+ has been calculated to be 1.56 × 10¹² m−1 and evaluated graphically by plotting log[(F − F0)/(Fm − F)] against log[Hg2+] (Figure 3c). Figure 3d also displayed the good linearity between the emission at 526 nm and concentrations of Hg2+ in the range from 0.5 to 4 μm, indicating that HL can detect quantitatively relevant concentrations of Hg2+.
The detection limit based on the definition by IUPAC was calculated to be 0.18 µm with the following equation [50]: CDL = 3 σ/k, where σ is the standard deviation of the blank solution, k is the slope of the intensity versus the sample concentration. This value is far below U.S. EPA-regulated limits of 31.5 μm [51] and it confirms the ability of HL to monitor low concentrations of Hg2+ ions commonly encountered in both environmental and physiological systems.
3.5 Mechanism of recognition of HL towards Hg2+
Even though the stoichiometric ratio of 2:1 between HL and Hg2+ was obtained by the above-mentioned fluorescence titration experiment, additional evidence for the exact ratio needed to be provided by the Job’s method. As shown in Figure 4, the concentration of the sensor L and Hg2+ reached a turning point when the molar fraction of [Hg2+]/[L + Hg2+] was about 0.345 at 526 nm, indicating a high binding tendency between HL and Hg2+ with a 2:1 stoichiometry as expected.

Job’s plot at 526 nm for determining the stoichiometry of HL and Hg2+ in solution (DMF/Tris-HCl buffer, 1:1, v/v, pH = 7.2).
Based on the fluorescence titration spectra and the Job’s plot, we propose a possible binding model of HL and Hg2+ as shown in Scheme 2 [52, 53]. The fluorescence enhancement of the HL response to Hg2+ could be attributed to photoinduced electron transfer (PET) [12, 54], [55], [56]. Before binding with Hg2+, the moderate fluorescence intensity of HL is probably due to the lack of a lone pair of electrons with suitable energy at the O-hydroxy Schiff base group, therefore causing sufficient intramolecular photoinduced electron transfer (PET) [57], [58], [59], [60], [61], [62], [63]. However, when HL was bound to Hg2+, the PET process was blocked and the complex was more rigid, thus a significant enhancement of fluorescence was observed.
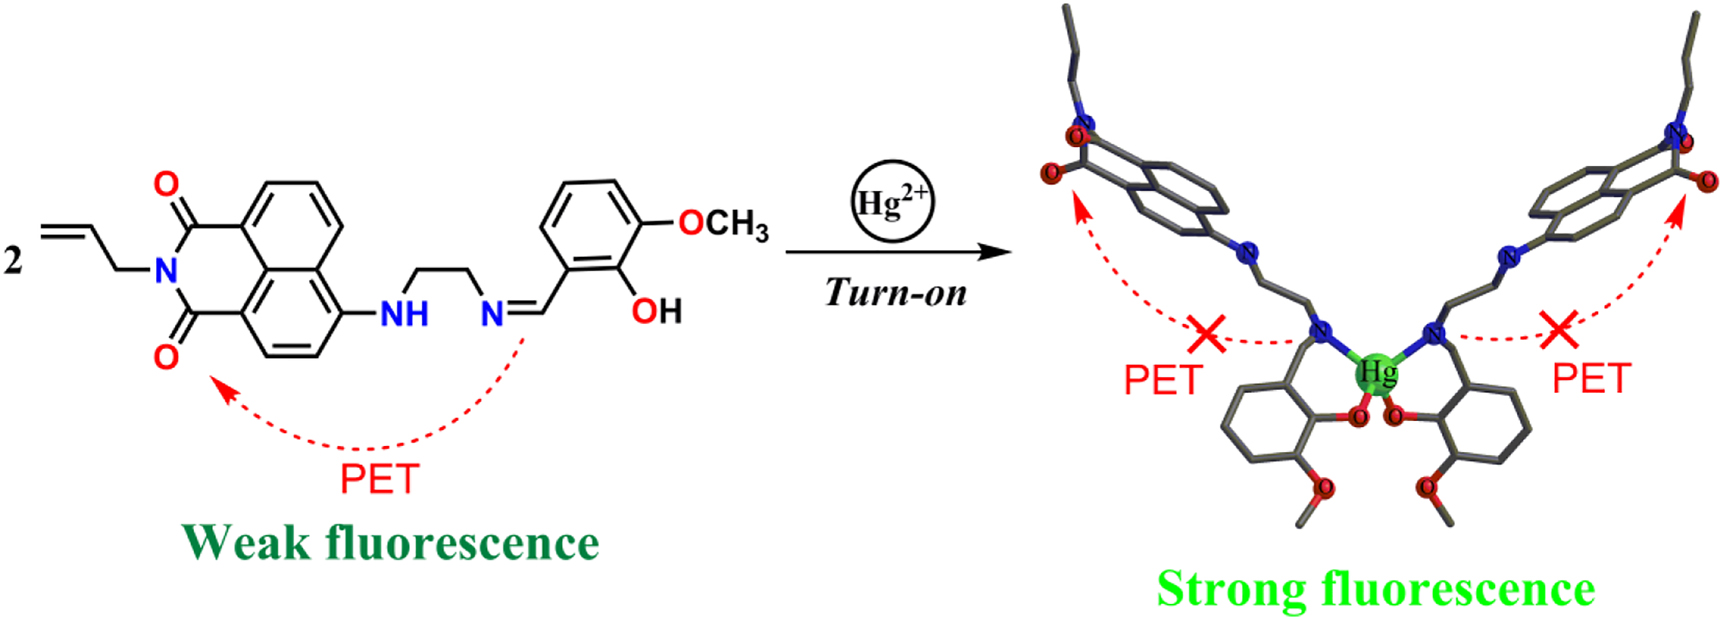
Proposed binding model of HL with Hg2+ to give L2Hg.
4 Conclusions
In summary, a new fluorescence sensor HL was designed and synthesized for highly selective and sensitive detection of the Hg2+ ion which shows significant fluorescence enhancement. HL contains a naphthalimide moiety as fluorophore and a Schiff base for Hg2+ ion recognition. HL exhibits a highly selective response to Hg2+ over other metal ions. The binding ratio of the L and Hg2+ complex was determined to be 2:1 according to fluorescence titration and to a Job plot. The detection limit of the sensor HL toward Hg2+ is 0.18 µm, suggesting that this sensor could be useful for quantitatively analysis of low concentration levels of Hg2+ in both environment and biological systems.
5 Supporting information
The 1H NMR, 13C NMR and ESI-MS spectra of HL are given as supplementary material available online (https://doi.org/10.1515/znb-2022-0044).
Funding source: Natural Science Foundation of Gansu Province
Award Identifier / Grant number: 21JR7RA298
-
Author contributions: All the authors have accepted responsibility for the entire content of this submitted manuscript and approved submission.
-
Research funding: The present research was supported by Natural Science Foundation of Gansu Province (Grant No. 21JR7RA298).
-
Conflict of interest statement: The authors declare no conflicts of interest regarding this article.
References
1. Cheng, Z. Q., Foland, K. A. Appl. Geochem. 2005, 20, 353–365; https://doi.org/10.1016/j.apgeochem.2004.09.003.Search in Google Scholar
2. Zahir, F., Rizwi, S. J., Haq, S. K., Khan, R. H. Environ. Toxicol. Pharmacol. 2005, 20, 351–360; https://doi.org/10.1016/j.etap.2005.03.007.Search in Google Scholar PubMed
3. Kern, J. K., Geier, D. A., Audhya, T., King, P. G., Sykes, L. K., Geier, M. R. Acta Neurobiol. Exp. 2012, 72, 113–153.Search in Google Scholar
4. Panthi, G., Park, M. J. Hazard Mater. 2022, 424, 127565; https://doi.org/10.1016/j.jhazmat.2021.127565.Search in Google Scholar PubMed
5. Rullyani, C., Shellaiah, M., Ramesh, M., Lin, H. C., Chu, C. W. Org. Electron. 2019, 69, 275–280; https://doi.org/10.1016/j.orgel.2019.03.015.Search in Google Scholar
6. El-Sherbeeny, A. M., Odom, J. V., Smith, J. E. Cutan. Ocul. Toxicol. 2006, 25, 173–183; https://doi.org/10.1080/15569520600860215.Search in Google Scholar PubMed
7. Rao, P. G., Saritha, B., Rao, T. S. J. Fluoresc. 2019, 29, 353–360; https://doi.org/10.1007/s10895-018-02342-4.Search in Google Scholar PubMed
8. Wang, M., An, X. J., Gao, J. J. Lumin. 2013, 144, 91–97; https://doi.org/10.1016/j.jlumin.2013.06.038.Search in Google Scholar
9. Wang, M., Zhao, W., Jia, X. Y., Wei, J., Wang, S. Environ. Sci. Pollut. Res. 2018, 25, 16024–16036; https://doi.org/10.1007/s11356-018-1800-1.Search in Google Scholar PubMed
10. Gunnlaugsson, T., Leonard, J. P., Murray, N. S. Org. Lett. 2004, 6, 1557–1560; https://doi.org/10.1021/ol0498951.Search in Google Scholar PubMed
11. Martínez, R., Espinosa, A., Tárraga, A., Molina, P. Org. Lett. 2005, 7, 5869–5872.10.1021/ol052508iSearch in Google Scholar PubMed
12. Huang, C. B., Li, H. R., Luo, Y. Y., Xu, L. Dalton Trans. 2014, 43, 8102; https://doi.org/10.1039/c4dt00014e.Search in Google Scholar
13. Zhang, L. M., Li, B. Spectrochim. Acta Part A 2009, 74, 1060–1063; https://doi.org/10.1016/j.saa.2009.09.007.Search in Google Scholar
14. Mandal, A. K., Suresh, M., Das, P., Suresh, E., Baidya, M., Ghosh, S. K., Das, A. Org. Lett. 2012, 14, 2980–2983; https://doi.org/10.1021/ol3009733.Search in Google Scholar
15. Das, P., Ghosh, A., Bhatt, H., Das, A. RSC Adv. 2012, 2, 3714; https://doi.org/10.1039/c2ra00788f.Search in Google Scholar
16. Xu, Y. L., Mao, S. S., Peng, H. P., Wang, F., Zhang, H., Aderinto, S. O., Wu, H. L. J. Lumin. 2017, 192, 56–63; https://doi.org/10.1016/j.jlumin.2017.06.023.Search in Google Scholar
17. Niu, C. G., Yang, X., Lin, W. Q., Shen, G. L., Yu, R. Q. Analyst 2002, 127, 512–517; https://doi.org/10.1039/b109126n.Search in Google Scholar
18. Sali, S., Guittonneau, S., Grabchev, I. Polym. Adv. Technol. 2006, 17, 180–185; https://doi.org/10.1002/pat.704.Search in Google Scholar
19. Grabchev, I., Chovelon, J. M. Dyes Pigments 2008, 77, 1–6; https://doi.org/10.1016/j.dyepig.2007.02.012.Search in Google Scholar
20. Poteau, X., Brown, A. I., Brown, R. G., Holmes, C., Matthew, D. Dyes Pigments 2000, 47, 91–105; https://doi.org/10.1016/s0143-7208(00)00067-x.Search in Google Scholar
21. Xu, Z. C., Qian, X. H., Cui, J. N. Org. Lett. 2005, 7, 3029–3032; https://doi.org/10.1021/ol051131d.Search in Google Scholar PubMed
22. Xue, L., Prifti, E., Johnsson, K. J. Am. Chem. Soc. 2016, 138, 5258–5261; https://doi.org/10.1021/jacs.6b03034.Search in Google Scholar
23. Grabchev, I., Qian, X. H., Bojinov, V., Xiao, Y., Zhang, W. Polymer 2002, 43, 5731–5736; https://doi.org/10.1016/s0032-3861(02)00417-2.Search in Google Scholar
24. Tian, H., He, Y. J., Chang, C. P. J. Mater. Chem. 2000, 10, 2049–2055; https://doi.org/10.1039/b000141o.Search in Google Scholar
25. Beck, C., Gong, Y. Y. Sci. Rep. 2019, 9, 15878; https://doi.org/10.1038/s41598-019-52370-8.Search in Google Scholar PubMed PubMed Central
26. Xu, Y. L., Aderinto, S. O., Wu, H. L., Peng, H. P., Zhang, H., Zhang, J. W., Fan, X. Y. Z. Naturforsch. 2017, 72b, 35–41; https://doi.org/10.1515/znb-2016-0138.Search in Google Scholar
27. Wu, H. L., Aderinto, S. O., Xu, Y. L., Zhang, H., Fan, X. Y. J. Appl. Spectrosc. 2017, 84, 25–30; https://doi.org/10.1007/s10812-017-0421-7.Search in Google Scholar
28. Qu, Y., Wang, C., Wu, Y. C., Zhao, K., Wu, H. L. J. Appl. Spectrosc. 2020, 87, 429–436; https://doi.org/10.1007/s10812-020-01018-x.Search in Google Scholar
29. Xu, Y. L., Zhang, H., Shen, K. S., Mao, S. S., Shi, X. K., Wu, H. L. Appl. Organomet. Chem. 2018, 32, 3902; https://doi.org/10.1002/aoc.3902.Search in Google Scholar
30. Zhang, H., Qu, Y., Zhao, K., Wang, C., Wu, Y. C., Wu, H. L. J. Chin. Chem. Soc. 2020, 67, 1062–1069; https://doi.org/10.1002/jccs.201900337.Search in Google Scholar
31. Qu, Y., Wu, Y. C., Wang, C., Zhao, K., Wu, H. L. Z. Naturforsch. 2019, 74b, 665–670; https://doi.org/10.1515/znb-2019-0095.Search in Google Scholar
32. Huang, G. Z., Li, C., Han, X. T., Aderinto, S. O., Shen, K. S., Mao, S. S., Wu, H. L. Luminescence 2018, 33, 660–669; https://doi.org/10.1002/bio.3461.Search in Google Scholar PubMed
33. Shen, K. S., Mao, S. S., Shi, X. K., Wang, F., Xu, Y. L., Aderinto, S. O., Wu, H. L. Luminescence 2018, 33, 54–63; https://doi.org/10.1002/bio.3372.Search in Google Scholar PubMed
34. Li, C., Han, X. T., Mao, S. A., Aderinto, S. O., Shi, X. K., Shen, K. S., Wu, H. L. Color. Technol. 2018, 134, 230–239; https://doi.org/10.1111/cote.12340.Search in Google Scholar
35. Peng, H. P., Shen, K. S., Mao, S. S., Shi, X. K., Xu, Y. L., Aderinto, S. O., Wu, H. L. J. Fluoresc. 2017, 27, 1191–1200; https://doi.org/10.1007/s10895-017-2056-8.Search in Google Scholar PubMed
36. Wang, F., Xu, Y. L., Aderinto, S. O., Peng, H. P., Zhang, H., Wu, H. L. J. Photochem. Photobiol., A 2017, 332, 273–282; https://doi.org/10.1016/j.jphotochem.2016.09.004.Search in Google Scholar
37. Wu, H. L., Peng, H. P., Wang, F., Zhang, H., Chen, C. G., Zhang, J. W., Yang, Z. H. J. Appl. Spectrosc. 2017, 83, 931–937; https://doi.org/10.1007/s10812-017-0386-6.Search in Google Scholar
38. Aderinto, S. O., Zhang, H., Wu, H. L., Chen, C. Y., Zhang, J. W., Peng, H. P., Yang, Z. H., Wang, F. Color. Technol. 2017, 133, 40–49; https://doi.org/10.1111/cote.12250.Search in Google Scholar
39. Bojinov, V. B., Georgiev, N. I., Nikolov, P. S. J. Photochem. Photobiol., A 2008, 197, 281–289; https://doi.org/10.1016/j.jphotochem.2008.01.005.Search in Google Scholar
40. Georgiev, N. I., Bojinov, V. B. J. Lumin. 2012, 132, 2235–2241; https://doi.org/10.1016/j.jlumin.2012.04.023.Search in Google Scholar
41. Roy, S., Gayen, P., Saha, R., Mondal, T. K., Sinha, C. Inorg. Chim. Acta 2014, 410, 202–213; https://doi.org/10.1016/j.ica.2013.10.029.Search in Google Scholar
42. Alamry, K. A., Georgiev, N. I., El-Daly, S. A., Taib, L. A., Bojinov, V. B. J. Lumin. 2015, 158, 50–59; https://doi.org/10.1016/j.jlumin.2014.09.014.Search in Google Scholar
43. Liu, Y. F., Deng, M., Tang, X. S., Zhu, T., Zang, Z. G., Zeng, X. F., Han, S. Sens. Actuators, B 2016, 233, 25–30; https://doi.org/10.1016/j.snb.2016.04.026.Search in Google Scholar
44. Dong, W. K., Ma, J. C., Dong, Y. J., Zhao, L., Zhu, L. C., Sun, Y. X., Zhang, Y. J. Coord. Chem. 2016, 69, 3231–3241; https://doi.org/10.1080/00958972.2016.1231302.Search in Google Scholar
45. Ma, Q. J., Zhang, X. B., Han, Z. X., Huang, B., Jiang, Q., Shen, G. L., Yu, R. Q. Int. J. Environ. Anal. Chem. 2011, 91, 74–86; https://doi.org/10.1080/03067310903045448.Search in Google Scholar
46. Shen, W., Yan, L. Q., Tian, W. W., Cui, X., Qi, Z. J., Sun, Y. M. J. Lumin. 2016, 177, 299–305; https://doi.org/10.1016/j.jlumin.2016.04.048.Search in Google Scholar
47. Li, C. Y., Zhang, X. B., Qiao, L., Zhao, Y., He, C. M., Huan, S. Y., Lu, L. M., Jian, L. X., Shen, G. L., Yu, R. Q. Anal. Chem. 2009, 81, 9993–10001; https://doi.org/10.1021/ac9018445.Search in Google Scholar PubMed
48. Liu, M., Dong, L. N., Chen, A., Zheng, Y., Sun, D. Z., Wang, X., Wang, B. Q. Spectrochim. Acta Part A 2013, 115, 854–860; https://doi.org/10.1016/j.saa.2013.07.008.Search in Google Scholar PubMed
49. Chen, Z. J., Wang, L. M., Zou, G., Cao, X. M., Wu, Y., Hu, P. Spectrochim. Acta Part A 2013, 114, 323–329; https://doi.org/10.1016/j.saa.2013.05.072.Search in Google Scholar PubMed
50. Zhao, L. Y., Wang, G. K., Chen, J. H., Zhang, L. M., Liu, B., Zhang, J. F., Zhao, Q. H., Zhou, Y. J. Fluor. Chem. 2014, 158, 53–59; https://doi.org/10.1016/j.jfluchem.2013.11.002.Search in Google Scholar
51. U.S. EPA. Regulatory Impact Analysis of the Clean Air Mercury Rule. EPA-452/R-05-003; Research Triangle Park: NC, USA, 2005.Search in Google Scholar
52. Chen, Y., Mao, S. S., Shi, X. K., Shen, K. S., Wu, H. L. Z. Anorg. Allg. Chem. 2017, 643, 1182–1190; https://doi.org/10.1002/zaac.201700207.Search in Google Scholar
53. Qu, Y., Wu, Y. C., Wang, C., Zhao, K., Wu, H. L. J. Chem. Res. 2020, 44, 121–127; https://doi.org/10.1177/1747519819886540.Search in Google Scholar
54. Culzoni, M. J., Peña, A. M., Machuca, A., Goicoechea, H. C., Brasca, R., Babiano, R. Talanta 2013, 117, 288–296; https://doi.org/10.1016/j.talanta.2013.09.009.Search in Google Scholar PubMed
55. Tan, H. L., Liu, B. X., Chen, Y. ACS Nano 2012, 6, 10505–10511; https://doi.org/10.1021/nn304469j.Search in Google Scholar PubMed
56. Lee, H., Lee, H.-S., Reibenspies, J. H., Hancock, R. D. Inorg. Chem. 2012, 51, 10904–10915; https://doi.org/10.1021/ic301380w.Search in Google Scholar PubMed
57. Shellaiah, M., Rajan, Y. C., Balu, P., Murugan, A. New J. Chem. 2015, 39, 2523–2531; https://doi.org/10.1039/c4nj02367f.Search in Google Scholar
58. Shen, Y. M., Zhang, Y. Y., Zhang, X. Y., Zhang, C. X., Zhang, L. L., Jin, J. L., Li, H. T., Yao, S. Z. Anal. Methods 2014, 6, 4797–4802; https://doi.org/10.1039/c4ay00729h.Search in Google Scholar
59. Kang, L., Liu, Y. T., Li, N. N., Dang, Q. X., Xing, Z. Y., Li, J. L., Zhang, Y. J. Lumin. 2017, 186, 48–52; https://doi.org/10.1016/j.jlumin.2016.12.056.Search in Google Scholar
60. Su, Q. C., Niu, Q. F., Sun, T., Li, T. D. Tetrahedron Lett. 2016, 57, 4297–4301; https://doi.org/10.1016/j.tetlet.2016.08.031.Search in Google Scholar
61. Chen, Z. J., Wang, L. M., Zou, G., Tang, J., Cai, X. F., Teng, M. S., Chen, L. Spectrochim. Acta Part A 2013, 105, 57–61; https://doi.org/10.1016/j.saa.2012.12.005.Search in Google Scholar PubMed
62. Hettie, K. S., Glass, T. E. Chem. Eur J. 2014, 20, 17488–17499; https://doi.org/10.1002/chem.201403128.Search in Google Scholar PubMed
63. Shen, R. H., Yang, J. J., Luo, H., Wang, B. X., Jiang, Y. L. Tetrahedron 2017, 73, 373–377; https://doi.org/10.1016/j.tet.2016.12.016.Search in Google Scholar
Supplementary Material
The online version of this article offers supplementary material (https://doi.org/10.1515/znb-2022-0044).
© 2022 Walter de Gruyter GmbH, Berlin/Boston
Articles in the same Issue
- Frontmatter
- In this issue
- Research Articles
- Crystal structures of sildenafil compounds with nitrate and di(citrato)zinc counterions
- Synthesis, crystal structure, and properties of three lead(II) complexes based on the 1,10-phenanthroline ligand
- A highly selective and sensitive fluorescent sensor based on a 1,8-naphthalimide with a Schiff base function for Hg2+ in aqueous media
- Co-crystallization of dimethyl N-cyanodithioiminocarbonate and bis[(aqua)-µ2-hydroxy-n-butyldichlorotin(IV)]
- Synthesis of ring-A serjanic acid derivatives and their cytotoxic evaluation through the brine shrimp lethality assay (BSLA)
- Electron density of the 1:2 complex of valinomycin with calcium triflate observed in crystals of the composition (valinomycin)Ca2(OTf)4(THF)5(H2O)4
- Two zinc and cadmium coordination polymers constructed with bis(4-(1H-imidazol-1-yl)phenyl)methanone and naphthalene-1,4-dicarboxylate ligands: synthesis and structural characterization
- Characterization of hydrophilic carbon nanohorns prepared by the arc-in-water method
- Crystal structure determination and characterization of Sm3SiO5F3
- A four-fold three-dimensional zinc(II) coordination polymer based on 4,4′-bis(2-methyl-imidazolyl)biphenyl and 5-sulfoisophthalate ligands: synthesis, structure and properties
- Synthesis, structures, and photophysical properties of two Cu(I) complexes supported by N-heterocyclic carbene and phosphine ligands
- Synthesis of chiral binaphthol-based bishydroxylamines