Ternary transition metal gallides with TiNiSi, ZrBeSi and MgZn2-type structure
-
Lukas Heletta


Abstract
A series of ternary transition metal gallides around the equiatomic composition have been synthesized from the elements by arc-melting and subsequent annealing. The compounds crystallize with site occupancy variants of the hexagonal Laves phase MgZn2, with the hexagonal ZrBeSi or the orthorhombic TiNiSi type. All samples have been characterized on the basis of their lattice parameters, determined by X-ray powder diffraction (Guinier technique). The structures of NbCr1.58Ga0.42 and NbFe1.51Ga0.49 (MgZn2 type, P63/mmc), NbRhGa (ZrBeSi type, P63/mmc), and ScNiGa, ScPtGa and ScAuGa (TiNiSi type, Pnma) were refined from single crystal X-ray diffractometer data. The ScPtGa and ScAuGa crystals showed trilling formation. Mixed site occupancies were only observed in the Laves phases while all other crystals were well ordered. A striking structural motif of NbRhGa is the formation of niobium chains (264 pm Nb–Nb) along the c axis. Several gallides were magnetically characterized. They are Pauli paramagnets. The two crystallographically independent iron sites in the Laves phase TaFeGa could be distinguished in the 57Fe Mössbauer spectrum. The isomer shifts of 0.06(3) (Fe1) and –0.02(3) (Fe2) mm s−1 indicate metallic iron.
1 Introduction
Of the three Laves phase types [1], [2], [3] those with the cubic MgCu2 and the hexagonal MgZn2 type have mainly binary and ternary representatives [4]. The formation of one of these types depends on the valence electron count (VEC). Various studies of Laves phase solid solutions along with detailed electronic structure calculations confirmed these trends [5], [6], [7], [8], [9], [10], [11].
Besides the statistical site occupancies within the solid solutions, the two Laves phase types allow ordering variants. The simplest possibility occurs for the MgZn2 type. In the silicide Mg2Cu3Si [12], coloring of the 2a and 6h sites with silicon, respectively copper atoms leads to superstructure formation without the need for symmetry reduction. This is the key difference with respect to all other Laves phase superstructures. Similar compositions occur for the silicide Mg2Ni3Si [13] and the series of RE2Rh3Ga (RE=Y, La–Nd, Sm, Gd–Er) gallides [14]; however, these phases are derived from the cubic Laves phase MgCu2 and require a rhombohedral distortion in order to enable the 3:1 ordering on the tetrahedral network. A 7:1 ordering variant has been reported for Cd4Cu7As [15]. Ordering is also possible on the magnesium site. MgCu2 shows the MgSnCu4 [16], [17] superstructure variant which is possible in the non-centrosymmetric subgroup F4̅3m, splitting the 8b site into two fourfold sites.
The Pearson data base lists a large number of equiatomic phases for which the MgZn2 structure has been assigned. This is only possible with mixed-occupied sites. During recent studies on the equiatomic gallides REIrGa we observed the phases RE6Ir5Ga7 (RE=Sc, Y, Nd, Sm, Gd–Lu) [18], [19] which are very close in composition, i.e. REIr0.83Ga1.17. Motivated by this new ordering variant we started a more systematic study of ternary transition metal gallides around the equiatomic composition. Herein we report on the synthesis, structure refinements and some physical properties of such hexagonal Laves phases and the equiatomic gallides ScNiGa, ScPtGa, ScAuGa, and NbRhGa which crystallize with different AlB2 superstructures.
2 Experimental
2.1 Synthesis
The ternary gallides listed in Tables 1 and 2 were synthesized directly from the elements by arc-melting. The transition metals (T) were used as ingots, powders, chips, granules or sponge from different suppliers, all with stated purities better than 99.9%. The gallium pieces (Smart Elements) had a metal-based purity of 99.999%. The elements were mixed in the ideal T:T′:X=1:1:1 or 2:3:1 atomic ratios (the powders were cold-pressed to pellets) and were arc-melted under an argon pressure of 700–800 mbar using a home-made water-cooled copper crucible [20]. The argon (Westfalen, 99.998%) was purified over titanium sponge (T=900 K), silica gel, and molecular sieves. The product ingots were turned over and re-melted several times to ensure sample homogeneity. The weight losses after the repeated arc-melting were always smaller than 1%. Most buttons were subsequently sealed in evacuated silica tubes and annealed at T=1073 K for 30 days. At the end of the annealing sequence the samples were quenched in ice water. The polycrystalline samples are all air-stable and show the typical metallic lustre.
Refined lattice parameters (Guinier powder data) of several transition metal gallides with the MgZn2 Laves phase structure (with transition metal gallium mixing), space group P63/mmc.
| Composition | a (pm) | c (pm) | V (nm3) | Reference |
|---|---|---|---|---|
| ScMnGa | 518.2(2) | 849.6(3) | 0.1976 | This work |
| ScMn0.8Ga1.2 | 522 | 852 | 0.2011 | [22] |
| ScFeGa | 504.8(2) | 824.0(3) | 0.1818 | This work |
| ScFe1.37Ga0.63 | 505.3 | 828.7 | 0.1832 | [22] |
| ScCoGa | 513.8(2) | 815.5(4) | 0.1864 | This work |
| ScCo1.13Ga0.87 | 502.1 | 813.7 | 0.1777 | [23] |
| ScNi1.31Ga0.69 | 505.4 | 800.2 | 0.1770 | [23] |
| ScRuGaa | 522.2(2) | 841.1(2) | 0.1986 | This work |
| ScRhGa | 911.6(2) | 822.8(1) | 0.5922 | This work |
| ScIrGaa | 913.6(3) | 818.5(2) | 0.5916 | This work |
| ScIrGab | 913.79(4) | 817.67(4) | 0.5913 | This work |
| Sc6Ir5Ga7 | 911.8(2) | 828.0(1) | 0.5962 | [19] |
| ZrCoGaa | 510.3(3) | 819.3(4) | 0.1848 | This work |
| NbCrGa | 499.3(1) | 822.4(2) | 0.1776 | This work |
| NbCrGa | 497.2 | 822.8 | 0.1762 | [24] |
| NbCr1.5Ga0.5 | 494.5(2) | 822.4(3) | 0.1742 | This work |
| NbMnGa | 499.4(1) | 814.5(2) | 0.1759 | This work |
| NbMn1.5Ga0.5 | 495.3(3) | 807.6(4) | 0.1716 | This work |
| Nb0.9Mn1.8Ga0.3 | 491.7 | 800.2 | 0.1675 | [25] |
| NbFeGaa | 496.9(2) | 807.7(2) | 0.1727 | This work |
| NbFe1.5Ga0.5 | 490.3(2) | 799.3(3) | 0.1664 | This work |
| NbCoGaa | 495.2(1) | 797.9(2) | 0.1694 | This work |
| NbCo1.5Ga0.5 | 487.0(3) | 789.2(3) | 0.1621 | This work |
| NbCo1.5Ga0.5 | 487.0 | 789.3 | 0.1621 | [26] |
| NbNiGa | 494.8(1) | 793.8(1) | 0.1683 | This work |
| NbNi1.5Ga0.5 | 488.5(2) | 791.7(3) | 0.1636 | This work |
| NbNi1.5Ga0.5 | 488.2 | 788.5 | 0.1628 | [26] |
| NbCuGa | 501.3(3) | 807.2(5) | 0.1757 | [27], [28] |
| TaCrGa | 496.3(2) | 821.3(3) | 0.1752 | This work |
| TaCr1.5Ga0.5 | 496.7(1) | 815.1(2) | 0.1742 | This work |
| TaMnGaa | 497.6(1) | 811.8(2) | 0.1741 | This work |
| TaMn1.5Ga0.5 | 496.6(1) | 808.1(2) | 0.1726 | This work |
| TaFeGa | 494.5(3) | 804.0(3) | 0.1703 | This work |
| TaFe1.5Ga0.5 | 488.7(1) | 795.6(2) | 0.1646 | This work |
| TaCoGa | 493.0(3) | 795.0(5) | 0.1673 | This work |
| TaCo1.5Ga0.5 | 486.1(1) | 786.9(2) | 0.1610 | This work |
| TaCo1.5Ga0.5 | 486.0 | 786.1 | 0.1608 | [26] |
| TaNiGa | 493.7(2) | 794.1(2) | 0.1676 | This work |
| TaNi1.5Ga0.5 | 487.3(3) | 789.9(4) | 0.1624 | This work |
| TaNi1.5Ga0.5 | 487.2 | 787.3 | 0.1618 | [26] |
aThese samples were not annealed; bsingle crystal data. Note that the ScRhGa and ScIrGa samples adopt a √3a×√3a×c superstructure variant, space group P63/mcm (Yb6Ir5Ga7 type with small degrees of Rh/Ga respectively Ir/Ga mixing). Standard deviations are given in parentheses.
Refined lattice parameters (Guinier powder data) of several equiatomic transition metal gallides.
| Compound | Type | Space group | a (pm) | b (pm) | c (pm) | V (nm3) | Reference |
|---|---|---|---|---|---|---|---|
| ScNiGa | TiNiSi | Pnma | 631.2(1) | 416.0(1) | 722.8(2) | 0.1898 | This work |
| ScNiGa | KHg2 | Imma | 416.4(1) | 630.6(1) | 723.0(1) | 0.1899 | [29] |
| ScCu0.95Ga1.05 | KHg2 | Imma | 422.9 | 645.0 | 732.5 | 0.1998 | [30] |
| ScPdGa | TiNiSi | Pnma | 628.1(7) | 435.82(7) | 755.20(5) | 0.2067 | [31] |
| ScPtGa | TiNiSi | Pnma | 630.8(2) | 433.4(1) | 751.4(1) | 0.2054 | This work |
| ScPtGa | TiNiSi | Pnma | 645.4(2) | 434.2(1) | 747.9(3) | 0.2096 | [31] |
| ScAuGa | TiNiSi | Pnma | 659.4(2) | 436.40(8) | 756.3(2) | 0.2176 | This work |
| NbRhGa | ZrBeSi | P63/mmc | 444.2(6) | a | 530.6(7) | 0.0907 | This work |
Standard deviations are given in parentheses.
2.2 X-ray image plate data and data collection
The gallide samples were characterized by powder X-ray diffraction after the arc-melting as well as after the annealing sequence using a Guinier camera (Enraf-Nonius FR552 equipped with a Fuji-film image plate system, BAS-1800) equipped with CuKα1 radiation and α-quartz (a=491.30, c=540.46 pm) as an internal standard. The lattice parameters (Tables 1 and 2) were obtained from standard least-squares refinements from the powder data. The experimental patterns were compared to calculated ones to ensure proper indexing [21]. Our data agree with previous literature reports [22], [23], [24], [25], [26], [27], [28], [29], [30], [31]. The discrepancies for ScPtGa are discussed in the crystal chemical section.
Crystal fragments were selected from several of the crushed annealed Laves phase samples as well as from the crushed ingots of ScNiGa, ScPtGa, ScAuGa and NbRhGa. The crystals were glued to quartz fibers using bees wax and their quality for intensity data collection was first checked by Laue photographs on a Buerger camera (white Mo radiation, image plate technique, Fuji-film, BAS-1800). Data sets were collected either on a Stoe StadiVari diffractometer equipped with a Mo micro focus source and a Pilatus detection system or on a Stoe IPDS-II two-circle diffractometer with graphite-monochromatized Mo radiation (λ=71.073 pm). Due to a Gaussian-shaped profile of the micro focus source, scaling was applied along with the numerical absorption correction. All relevant crystallographic data and details of the data collections and evaluations are listed in Tables 3 and 4.
Single crystal data and structure refinements for ScTGa (T=Ni, Pt, Au) and NbRhGa.
| Empirical formula Formula weight, g mol−1 | ScNiGa 173.4 | ScPtGa 309.8 | ScAuGa 311.6 | NbRhGa 265.5 |
| Lattice parameters (single crystal data) | ||||
| a, pm | 631.20(1) | 629.88(5) | 660.92(4) | 444.63(8) |
| b, pm | 416.00(1) | 433.35(4) | 435.21(7) | a |
| c, pm | 722.8(2) | 751.81(6) | 753.56(6) | 527.38(9) |
| Cell volume, nm3 | 0.1898 | 0.2052 | 0.2168 | 0.0903 |
| Space group | Pnma | Pnma | Pnma | P63/mmc |
| Formula units, Z | 4 | 4 | 4 | 2 |
| Calculated density, g cm−3 | 6.07 | 10.03 | 9.55 | 9.77 |
| Crystal size, μm3 | 20×30×50 | 40×60×75 | 20×30×40 | 30×40×40 |
| Diffractometer | IPDS II | IPDS II | StadiVari | IPDS II |
| Radiation | MoKα | MoKα | MoKα | MoKα |
| Transmission min/max | 0.459/0.721 | 0.084/0.118 | 0.047/0.159 | 0.404/0.420 |
| Detector distance, mm | 70 | 70 | 40 | 70 |
| Exposure time, s | 360 | 300 | 30 | 240 |
| Integr. Param. A/B/EMS | 12.7/2.9/0.012 | 12.0/3.0/0.02 | 6.5/–4.0/0.02 | 14.0/–1.0/0.03 |
| Abs. coefficient, mm−1 | 26.8 | 83.7 | 83.4 | 29.5 |
| F(000), e | 320 | 520 | 524 | 234 |
| θ range, deg | 4.3–33.3 | 4.2–33.3 | 4.1–33.5 | 5.3–33.2 |
| hkl range | ±9, ±6, ±11 | ±9, ±6, ±11 | ±10, ±6, ±11 | ±6, ±6, ±8 |
| Total no. reflections | 9313 | 5603 | 9705 | 1461 |
| Independent reflections, Rint | 398/0.0599 | 631/0.0892 | 668/0.0642 | 85/0.0209 |
| Refl. with I ≥ 3 σ(I), Rσ | 344/0.0132 | 536/0.0108 | 527/0.0133 | 64/0.0044 |
| Data/parameters | 398/20 | 631/22 | 668/22 | 85/8 |
| Goodness-of-fit on F2 | 1.84 | 1.71 | 1.63 | 2.17 |
| R1/wR2 for I ≥ 3 σ(I) | 0.0267/0.0566 | 0.0235/0.0499 | 0.0229/0.0574 | 0.0141/0.0629 |
| R1/wR2 for all data | 0.0352/0.0580 | 0.0292/0.0509 | 0.0311/0.0580 | 0.0228/0.0638 |
| Trilling ratio, % | – | 60.6(5):5.2:34.2 | 37.4(13):26.9:35.7 | – |
| Extinction coefficient | 2600(500) | 440(50) | 40(5) | 81(17) |
| Largest diff. peak/hole, e Å−3 | 1.56/–1.20 | 2.32/−2.56 | 2.68/–1.93 | 2.50/–1.67 |
Single crystal data and structure refinements of the hexagonal Laves phases NbCr1.58Ga0.42 and NbFe1.51Ga0.49 at room temperature.
| Empirical formula | NbCr1.58(1)Ga0.42(1) | NbFe1.51(1)Ga0.49(1) | ||
| Formula weight, g mol−1 | 204.4 | 211.3 | ||
| Lattice parameters (single crystal data) | ||||
| a, pm | 494.63(9) | 490.60(4) | ||
| c, pm | 822.4(1) | 799.46(6) | ||
| Cell volume, nm3 | 0.1742 | 0.1666 | ||
| Space group | P63/mmc | P63/mmc | ||
| Formula units, Z | 4 | 4 | ||
| Calculated density, g cm−3 | 7.79 | 8.42 | ||
| Crystal size, μm3 | 20×20×20 | 60×40×20 | ||
| Diffractometer | StadiVari | IPDS II | ||
| Radiation | MoKα | MoKα | ||
| Transmission min/max | 0.528/0.537 | 0.385/0.613 | ||
| Detector distance, mm | 40 | 70 | ||
| Exposure time, s | 20 | 600 | ||
| Integr. Param. A/B/EMS | 7.0/–6.0/0.03 | 13.0/3.0/0.014 | ||
| Abs. coefficient, mm−1 | 22.0 | 26.9 | ||
| F(000), e | 368 | 382 | ||
| θ range, deg | 4.8–31.8 | 4.8–33.4 | ||
| hkl range | ±7, ±7, ±13 | ±7, ±7, ±12 | ||
| Total no. reflections | 1736 | 4078 | ||
| Independent reflections, Rint | 140/0.0220 | 152/0.0535 | ||
| Refl. with I ≥ 3 σ(I), Rσ | 123/0.0073 | 130/0.0048 | ||
| Data/parameters | 140/13 | 152/13 | ||
| Goodness-of-fit on F2 | 0.77 | 1.16 | ||
| R1/wR2 for I ≥ 3 σ(I) | 0.0088/0.0204 | 0.0113/0.0285 | ||
| R1/wR2 for all data | 0.0112/0.0213 | 0.0183/0.0300 | ||
| Extinction coefficient | 109(13) | 1690(130) | ||
| Largest diff. peak/hole, e Å−3 | 0.30/–0.32 | 0.92/−0.90 | ||
2.3 EDX data
The six single crystals studied on the diffractometers were semi-quantitatively analysed by EDX using a Zeiss EVO® MA10 scanning electron microscope which was operated in variable pressure mode (60 Pa). Sc, Nb, Cr, Fe, Ni, Rh, Pt, Au, and GaP were used as internal standards. Several points on each crystal were analysed with a secondary electron detector. The experimentally observed compositions matched the ones obtained from the singe crystal X-ray data within ±3 at-%. The standard deviation accounts for the irregular crystal surfaces (conchoidal fracture). No impurity elements were detected.
2.4 Physical property measurements
The magnetic properties of the gallide samples which were pure on the level of X-ray powder diffraction were measured with the VSM option of a Physical Property Measurement System (QuantumDesign PPMS-9). The susceptibilities were measured with an applied magnetic field of 10 kOe (1 kOe=7.96×10⁴ A m−1) in the temperature range of 3–300 K.
2.5 Mössbauer spectroscopy
The TaFeGa sample was further characterized through its room-temperature 57Fe Mössbauer spectrum using a 57Co/Rh source. The sample was placed in a thin walled PMMA container with an optimized thickness according to Long et al. [32]. The measurement was conducted in usual transmission geometry with a counting time of 1 day. The WinNormos for Igor6 routine [33] was used for fitting the spectrum.
3 Results and discussion
3.1 Structure refinements
The NbCr1.58Ga0.42 and NbFe1.51Ga0.49 data sets show hexagonal lattices with high Laue symmetry, and the systematic extinctions were compatible with space group P63/mmc. The starting atomic parameters were determined with the charge-flip algorithm [34] of SuperFlip [35] and the two structures were refined on F2 with the Jana2006 [36] software package using anisotropic displacement parameters for all atoms. Refinements of the occupancy parameters revealed mixed occupancy for the 2a and 6h sites of both crystals. These occupancies were included as least-squares parameters in the final cycles.
The NbRhGa crystal also showed a hexagonal lattice with high Laue symmetry. The systematic extinctions were compatible with space group P63/mmc; however, the powder pattern already pointed to an AlB2 superstructure. The structure refinement confirmed the ZrBeSi type [37] and all sites were fully occupied within two standard deviations.
The situation is more complex for the equiatomic gallides ScNiGa, ScPtGa and ScAuGa. The Guinier patterns pointed to isotypism with the orthorhombic TiNiSi-type structure [38], space group Pnma. For ScNiGa the structure refinement was straightforward, confirming the fully ordered TiNiSi type, which is an orthorhombically distorted superstructure of the aristotype AlB2 [39], [40]. The symmetry reduction proceeds via three steps of which the first one is the translationengleiche t3 transition to the orthohexagonal setting in space group Cmmm. This t3 transition can induce trilling formation, especially for those orthorhombic cells which have c/b ratios close to √3 (≈1.7321). This is the case for the ScPtGa (c/b=1.735) and ScAuGa (c/b=1.731) crystals and the trilling refinements were conducted with the following matrices:
The resulting domain ratios are listed in Table 3. Refinements of the occupancy parameters in separate least-squares cycles revealed full occupancy within two standard deviations for the three scandium compounds. The final difference Fourier analyses revealed no significant residual electron densities. All positional and displacement parameters and interatomic distances are listed in Tables 5– 7.
Atomic coordinates and isotropic displacement parameters (pm2) of the studied transition metal gallides.
| Atom | Wyckoff position | x | y | z | Ueq |
|---|---|---|---|---|---|
| ScNiGa | |||||
| Sc | 4c | 0.01221(14) | 1/4 | 0.70196(13) | 103(2) |
| Ni | 4c | 0.27573(11) | 1/4 | 0.40361(9) | 111(2) |
| Ga | 4c | 0.18360(9) | 1/4 | 0.07593(7) | 107(2) |
| ScPtGa | |||||
| Sc | 4c | 0.0089(4) | 1/4 | 0.7116(3) | 162(5) |
| Pt | 4c | 0.26635(7) | 1/4 | 0.40840(6) | 153(1) |
| Ga | 4c | 0.19150(17) | 1/4 | 0.07915(17) | 174(3) |
| ScAuGa | |||||
| Sc | 4c | 0.0021(5) | 1/4 | 0.7199(4) | 209(6) |
| Au | 4c | 0.27975(10) | 1/4 | 0.4161(2) | 214(2) |
| Ga | 4c | 0.20852(16) | 1/4 | 0.0852(5) | 225(5) |
| NbRhGa | |||||
| Nb | 2a | 0 | 0 | 0 | 51(4) |
| Rh | 2c | 1/3 | 2/3 | 1/4 | 59(3) |
| Ga | 2d | 1/3 | 2/3 | 3/4 | 62(4) |
| NbCr1.58Ga0.42 | |||||
| Nb | 4f | 1/3 | 2/3 | 0.56328(3) | 131(1) |
| 0.41(1) Cr1/0.59(1) Ga1 | 2a | 0 | 0 | 0 | 135(2) |
| 0.91(1) Cr2/0.09(1) Ga2 | 6h | 0.17196(5) | 2x | 1/4 | 138(1) |
| NbFe1.51Ga0.49 | |||||
| Nb | 4f | 1/3 | 2/3 | 0.56273(4) | 57(1) |
| 0.68(1) Fe1/0.32(1) Ga1 | 2a | 0 | 0 | 0 | 62(2) |
| 0.78(1) Fe2/0.22(1) Ga2 | 6h | 0.17025(6) | 2x | 1/4 | 61(2) |
The isotropic displacement parameter Ueq is defined as Ueq=1/3 (U11+U22+U33). Standard deviations are given in parentheses.
Interatomic distances (pm) in the structures of NbCr1.58Ga0.42 and NbFe1.51Ga0.49.
| NbCr1.58Ga0.42 | NbFe1.51Ga0.49 | ||||||
|---|---|---|---|---|---|---|---|
| Nb: | 3 | Ga1/Cr1 | 290.3 | Nb: | 3 | Ga2/Fe2 | 285.9 |
| 6 | Ga2/Cr2 | 291.1 | 6 | Ga2/Fe2 | 287.4 | ||
| 3 | Ga2/Cr2 | 292.4 | 3 | Ga1/Fe1 | 287.7 | ||
| 3 | Nb | 304.0 | 1 | Nb | 299.4 | ||
| 1 | Nb | 307.1 | 3 | Nb | 300.5 | ||
| Ga1/Cr1: | 6 | Ga2/Cr2 | 252.9 | Ga1/Fe1: | 6 | Ga2/Fe2 | 246.7 |
| 6 | Nb | 290.3 | 6 | Nb | 287.7 | ||
| Ga2/Cr2: | 2 | Ga2/Cr2 | 239.5 | Ga2/Fe2: | 2 | Ga2/Fe2 | 240.0 |
| 2 | Ga1/Cr1 | 252.9 | 2 | Ga1/Fe1 | 246.7 | ||
| 2 | Ga2/Cr2 | 255.2 | 2 | Ga2/Fe2 | 250.6 | ||
| 4 | Nb | 291.1 | 2 | Nb | 285.9 | ||
| 2 | Nb | 292.4 | 4 | Nb | 287.4 | ||
All distances within the first coordination spheres are listed. Standard deviations are all equal or smaller than 0.1 pm.
Interatomic distances (pm) in the structures of ScTGa (T=Ni, Pt, Au) and NbRhGa.
| ScNiGa | ScPtGa | ScAuGa | NbRhGa | ||||||||||||
|---|---|---|---|---|---|---|---|---|---|---|---|---|---|---|---|
| Sc: | 1 | Ni | 272.3 | Sc: | 1 | Pt | 279.7 | Sc: | 1 | Au | 293.4 | Nb: | 2 | Nb | 263.7 |
| 2 | Ni | 286.6 | 2 | Pt | 291.8 | 2 | Ga | 297.2 | 6 | Rh | 288.6 | ||||
| 2 | Ni | 287.1 | 2 | Ga | 296.0 | 2 | Au | 300.0 | 6 | Ga | 288.6 | ||||
| 1 | Ga | 288.7 | 1 | Ga | 296.2 | 1 | Ga | 300.8 | |||||||
| 2 | Ga | 290.4 | 2 | Pt | 298.1 | 2 | Au | 304.2 | |||||||
| 1 | Ga | 291.1 | 1 | Ga | 299.3 | 2 | Ga | 307.0 | |||||||
| 2 | Ga | 297.4 | 2 | Ga | 304.1 | 1 | Ga | 307.2 | |||||||
| 1 | Ni | 321.8 | 2 | Sc | 320.2 | 1 | Au | 311.2 | |||||||
| 2 | Sc | 323.2 | 1 | Pt | 324.0 | 2 | Sc | 333.6 | |||||||
| 2 | Sc | 358.8 | 2 | Sc | 385.1 | 2 | Sc | 396.5 | |||||||
| Ni: | 2 | Ga | 243.8 | Pt: | 1 | Ga | 252.0 | Au: | 2 | Ga | 252.3 | Rh: | 3 | Ga | 256.7 |
| 1 | Ga | 243.9 | 2 | Ga | 253.2 | 1 | Ga | 253.8 | 2 | Ga | 263.7 | ||||
| 1 | Ga | 257.9 | 1 | Ga | 268.0 | 1 | Ga | 283.4 | 6 | Nb | 288.6 | ||||
| 1 | Sc | 272.3 | 1 | Sc | 279.7 | 1 | Sc | 293.4 | |||||||
| 2 | Sc | 286.6 | 2 | Sc | 291.8 | 2 | Sc | 300.0 | |||||||
| 2 | Sc | 287.1 | 2 | Sc | 298.1 | 2 | Sc | 304.2 | |||||||
| 1 | Sc | 321.8 | 1 | Sc | 324.0 | 1 | Sc | 311.2 | |||||||
| Ga: | 2 | Ni | 243.8 | Ga: | 1 | Pt | 252.0 | Ga: | 2 | Au | 252.3 | Ga: | 3 | Rh | 256.7 |
| 1 | Ni | 243.9 | 2 | Pt | 253.2 | 1 | Au | 253.8 | 2 | Rh | 263.7 | ||||
| 1 | Ni | 257.9 | 1 | Pt | 268.0 | 1 | Au | 283.4 | 6 | Nb | 288.6 | ||||
| 1 | Sc | 288.7 | 2 | Sc | 296.0 | 2 | Sc | 297.2 | |||||||
| 2 | Sc | 290.4 | 1 | Sc | 296.2 | 1 | Sc | 300.8 | |||||||
| 1 | Sc | 291.1 | 1 | Sc | 299.3 | 2 | Sc | 307.0 | |||||||
| 2 | Sc | 297.4 | 2 | Sc | 304.1 | 1 | Sc | 307.2 | |||||||
All distances within the first coordination spheres are listed. Standard deviations are all equal or smaller than 0.1 pm.
CCDC 1888747 (NbCr1.58Ga0.42), 1888749 (NbFe1.51Ga0.49), 1888746 (ScNiGa), 1888743 (ScPtGa), 1888741 (ScAuGa) and 1888742 (NbRhGa) contain the supplementary crystallographic data for this paper. These data can be obtained free of charge from The Cambridge Crystallographic Data Centre via www.ccdc.cam.ac.uk/data_request/cif.
3.2 Crystal chemistry
We start the crystal chemical description with the hexagonal Laves phases. Synthesis of several samples with both the 1:1:1 and 1:1.5:0.5 (≡2:3:1) compositions showed the formation of extended solid solutions with transition metal/gallium mixing on the 2a and 6h sites of the tetrahedral network. The differences in the a and c lattice parameters of the 1:1:1 and 1:1.5:0.5 compositions account for the transition metal/gallium mixing.
The situation is different for the scandium compounds ScRhGa and ScIrGa. The Guinier powder patterns of both samples already showed superstructure reflections after the arc-melting, pointing to Rh/Ga respectively Ir/Ga ordering of the Yb6Ir5Ga7 type [18], also observed for Sc6Ir5Ga7 [19]. While the ScRhGa sample was microcrystalline also after several annealing steps, the ScIrGa sample allowed for a selection of small single crystals. Although the data set was of bad quality (and not documented herein), refinement with the structural model of the Yb6Ir5Ga7 type led to a composition Sc6Ir5.99Ga6.01 (close to the starting composition) with 76/24(1)% Ir/Ga mixing on the 12j and 20/80(1)% Ir/Ga mixing on the 4d Wyckoff sites. We can thus assume solid solutions Sc6Rh5±xGa7±x and Sc6Ir5±xGa7±x around the equiatomic compositions.
As an example we present the Guinier powder pattern of the ScRhGa sample in Fig. 1. The strongest superstructure reflections for the √3×√3×c cell are marked in red. Those marked in blue color correspond to a primitive cubic cell with a lattice parameter of 314 pm which is in between the binaries RhGa (300.6 pm) [41] and ScRh (320.6 pm) [42], indicating a solid solution of the three elements on a CsCl cell with some long-range order; thus the primitive reflections. At first sight one might think that the small by-product could be the Heusler phase ScRh2Ga [43]; however its lattice parameter is 619.2 (≡2×309.6 pm) and this is too small with respect to the present phase.
![Fig. 1: Guinier powder pattern of the ScRhGa sample (top) along with calculated patterns assuming the ordered Yb6Ir5Ga7 type (middle) and the MgZn2 subcell with Ir/Ga statistics (bottom). The red dots mark the strongest superstructure reflections, manifesting the Ir/Ga ordering of the Yb6Ir5Ga7 type. Blue circles correspond to a small by-product of a cubic CsCl-type phase with a lattice parameter of 314 pm which is in between the binaries RhGa (300.6 pm) [41] and ScRh (320.6 pm) [42].](/document/doi/10.1515/znb-2019-0002/asset/graphic/j_znb-2019-0002_fig_001.jpg)
Guinier powder pattern of the ScRhGa sample (top) along with calculated patterns assuming the ordered Yb6Ir5Ga7 type (middle) and the MgZn2 subcell with Ir/Ga statistics (bottom). The red dots mark the strongest superstructure reflections, manifesting the Ir/Ga ordering of the Yb6Ir5Ga7 type. Blue circles correspond to a small by-product of a cubic CsCl-type phase with a lattice parameter of 314 pm which is in between the binaries RhGa (300.6 pm) [41] and ScRh (320.6 pm) [42].
Figure 2 shows a projection of the NbCr1.58Ga0.42 and Sc6Ir5.99Ga6.01 structures along the hexagonal axes. Both structures show transition metal/gallium mixing onto the tetrahedral networks; however, with different consequences. To a first approximation, the hexagonal Laves phase structures can be described as hexagonal rod packings of corner- and face-sharing tetrahedra with shorter distances within than between the tetrahedra. The rows in the NbCr1.58Ga0.42 structure show Cr/Ga mixing on both sites, emphasized by blue and red segments. This is different for the Sc6Ir5.99Ga6.01 structure. The √3×√3 superstructure formation leads to a decoupling of the rows. Those extending along 0 0 z consist of fully ordered IrGa3 tetrahedra, while those at 1/3 2/3 z and 2/3 1/3 z show Ir/Ga mixing on both Wyckoff sites. The complete ordering of one type of rows is the reason for superstructure formation (partial long-range order).
![Fig. 2: Projection of the NbCr1.58Ga0.42 (left) and Sc6Ir5.99Ga6.01 (right) structures along the hexagonal axes. Niobium (scandium), chromium (iridium) and gallium atoms are drawn as medium grey, blue and red circles, respectively. The rows of edge- and corner-sharing tetrahedra are emphasized. NbCr1.58Ga0.42 adopts the MgZn2 subcell structure, and Sc6Ir5.99Ga6.01 (~ScIrGa) crystallizes with the Yb6Ir5Ga7 [18] superstructure with some residual Ir/Ga disorder.](/document/doi/10.1515/znb-2019-0002/asset/graphic/j_znb-2019-0002_fig_002.jpg)
Projection of the NbCr1.58Ga0.42 (left) and Sc6Ir5.99Ga6.01 (right) structures along the hexagonal axes. Niobium (scandium), chromium (iridium) and gallium atoms are drawn as medium grey, blue and red circles, respectively. The rows of edge- and corner-sharing tetrahedra are emphasized. NbCr1.58Ga0.42 adopts the MgZn2 subcell structure, and Sc6Ir5.99Ga6.01 (~ScIrGa) crystallizes with the Yb6Ir5Ga7 [18] superstructure with some residual Ir/Ga disorder.
The order (Yb6Ir5Ga7 type)/disorder (MgZn2 type) in the ScIrGa sample plays mainly on the c lattice parameter (Table 1). From the description with the rod packing it is readily evident, that a substitution of the apices of the condensed tetrahedra with an element of different size changes the c parameter: 818.5 pm for the disordered ScIrGa and 828.0 pm for the ordered Sc6Ir5Ga7 sample. This is similar to the observation of Hulliger for an off-stoichiometric sample of composition ScIrGa with a c parameter of 816.25 pm [44].
Herein we have only discussed the relevant crystal chemical features that are relevant for understanding the gallides presented in this work. For the general crystal chemical details of Laves phases we refer to competent review articles ([5], [6], [7], [8], [9], [10], [11], and references cited therein).
Now we turn to the equiatomic phases ScNiGa, ScPtGa, ScAuGa, and NbRhGa and start with the niobium compound. The rhodium and gallium atoms build up planar Rh3Ga3 hexagons with 257 pm Rh–Ga distances. The latter are only slightly longer than the sum of the covalent radii [45] for Rh+Ga of 250 pm and they compare well with the Rh–Ga distance of 260 pm in CsCl-type RhGa [41]. Every other layer of planar Rh3Ga3 hexagons is rotated by 60°, forcing the doubling of the AlB2 subcell in c direction (ZrBeSi-type structure, space group P63/mmc [37]). This way we obtain a sandwich-like coordination for the niobium atoms by two Rh3Ga3 hexagons (Fig. 3). The coordination sphere is completed by additional niobium atoms below and above the hexagons with Nb–Nb distances of 264 pm. This distance corresponds to half the lattice parameter c and is even shorter than the Nb–Nb distance of 285 pm in bcc niobium [46]. We can thus assume substantial Nb–Nb bonding along the c axis and this feature reminds of the NiAs-type intermetallics [1], [2], [3]. Each rhodium and gallium atom has trigonal prismatic niobium coordination. These Nb6 prisms are severely compressed with 444 pm Nb–Nb within the triangular plane and 264 pm Nb–Nb for the rectangular edges, leading to strongly anisotropic Nb–Nb bonding. This structural behavior is similar to the isotyopic aluminides TiAuAl (291 and 441 pm Ti–Ti) [47] and TiPtAl (274 and 440 pm Ti–Ti) [48].
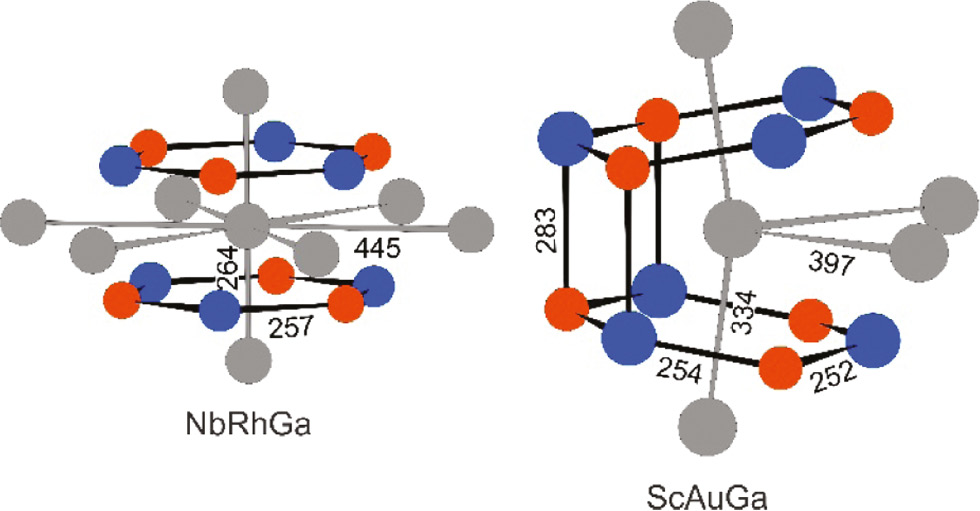
Coordination polyhedra of the niobium and scandium atoms in NbRhGa (left) and ScAuGa (right). Niobium (scandium), rhodium (gold) and gallium atoms are drawn as medium grey, blue and red circles, respectively.
ScNiGa, ScPtGa and ScAuGa crystallize with the well-known TiNiSi-type structure, space group Pnma. The single crystal X-ray data clearly show the primitive reflections that manifest the transition metal/gallium ordering. ScAuGa is reported herein for the first time. Previous work on ScNiGa [30] and ScPtGa [31] was based only on powder X-ray data, and ScNiGa was ascribed to the KHg2 type with Ni/Ga mixing. Since nickel and gallium differ by only three electrons, the weaker superstructure reflections have most likely been overlooked in the previous study. The lattice parameters reported by Dwight compare well with our data (Table 2) and most likely his older sample also had the correct composition and Ni/Ga ordering.
However, a distinct discrepancy occurs for ScPtGa. Our powder (Table 2) and single crystal (Table 3) lattice parameters show excellent agreement and the occupancy parameters (99.8(8)% for the platinum and 100.3(8)% for the gallium site) point to the ideal composition. The large deviations for the a and c parameters and the larger cell volume might indicate a different composition ScPt1±xGa1±x for the sample studied by Hovestreydt et al. [31].
As an example we discuss the structure of ScAuGa. The gold and gallium atoms build up a three-dimensional polyanionic network with strongly distorted tetrahedral gallium coordination around gold and vice versa. The Au–Ga distances (2×252, 1×254 and 1×283 pm) underline this anisotropic bonding situation. The shorter ones indicate substantial covalent Au–Ga bonding. They are even shorter than the sum of the covalent radii [45] for Au+Ga of 259 pm. The shorter Au–Ga distances are within the tilted and slightly puckered Au3Ga3 hexagons (Fig. 3), while the longer ones are interlayer Au–Ga bonds. Similar to NbRhGa discussed above, the scandium atoms in ScAuGa also have such a sandwich-like coordination; however, with orthorhombic distortion. The tilt of the hexagons leads to drastic changes in the Sc–Sc coordinations as compared to Nb–Nb. In ScAuGa we observe 2+2 scandium neighbors (2×334 and 2×397 pm) as compared to the 2+6 Nb–Nb coordination in NbRhGa. The shorter Sc–Sc distances are comparable to those in hcp scandium (6×325 and 6×331 pm) [46], Sc3C4 (314–367 pm) [49], Sc4Pt7Si2 (305–350 pm) [50] and the two modifications of ScPdGa (334–388 pm in LT-ScPdGa and 317–395 pm in HT-ScPdGa) [51]. For more crystal chemical details on the large family of TiNiSi-type intermetallics (>1600 entries in the Pearson data base [4]) we refer to review articles ([2], [39], [40], [52], [53], [54]], and references cited therein).
In parallel we studied the structures of ScCuGa and ScAgGa. They also crystallize with orthorhombically distorted superstructure variants of the aristotype AlB2; however with substantial modulations. These new ordering variants will be reported in a separate publication.
3.3 Magnetic properties
Fourteen of the studied samples were pure on the level of X-ray powder diffraction and their temperature dependence of the magnetic susceptibility was studied at a magnetic flux density of 10 kOe (Fig. 4). All samples show weak positive susceptibility values classifying them as Pauli paramagnets (the Pauli contribution over-compensates the intrinsic diamagnetism). The room temperature susceptibility values are listed in Table 8. While some samples (especially ZrCoGa and NbRhGa) show almost temperature independent susceptibility courses, most others show increases in the low-temperature regimes, pointing to minor amounts of paramagnetic impurities. Such paramagnetic phases have some orders of magnitude higher molar susceptibilities and thus already very small amounts (mostly <<1%) strongly affect the Pauli paramagnetism characteristics of the samples. The largest influence is observed for the TaMnGa sample, where the impurity phase is already evident at T=150 K. Data for the ScNiGa sample are included in Table 8. The susceptibility is higher than that of ScPtGa and ScAuGa, most likely due to paramagnetic nickel at the grain boundaries.
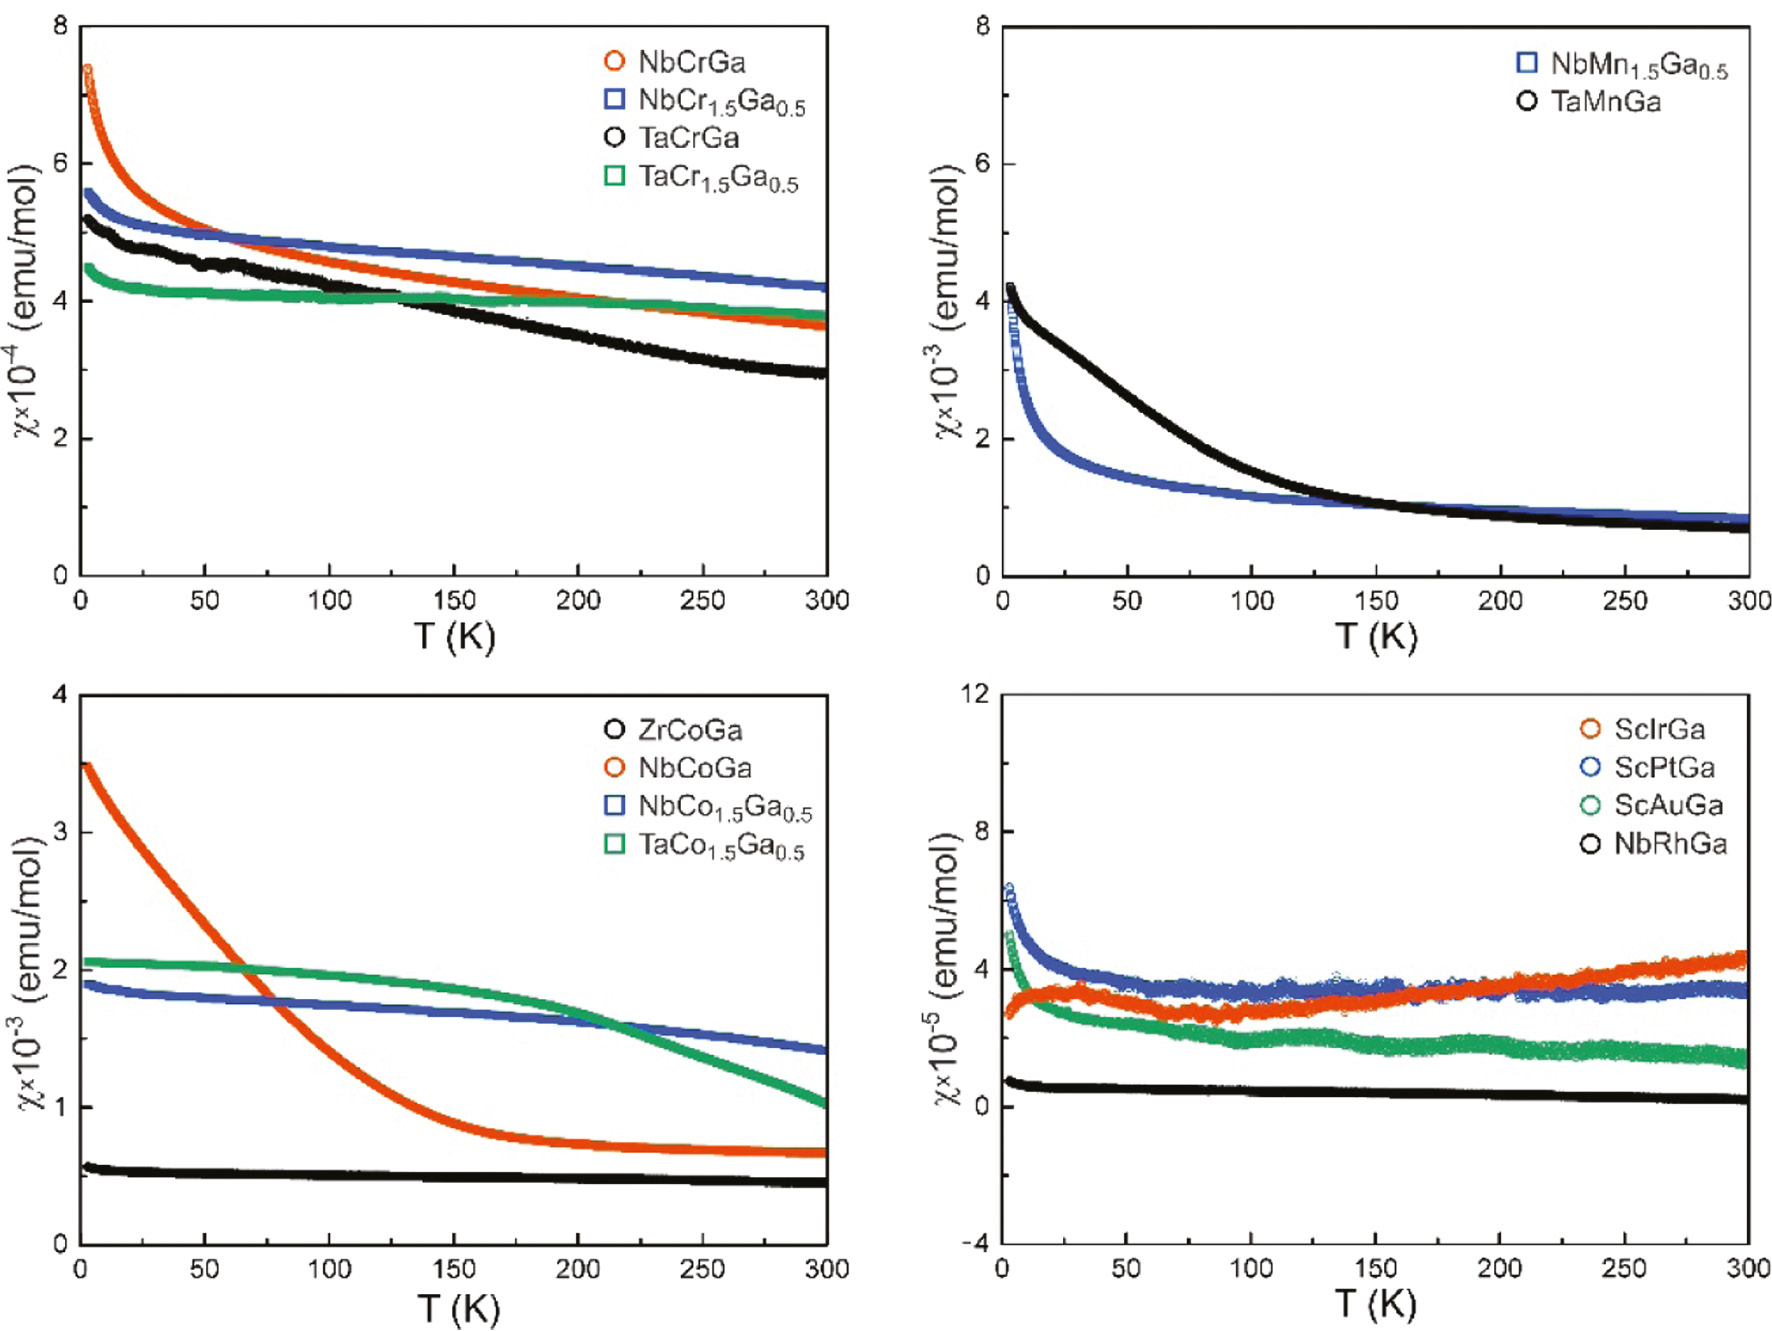
Temperature dependence of the molar susceptibility of diverse ternary transition metal gallide phases (10 kOe data). The room temperature susceptibilities are summarized in Table 8.
Room temperature magnetic susceptibilities measured with a flux density of 10 kOe.
| Compound | χ(300 K) (emu mol–1) |
|---|---|
| ScNiGa | 1.29(2)×10−4 |
| ScIrGa | 4.2(2)×10−5 |
| ScPtGa | 3.3(2)×10−5 |
| ScAuGa | 1.5(2)×10−5 |
| ZrCoGa | 4.50(2)×10−4 |
| NbCrGa | 7.84(2)×10−4 |
| NbCr1.5Ga0.5 | 4.20(2)×10−4 |
| NbMn1.5Ga0.5 | 8.45(2)×10−4 |
| NbCoGa | 6.68(2)×10−4 |
| NbCo1.5Ga0.5 | 1.41(1)×10−3 |
| NbRhGa | 2.1(5)×10−6 |
| TaMnGa | 7.03(2)×10−4 |
| TaCrGa | 2.94(2)×10−4 |
| TaCr1.5Ga0.5 | 3.79(2)×10−4 |
| TaCo1.5Ga0.5 | 1.02(1)×10−3 |
3.4 57Fe Mössbauer spectroscopy
Figure 5 shows the 57Fe Mössbauer spectrum of the TaFeGa sample at room temperature. At first sight one might assume the presence of a single signal; however, this would result in a too large line width parameter. The hexagonal Laves phase TaFeGa contains iron atoms on two crystallographically independent sites, as also observed for the isotypic niobium compound NbFe1.51Ga0.49. We have then reproduced the experimental spectrum with a superposition of two sub-signals: Fe1 with δ=0.06(3) mm s−1, ΔEQ=0.18(4) mm s−1, Γ=0.30 mm s−1, 43% area and Fe2 with δ=–0.02(3) mm s−1, ΔEQ=0.26(3) mm s−1, Γ=0.32(3) mm s−1, 57% area. The line width parameter of Fe1 was fixed to 0.30 mm s−1 in order to avoid correlations.
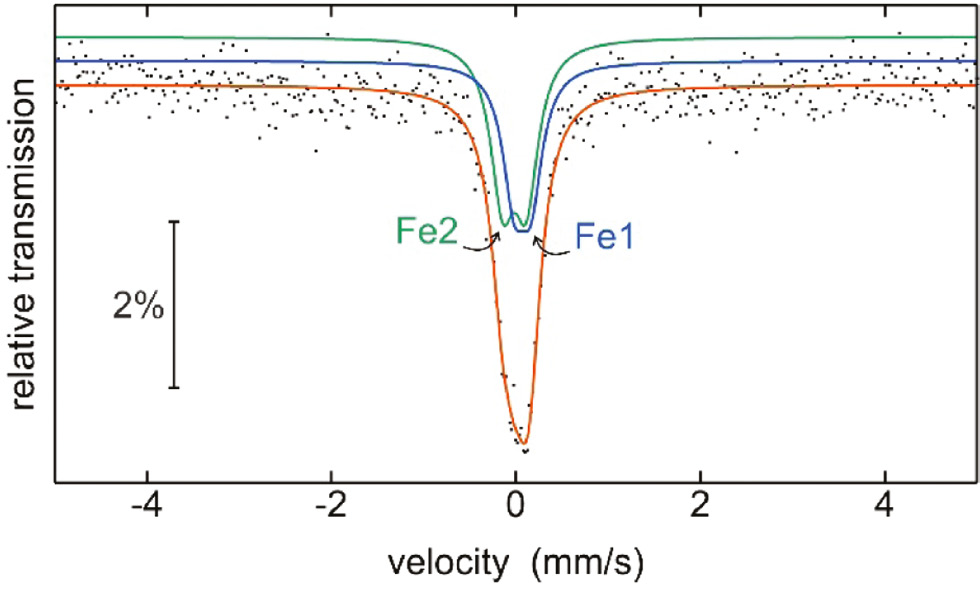
Experimental and simulated 57Fe Mössbauer spectrum of the TaFeGa sample. The subspectra of the two crystallographically independent iron sites are emphasized (blue and green subspectra) and the simulated complete spectrum is drawn in red.
The isomer shift values around 0 mm s−1 show more or less metallic iron. They compare well with the values recently determined for the series of TFeSi and TFeGe (T=Zr, Nb, Hf, Ta) tetrelides [55]. Keeping the areas of the two sub-signals in mind, we can assume occupancies of approximately 86% Fe1/14% Ga1 for the 2a and 38% Fe2/62% Ga2 for the 6h site of our TaFeGe sample. The quadrupole splitting parameters reflect non-cubic site symmetries, 3̅m. for Fe1 and mm2 for Fe2. The lower site symmetry of Fe2 leads to the slightly higher ΔEQ value of 0.26(3) mm s−1.
Acknowledgements
We thank Dr. Rolf-Dieter Hoffmann and Dipl.-Ing. Jutta Kösters for collecting the single-crystal intensity data.
References
[1] R. Ferro, A. Saccone, Intermetallic Chemistry, Elsevier, Amsterdam, 2008.Search in Google Scholar
[2] R. Pöttgen, D. Johrendt, Intermetallics, De Gruyter, Berlin, 2014.10.1524/9783486856187Search in Google Scholar
[3] W. Steurer, J. Dshemuchadse, Intermetallics: Structures, Properties, and Statistics, IUCr Monographs on Crystallography, Vol. 26, Oxford University Press, New York, 2016. ISBN-10: 0198714556.10.1093/acprof:oso/9780198714552.001.0001Search in Google Scholar
[4] P. Villars, K. Cenzual, Pearson’s Crystal Data: Crystal Structure Database for Inorganic Compounds (release 2018/19), ASM International®, Materials Park, Ohio (USA) 2018.Search in Google Scholar
[5] R. L. Johnston, R. Hoffmann, Z. Anorg. Allg. Chem. 1992, 616, 105.10.1002/zaac.19926161017Search in Google Scholar
[6] R. Nesper, G. J. Miller, J. Alloys Compd. 1993, 197, 109.10.1016/0925-8388(93)90628-ZSearch in Google Scholar
[7] A. Von Keitz, G. Sauthoff, Intermetallics2002, 10, 497.10.1016/S0966-9795(02)00025-0Search in Google Scholar
[8] S. Amerioun, S. I. Simak, U. Häussermann, Inorg. Chem. 2003, 42, 1467.10.1021/ic020596mSearch in Google Scholar
[9] F. Stein, M. Palm, G. Sauthoff, Intermetallics2004, 12, 713.10.1016/j.intermet.2004.02.010Search in Google Scholar
[10] A. Ormeci, A. Simon, Yu. Grin, Angew. Chem. Int. Ed. 2010, 49, 8997.10.1002/anie.201001534Search in Google Scholar
[11] S. Thimmaiah, G. J. Miller, Z. Anorg. Allg. Chem. 2015, 641, 1486.10.1002/zaac.201500197Search in Google Scholar
[12] H. Witte, Metallwirtsch. Metallwiss. Metalltech. 1939, 18, 459.10.1093/jn/18.5.459Search in Google Scholar
[13] D. Noréus, L. Eriksson, L. Göthe, P.-E. Werner, J. Less-Common Met. 1985, 107, 345.10.1016/0022-5088(85)90093-1Search in Google Scholar
[14] S. Seidel, O. Janka, C. Benndorf, B. Mausolf, F. Haarmann, H. Eckert, L. Heletta, R. Pöttgen, Z. Naturforsch. 2017, 72b, 289.10.1515/znb-2016-0265Search in Google Scholar
[15] O. Osters, T. Nilges, M. Schöneich, P. Schmidt, J. Rothballer, F. Pielnhofer, R. Weihrich, Inorg. Chem. 2012, 51, 8119.10.1021/ic3005213Search in Google Scholar
[16] E. I. Gladyshevskii, P. I. Krypyakevich, M. Y. Teslyuk, Dopov. Akad. Nauk. SSSR1952, 85, 81.Search in Google Scholar
[17] K. Osamura, Y. Murakami, J. Less-Common Met. 1978, 60, 311.10.1016/0022-5088(78)90185-6Search in Google Scholar
[18] S. Seidel, R. Pöttgen, Z. Anorg. Allg. Chem. 2017, 643, 261.10.1002/zaac.201600422Search in Google Scholar
[19] F. Eustermann, A. Pominov, R. Pöttgen, Z. Anorg. Allg. Chem. 2018, 644, 1297.10.1002/zaac.201800287Search in Google Scholar
[20] R. Pöttgen, T. Gulden, A. Simon, GIT Labor-Fachzeitschrift1999, 43, 133.Search in Google Scholar
[21] K. Yvon, W. Jeitschko, E. Parthé, J. Appl. Crystallogr. 1977, 10, 73.10.1107/S0021889877012898Search in Google Scholar
[22] I. S. Gavrilenko, V. Ya. Markiv, Dopov. Akad. Nauk Ukr. RSR, Ser. A1978, 271.Search in Google Scholar
[23] I. S. Gavrilenko, V. Ya. Markiv, Metallofizika1979, 75, 103.Search in Google Scholar
[24] E. Ganglberger, H. Nowotny, F. Benesovsky, Monatsh. Chem.1965, 96, 1658.10.1007/BF00902104Search in Google Scholar
[25] M. Dryś, J. Less-Common Met.1980, 75, 261.10.1016/0022-5088(80)90123-XSearch in Google Scholar
[26] M. Yu. Teslyuk, V. Ya. Markiv, E. I. Gladyshevskii, J. Struct. Chem.1964, 5, 364.10.1007/BF00748873Search in Google Scholar
[27] V. Ya. Markiv, Y. V. Voroshilov, P. I. Krypyakevych, E. E. Cherkashin, Sov. Phys. Crystallogr.1965, 9, 619.Search in Google Scholar
[28] E. M. Savitskii, Y. V. Efimov, V. Ya. Markiv, A. I. Storozhenko, O. I. Zvolinskii, Russ. Metall.1978, 1, 183.Search in Google Scholar
[29] A. E. Dwight, Proc. Rare Earth Res. Conf. 7th, 1969, 1, 273.Search in Google Scholar
[30] V. Y. Markiv, N. N. Belyavina, I. S. Gavrilenko, Russ. Metall. 1984, 5, 227.Search in Google Scholar
[31] E. Hovestreydt, N. Engel, K. Klepp, B. Chabot, E. Parthé, J. Less-Common Met. 1982, 85, 247.10.1016/0022-5088(82)90075-3Search in Google Scholar
[32] G. J. Long, T. E. Cranshaw, G. Longworth, Mössbauer Eff. Ref. Data J.1983, 6, 42.Search in Google Scholar
[33] R. A. Brand, WinNormos for Igor6 (Version for Igor 6.2 or above: 22.02.2017), Universität Duisburg, Duisburg, Germany, 2017.Search in Google Scholar
[34] L. Palatinus, Acta Crystallogr. B2013, 69, 1.10.1107/S2052519212051366Search in Google Scholar
[35] L. Palatinus, G. Chapuis, J. Appl. Crystallogr.2007, 40, 786.10.1107/S0021889807029238Search in Google Scholar
[36] V. Petříček, M. Dušek, L. Palatinus, Z. Kristallogr.2014, 229, 345.10.1515/zkri-2014-1737Search in Google Scholar
[37] J. W. Nielsen, N. C. Baenziger, Acta Crystallogr.1954, 7, 132.10.1107/S0365110X5400031XSearch in Google Scholar
[38] C. Brink Shoemaker, D. P. Shoemaker, Acta Crystallogr.1965, 18, 900.10.1107/S0365110X65002189Search in Google Scholar
[39] R.-D. Hoffmann, R. Pöttgen, Z. Kristallogr. 2001, 216, 127.10.1524/zkri.216.3.127.20327Search in Google Scholar
[40] R. Pöttgen, Z. Anorg. Allg. Chem. 2014, 640, 869.10.1002/zaac.201400023Search in Google Scholar
[41] V. B. Compton, Acta Crystallogr. 1958, 11, 446.10.1107/S0365110X58001195Search in Google Scholar
[42] B. H. Verbeek, H. W. A. M. Rompa, P. K. Larsen, M. S. Methfessel, F. M. Mueller, Phys. Rev. B1983, 28, 6774.10.1103/PhysRevB.28.6774Search in Google Scholar
[43] L. Heletta, S. Seidel, C. Benndorf, H. Eckert, R. Pöttgen, Z. Naturforsch. 2017, 72b, 609.10.1515/znb-2017-0084Search in Google Scholar
[44] F. Hulliger, J. Alloys Compd. 1996, 239, 131.10.1016/0925-8388(96)02262-1Search in Google Scholar
[45] J. Emsley, The Elements, Oxford University Press, Oxford, 1999.Search in Google Scholar
[46] J. Donohue, The Structures of the Elements, Wiley, New York, 1974.Search in Google Scholar
[47] J. L. Jorda, J. Muller, H. F. Braun, C. Susz, J. Less-Common Met. 1987, 134, 99.10.1016/0022-5088(87)90446-2Search in Google Scholar
[48] X. Yan, A. Grytsiv, P. Rogl, H. Schmidt, G. Giester, A. Saccone, X.-Q. Chen, Intermetallics2009, 17, 336.10.1016/j.intermet.2008.11.006Search in Google Scholar
[49] R. Pöttgen, W. Jeitschko, Inorg. Chem. 1991, 30, 427.10.1021/ic00003a013Search in Google Scholar
[50] T. Harmening, L. van Wüllen, H. Eckert, U. Ch. Rodewald, R. Pöttgen, Z. Anorg. Allg. Chem. 2010, 636, 972.10.1002/zaac.201000003Search in Google Scholar
[51] L. Heletta, S. F. Matar, R. Pöttgen, Z. Naturforsch. 2019, 74b, 15.10.1515/znb-2018-0140Search in Google Scholar
[52] E. Parthé, L. Gelato, B. Chabot, M. Penzo, K. Cenzual, R. Gladyshevskii, TYPIX-Standardized Data and Crystal Chemical Characterization of Inorganic Structure Types, Gmelin Handbook of Inorganic and Organometallic Chemistry, 8th edition, Springer, Berlin (Germany), 1993.10.1007/978-3-662-10641-9Search in Google Scholar
[53] G. Nuspl, K. Polborn, J. Evers, G. A. Landrum, R. Hoffmann, Inorg. Chem. 1996, 35, 6922.10.1021/ic9602557Search in Google Scholar PubMed
[54] M. D. Bojin, R. Hoffmann, Helv. Chim. Acta2003, 86, 1683.10.1002/hlca.200390141Search in Google Scholar
[55] S. Stein, T. Block, S. Klenner, L. Heletta, R. Pöttgen, Z. Naturforsch. 2019, 74b, 211.10.1515/znb-2018-0237Search in Google Scholar
©2019 Walter de Gruyter GmbH, Berlin/Boston
Articles in the same Issue
- Frontmatter
- In this Issue
- Review
- Extended conjugation in stilbenoid squaraines
- Research Articles
- Synthesis, crystal structure and magnetic properties of an octanuclear cerium(III) complex of pyridine-2,6-dicarboxylate
- Synthesis and structural characterization of two coordination polymers constructed by bis(4-(1H-imidazol-1-yl)phenyl)methanone and 5-(tert-butyl)isophthalate ligands
- Syntheses and properties of cyclometalated ruthenium(II) complexes with 1,10-phenanthroline and phenylphthalazine ligands
- Synthesis of novel 1,2,3-triazole-substituted tomentosins
- New antifungal prenylated flavanones from Colutea armata
- Crystal structure of Sc3Co1.64In4 and Sc10Co9In20 from single-crystal data
- Ternary transition metal gallides with TiNiSi, ZrBeSi and MgZn2-type structure