Synthesis and structural characterization of Li3Y(BO3)2
-
Sebastian Bräuchle


Abstract
Li3Y(BO3)2 was prepared by high-temperature solid state synthesis at 900°C in a platinum crucible from lithium carbonate, boric acid, and yttrium(III) oxide. The compound crystallizes monoclinically in the space group P21/c (no. 14) (Z=4) isotypically to Li3Gd(BO3)2. The structure was refined from single-crystal X-ray diffraction data: a=8.616(3), b=6.416(3), c=10.014(2) Å, β=116.6(2)°, V=494.9(3) Å3, R1=0.0211, and wR2=0.0378 for all data. The crystal structure of Li3Y(BO3)2 consists of [Y2O14] dinuclear units, which are interconnected to each other by planar B(1)O3 groups and LiO4 tetrahedra via common edges and corners along the a axis.
1 Introduction
In the past few decades, the synthesis and characterization of new borates have gained more and more interest, because of their interesting physical properties. Often, these compounds exhibit a very high transparency down into the deep UV and a high laser damage threshold. LiB3O5 [1] and β-BaB2O4 [2] are known for their excellent nonlinear-optical behavior. In addition, several rare earth (RE) borates such as YBO3 and GdBO3 [3] doped with Eu3+ found application as red phosphors in plasma display panels.
The ternary systems Li2O–RE2O3–B2O3 (RE=rare earth element) have been intensively studied in the last few years including compounds such as Li3Gd(BO3)2 [4], Li3RE2(BO3)3 [5], Li6RE(BO3)3 [6], LiRE6O5(BO3)3 [7], Li2RE5O4(BO3)3 [8], Na3RE(BO3)2 [9], [10], Na3RE9O3(BO3)8 [11], K3Y3(BO3)4 [12], and K3RE(BO3)2 [13]. In an attempt to synthesize new compounds in the system Li2O–Y2O3–B2O3 using cesium oxide as a flux, we obtained Li3Y(BO3)2, which is isotypic to Li3Gd(BO3)2 [4]. In 2001, Jubera, Gravereau, and Chaminade published the crystal structure of Li3Gd(BO3)2 [4] and also reported the syntheses of Li3RE(BO3)2 (RE=Er, Yb, Lu, and Y). Due to the difficult syntheses of these compounds, the quality of the X-ray powder diffraction patterns was not sufficient to refine the cell parameters of Li3RE(BO3)2 (RE=Er, Yb, Lu, and Y). In this paper, we report the preparation of Li3Y(BO3)2 including a precise structure determination based on single-crystal data.
2 Experimental section
2.1 Synthesis
As mentioned above, our first synthesis was based on the system Li2CO3–Cs2CO3–Y2O3–H3BO3, leading to the new compound Li3Y(BO3)2. In contrast to Jubera et al., we used a non-stoichiometric mixture of Li2CO3 (99.5%, Alfa Aesar, Karlsruhe, Germany), Cs2CO3 (99.99%, ChemPur, Karlsruhe, Germany), Y2O3 (99.99%, ChemPur), and H3BO3 (99.5%, Merck, Darmstadt, Germany) in a molar ratio of 3:3:1:6, which was finely ground in an agate mortar and filled into a platinum FKS 95/5 crucible (feinkornstabilisiert, 95% Pt, 5% Au, Ögussa, Wien, Austria).
The sample was positioned in an electric resistance furnace (Nabertherm muffle furnace), heated up to 900°C at a rate of 90°C h−1 and maintained at that temperature for 24 h. After that period, the temperature was lowered to 500°C at a rate of 2°C h−1 before switching off the furnace. The product cooled down to room temperature by natural rate.
The product Li3Y(BO3)2 was obtained in the form of colorless, air-, and water-resistant crystals. The powder diffraction pattern (Fig. 1) showed the reflections of Li3Y(BO3)2 as the major phase. The reflections marked with an asterisk could not be assigned until now.

Top: experimental powder pattern of Li3Y(BO3)2. The reflections marked with a red asterisk could not be assigned until now. Bottom: theoretical powder pattern of Li3Y(BO3)2 based on single-crystal diffraction data.
2.2 Crystal structure analysis
The powder diffraction pattern of Li3Y(BO3)2 was obtained in transmission geometry from a flat sample of the reaction product, using a Stoe Stadi P powder diffractometer with Ge (111)-monochromatized MoKα1 (λ=70.93 pm) radiation. The comparison of the experimental powder pattern with the theoretical pattern simulated from the single-crystal data (Fig. 1) shows that they match well. However, the experimental powder pattern has many additional reflections which do not belong to Li3Y(BO3)2.
Small single crystals of Li3Y(BO3)2 were isolated by mechanical fragmentation using a polarization microscope. A Bruker D8 Quest Kappa diffractometer with MoKα radiation (λ=71.073 pm) was used to collect the single-crystal intensity data at room temperature. A multi-scan absorption correction (Sadabs-2014 [14]) was applied to the intensity data sets. All relevant details of the data collection and the refinement are listed in Table 1. The monoclinic space group P21/c was derived from the systematic extinctions. The structural refinement was performed with the standardized positional parameters (Platon [15]) of Li3Gd(BO3)2 [4] as starting values (Shelxl-13 [16], [17]). All atoms were refined anisotropically and the final difference Fourier synthesis did not reveal any significant residual peaks. Tables 2–4 list the atomic coordinates, anisotropic displacement parameters, and interatomic distances. Graphical representations of the structure were produced with the program Diamond [18].
Crystal data and structure refinement of Li3Y(BO3)2.
| Empirical formula | Li3Y(BO3)2 |
|---|---|
| Molar mass, g·mol−1 | 227.35 |
| Crystal system | Monoclinic |
| Space group | P21/c (no. 14) |
| Powder data | |
| Powder diffractometer | STOE Stadi P |
| Radiation | MoKα1 (λ=70.93 pm) |
| a, Å | 8.623(4) |
| b, Å | 6.431(4) |
| c, Å | 10.030(4) |
| β, deg | 116.5(3) |
| V, Å3 | 495.10(4) |
| Single crystal data | |
| Single crystal diffractometer | Bruker D8 Quest Kappa |
| Radiation | MoKα (λ=71.073 pm) |
| a, Å | 8.616(3) |
| b, Å | 6.416(3) |
| c, Å | 10.014(3) |
| β, deg | 116.6(2) |
| V, Å3 | 494.93(3) |
| Formula units per cell | 4 |
| Calculated density, g cm−3 | 3.05 |
| Crystal size, mm3 | 0.09×0.09×0.03 |
| Temperature, K | 286(2) |
| Absorption coefficient, mm−1 | 11.7 |
| F(000), e | 424 |
| θ range, deg | 2.6–39.6 |
| Range in hkl | ±15, ±11, ±17 |
| Total no. of reflections | 30018 |
| Independent reflections | 2983 |
| Reflections with I>2σ(I) | 2728 |
| Data/ref. parameters | 2983/110 |
| Absorption correction | Multi-scan |
| Goodness-of-fit on F2 | 1.092 |
| Final R1/wR2 [I>2σ(I)] | 0.0168/0.0367 |
| Final R1/wR2 (all data) | 0.0211/0.0367 |
| Largest diff. peak/hole, e Å−3 | 0.50/−0.65 |
Standard deviations in parentheses.
Atomic coordinates (Wyckoff position 4e for all atoms) and equivalent isotropic displacement parameters Ueq (Å2) of Li3Y(BO3)2.
| Atom | x | y | z | Ueqa |
|---|---|---|---|---|
| Y1 | 0.31899(2) | 0.52818(2) | 0.30185(2) | 0.00463(3) |
| Li1 | 0.1016(3) | 0.7472(4) | 0.4787(3) | 0.0133(4) |
| Li2 | 0.2066(4) | 0.0596(4) | 0.1669(3) | 0.0127(4) |
| Li3 | 0.3343(3) | 0.2816(4) | 0.0386(3) | 0.0101(4) |
| B1 | 0.03929(16) | 0.33830(19) | 0.31936(13) | 0.00594(18) |
| B2 | 0.55479(16) | 0.17240(19) | 0.39155(13) | 0.00539(17) |
| O1 | 0.09371(11) | 0.29391(15) | 0.21139(10) | 0.00804(14) |
| O2 | 0.12236(11) | 0.79002(14) | 0.19485(10) | 0.00833(14) |
| O3 | 0.16192(11) | 0.44162(14) | 0.44562(10) | 0.00714(13) |
| O4 | 0.29442(11) | 0.56227(14) | 0.06163(10) | 0.00649(13) |
| O5 | 0.44468(11) | 0.18007(15) | 0.24002(9) | 0.00886(14) |
| O6 | 0.51100(11) | 0.28952(14) | 0.48425(9) | 0.00678(13) |
Standard deviations in parentheses.
aUeq is defined as one third of the trace of the orthogonalized Uij tensor.
Anisotropic displacement parameters Uij (Å2) of Li3Y(BO3)2.
| Atom | U11 | U22 | U33 | U23 | U13 | U12 |
|---|---|---|---|---|---|---|
| Y1 | 0.00430(5) | 0.00570(5) | 0.00374(5) | 0.00042(3) | 0.00169(3) | − 0.00032(3) |
| Li1 | 0.0111(10) | 0.0145(11) | 0.0108(10) | −0.0001(8) | 0.0018(8) | −0.0004(8) |
| Li2 | 0.0138(10) | 0.0096(10) | 0.0157(11) | −0.0015(8) | 0.0075(9) | −0.0015(8) |
| Li3 | 0.0114(10) | 0.0095(9) | 0.0098(9) | −0.0025(7) | 0.0051(8) | −0.0004(8) |
| B1 | 0.0059(4) | 0.0055(4) | 0.0065(4) | 0.0000(3) | 0.0028(4) | −0.0001(3) |
| B2 | 0.0060(4) | 0.0051(4) | 0.0051(4) | 0.0000(3) | 0.0025(3) | −0.0003(3) |
| O1 | 0.0073(3) | 0.0097(3) | 0.0083(3) | −0.0032(3) | 0.0046(3) | −0.0018(3) |
| O2 | 0.0068(3) | 0.0081(3) | 0.0116(4) | 0.0019(3) | 0.0055(3) | 0.0022(3) |
| O3 | 0.0069(3) | 0.0077(3) | 0.0058(3) | −0.0010(2) | 0.0018(3) | −0.0008(2) |
| O4 | 0.0059(3) | 0.0066(3) | 0.0070(3) | −0.0004(2) | 0.0029(3) | −0.0009(2) |
| O5 | 0.0072(3) | 0.0136(4) | 0.0044(3) | 0.0005(3) | 0.0013(3) | 0.0013(3) |
| O6 | 0.0077(3) | 0.0068(3) | 0.0064(3) | −0.0018(2) | 0.0037(3) | 0.0004(2) |
Standard deviations in parentheses.
Interatomic distances (Å) in Li3Y(BO3)2.
| Li1–O1 | 1.917(3) | Li2–O2 | 1.944(3) | Li3–O4 | 1.867(3) |
| Li1–O4 | 1.926(3) | Li2–O1 | 1.948(3) | Li3–O6 | 1.888(3) |
| Li1–O3 | 2.092(3) | Li2–O5 | 1.999(3) | Li3–O5 | 1.918(3) |
| Li1–O2 | 2.104(3) | Li2–O3 | 2.072(3) | Li3–O3 | 1.971(3) |
| Ø | 2.001 | Ø | 1.991 | Ø | 1.911 |
| B1–O2 | 1.3701(2) | B2–O4 | 1.364(2) | Y1–O2 | 2.284(9) |
| B1–O1 | 1.387(2) | B2–O6 | 1.372(2) | Y1–O1 | 2.296(9) |
| B1–O3 | 1.399(2) | B2–O5 | 1.384(2) | Y1–O6a | 2.300(8) |
| Y1–O4 | 2.329(9) | ||||
| Ø | 1.386 | Ø | 1.373 | Y1–O6b | 2.390(9) |
| Y1–O3 | 2.441(9) | ||||
| Y1–O5a | 2.457(9) | ||||
| Y1–O5b | 2.673(9) | ||||
| Ø | 2.396 |
Standard deviations in parentheses.
Further details of the crystal structure investigation may be obtained from Fachinformationszentrum Karlsruhe, D-76344 Eggenstein-Leopoldshafen, Germany (fax: +49-7247-808-666; e-mail: crysdata@fiz-karlsruhe.de, http://www.fiz-informationsdienste.de/en/DB/icsd/depot_anforderung.html) on quoting the deposition number CSD-432026.
2.3 Vibrational spectra
The transmission FT-IR spectrum of a single crystal of Li3Y(BO3)2 was measured in the spectral range of 600–4000 cm−1 with a Vertex 70 FT-IR spectrometer (spectral resolution 4 cm−1), which is equipped with a KBr beam splitter, an LN-MCT (Mercury Cadmium Telluride) detector, and a Hyperion 3000 microscope (Bruker, Vienna, Austria). A total of 320 scans of the sample were acquired using a Globar (silicon carbide) rod as a mid-IR source and a 15× IR objective as focus. During the measurement, the sample was positioned on a BaF2 window. A correction of atmospheric influences was performed with the software Opus 6.5.
3 Results and discussion
3.1 Crystal structure of Li3Y(BO3)2
The lithium yttrium borate Li3Y(BO3)2 crystallizes isotypically to Li3Gd(BO3)2 [4] in the monoclinic space group P21/c (no. 14). The structure is composed of YO8 polyhedra, which form dinuclear units [Y2O14] by a common edge arranged in the bc plane (Fig. 2). Along the a axis, the [Y2O14] layers are interconnected to each other by planar B(1)O3 groups (Fig. 3). Furthermore, LiO4 tetrahedra, connected via common edges and corners, form chains as shown in Fig. 4. These chains additionally connect the [Y2O14] units as shown in Fig. 5.

Projection of the YO8 polyhedra forming Y2O14 dinuclear units viewed along the a axis.
Connection between the Y2O14 units layers to each other by a planar B(1)O3 group along the a axis.
![Fig. 4: [Li3O6]n chains built up of three edge sharing LiO4 tetrahedra. The chains are connected to each other via vertex sharing.](/document/doi/10.1515/znb-2016-0216/asset/graphic/j_znb-2016-0216_fig_004.jpg)
[Li3O6]n chains built up of three edge sharing LiO4 tetrahedra. The chains are connected to each other via vertex sharing.

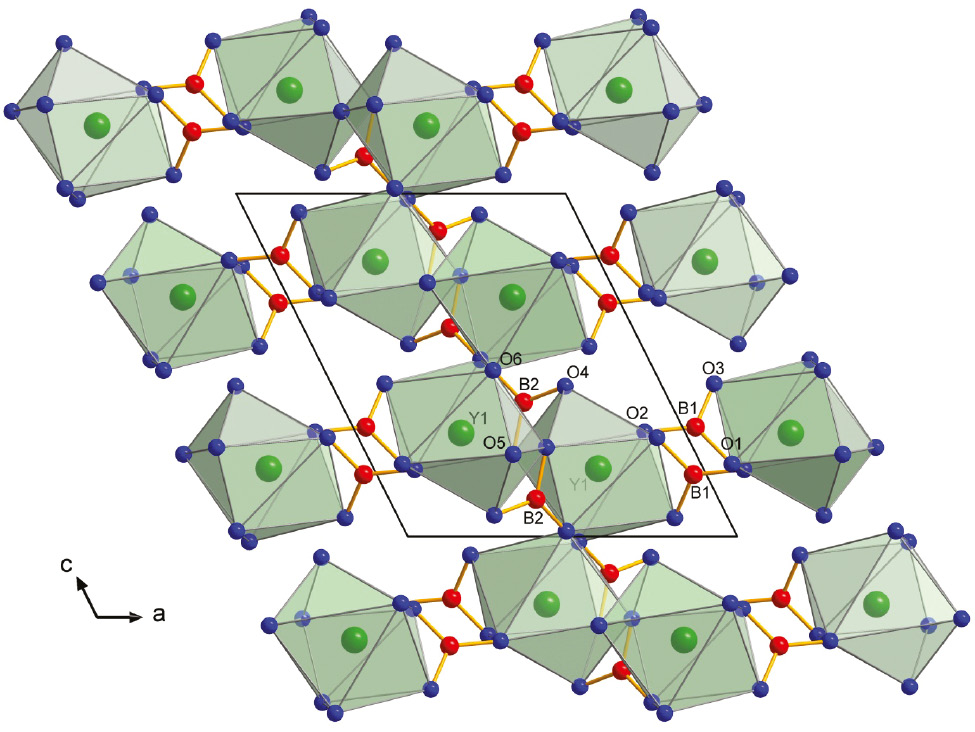
Crystal structure of Li3Y(BO3)2 along the b axis.
The Y atoms are eightfold coordinated by oxygen atoms forming distorted cubic antiprisms. The Y–O distances range from 2.284(9) to 2.673(9) Å with a mean value of 2.396(9) Å. The values correspond to the Y–O distances of Na3Y(BO3)2 with an average value of 2.323 Å [10]. A Y2O14 unit is formed by two YO8 polyhedra sharing a common edge O(6a)–O(6b). These Y2O14 units are connected to four other ones via vertex sharing (O(5a) and O(5b)) (Fig. 2). The structure contains two crystallographically independent B atoms, which are coordinated to three oxygen atoms forming isolated BO3 groups with B–O distances from 1.364(2) to 1.399(2) Å. The average value over the B–O distances is 1.379(4) Å, which fits very well with that of other compounds containing isolated BO3 groups, for example, 1.364(3)–1.397(3) Å for Li3Gd(BO3)2 [4], 1.360–1.399 Å for LiGd6O5(BO3)3 [7], and the literature value of 1.37 Å for compounds containing BO3 groups in general [19]. B(1) shares a corner O(2) and an edge O(1)–O(3) with Y atoms of two consecutive [Y2O14] dimer layers, whereas B(2) shares two edges O(4)–O(5) and O(5)–O(6) with [Y2O14] units (Fig. 3). All three lithium atoms are tetrahedrally coordinated to oxygen atoms with distances between 1.867(3) and 2.104(3) Å. The mean value of all Li–O distances in Li3Y(BO3)2 comes to 1.968(3) Å, fitting perfectly to values of other compounds containing fourfold coordinated Li atoms as found, for example, in Li3Gd(BO3)2 (mean value 1.973 Å) [4]. The average values of the bond angles in the LiO4 tetrahedra are 109.3(1)° for Li(1), 109.2(2)° for Li(2), and 108.5(1)° for Li(3), and fit well to the ideal tetrahedral bonding angle of 109.5°. The three LiO4 tetrahedra are connected to each other by common edges [O(2)–O(3) between Li(1) and Li(2); O(3)–O(5) between Li(2) and Li(3)], and corners [O(1) between Li(1) and Li(2); O(3) and O(4) between Li(1) and Li(2)] building up [Li3O6]n chains along the b axis (Fig. 4). The LiO4 tetrahedra are connected to the BO3 triangles via corner sharing. Tables 4 and 5 list all interatomic distances and important bond angles of Li3Y(BO3)2. Table 6 shows a comparison of the unit cell parameters of Li3Y(BO3)2 and of the isostructural compound Li3Gd(BO3)2 [4].
Bond angles (deg) inside of the LiO4 tetrahedra and BO3 groups in Li3Y(BO3)2.
| O4–Li1–O2 | 88.2(1) | O5–Li2–O3 | 93.5(1) | O6–Li3–O5 | 97.9(1) |
| O3–Li1–O2 | 98.3(1) | O1–Li2–O5 | 98.8(1) | O5–Li3–O3 | 99.4(1) |
| O1–Li1–O3 | 99.2(1) | O2–Li2–O3 | 104.4(1) | O6–Li3–O3 | 102.9(1) |
| O4–Li1–O3 | 115.8(1) | O1–Li2–O3 | 112.0(1) | O4–Li3–O5 | 103.3(1) |
| O1–Li1–O4 | 122.2(1) | O2–Li2–O1 | 113.4(1) | O4–Li3–O6 | 119.1(1) |
| O1–Li1–O2 | 132.2(1) | O2–Li2–O5 | 132.8(2) | O4–Li3–O3 | 128.1(1) |
| Ø | 109.3 | Ø | 109.2 | Ø | 108.5 |
| O1–B1–O3 | 114.8(1) | O4–B2–O6 | 124.0(1) | ||
| O2–B1–O3 | 121.5(1) | O4–B2–O5 | 118.4(1) | ||
| O2–B1–O1 | 123.7(1) | O6–B2–O5 | 117.5(1) | ||
| Ø | 120.0 | Ø | 120.0 |
Standard deviations in parentheses.
Unit cell parameters of Li3Y(BO3)2 and Li3Gd(BO3)2.
| Empirical formula | Li3Y(BO3)2 | Li3Gd(BO3)2 |
|---|---|---|
| Reference | This work | [4] |
| Molar mass, g mol−1 | 647.3 | 504.8(2) |
| Unit cell dimensions | ||
| a, Å | 8.616(3) | 8.724(2) |
| b, Å | 6.416(3) | 6.425(2) |
| c, Å | 10.014(3) | 10.95(2) |
| β, deg | 116.6(2) | 116.85(2) |
| V, Å3 | 494.9(3) | 504.8(2) |
Space group: P21/c (No.14).
Standard deviations in parentheses.
We calculated the bond valence sums for Li3Y(BO3)2 with the bond-length/bond-strength concept (ΣV) [20], [21] and the Chardi concept (charge distribution in solids, ΣQ) [22]. The results of these calculations are listed in Table 7 and correspond well with the expected values of the formal ionic charge of each specific atom.
Charge distribution in Li3Y(BO3)2 calculated with the bond-length/bond-strength (∑V) and the CHARDI (∑Q) concept.
| Li1 | Li2 | Li3 | Y | B1 | B2 | |
|---|---|---|---|---|---|---|
| ∑V | 0.95 | 0.98 | 1.20 | 2.99 | 2.89 | 2.98 |
| ∑Q | 0.99 | 1.02 | 1.01 | 2.97 | 3.04 | 2.97 |
| O1 | O2 | O3 | O4 | O5 | O6 | |
| ∑V | − 1.99 | −1.94 | −1.88 | −2.07 | −1.97 | −2.14 |
| ∑Q | −2.07 | −2.01 | −1.84 | −2.08 | −1.88 | −2.12 |
Maple values (Madelung Part of Lattice Energy) [23], [24], [25] of Li3Y(BO3)2 were compared with those received from the summation of the data for the starting compounds Li2O [26], Y2O3 [27], and B2O3 [28]. A value of 8319.1 kcal mol−1 was obtained in comparison with 8318.1 kcal mol−1 (deviation=0.01%) calculated starting from the binary oxides [1½ Li2O (1255.2 kcal mol−1)+½ Y2O3 (1825.1 kcal mol−1)+1 B2O3 (5237.5 kcal mol−1)].
3.2 IR spectroscopy
Figure 6 displays the result of the IR spectroscopic measurement, which was performed on a single crystal of Li3Y(BO3)2. The spectrum shows a series of different absorption bands with frequencies below 1500 cm−1, from 2100 to 2650 cm−1, and from 2800 to 3000 cm−1. The assignments of the vibrational modes are based on a comparison with the experimental data of borates containing trigonal [BO3]3− groups [29], [30], [31], [32], [33]. The two absorption bands between 600 and 800 cm−1 could be assigned as BO3 deformation and out-of-plane bending. The bands at 900–965 cm−1 belong to the B–O symmetric stretching vibrations. The region between 1150 and 1450 cm−1 can be related to the anti-symmetric B–O stretching vibrations. Interestingly, several unusual absorption bands were observed in the range of 2100–2650 cm−1, which can be interpreted as combination and overtone bands of the BO3 groups according to Mak et al. [33]. The absorption bands between 2800 and 3000 cm−1 belong to the grease, which was used to fix the crystal on the class fiber.

FT-IR reflectance spectrum of Li3Y(BO3)2.
4 Conclusions
With the synthesis and precise single-crystal structure solution and refinement of Li3Y(BO3)2, we could contribute the yttrium phase to the already described series Li3RE(BO3)2 (RE=Er, Yb, and Lu) [4]. It crystallizes in the monoclinic space group P21/c (no. 14) being isotypic to Li3Gd(BO3)2 [4]. The main structural characteristics are YO8 polyhedra, which build [Y2O14] dinuclear units by a common edge. These units are linked to each other by three- and four-coordinated boron and lithium atoms, respectively. Our future research interests will be focused on the exploration of other alkaline rare earth borates in the ternary system A2O–RE2O3–B2O3 (A=alkali metals) and in the quaternary system A2O–X2O–RE2O3–B2O3 (A,X=alkali metals).
Acknowledgments
Special thanks go to Dr. G. Heymann for collecting the single-crystal diffraction data, to D. Vitzthum for the measurements of the single-crystal IR spectra (both from Institute for General, Inorganic, and Theoretical Chemistry, University of Innsbruck), and to Univ.-Prof. Dr. R. Stalder, Institute for Mineralogy and Petrography, University of Innsbruck, for the access to the FTIR spectrometer.
References
[1] S. Lin, Z. Sun, B. Wu, C. Chen, J. Appl. Phys.1990, 67, 634.10.1063/1.345765Search in Google Scholar
[2] C. Chen, B. Wu, A. Jiang, G. You, Sci. Sin. B-Chem. B. A. M.1985, 28, 235.Search in Google Scholar
[3] G. Chadeyron, M. El-Ghozzi, R. Mahiou, A. Arbus, J. Cousseins, J. Solid State Chem.1997, 128, 261.10.1006/jssc.1996.7207Search in Google Scholar
[4] V. Jubera, P. Gravereau, J. P. Chaminade, Solid State Sci.2001, 3, 469.10.1016/S1293-2558(01)01156-6Search in Google Scholar
[5] N. Akhmedova, S. Guseinova, N. Mustafaev, M. Zargarova, Russ. J. Inorg. Chem.1992, 37, 696.Search in Google Scholar
[6] G. Abdullaev, K. S. Mamedov, P. Rza-Zade, S. A. Guseinova, G. Dzhafarov, Russ. J. Inorg. Chem.1977, 22, 1765.Search in Google Scholar
[7] J.-P. Chaminade, P. Gravereau, V. Jubera, C. Fouassier, J. Solid State Chem.1999, 146, 189.10.1006/jssc.1999.8331Search in Google Scholar
[8] V. Jubera, P. Gravereau, J.-P. Chaminade, C. Fouassier, J. Solid State Chem.2001, 156, 161.10.1006/jssc.2000.8977Search in Google Scholar
[9] J. Mascetti, M. Vlasse, C. Fouassier, J. Solid State Chem.1981, 39, 288.10.1016/0022-4596(81)90262-0Search in Google Scholar
[10] Y. Zhang, X. Chen, J. Liang, T. Xu, J. Alloys Compd.2002, 333, 72.10.1016/S0925-8388(01)01689-9Search in Google Scholar
[11] P. Gravereau, J.-P. Chaminade, S. Pechev, V. Nikolov, D. Ivanova, P. Peshev, Solid State Sci.2002, 4, 993.10.1016/S1293-2558(02)01344-4Search in Google Scholar
[12] J. Gao, R. Li, Mater. Res. Bull.2008, 43, 882.10.1016/j.materresbull.2007.05.009Search in Google Scholar
[13] J. Gao, R. Li, Solid State Sci.2008, 10, 26.10.1016/j.solidstatesciences.2007.08.009Search in Google Scholar
[14] Sadabs (version 5), Bruker AXS Inc., Madison, WI (USA) 2014.Search in Google Scholar
[15] A. L. Spek, Acta Crystallogr.2009, D65, 148.10.1107/S090744490804362XSearch in Google Scholar
[16] G. Sheldrick, Shelxs-13 and Shelxl-13, Program Suite for the Solution and Refinement of Crystal Structures, University of Göttingen, Göttingen (Germany) 2013.Search in Google Scholar
[17] G. M. Sheldrick, Acta Crystallogr.2015, C71, 3.Search in Google Scholar
[18] K. Brandenburg, Diamond (version 3.2i), Crystal and Molecular Structure Visualization, Crystal Impact – H. Putz and K. Brandenburg GbR, Bonn (Germany) 2012.Search in Google Scholar
[19] E. Zobetz, Z. Kristallogr.1982, 160, 81.10.1524/zkri.1982.160.1-2.81Search in Google Scholar
[20] I. Brown, D. Altermatt, Acta Crystallogr.1985, B41, 244.10.1107/S0108768185002063Search in Google Scholar
[21] N. Brese, M. O’Keeffe, Acta Crystallogr.1991, B47, 192.10.1107/S0108768190011041Search in Google Scholar
[22] R. Hoppe, S. Voigt, H. Glaum, J. Kissel, H. P. Müller, K. Bernet, J. Less-Common Met.1989, 156, 105.10.1016/0022-5088(89)90411-6Search in Google Scholar
[23] R. Hübenthal, Maple (Version 4), Programm zur Berechnung des Madelunganteils der Gitterenergie, Universität Giessen, Gießen (Germany) 1993.Search in Google Scholar
[24] R. Hoppe, Angew. Chem. Int. Ed. Engl.1970, 9, 25.10.1002/anie.197000251Search in Google Scholar
[25] R. Hoppe, Angew. Chem. Int. Ed. Engl.1966, 5, 95.10.1002/anie.196600951Search in Google Scholar
[26] W. I. David, M. O. Jones, D. H. Gregory, C. M. Jewell, S. R. Johnson, A. Walton, P. P. Edwards, J. Am. Chem. Soc.2007, 129, 1594.10.1021/ja066016sSearch in Google Scholar
[27] A. Kevorkov, V. Karyagin, A. Munchaev, Crystallogr. Rep.1995, 40, 28.Search in Google Scholar
[28] G. Gurr, P. Montgomery, C. Knutson, B. Gorres, Acta Crystallogr.1970, B26, 906.10.1107/S0567740870003369Search in Google Scholar
[29] J. Laperches, P. Tarte, Spectrochim. Acta1966, 22, 1201.10.1016/0371-1951(66)80023-1Search in Google Scholar
[30] R. Böhlhoff, H. Bambauer, W. Hoffmann, Z. Kristallogr.1971, 133, 386.10.1524/zkri.1971.133.133.386Search in Google Scholar
[31] K. Machida, H. Hata, K. Okuno, G. Adachi, J. Shiokawa, J. Inorg. Nucl. Chem.1979, 41, 1425.10.1016/0022-1902(79)80205-5Search in Google Scholar
[32] A. Haberer, H. Huppertz, J. Solid State Chem.2009, 182, 888.10.1016/j.jssc.2009.01.023Search in Google Scholar
[33] C. Mak, P. Tanner, Z. Zhuo, J. Alloys Compd.2001, 323, 292.10.1016/S0925-8388(01)01117-3Search in Google Scholar
©2017 Walter de Gruyter GmbH, Berlin/Boston
Articles in the same Issue
- Frontmatter
- In this Issue
- Crystal and molecular structure of 1-picryl-2-phenyl-2-(4-picrylamidophenyl)-diazenium betaine: analogy between a picramido group and an oxygen atom
- Synthesis and crystal structure of the rare earth borogermanate EuGeBO5
- Alkylation of tetrathiotungstate anions: crystal structures of the alkylthiolatotrithiotungstate complexes [PPh4]2[WS3(Sn Pr)][WS3(Sn Bu)]·½C6H6 and [PPh4][WS3(SCH2C6H4CH2Cl-4)]
- Two isostructural fluorinated metal-organic frameworks with rare rod-packing architecture: syntheses, structures and luminescent properties
- Synthesis and characterization of a macrocyclic copper complex containing the 14-membered 1,3,5,8,10,12-hexaazacyclotetradecane unit
- Synthesis of lignin model compound containing a β-O-4 linkage
- Crystal structures and third-order optical properties of three manganese(II) complexes constructed from N-heterocyclic and polycarboxylate ligands
- Trigonal dodecahedral sodium coordination in a trinuclear copper(II)-sodium complex incorporating a salen-type compartmental Schiff base
- X-ray and NQR studies of bromoindate(III) complexes: [C2H5NH3]4InBr7, [C(NH2)3]3InBr6, and [H3NCH2C(CH3)2CH2NH3]InBr5
- Synthesis and structural characterization of Li3Y(BO3)2
- About the air- and water-stable copper(I) dicyanamide: synthesis, crystal structure, vibrational spectra and DSC/TG analysis of Cu[N(CN)2]
- Note
- Synthesis, crystal structure, and photoluminescence of a dumbbell-like sodium dicyanamide compound with 15-crown-5