Optical Properties of Liquid Crystalline Alkoxy Benzoic Acids with Dispersed Citrate-Capped Gold Nanoparticles
-
M. Tejaswi
 ,
B.T.P. Madhav
,
K. Pandian
,
B.T.P. Madhav
,
K. Pandian
 und
V.G.K.M. Pisipati
und
V.G.K.M. Pisipati

Abstract
Citrate-capped gold nanoparticles (Gnps) have multiple applications in all optical devices and influence the properties of birefringence in liquid crystalline (LC) molecules. In the present paper, systematic studies have been carried out on LC compounds p-n-undecyloxy benzoic acid (11oba) and p-n-dodecyloxy benzoic acid (12oba) with dispersed citrate-capped Gnps in different low molar concentrations. The phase transition temperatures of the LC nanocomposites obtained from polarizing thermal microscopy (POM), differential scanning calorimetry (DSC) and modified spectrometry are found to be reduced with the increase in concentration of dispersed citrate-capped Gnps. The information was obtained from textural data utilizing the simple technique gradient measurement of standard deviation (GMSD) using the MATLAB tool, which is analogous to DSC. Further, the existence of citrate-capped Gnps in 11oba and 12oba was determined by spectroscopic techniques like ultraviolet-visible spectrometry and scanning electron microscopy. The birefringence measurements were carried out at different wavelengths (460, 500, 570 and 635 nm) using a wedge-shaped cell with a modified spectrometer. The birefringence (δn) increases with increase in weight concentration of citrate-capped Gnps in the nematic thermal range. Further, the order parameter S values obtained from the Kuczynski internal field model, the Vuks model, the Haller extrapolation model and the effective geometry parameter methods are in good agreement. It is found that the order parameter S increases with increase in dispersion of concentration of citrate-capped Gnps. This is due to strong Van der Waal’s interaction between the LC molecules and citrate-capped Gnps, which increases the alignment of the LC molecules.
1 Introduction
Liquid crystallines (LCs) are very exciting because these materials show different optical, physical, thermal and electro-optical properties in the vicinity of condensed matter physics. LCs have budding commercial applications in a large range of optical devices, like optical lens, flat panel displays, spatial light modulators, etc., in which the measured parameters such as tilt angle, optimum response time, light modulation, birefringence, etc., play vital roles in LC materials [1], [2]. These LC materials have the tendency to reassign their long-range orientational order by the dispersion of nanoparticles and various colloids, which are more applicable in display technologies [3], [4]. The physical properties of LC compounds are based on information about their molecular shape and intermolecular interactions. A very small change in the molecular structure can result in a drastic change in the corresponding LC properties. The alkoxy benzoic acids with lower homologous series (n = 3–6) exhibit a solitary variant nematic phase, and those with higher homologues series (n = 7–12 and 16) exhibit bi-variant nematic and smectic-C (smC) phases [2], [5], [6], [7], [8], [9], [10], [11], [12], [13], [14]. The liquid crystal nanocomposites (LCNPs) have drawn significant attention in LC research for the better alignment of the molecules, especially in the nematic phase [15], [16], [17]. The nematic phase is more stable than the other phases, and the molecular alignment is not easily effected by temperature changes in the nematic thermal range. The dispersion of nanoparticles normally decreases the nematic clearing temperature [18]. Also, small amounts of these nanoparticles can drastically alter the magneto-optical, viscoelastic, dielectric, electro-optical, electric and optical properties of LCs by the enhancement of characteristic properties such as the nematic thermal range, birefringence and orientational order parameter [19], [20], [21], [22], [23]. The large increment in birefringence values by the chemical method has importance in so many applications [24]. As δn is inversely proportional to the cell gap, the increment in δn values can reduce the cell gap, thus shortening the response time and weakening the fringing fields [25].
Accordingly, gold (Au) nanoparticles (Gnps) capped with well-organized ligands have been dispersed in LCs and provided for various display and non-display applications. The agglomeration of nanoparticles is prevented by sufficient capping agents and provides better surface functionalization. It improves the stability of LC nanocolloids due to the increase in the miscibility nature of nanoparticles in the LC host [26], [27], [28]. The authors studied the birefringence properties of p-n-undecyloxy benzoic acid (11oba) and p-n-dodecyloxy benzoic acid (12oba) with dispersion of citrate-capped Gnps in increasing minute concentrations. The presence of citrate-capped Gnps in 11oba and 12oba is characterized by the experimental techniques ultraviolet (UV) spectrometry and scanning electron microscopy (SEM). The refractive indices ne and no are calculated by using a modified spectrometer designed and fabricated indigenously [29]. Further, the orientational order parameter S of the molecules of LCNPs is calculated from the internal field models, namely, the Kuczynski model, the Vuks model, the Haller extrapolation model and the effective geometry parameter (αeg) model. The results are discussed in detail with the body of data.
2 Experimental Techniques
2.1 Synthesis of Citrate-Capped Gnps
The citrate-capped Gnps were synthesized with the citrate reduction process from the standard literature data [30]. The chemical ingredients for the synthesis, the reducing agent trisodium citrate dehydrate (Na3C6H5O7 ⋅ 2H2O) 99 % and hydrogen tetrachloroaurate (III) trihydrate (HAuCl4 ⋅ 3H2O) ACS, 99.99 %, were purchased from Sigma Aldrich Laboratories, USA (Sigma Aldrich, St Louis, MO, USA) and used as such. From the Inductive Couple Plasma Optical Spectrometry report (ICAP6500 Thermo Fisher Scientific), the amount of Gnps present in the solution of 1 ml (1000 μl) of citrate-capped Gnps was 96.75 μg. The author has dispersed very small amounts of citrate-capped Gnps; 30, 50, 70 and 90 μl contain Gnps of amounts 2.90, 4.83, 6.77 and 8.70 μg, respectively.
2.2 Homogeneous Dispersion of Citrate-Capped Gnps in LC Compounds
The LC compounds 11oba and 12oba were purchased from Sigma-Aldrich Laboratories (USA) and used as such. Citrate-capped Gnps (30 μl) was dispersed homogeneously into 100 mg of LC material 11oba in the isotropic state, which was dissolved in toluene and stirred well for about 3 h (Remi DHMS 2432 magnetic stirrer, Vasai, India) and termed as 11oba mix 1. The same process was repeated with the dispersion of 30, 50, 70 and 90 μl in 100 mg of 11oba and 12oba, separately termed as 11oba mix 2, 11oba mix 3 and 11oba mix 4, and 12oba mix 1, 12oba mix 2, 12oba mix 3, and 12oba mix 4, respectively. After cooling, the 11oba and 12oba mixtures were subjected to examination of both phase transition temperatures and textures using polarizing thermal microscopy (POM) (SDTechs) attached with a hot stage (SDTECHS-SDVPM 2727, Machilipatnam, Andhra Pradesh, India). The substance was filled in 4-μm cells in planar alignment, and the temperature was measured with a thermometer designed by Gray [31]. The transition temperatures of LCs with nanomixtures at the phase transition were studied through differential scanning calorimetry (DSC) (Perkin Elmer Diamond DSC, Thane, Mumbai, India) along with the enthalpy values of the endothermic and exothermic regimes. Then, 11oba and 12oba with a homogeneous dispersion of citrate-capped Gnps in each concentration and characterized by the experimental techniques UV-visible spectroscopy (using Shimadzu UV-2450 UV-Visible spectrophotometry, Shimadzu, Tokyo, Japan) and SEM and the presence of citrate-capped Gnps in 11oba and 12oba were further studied.
3 Results and Discussion
3.1 Ultraviolet-Visible Spectroscopy
UV-visible spectroscopy is a powerful characterization tool for the citrate-capped Gnps due to the surface plasmon resonance emerging as a broad absorption band in the visible region from ∼510 to ∼580 nm. It is found that no peak is observed in the spectrum for 11oba and 12oba pure compounds in the wavelength range of 500–600 nm. However, the spectra of 11oba mix 3 and 12oba mix 4 show the prominent peak at 550 nm [32], which is the characteristic peak of citrate-capped Gnps shown in Figure 1a and b.
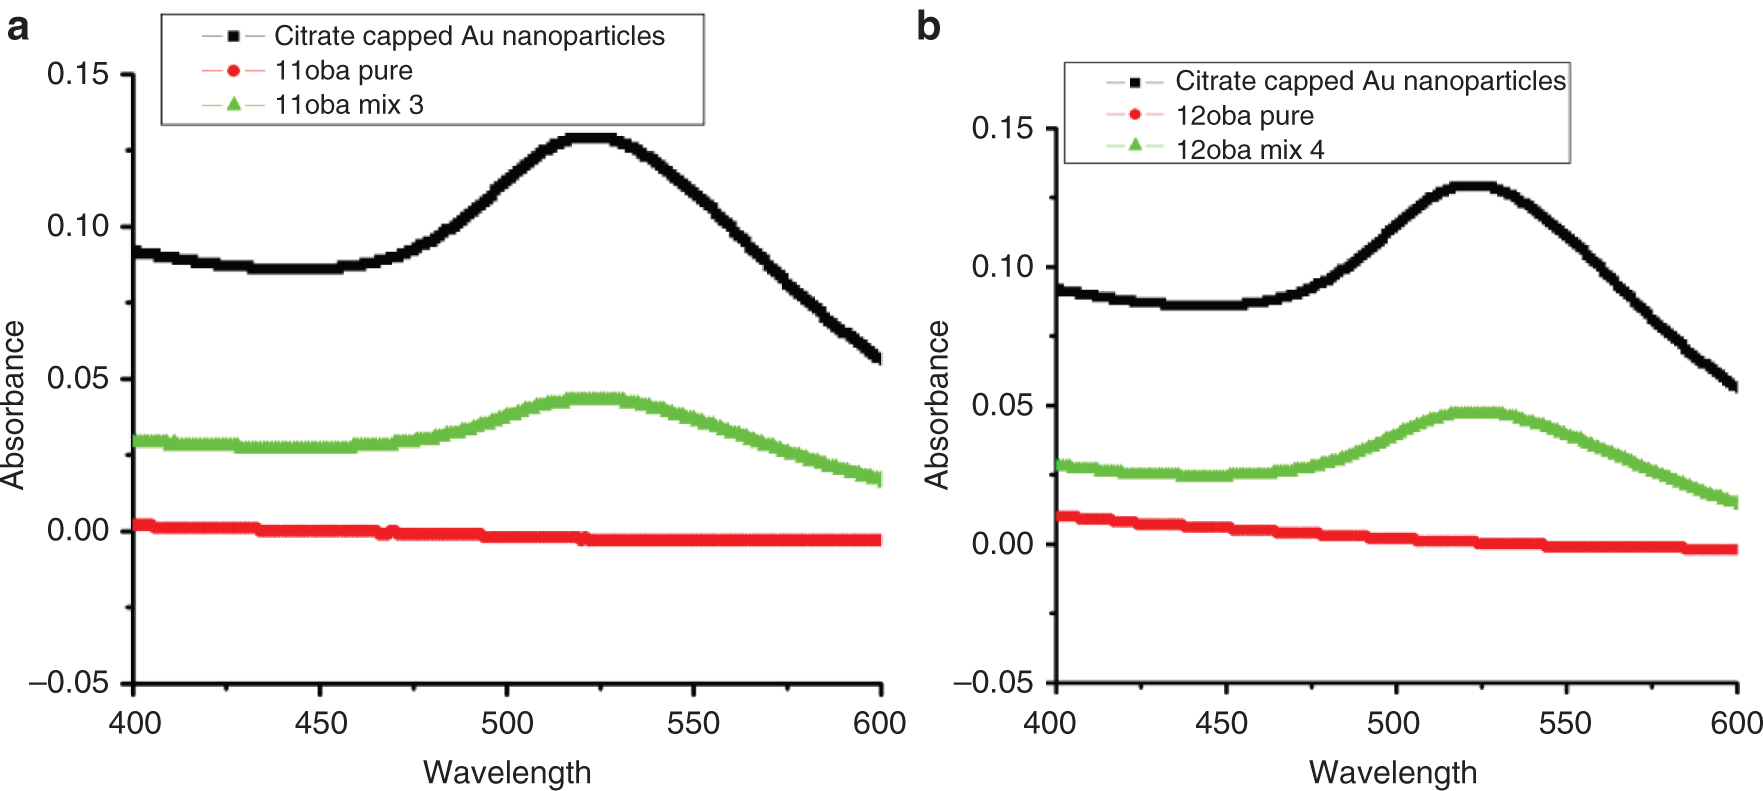
(a) UV data of citrate-capped Gnps 11oba mix 3. (b) UV data of citrate-capped Gnps in 12oba mix 4.
3.2 SEM Analysis
SEM gives the surface morphology and chemical composition of elements, which are presented in the sample for the characterization of nanomaterials [33]. The SEM image and EDS data of citrate-capped Gnps are shown in Figure 2a, while those of 11oba mix 3 and 12oba mix 4 are shown in Figure 2b and c, respectively. From the EDS data, the occurrence of citrate-capped Gnps in 11oba and 12oba is confirmed. SEM device used Zeiss from Zeiss, Oberkochen, Germany.
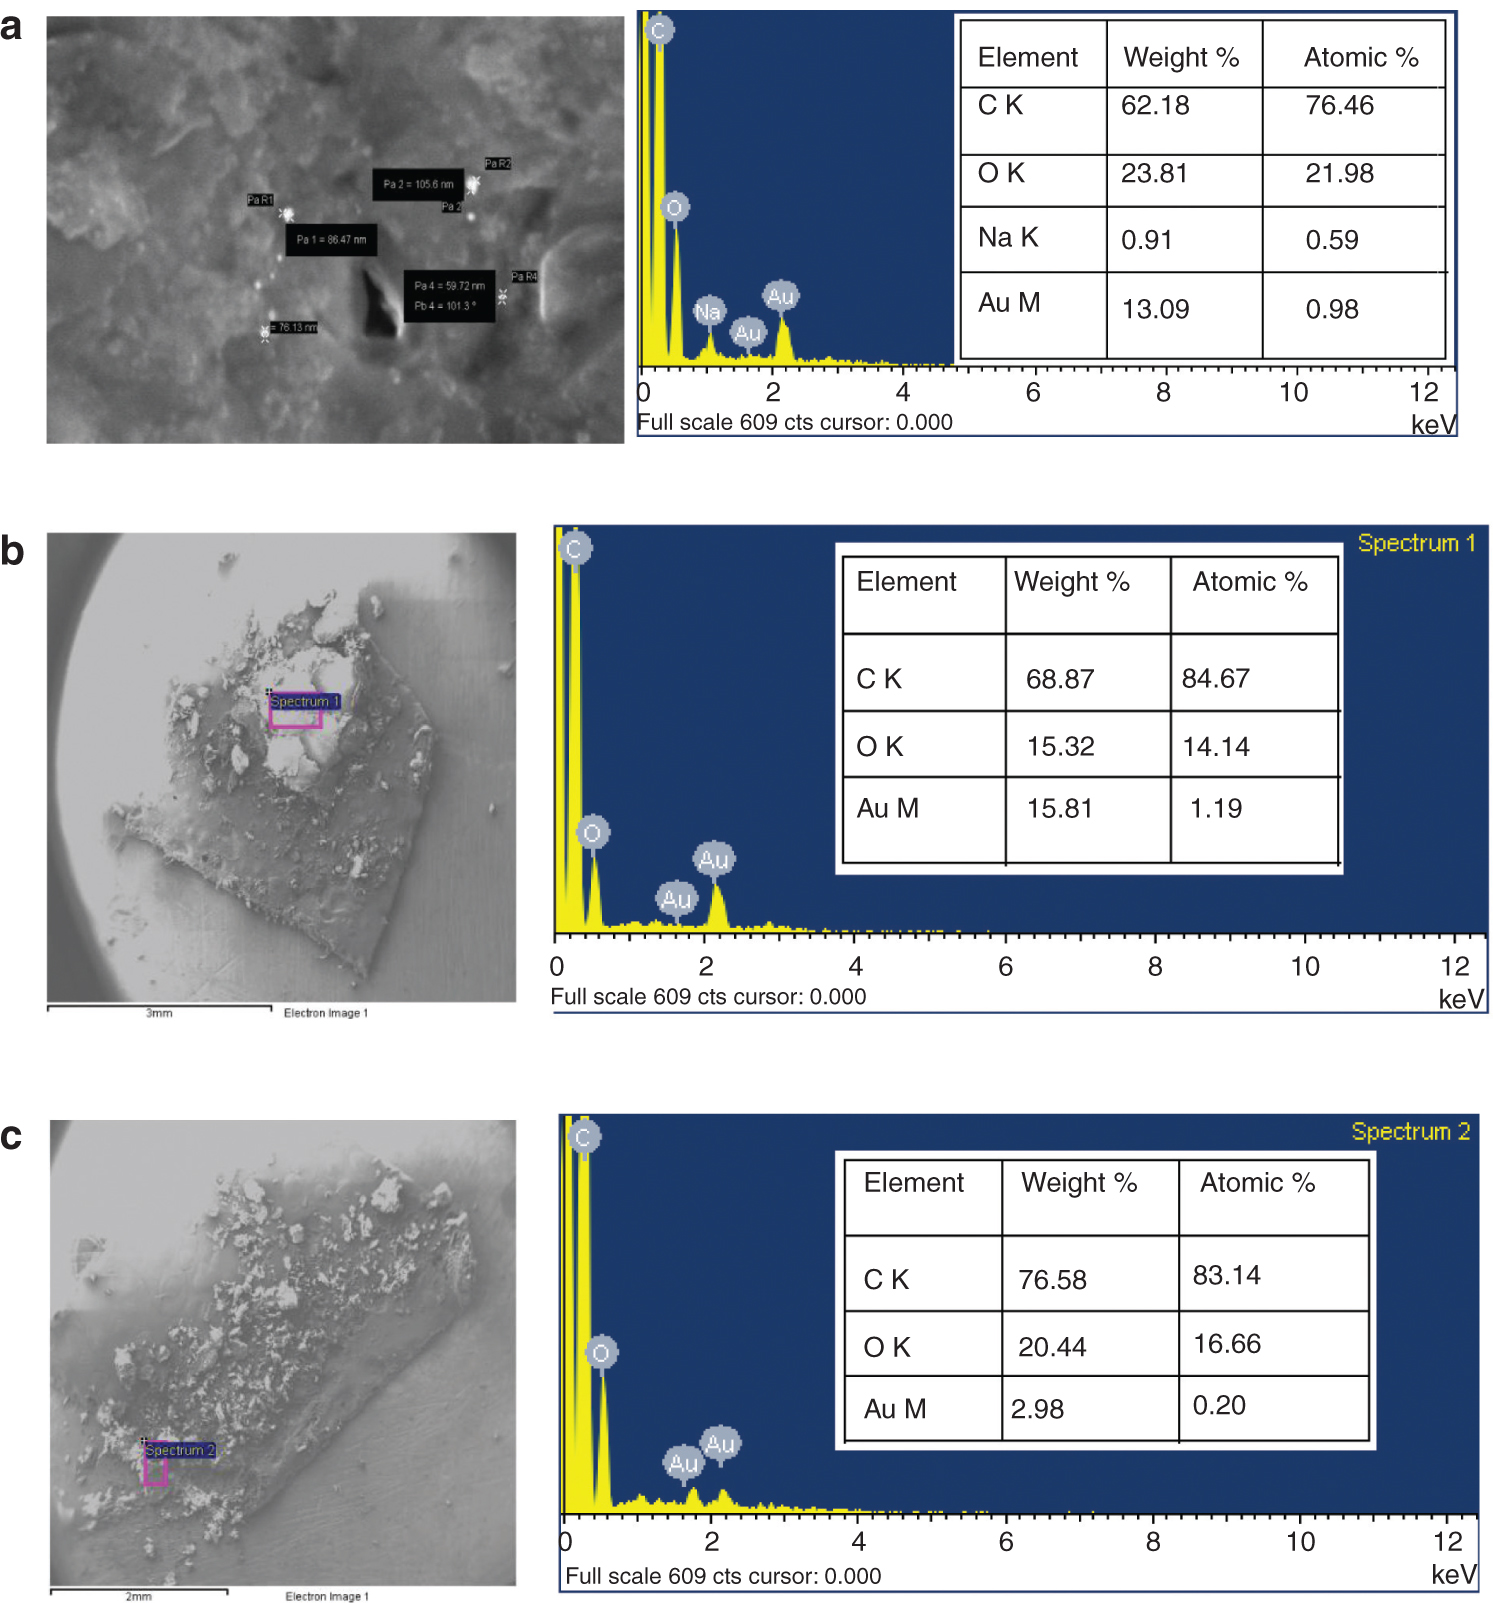
(a) SEM image and EDS data of citrate-capped Gnps. (b) SEM image and EDS data of 11oba mix 3. (c) SEM image and EDS data of 12oba mix 4.
3.3 Gradient Measurement Technique (GMSD)
Image gradient is a directional change in force or shading in an image, and it is an essential component since it can adequately catch the confined structures of the image. Image gradients might be utilized to separate two critical parameters from images. The first one is known as the magnitude of the gradient, which is how rapidly the image power is changing, and the other one is the course of the gradient, which reveals the bearing in which the image force is changing rapidly.
The image gradients are delicate to image contortions, while distinctive neighborhood structures in a mutilated image experience the ill effects of the different degrees of debasements. The most generally experienced image contortions, including commotion defilement, obscure and pressure ancient rarities, will prompt exceptionally the unmistakable auxiliary changes that “fly out” of the gradient area. Inspiring by this, we investigate the utilization of global variation of gradient-based local feature map for the variation in texture images due to change in temperature at phase transitions [34].
This image processing with statistical parameters technique will give information with regard to the phase transition temperature of the compound without taking assistance from the DSC instrument. The mean of all the collected images at various temperatures is used to find the phase change in this strategy. This will allow for the phase transition of the LC compound to be obtained in less time and at low cost [35]. The textures at the phase transition from the POM are shown in Figure 3a–d for 11oba mix 1, in Figure 3e–h for 11oba mix 2, in Figure 3i–l for 12oba mix 1, in Figure 3m–p for 12oba mix 2 and in Figure 3q–t for 12oba mix 4. Table 1 provides the data of the phase transitions of the LC mixtures, and DSC thermograms along with GMSD technique are shown in Figure 4a–d. The DSC thermograms of 11oba and 12oba along with various mixtures are shown in Figure 4e–h.
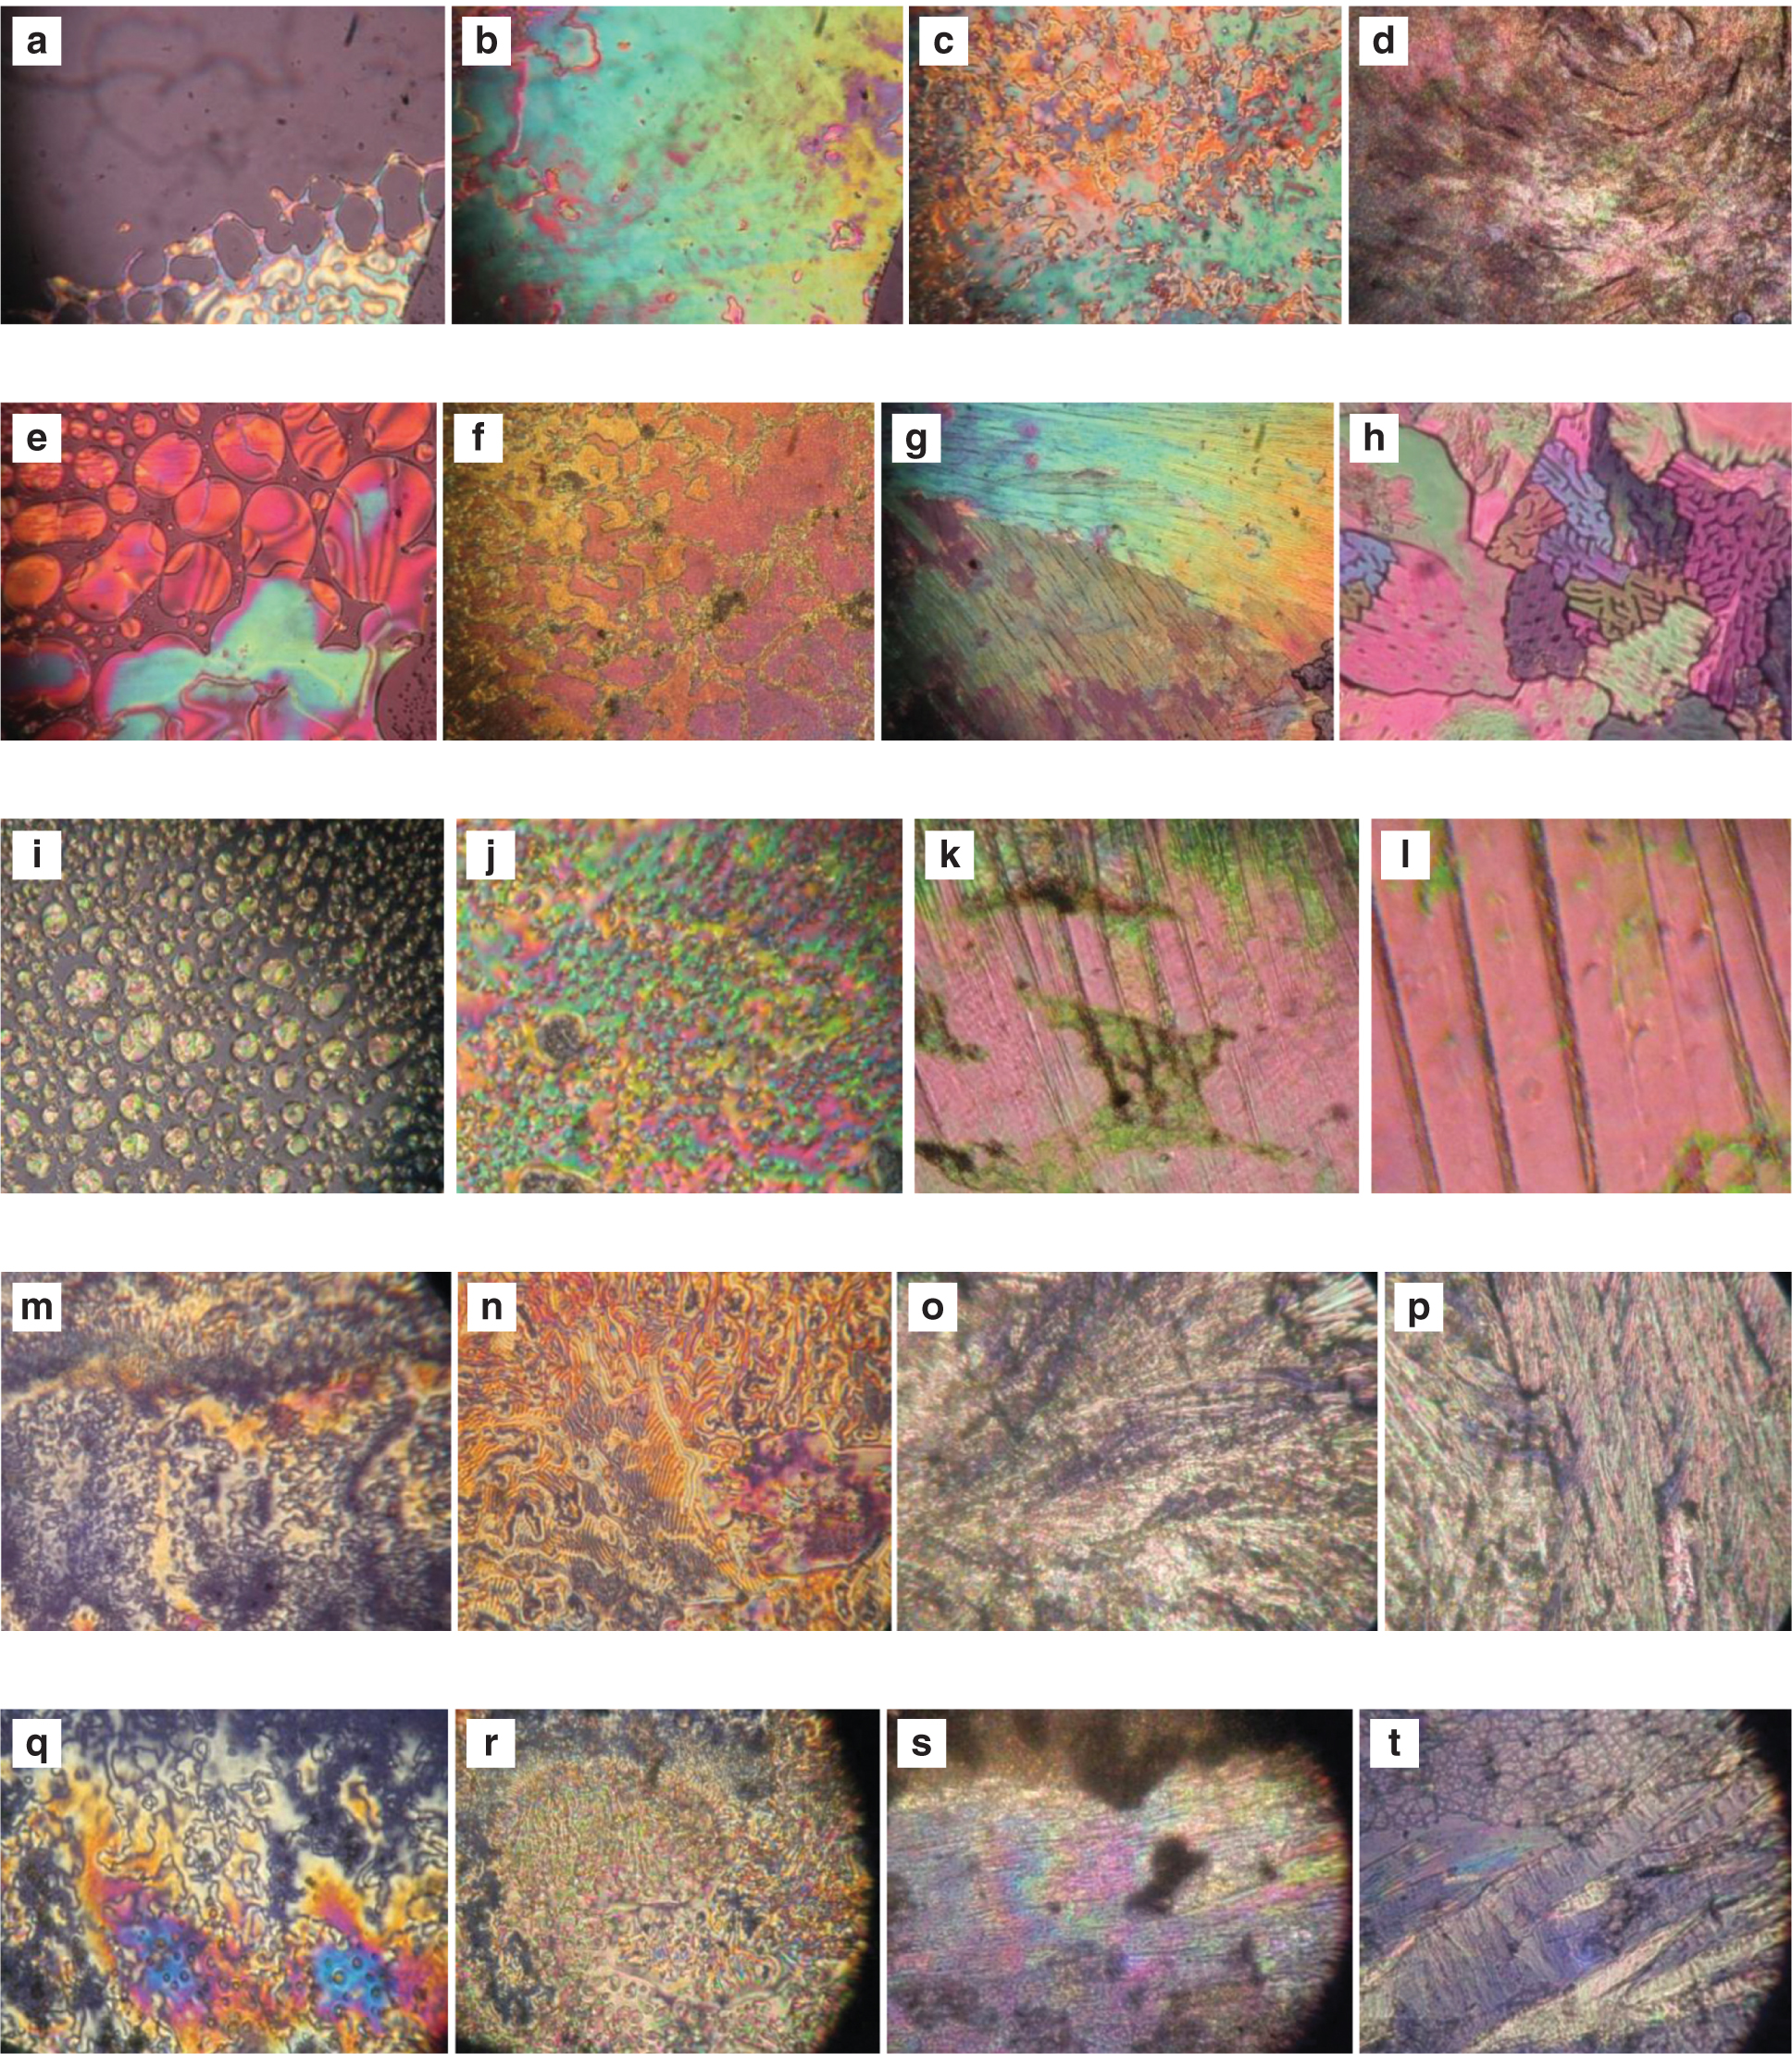
POM textures of 11oba mix 1: (a) isotropic to nematic phase at 136.9 °C; (b) nematic at 134.3 °C; (c) SmC at 125.8 °C; (d) solid I at 85.1 °C. POM textures of 11oba mix 2: (e) nematic phase at 136.2 °C; (f) SmC at 124.4 °C; (g) solid I at 83.2 °C; (h) solid II at 73.2 °C. POM textures of 12oba mix 1: (i) nematic phase at 132.8 °C; (j) SmC at 128 °C; (k) solid I at 86.1 °C; (l) solid II at 63.9 °C. POM textures of 12oba mix 2: (m) nematic phase at 132.8 °C; (n) SmC at 128.2 °C; (o) solid I at 86.6 °C; (p) solid II at 62.8 °C. POM textures of 12oba mix 4: (q) nematic phase at 129.9 °C; (r) SmC at 128.8 °C; (s) solid I at 85.9 °C; (t) solid II at 62.8 °C.
Enthalpy, phase transition temperatures of 11oba and 12oba with dispersed citrate-capped Gnps.
| S. No. | Compound | DSC/POM | Scan rate | Phase transition temperatures (°C) along with enthalpy values | Thermal range in the nematic region (°C) | |||
|---|---|---|---|---|---|---|---|---|
| I-N | N-SmC | SmC-Solid I | Solid I-Solid II | |||||
| 1 | 11oba pure | DSC | 20 °C min−1 | 137.1 | 126.3 | 85.2 | 71.8 | 10.8 |
| ΔH Jg−1 | 4.90 | 4.68 | 23.41 | 16.11 | ||||
| POM | 137.4 | 126.3 | 86 | 71.2 | 11.1 | |||
| 2 | 11oba mix 1 | DSC | 20 °C min−1 | 136.9 | 125.3 | 84.4 | 70.1 | 11.6 |
| ΔH Jg−1 | 6.58 | 6.07 | 32.74 | 21.73 | ||||
| POM | 136.9 | 125.8 | 85.1 | 70.6 | 11.1 | |||
| 3 | 11oba mix 2 | DSC | 20 °C min−1 | 136.5 | 125.3 | 84.2 | 72.6 | 11.2 |
| ΔH Jg−1 | 5.39 | 4.27 | 84.38 | 19.08 | ||||
| POM | 136.2 | 124.4 | 83.2 | 73.9 | 11.8 | |||
| 4 | 11oba mix 3 | DSC | 20 °C min−1 | 135.2 | 123.9 | 82.8 | 68.9 | 11.3 |
| ΔH Jg−1 | 6.06 | 4.92 | 28.31 | 19.05 | ||||
| POM | 135.9 | 124.6 | 83.4 | 69.4 | 11.3 | |||
| 5 | 11oba mix 4 | DSC | 20 °C min−1 | 135.2 | 123.3 | 83.7 | 69.9 | 11.9 |
| ΔH Jg−1 | 5.91 | 5.8 | 33.02 | 22.36 | ||||
| POM | 135.7 | 124.6 | 83.9 | 70.4 | 11.1 | |||
| 6 | 12oba pure | DSC | 20 °C min−1 | 138.8 | 128.9 | 97.3 | 75.4 | 9.9 |
| ΔH Jg−1 | 1.49 | 7.90 | 35.31 | 15.19 | ||||
| POM | 139.1 | 132.7 | 96.9 | 76.1 | 6.4 | |||
| 7 | 12oba mix 1 | DSC | 20 °C min−1 | 133.5 | 129.1 | 86.8 | 63.1 | 4.4 |
| ΔH Jg−1 | 1.58 | 17.87 | 26.50 | 13.80 | ||||
| POM | 132.8 | 128 | 86.1 | 63.9 | 4.8 | |||
| 8 | 12oba mix 2 | DSC | 20 °C min−1 | 133.2 | 128.7 | 86.2 | 62.4 | 4.5 |
| ΔH Jg−1 | 1.02 | 16.65 | 27.26 | 13.52 | ||||
| POM | 132.8 | 128.2 | 86.6 | 62.8 | 4.6 | |||
| 9 | 12oba mix 3 | DSC | 20 °C min−1 | 131.7 | 128.8 | 86.5 | 63.0 | 2.9 |
| ΔH Jg−1 | 0.98 | 14.33 | 23.56 | 11.21 | ||||
| POM | 131.9 | 128.9 | 85.9 | 62.9 | 3.0 | |||
| 10 | 12oba mix 4 | DSC | 20 °C min−1 | 130.2 | 129.2 | 86.6 | 62.9 | 1.0 |
| ΔH Jg−1 | 1.36 | 23.25 | 36.31 | 14.82 | ||||
| POM | 130. 0 | 128.9 | 85.9 | 62.9 | 1.1 | |||
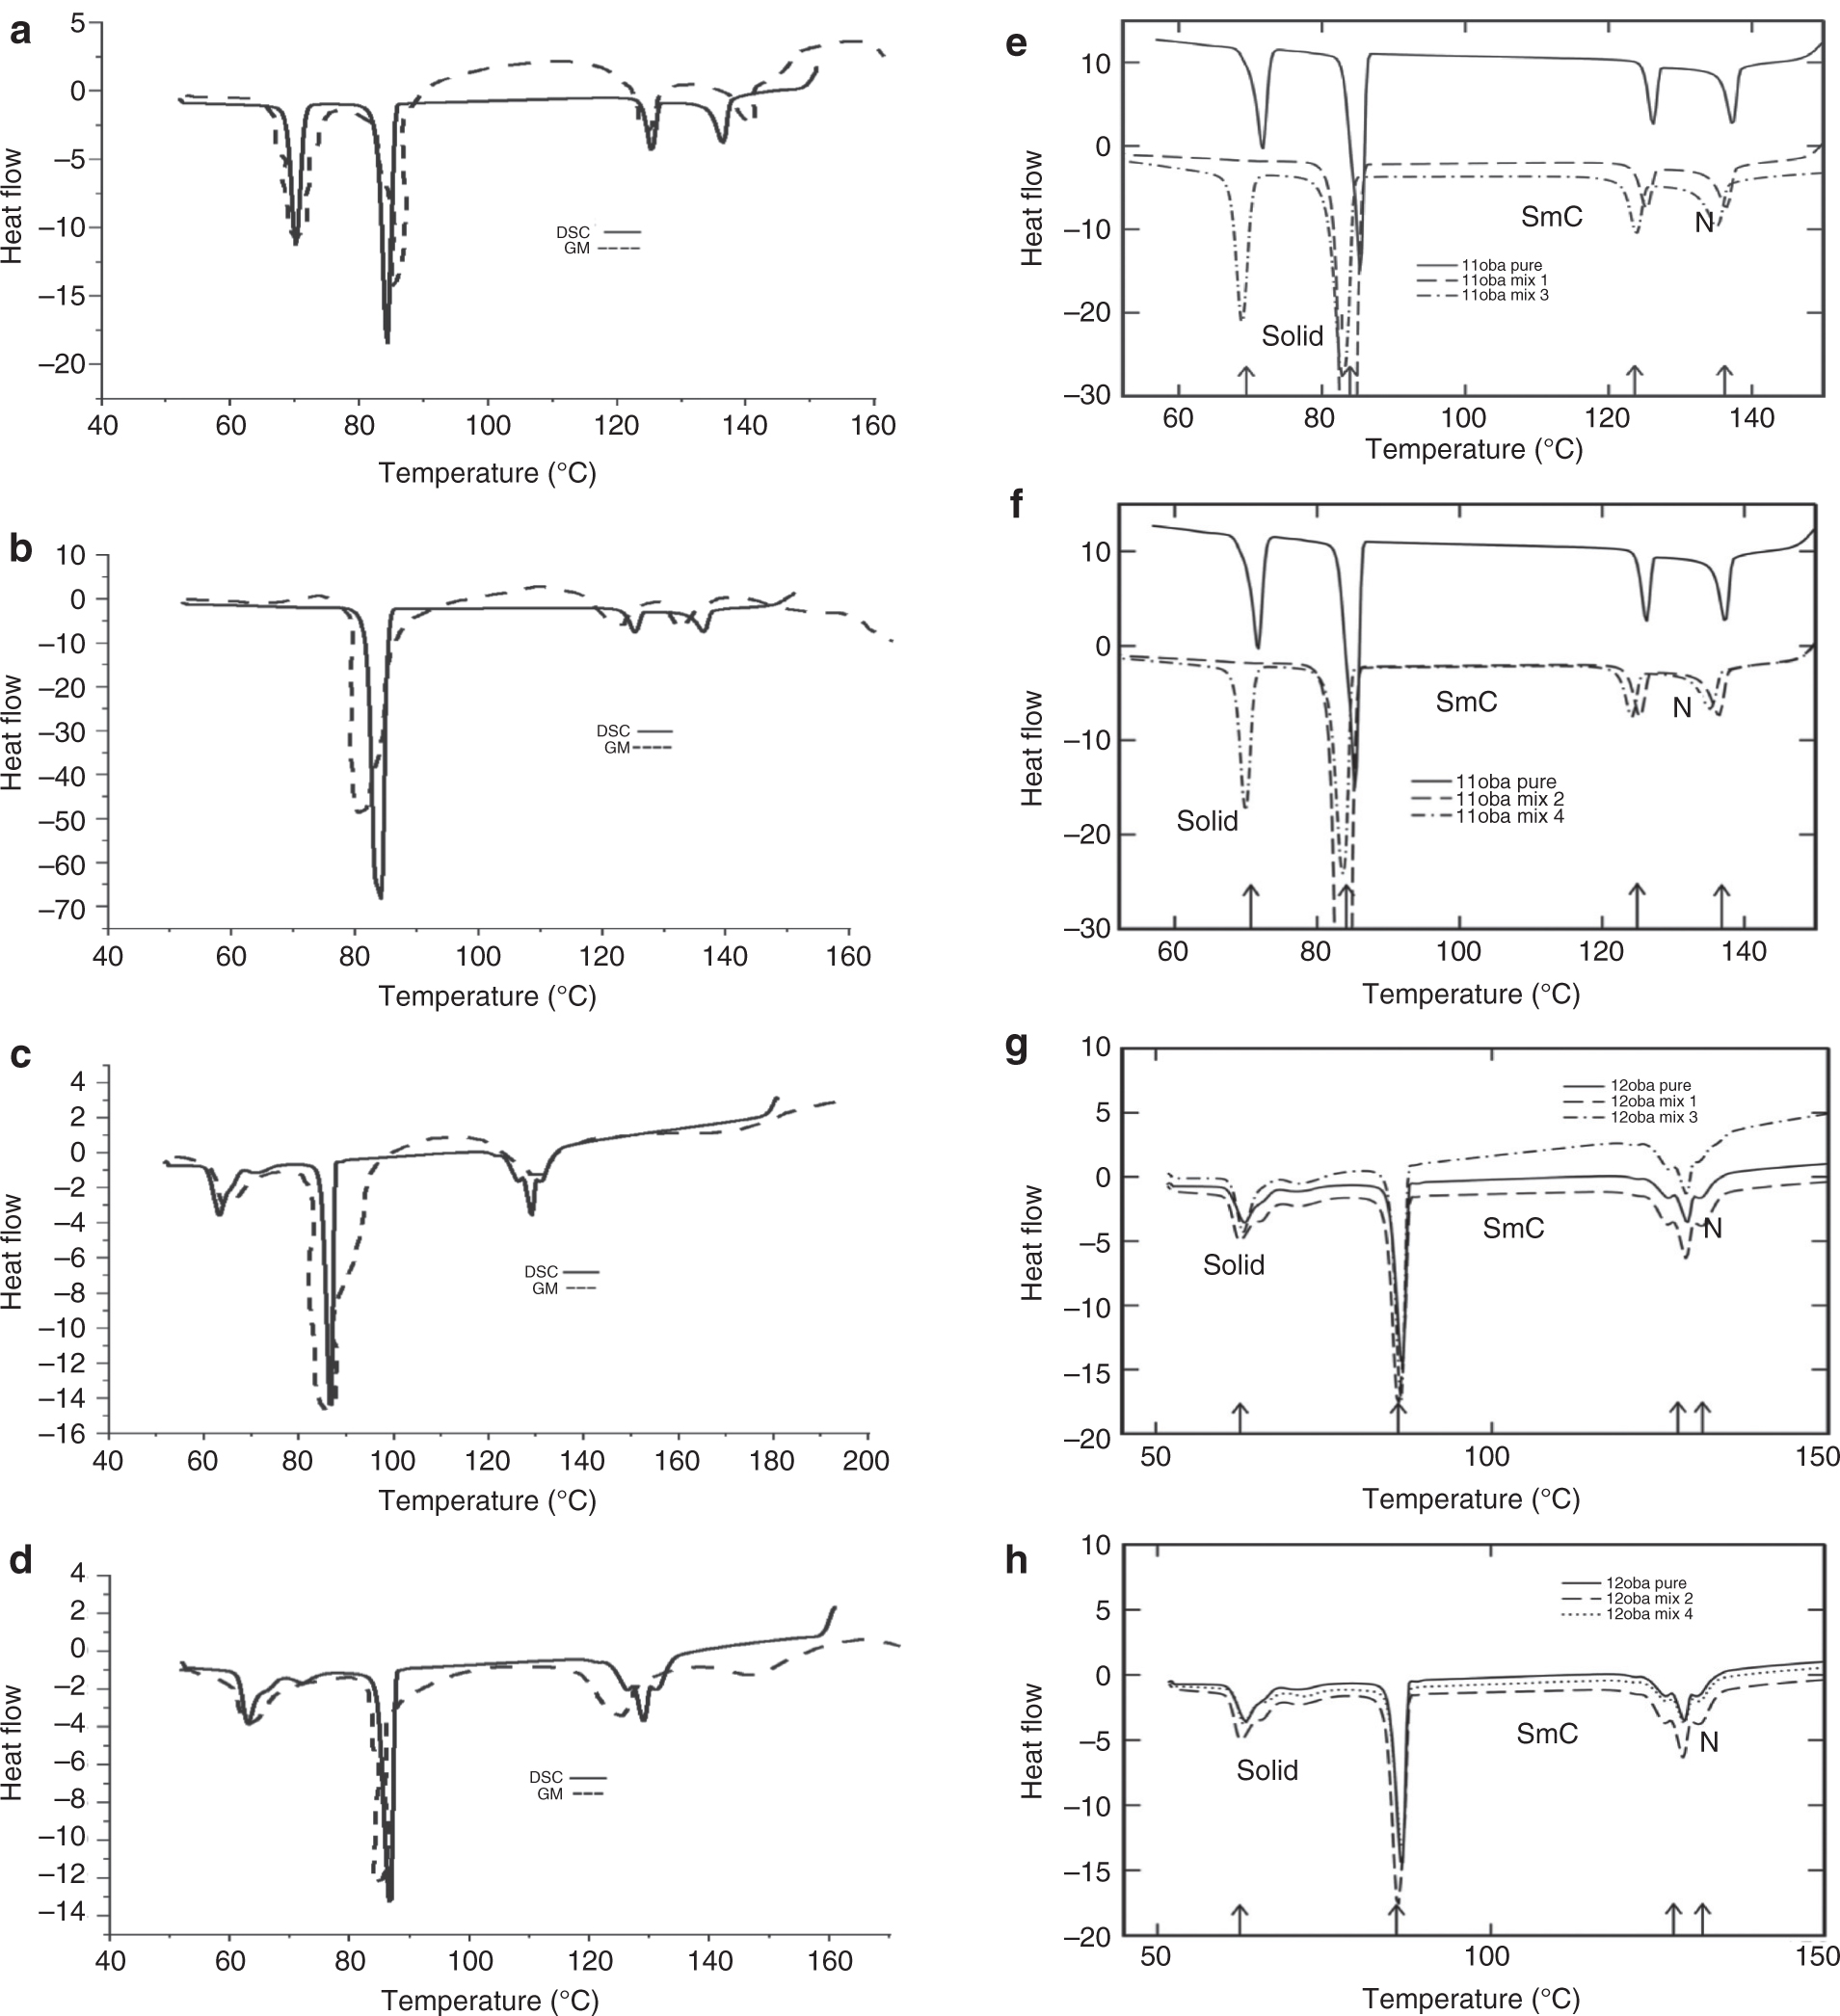
(a) 11oba mix 1 with the DSC and GMSD techniques. (b) 11oba mix 2 with the DSC and GMSD techniques. (c) 12oba mix 1 with the DSC and GMSD techniques. (d) 12oba mix 4 with the DSC and GMSD techniques. (e) DSC thermogram of 11oba pure and with mix 1 and mix 3. (f) DSC thermogram of 11oba pure and with mix 2 and mix 4. (g) DSC thermogram of 12oba pure and with mix 1 and mix 3. (h) DSC thermogram of 12oba pure and with mix 2 and mix 4.
3.4 Measurement of Refractive Indices Using Modified Spectrometer
The refractive indices of the LC compound and with dispersed citrate-capped Gnps in different concentrations are measured with a wedge-shaped glass cell similar to the one used by Haller et al [36] using a modified spectrometer [37], [38] (SDTechs SDMS 6336). The accuracy in the measured refractive indices is ±0.0005, and the temperature accuracy of the heating block is ±0.1 °C. The cell containing the LC sample is enclosed with a heating block mounted on a prism table. The whole system is attached to a modified spectrometer kept in minimum deviation position (SDTECHS-SDMS 6336, Machilipatnam, Andhra Pradesh, India). The refractive indices are measured from the readings of deviations observed in a modified spectrometer by using formula
Here, d is the deviation and A is the angle of the wedge in which the sample is placed.
The variation of the refractive indices with temperature is calculated during the cooling of the LC compound from the isotropic state to the nematic state. At the isotropic state (niso) while cooling, the deviated ray splits up into two rays: one is the extraordinary ray (higher value of niso), and the other is the ordinary ray (lower value of niso), and their corresponding refractive indices (ne and no) are calculated with variations of temperature in the nematic region at various wavelengths 460, 500, 570 and 635 nm. The refractive indices increase with a decrease in wavelength [39] as expected, (shown in Fig. 5a–j).
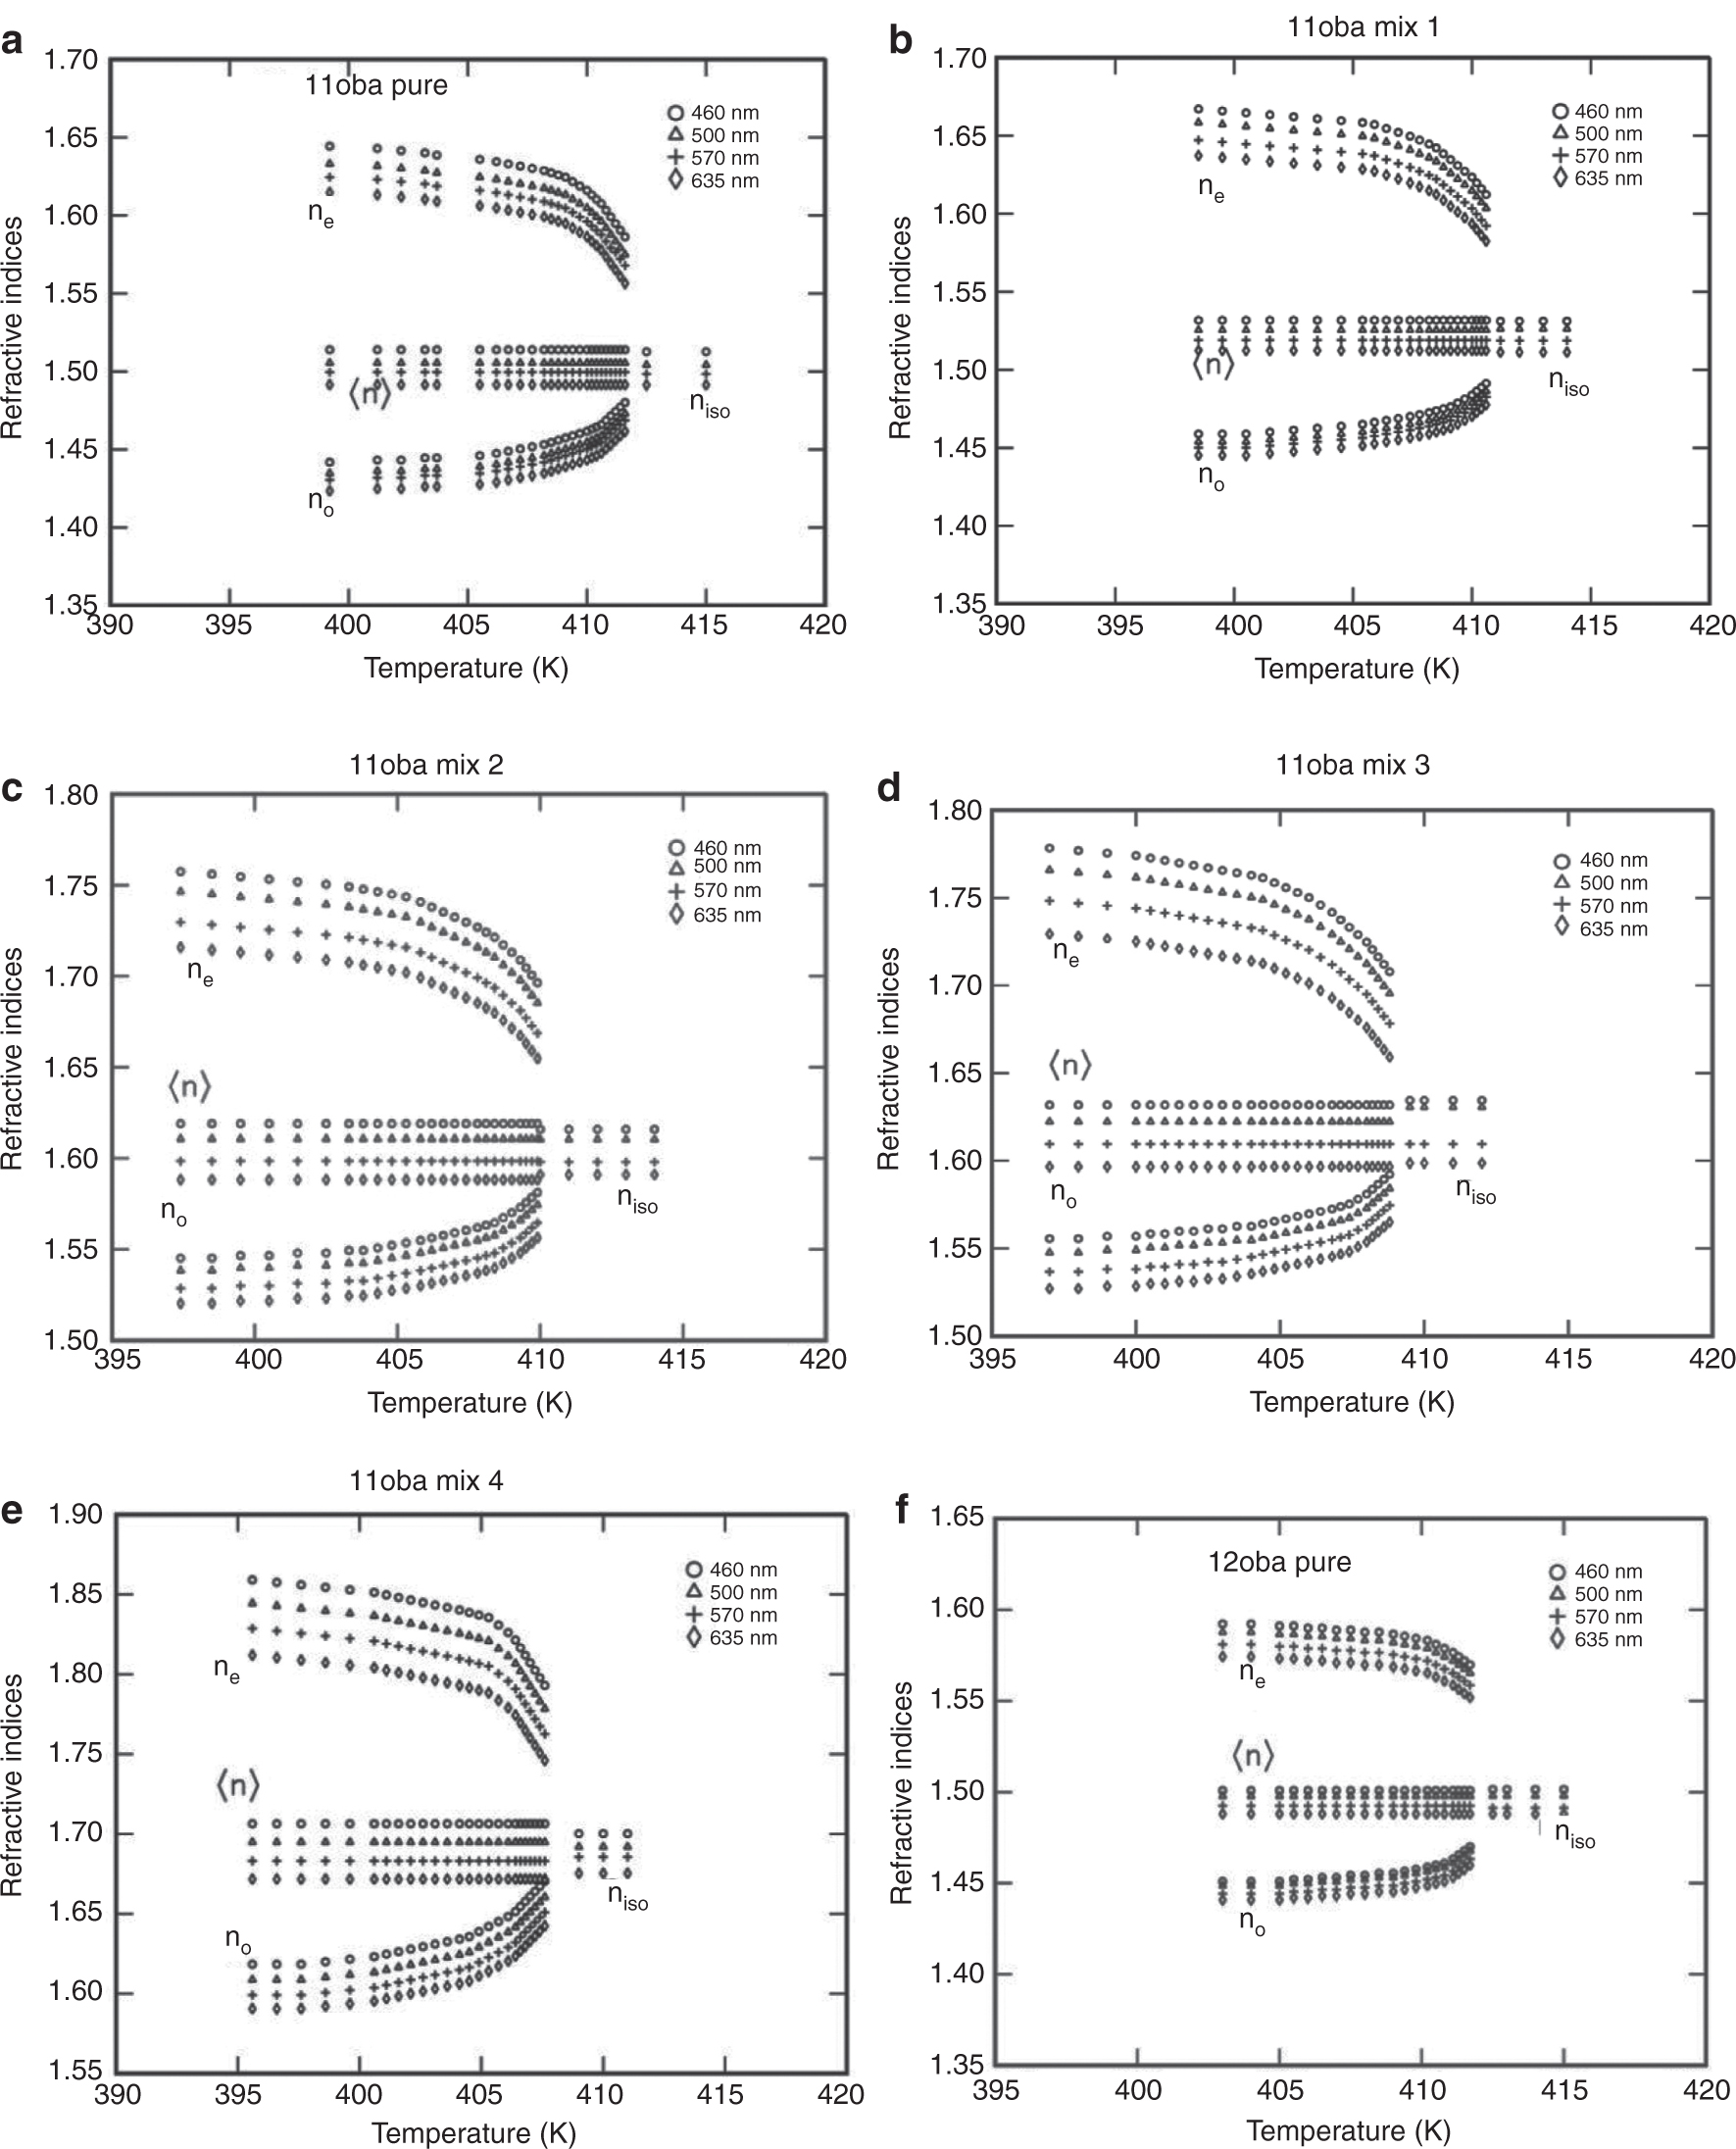
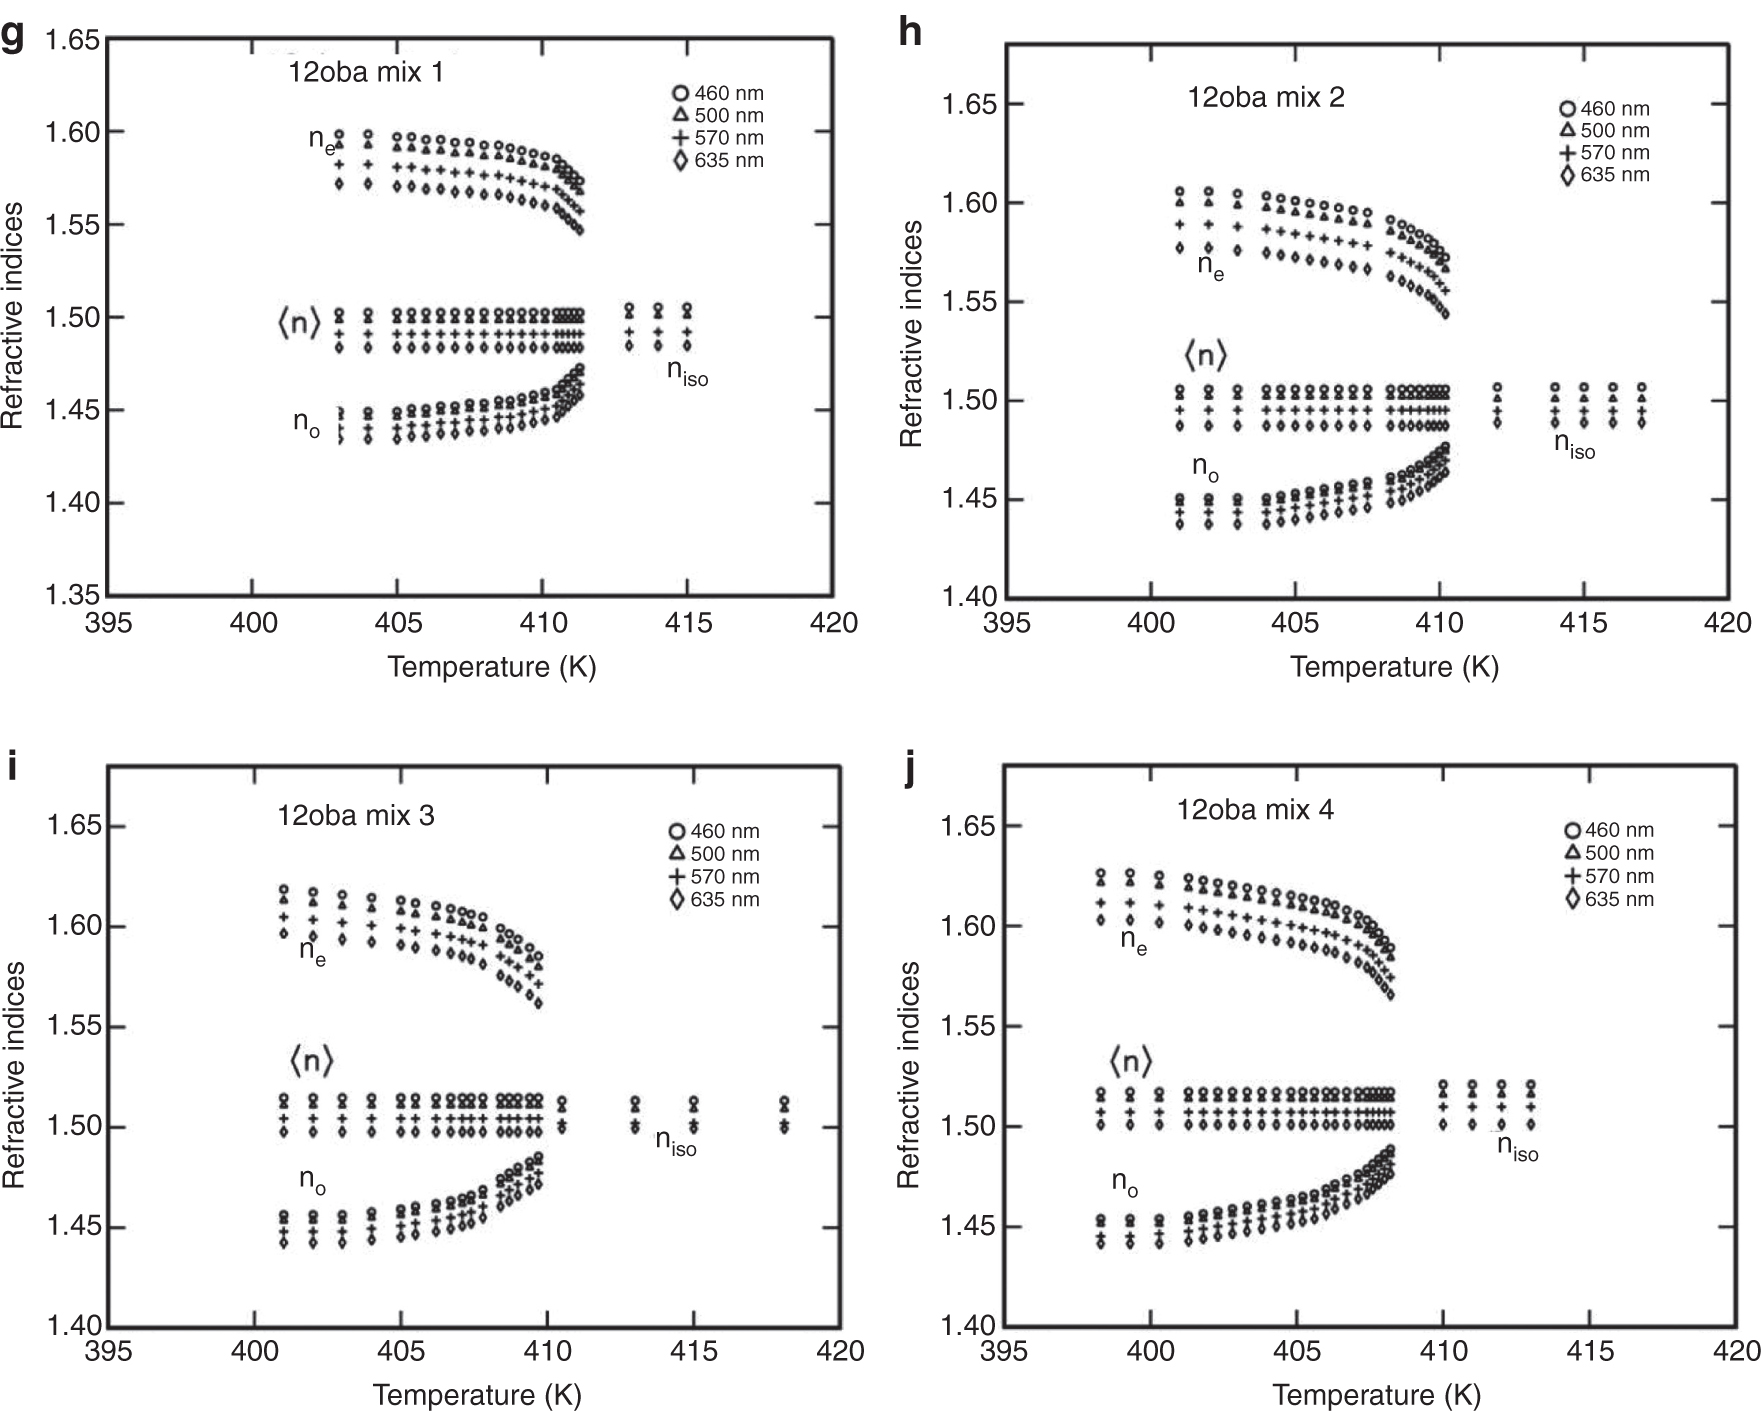
(a) Refractive indices (ne, no) vs. temperature in 11oba pure. (b) Refractive indices (ne, no) vs. temperatue in 11oba mix 1. (c) Refractive indices (ne, no) vs. temperature in 11oba mix 2. (d) Refractive indices (ne, no) vs. temperatue in 11oba mix 3. (e) Refractive indices (ne, no) vs. temperature in 11oba mix 4. (f) Refractive indices (ne, no) vs. temperatue in 12oba pure. (g) Refractive indices (ne, no) vs. temperature in 12oba mix 1. (h) Refractive indices (ne, no) vs. temperature in 12oba mix 2. (i) Refractive indices (ne, no) vs. temperature in 12oba mix 3. (j) Refractive indices (ne, no) vs. temperature in 12oba mix 4.
From Figure 5a–e, it is observed that the value of ne increased from 1.4 % to 13.1 % for 11oba mix 1 to 11oba mix 4 in comparison with the 11oba pure compound, while the value of no increased from 1.5 % to 14.1 %, respectively, and in the case of 12oba mix 1 to mix 4, the values of ne and no have been increased, with small amounts from 0.2 % to 2.3 % in comparison with the 12oba pure compound in the saturated nematic thermal region.
3.5 Determination of Birefringence (δn)
The birefringence (δn) with temperature plays an important role in display devices. It is the difference between ne and no measured for different nanocomposites mix 1, mix 2, mix 3 and mix 4 at different wavelengths (460, 500, 570 and 635 nm). The value of δn obtained increased with the decrease in wavelength as shown in Figure 6a–r.
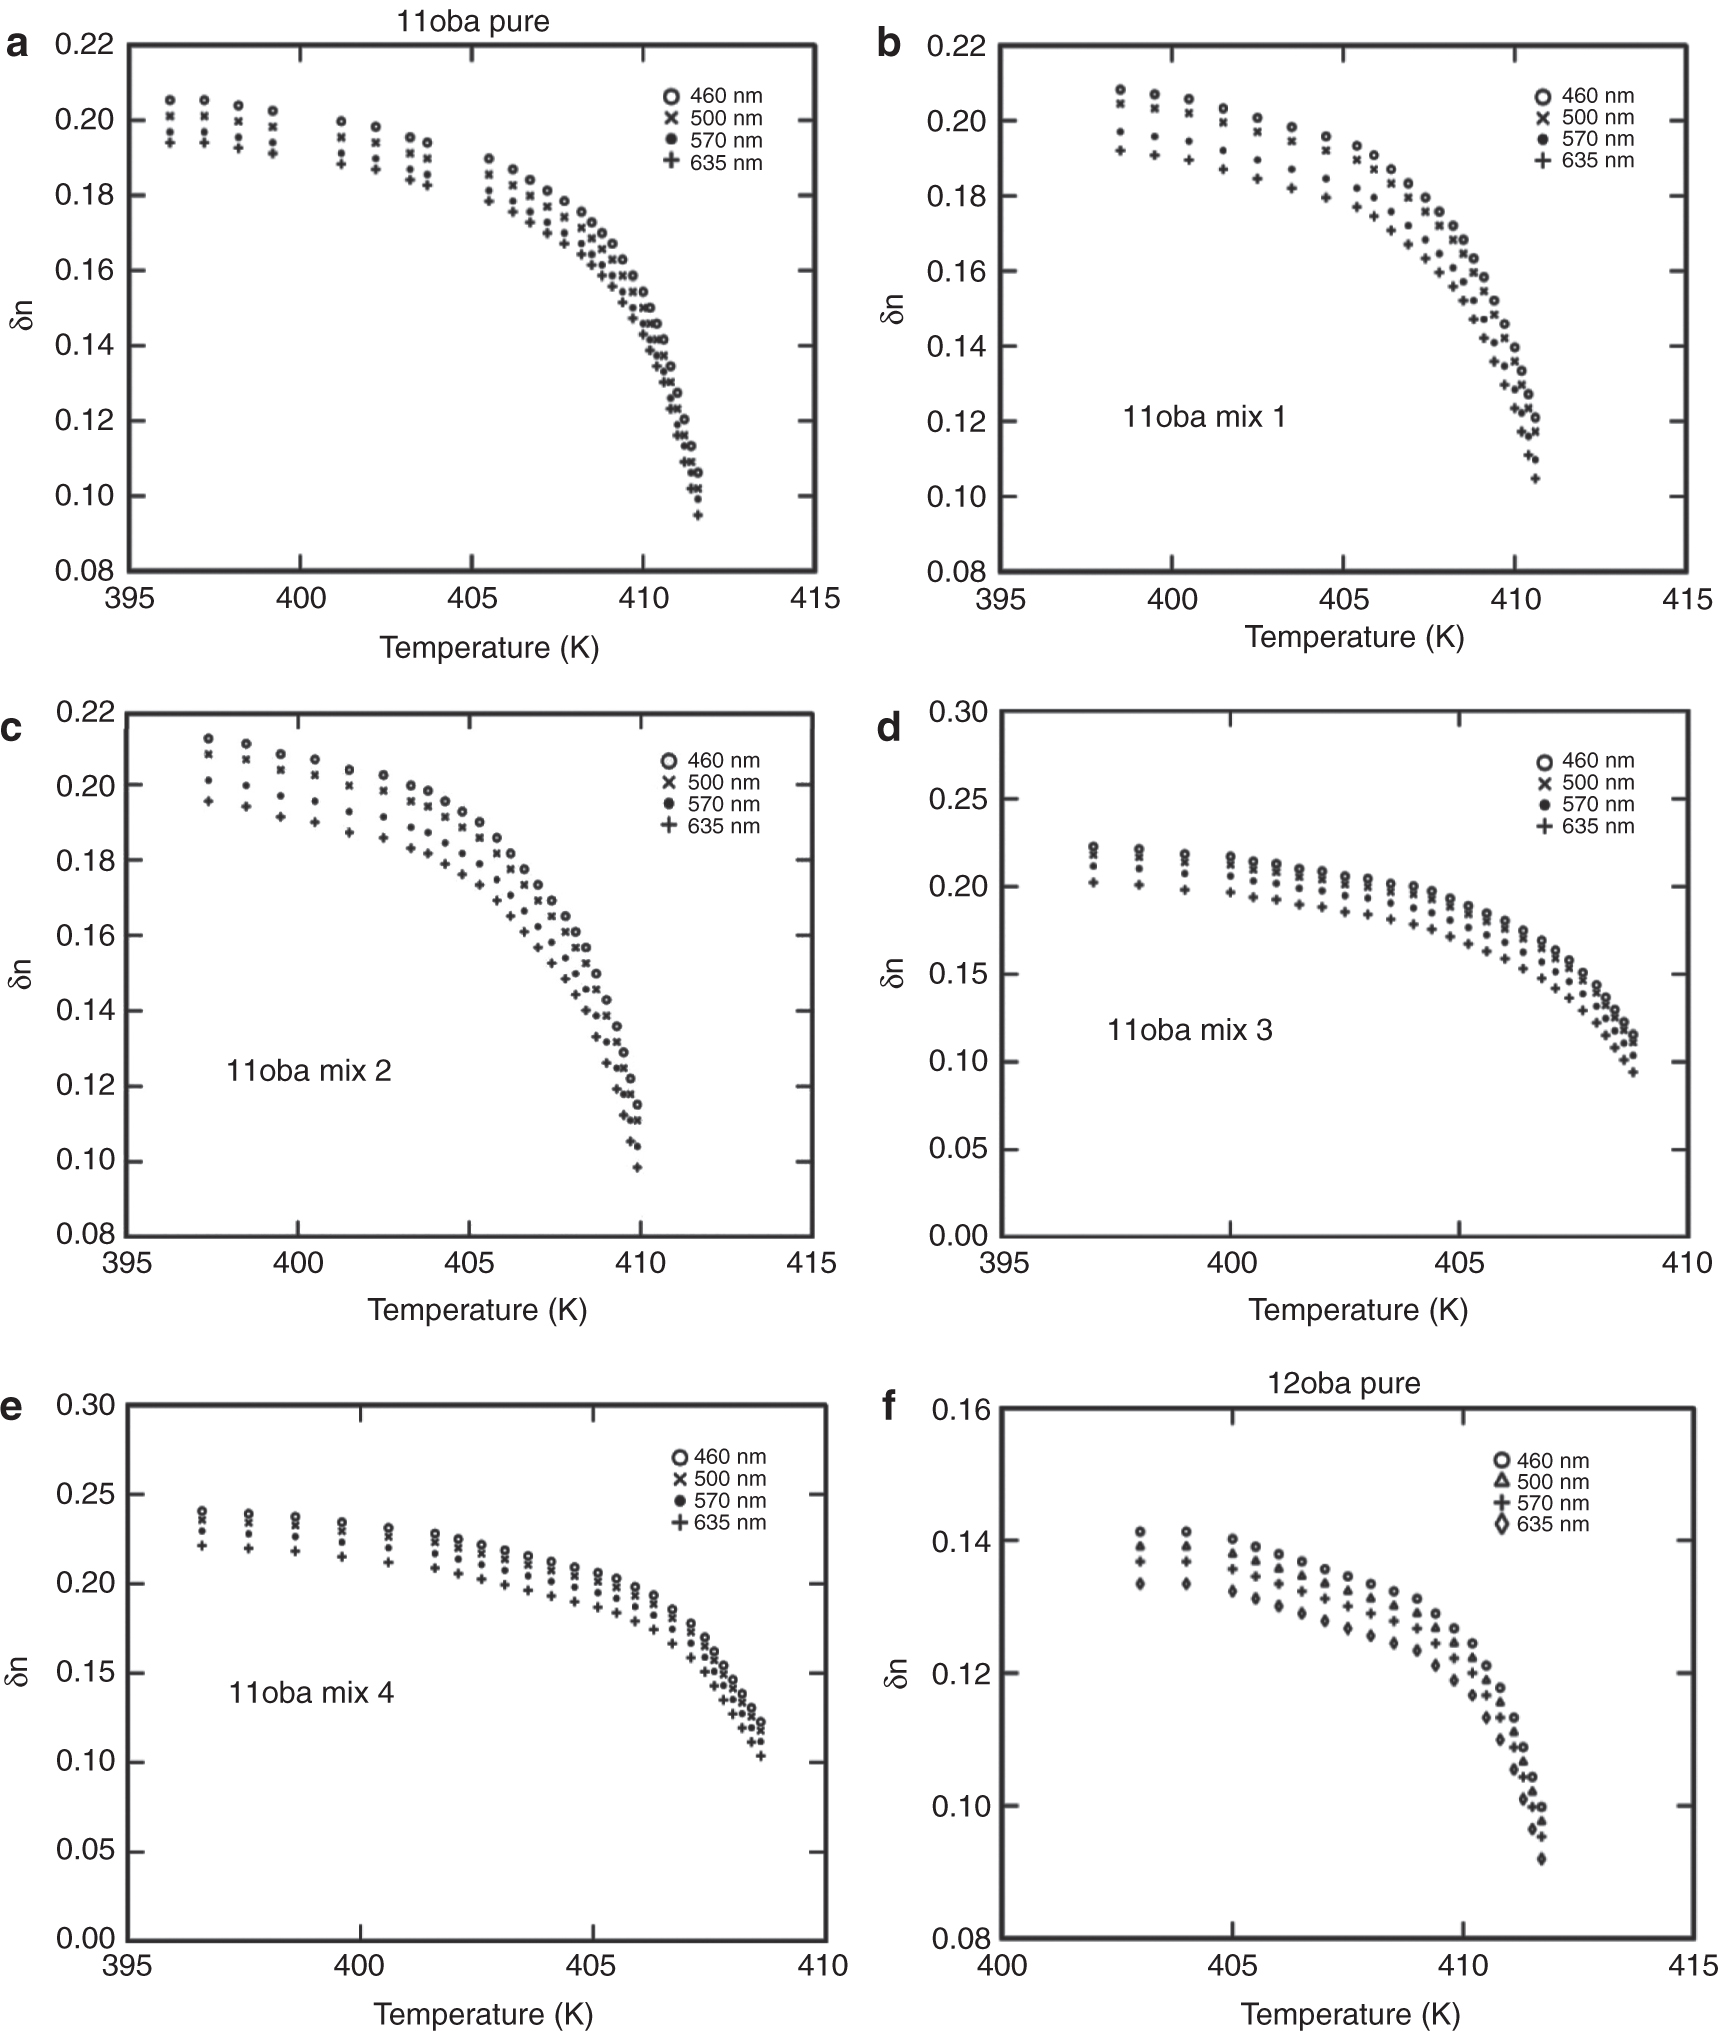
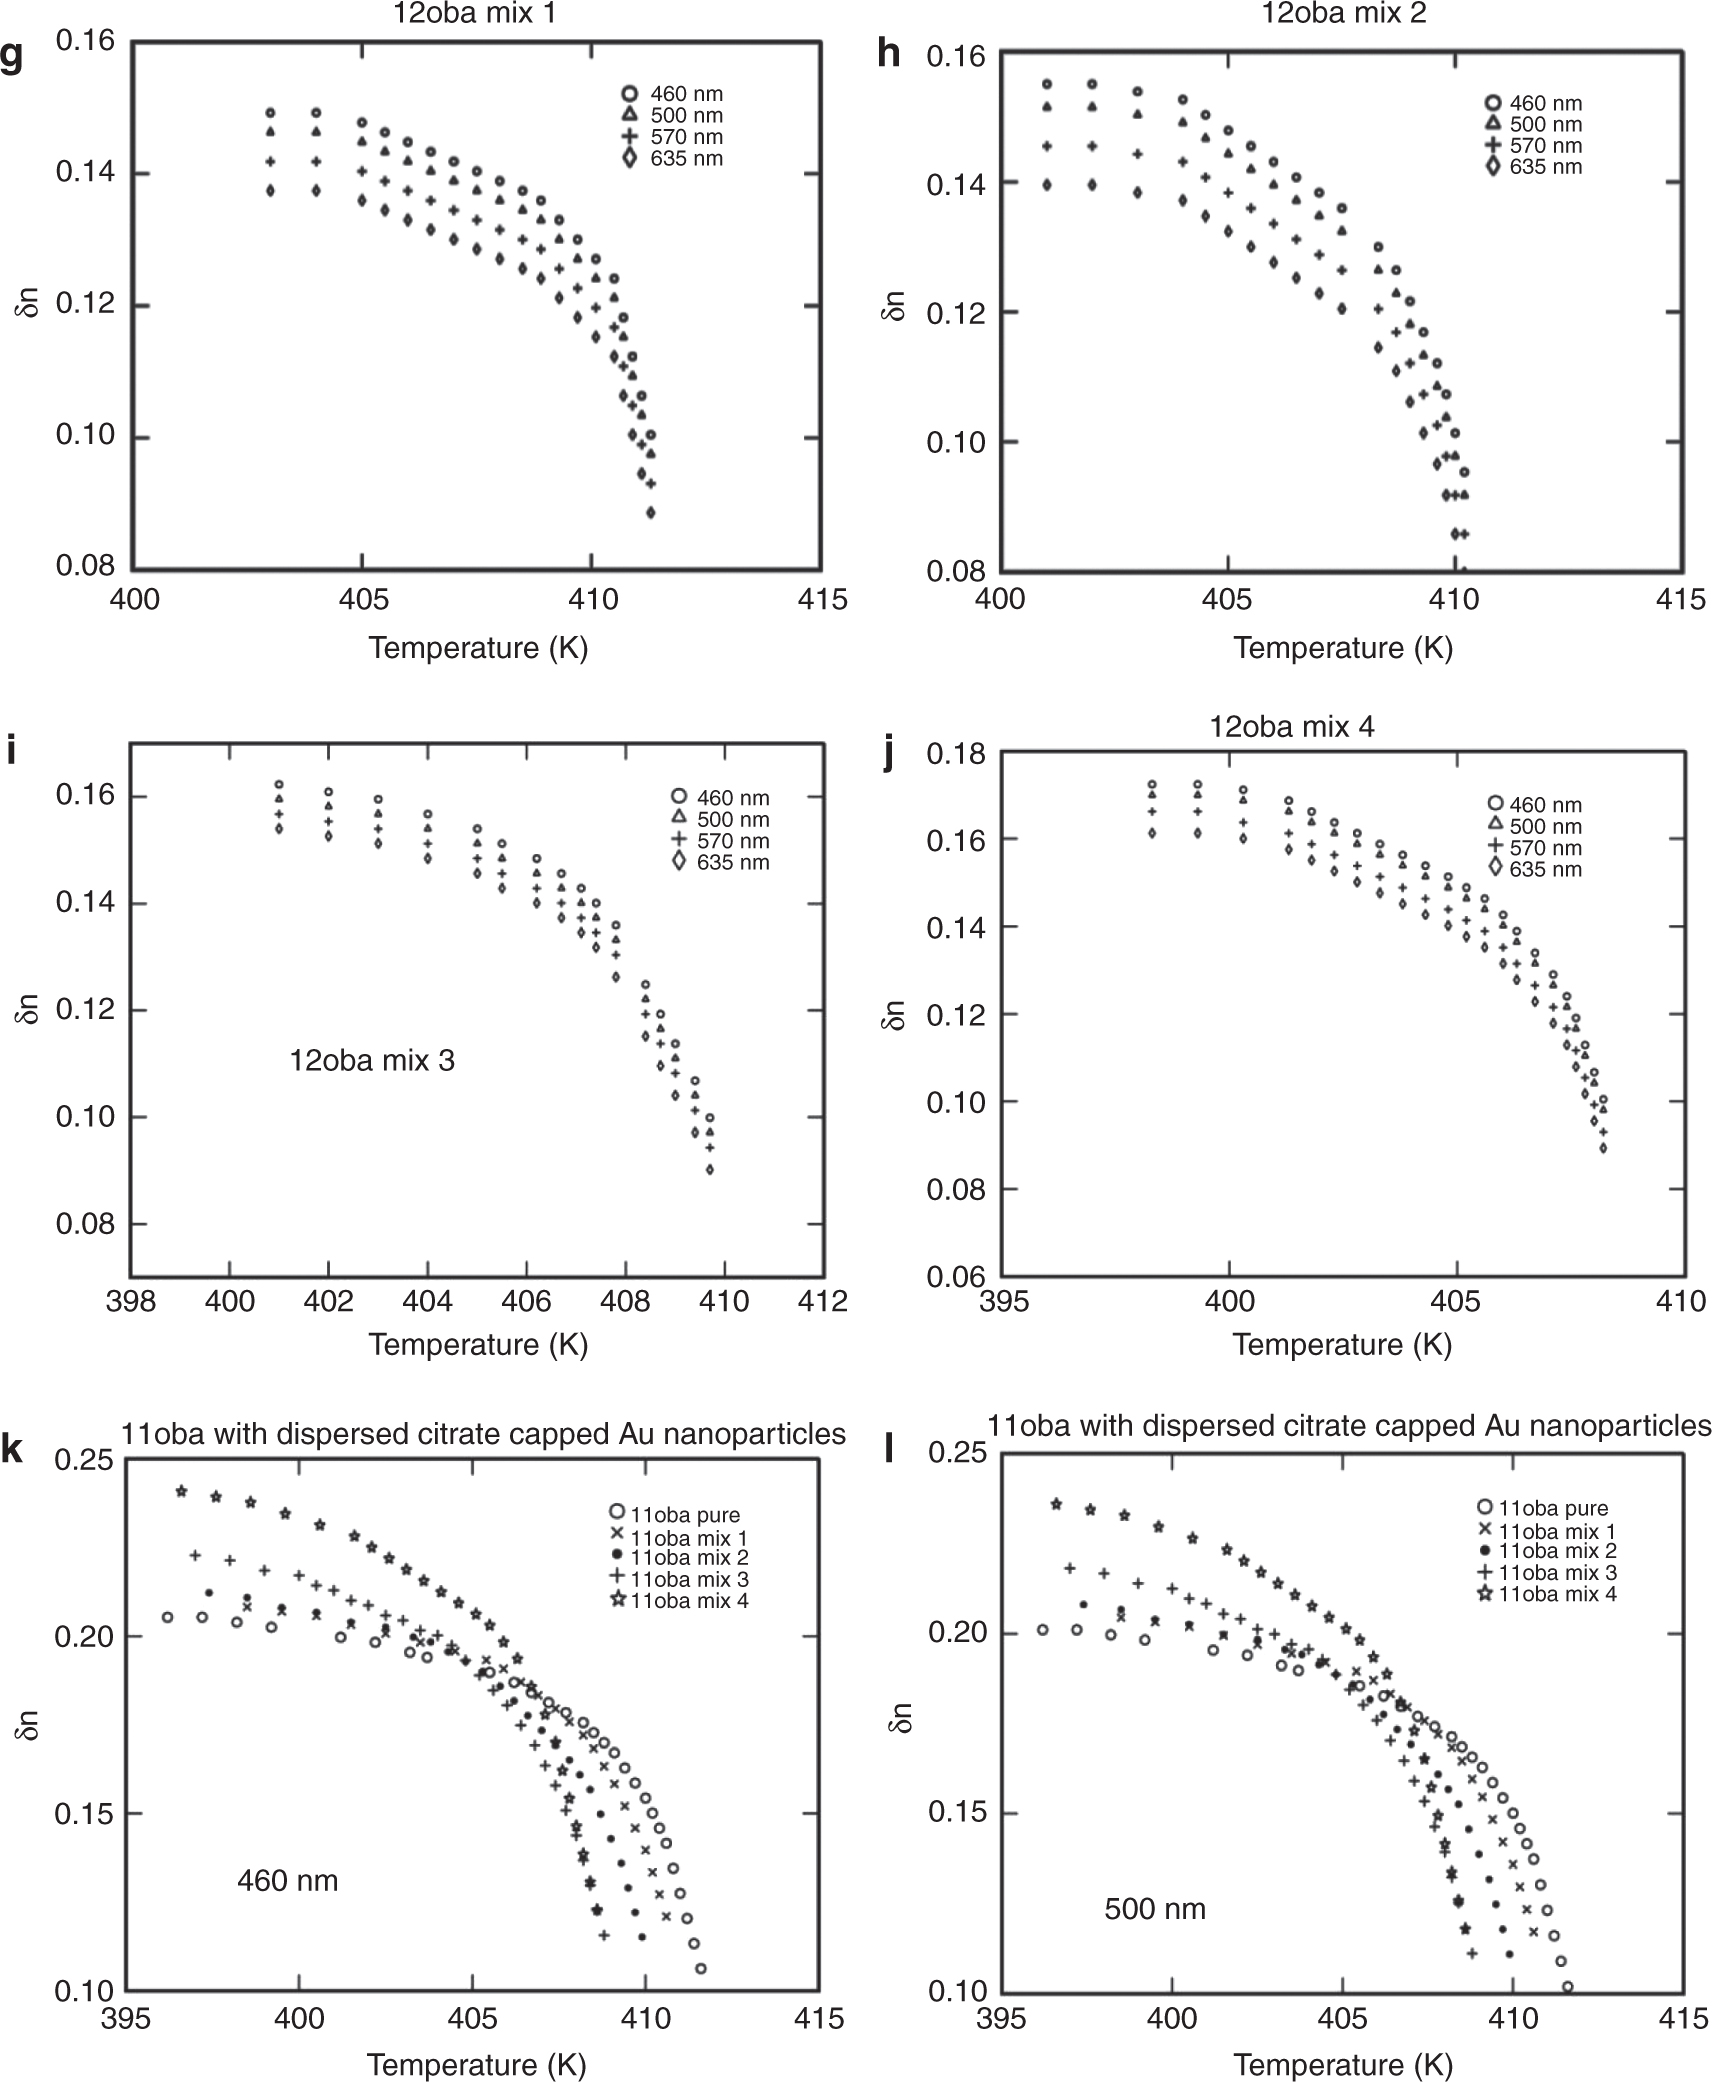
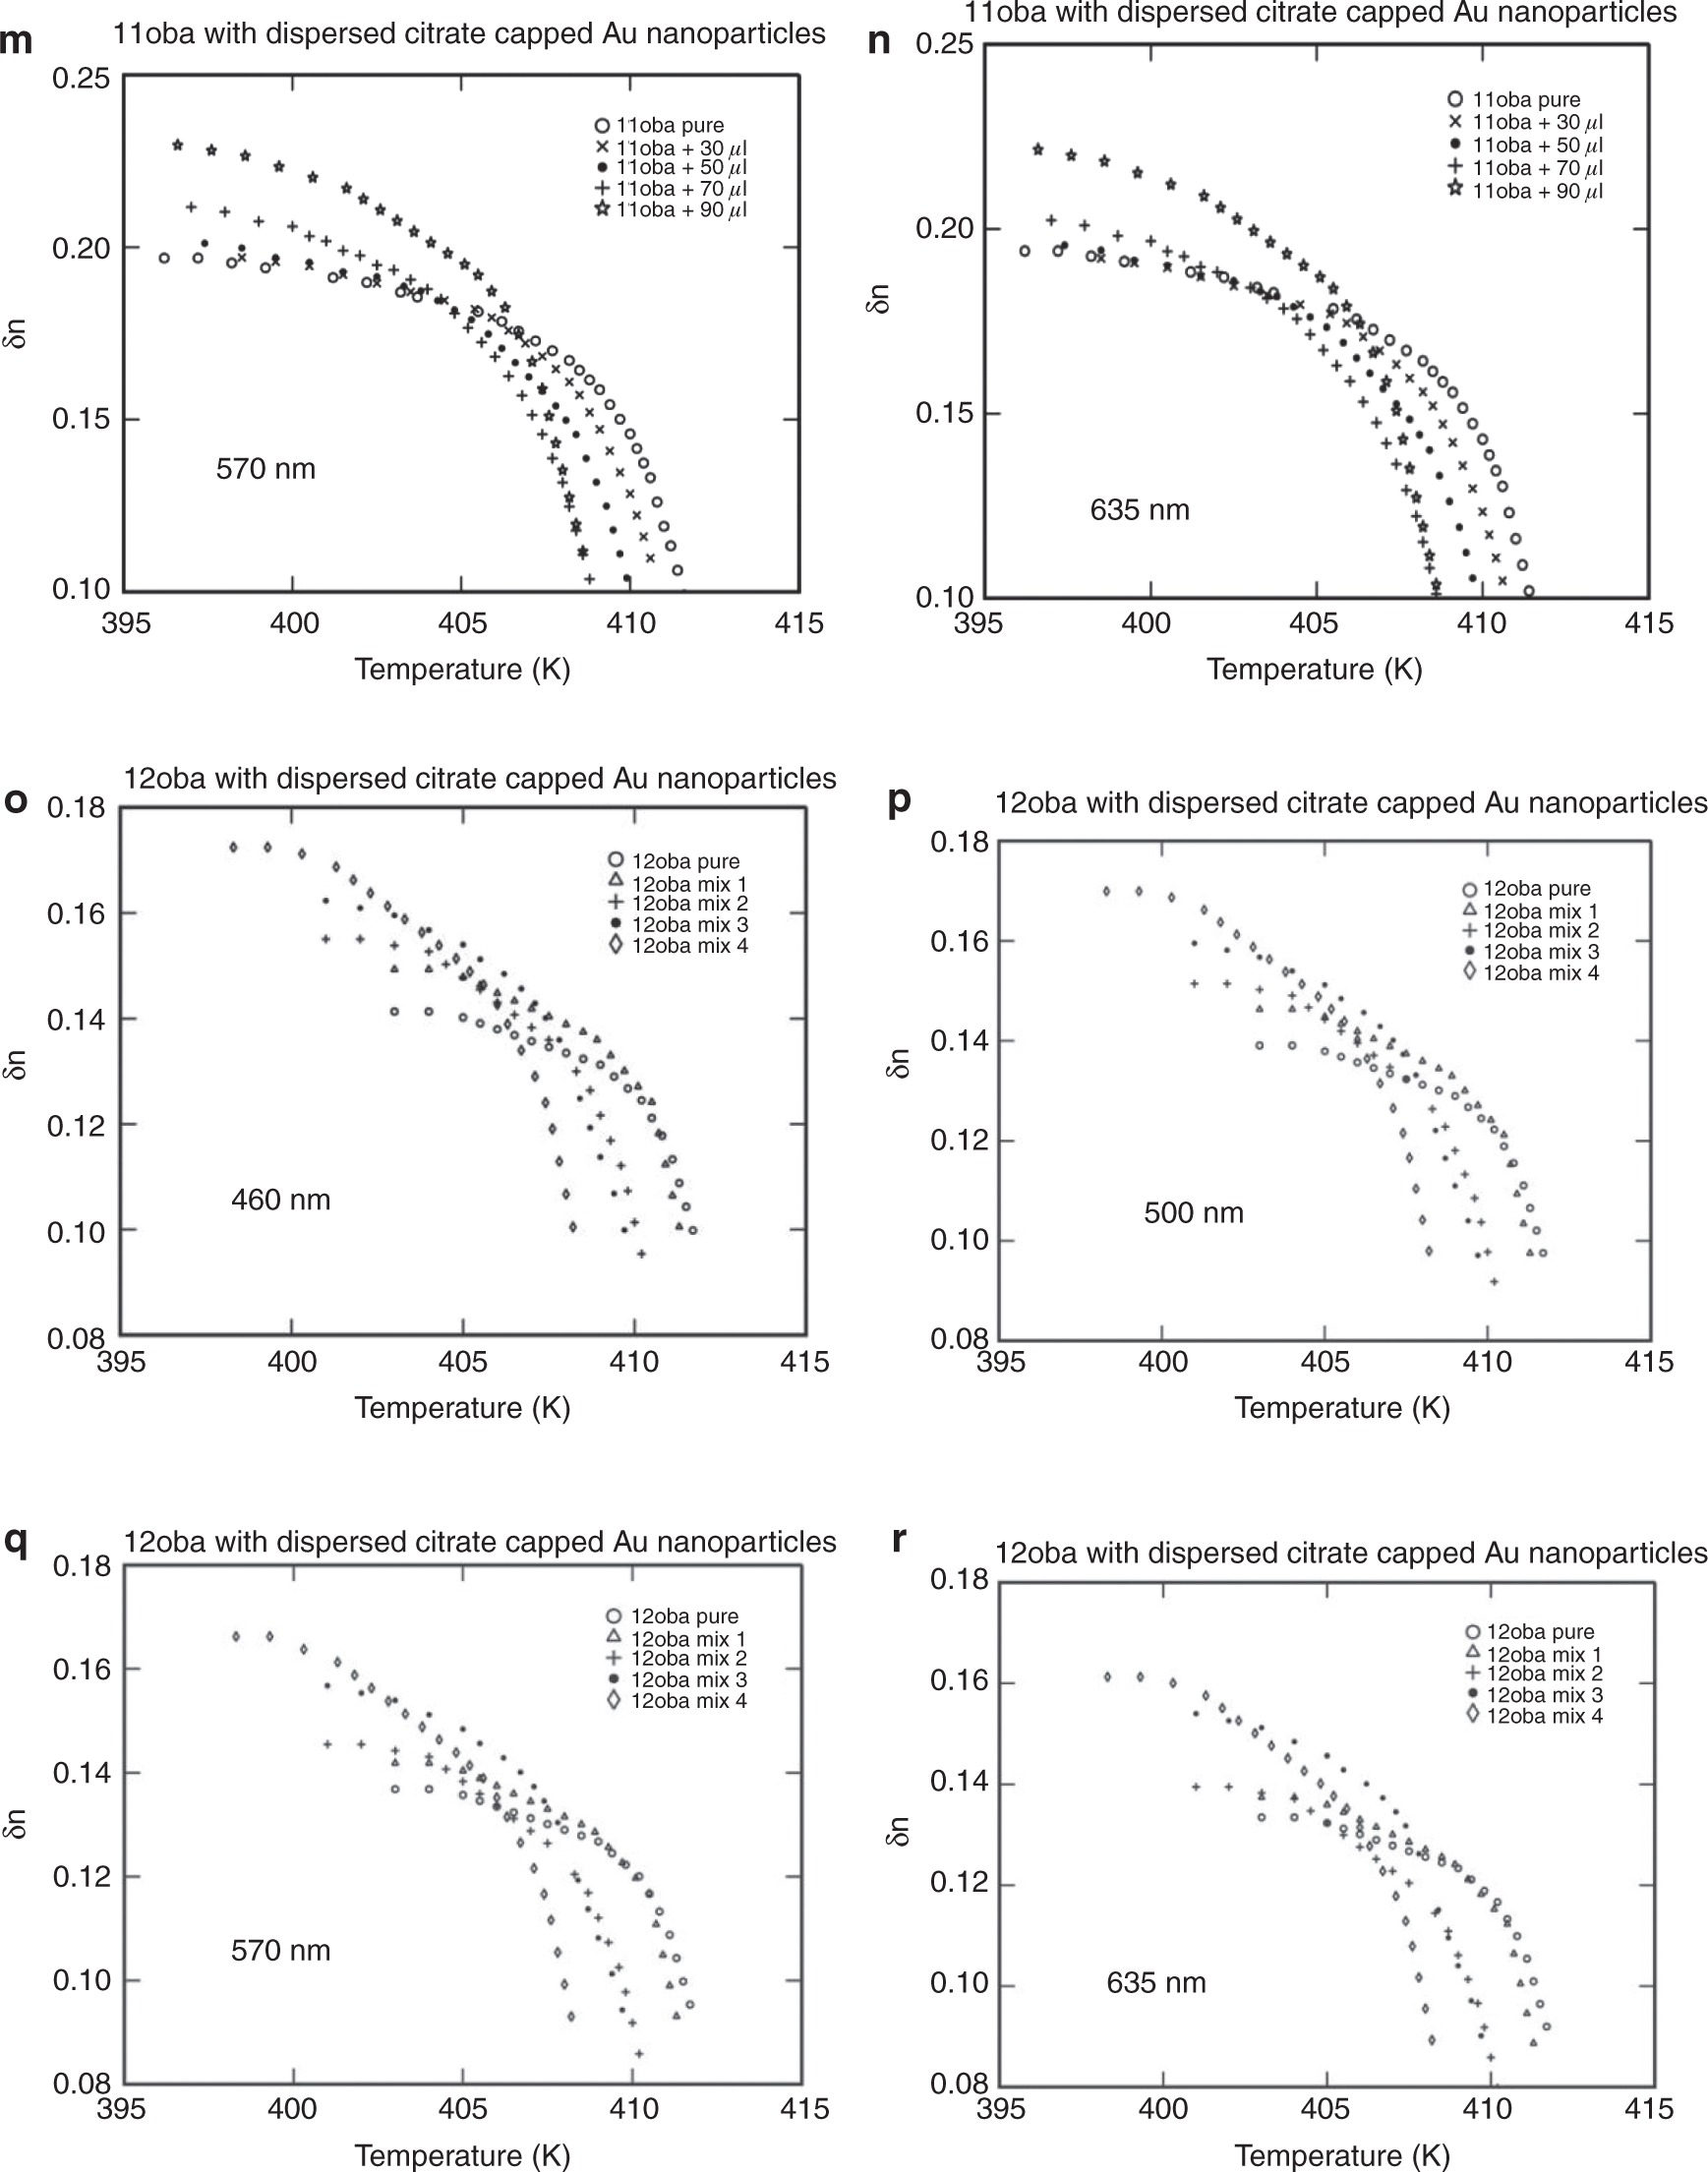
(a) Birefringence δn vs. temperature in 11oba pure at various wavelengths. (b) Birefringence δn vs. temperature in 11oba mix 1 at various wavelengths. (c) Birefringence δn vs. temperature in 11oba mix 2 at various wavelengths. (d) Birefringence δn vs. temperature in 11oba mix 3 at various wavelengths. (e) Birefringence δn vs. temperature in 11oba mix 4 at various wavelengths. (f) Birefringence δn vs. temperature in 12oba pure at various wavelengths. (g) Birefringence δn vs. temperature in 12oba mix 1 at various wavelengths. (h) Birefringence δn vs. temperature in 12oba mix 2 at various wavelengths. (i) Birefringence δn vs. temperature in 12oba mix 3 at various wavelengths. (j) Birefringence δn vs. temperature in 12oba mix 4 at various wavelengths. (k) Birefringence δn vs. temperature in 11oba with dispersed citrate-capped Gnps at various concentrations for 460 nm. (l) Birefringence δn vs. temperature in 11oba with dispersed citrate-capped Gnps at various concentrations for 500 nm. (m) Birefringence δn vs. temperature in 11oba with dispersed citrate-capped Gnps at various concentrations for 570 nm. (n) Birefringence δn vs. temperature in 11oba with dispersed citrate-capped Gnps at various concentrations for 635 nm. (o) Birefringence δn vs. temperature in 12oba with dispersed citrate-capped Gnps at various concentrations for 460 nm. (p) Birefringence δn vs. temperature in 12oba with dispersed citrate-capped Gnps at various concentrations for 500 nm. (q) Birefringence δn vs. temperature in 12oba with dispersed citrate-capped Gnps at various concentrations for 570 nm. (r) Birefringence δn vs. temperature in 12oba with dispersed citrate-capped Gnps at various concentrations for 635 nm.
As the concentration of the dispersed citrate-capped Gnps increased, the nematic transition temperature reduced in all concentrations measured. At first, I-N transition, i.e. in the high temperature regions, the difference in the values of birefringence will be smaller and increases more prominently in the low-temperature region, after crossing the fluctuation-dominated non-linear region in a short thermal range. The values of δn in the pure LC compounds 11oba and 12oba at the stabilized nematic region are enhanced from 2.81 % to18.86 % (460 nm), 1.62 %–18.91 % (500 nm), 1.54 %–18.35 % (570 nm) and 1.4 %–17.79 % (635 nm) with the dispersion of citrate-capped Gnps in increasing concentrations. This shows that the increment in values of δn in 11oba and 12oba with the dispersion of various concentrations of citrate-capped Gnps improves the molecular alignment along with orientational order parameter S of the LC molecules. The same phenomenon is observed in the other LC materials by the dispersion of ZnO and TiO2 [25], [39]. The citrate-capped Gnps captures the impurity ions in 11oba and 12oba, and the citrate-capped Gnps have greater dipole moment relative to LCs. Thereby, citrate-capped Gnps produce higher electric torque than molecules of the LC compound. Because of this, the electro-optical properties of 11oba and 12oba are enhanced by the dispersion of citrate-capped Gnps [40], [41].
Figure 6a–j shows the variation in δn with respect to temperature at different wavelengths, and Figure 6k to r shows the variation of δn at a particular wavelength for different concentrations with respect to temperature for the compounds 11oba and 12oba, pure and with mix 1, mix 2, mix 3 and mix 4, respectively. In all the graphs, systematic enhancement has been obtained in δn with respect to the different temperatures. The δn values at the stabilized nematic region are enhanced from 2.8 % to 18.9 % in 11oba and from 5.6 % to 22.1 % in 12oba for various wavelengths and with relatively increased concentrations of dispersed citrate-capped Gnps.
3.6 Order Parameter (S)
After the investigations of different optical studies were carried out, the important parameter of LC is order parameter, the parameter which gives the average direction of all LC molecules oriented about the optic axis. The order parameter is determined from the refractive indices data by several methods [42], such as the Kuczynski method (without considering the internal molecular field), the Vuks model (considering the isotropic nature of LCs), the Haller approximation method and the effective geometry parameter model.
3.6.1 Kuczynski Method
The author chose the Kuczynski method for the determination of order parameter S from the birefringence measurements δn without considering the local field experienced by the molecule in the LC nematic phase [43], [44], [45]. The order parameter of LC uniaxial crystal is calculated by the given formula
where δn is the birefringence and Δn is the hypothetical birefringence in the case of perfect order (crystalline state). According to Kuczynski et al. [45], [46], the order parameter S can be determined from birefringence δn, a function of temperature, and is built in to the following equation.
where T∗ and β are constants (T∗ is about 0.1–4 °C higher than the I–N transition temperature; the exponent β is near to 0.20). The three adjustable parameters T∗, Δn and β are obtained by varying T∗ and fitting the experimental data for δn to the logarithmic equation. The values of log Δn and β were obtained with the linear regression method by maintaining regression through adjusting the parameter T∗, which is obtained by adding a varied value from 0.1 to 4 °C to the I-N transition temperature to get the best correlation coefficient of the linear regression. The log-log plots of 11oba and 12oba with dispersed citrate-capped Gnps at different wavelengths for a particular concentration are shown in Figure 7a and b. The values of slope(β), regression(R) and log(Δn), Δn and T∗ of the 11oba pure and with mix 1, mix 2, mix 3 and mix 4 are shown in Table 2, while the corresponding values of 12oba pure along with the mixtures are shown in Table 3.
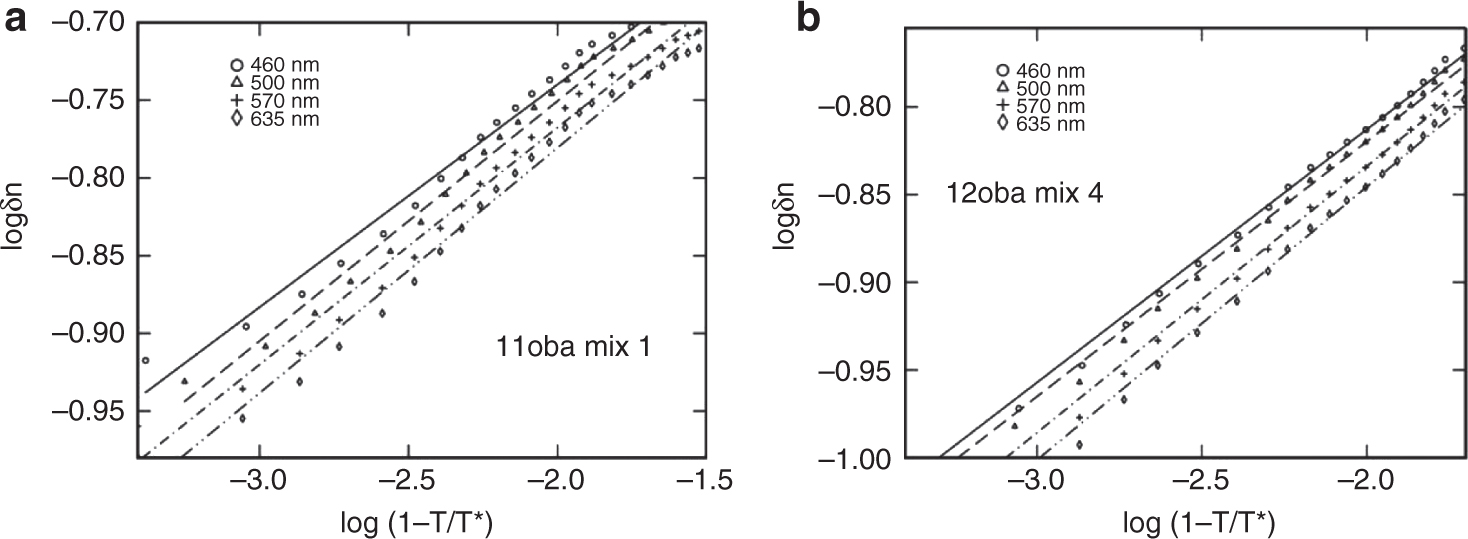
(a) Log-log plot of 11oba mix 1. (b) Log-log plot of 12oba mix 4.
Values of T∗, slope(β), regression(R), log(Δn) and Δn of the 11oba pure and with mix 1, mix 2, mix 3 and mix 4.
| S. No | LCNPs | T∗ | Slope | Regression | Log(Δn) | Δn |
|---|---|---|---|---|---|---|
| 11oba + citrate-capped Gnps – 460 nm | ||||||
| 1. | 11oba pure | 411.70 | 0.1500 | 0.9890 | −0.4573 | 0.3491 |
| 2. | 11oba mix 1 | 410.77 | 0.1432 | 0.9931 | −0.4535 | 0.3519 |
| 3. | 11oba mix 2 | 410.03 | 0.1529 | 0.9926 | −0.4486 | 0.3560 |
| 4. | 11oba mix 3 | 408.84 | 0.1423 | 0.9747 | −0.4349 | 0.3673 |
| 5. | 11oba mix 4 | 408.62 | 0.1327 | 0.9912 | −0.4193 | 0.3805 |
| 11oba + citrate-capped Gnps – 500 nm | ||||||
| 6. | 11oba pure | 411.71 | 0.1544 | 0.9889 | −0.4695 | 0.3471 |
| 7. | 11oba mix 1 | 410.03 | 0.1529 | 0.9926 | −0.4338 | 0.3485 |
| 8. | 11oba mix 2 | 409.99 | 0.1488 | 0.9888 | −0.4509 | 0.3540 |
| 9. | 11oba mix 3 | 408.84 | 0.1462 | 0.9752 | −0.4379 | 0.3648 |
| 10. | 11oba mix 4 | 408.62 | 0.1365 | 0.9915 | −0.4223 | 0.3780 |
| 11oba + citrate-capped Gnps – 570 nm | ||||||
| 11. | 11oba pure | 411.7 | 0.1583 | 0.9893 | −0.4626 | 0.3446 |
| 12. | 11oba mix 1 | 410.76 | 0.1524 | 0.9928 | −0.4626 | 0.3446 |
| 13. | 11oba mix 2 | 409.985 | 0.1546 | 0.9884 | −0.4567 | 0.3494 |
| 14. | 11oba mix 3 | 408.84 | 0.1548 | 0.9750 | −0.4380 | 0.3647 |
| 15. | 11oba mix 4 | 408.62 | 0.1427 | 0.9932 | −0.4238 | 0.3768 |
| 11oba + citrate-capped Gnps – 635 nm | ||||||
| 16. | 11oba pure | 411.69 | 0.1611 | 0.9886 | −0.4645 | 0.3431 |
| 17. | 11oba mix 1 | 410.76 | 0.1580 | 0.9929 | −0.4644 | 0.3433 |
| 18. | 11oba mix 2 | 409.99 | 0.1617 | 0.9896 | −0.4583 | 0.3481 |
| 19. | 11oba mix 3 | 408.84 | 0.1657 | 0.9759 | −0.4486 | 0.3562 |
| 20. | 11oba mix 4 | 408.62 | 0.1517 | 0.9959 | −0.4243 | 0.3765 |
Values of T∗, slope(β), regression(R), log(Δn) and Δn of the 12oba pure and with mix 1, mix 2, mix 3 and mix 4.
| S. No | LCNPs | T∗ | Slope | Regression | Log(Δn) | Δn |
|---|---|---|---|---|---|---|
| 12oba + citrate-capped Gnps – 460 nm | ||||||
| 1. | 12oba pure | 412.53 | 0.1561 | 0.9803 | −0.5657 | 0.2718 |
| 2. | 12oba mix 1 | 412.16 | 0.1565 | 0.9701 | −0.5501 | 0.2817 |
| 3. | 12oba mix 2 | 410.56 | 0.1535 | 0.9970 | −0.5449 | 0.2852 |
| 4. | 12oba mix 3 | 409.90 | 0.1520 | 0.9874 | −0.5399 | 0.2885 |
| 5. | 12oba mix 4 | 408.36 | 0.1443 | 0.9968 | −0.5242 | 0.2989 |
| 12oba + citrate-capped Gnps – 500 nm | ||||||
| 6. | 12oba pure | 412.51 | 0.1577 | 0.9806 | −0.5697 | 0.2693 |
| 7. | 12oba mix 1 | 412.14 | 0.1591 | 0.9704 | −0.5578 | 0.2792 |
| 8. | 12oba mix 2 | 410.52 | 0.1559 | 0.9972 | −0.5508 | 0.2813 |
| 9. | 12oba mix 3 | 409.89 | 0.1465 | 0.9872 | −0.5449 | 0.2852 |
| 10. | 12oba mix 4 | 408.35 | 0.1454 | 0.9964 | −0.5289 | 0.2958 |
| 12oba + citrate-capped Gnps – 570 nm | ||||||
| 11. | 12oba pure | 412.51 | 0.1608 | 0.9805 | −0.5710 | 0.2685 |
| 12. | 12oba mix 1 | 412.13 | 0.1645 | 0.9702 | −0.5578 | 0.2768 |
| 13. | 12oba mix 2 | 410.51 | 0.1629 | 0.9971 | −0.5560 | 0.2779 |
| 14. | 12oba mix 3 | 409.89 | 0.1498 | 0.9876 | −0.5466 | 0.2840 |
| 15. | 12oba mix 4 | 408.35 | 0.1518 | 0.9967 | −0.5301 | 0.2951 |
| 12oba + citrate-capped Gnps – 635 nm | ||||||
| 16. | 12oba pure | 412.51 | 0.1657 | 0.9802 | −0.5728 | 0.2674 |
| 17. | 12oba mix 1 | 412.12 | 0.1702 | 0.9700 | −0.5612 | 0.2747 |
| 18. | 12oba mix 2 | 411.51 | 0.1719 | 0.9970 | −0.5583 | 0.2765 |
| 19. | 12oba mix 3 | 409.86 | 0.1531 | 0.9839 | −0.5490 | 0.2824 |
| 20. | 12oba mix 4 | 408.35 | 0.1557 | 0.9966 | −0.5340 | 0.2924 |
The various values of the order parameter S of the molecules of the LC compounds along with citrate-capped Gnps are found wherein as the concentration of citrate-capped Gnps increases, they improve the alignment and have the tendency to orient the LC molecules more properly to the director direction.
The birefringence δn as well as the orientational order parameter S values of 11oba and 12oba pure agreed with the values which are previously determined [47]. δn and S increased with the increase in the concentration of citrate-capped Gnps in pure LCs, and these values agree with the values that were obtained from the experimental techniques.
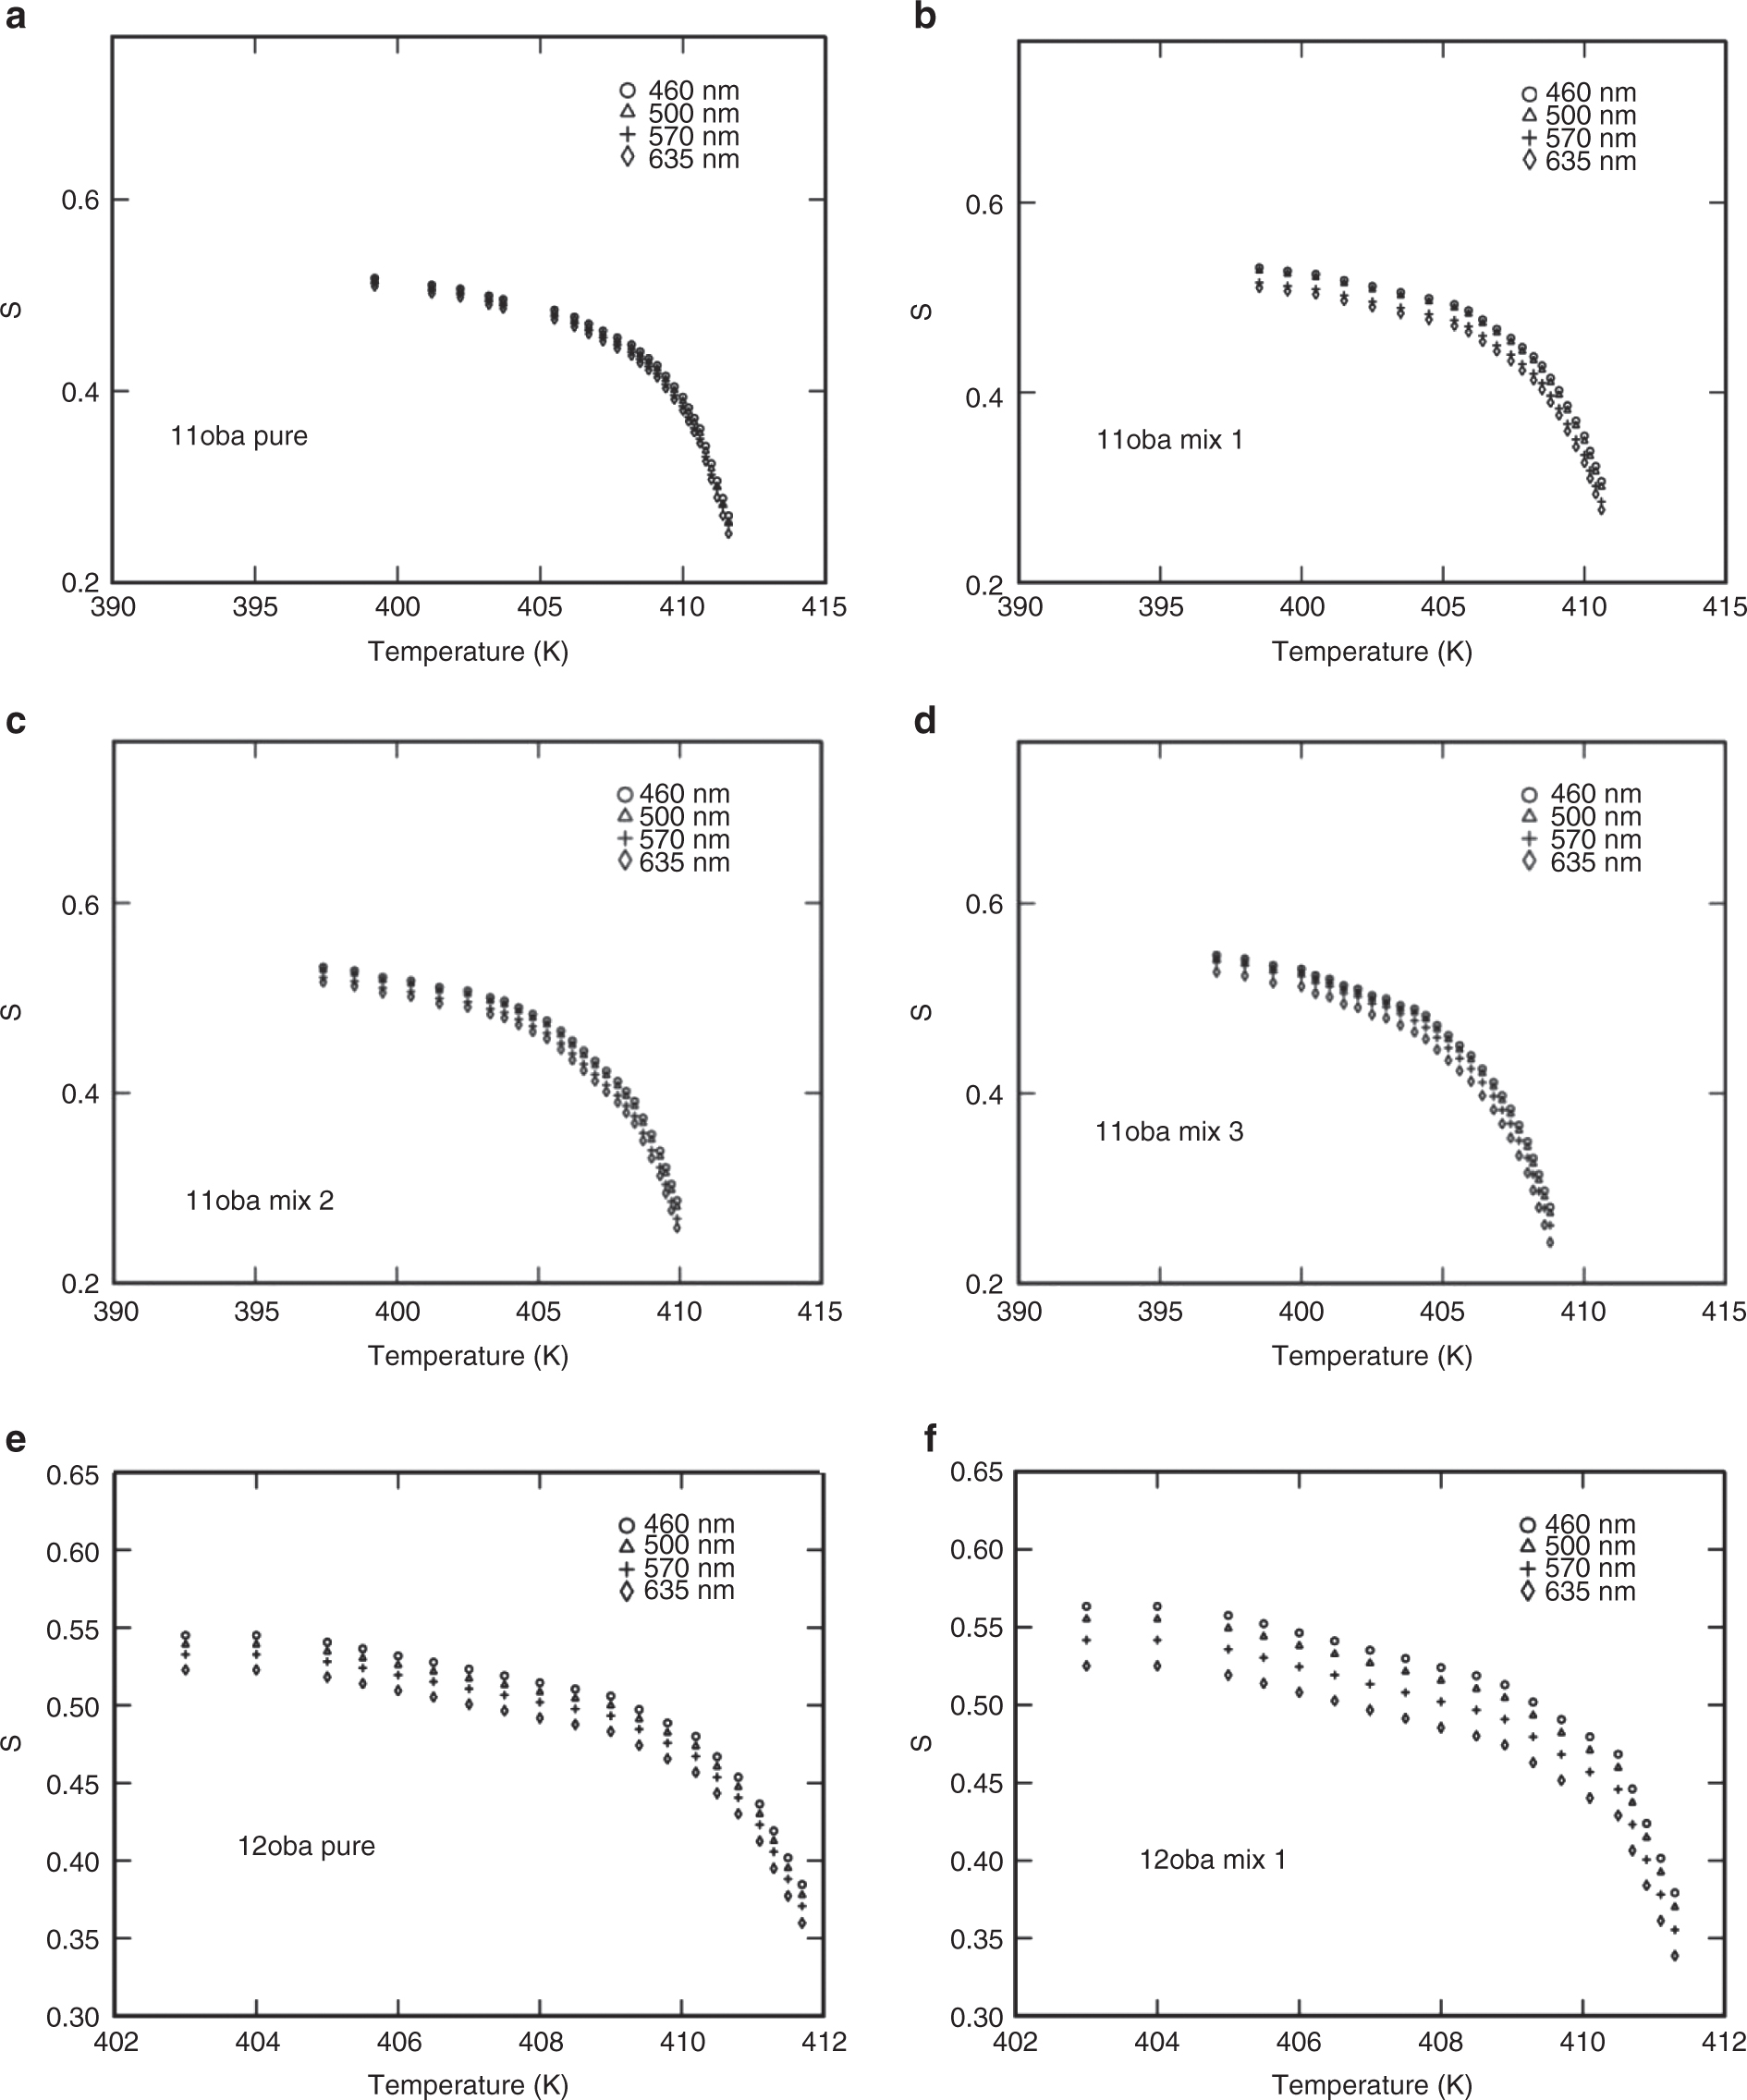
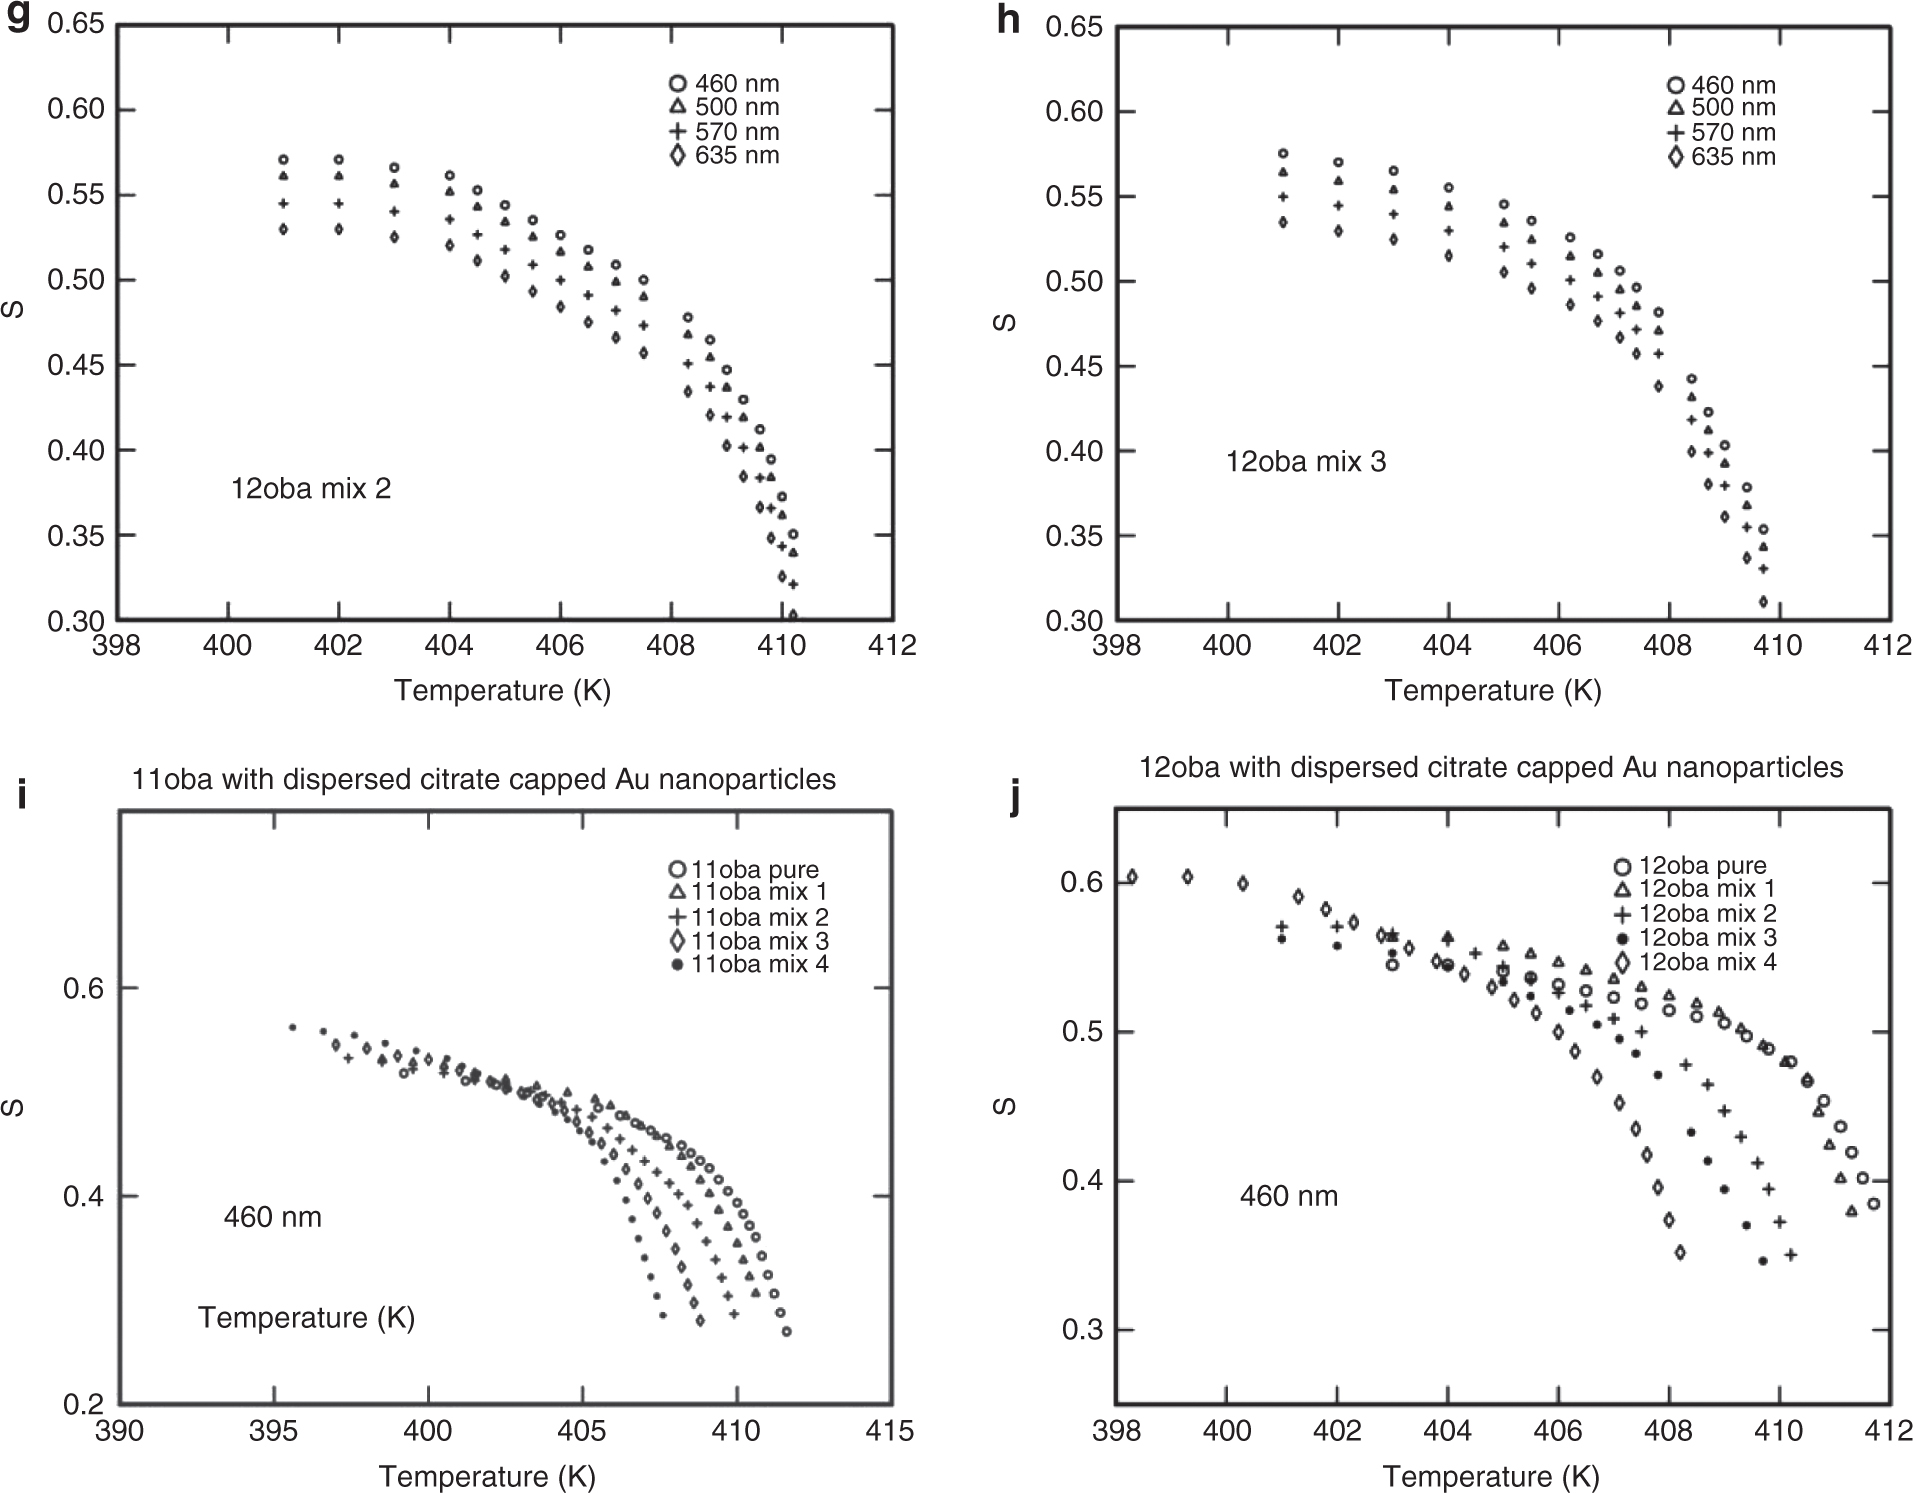
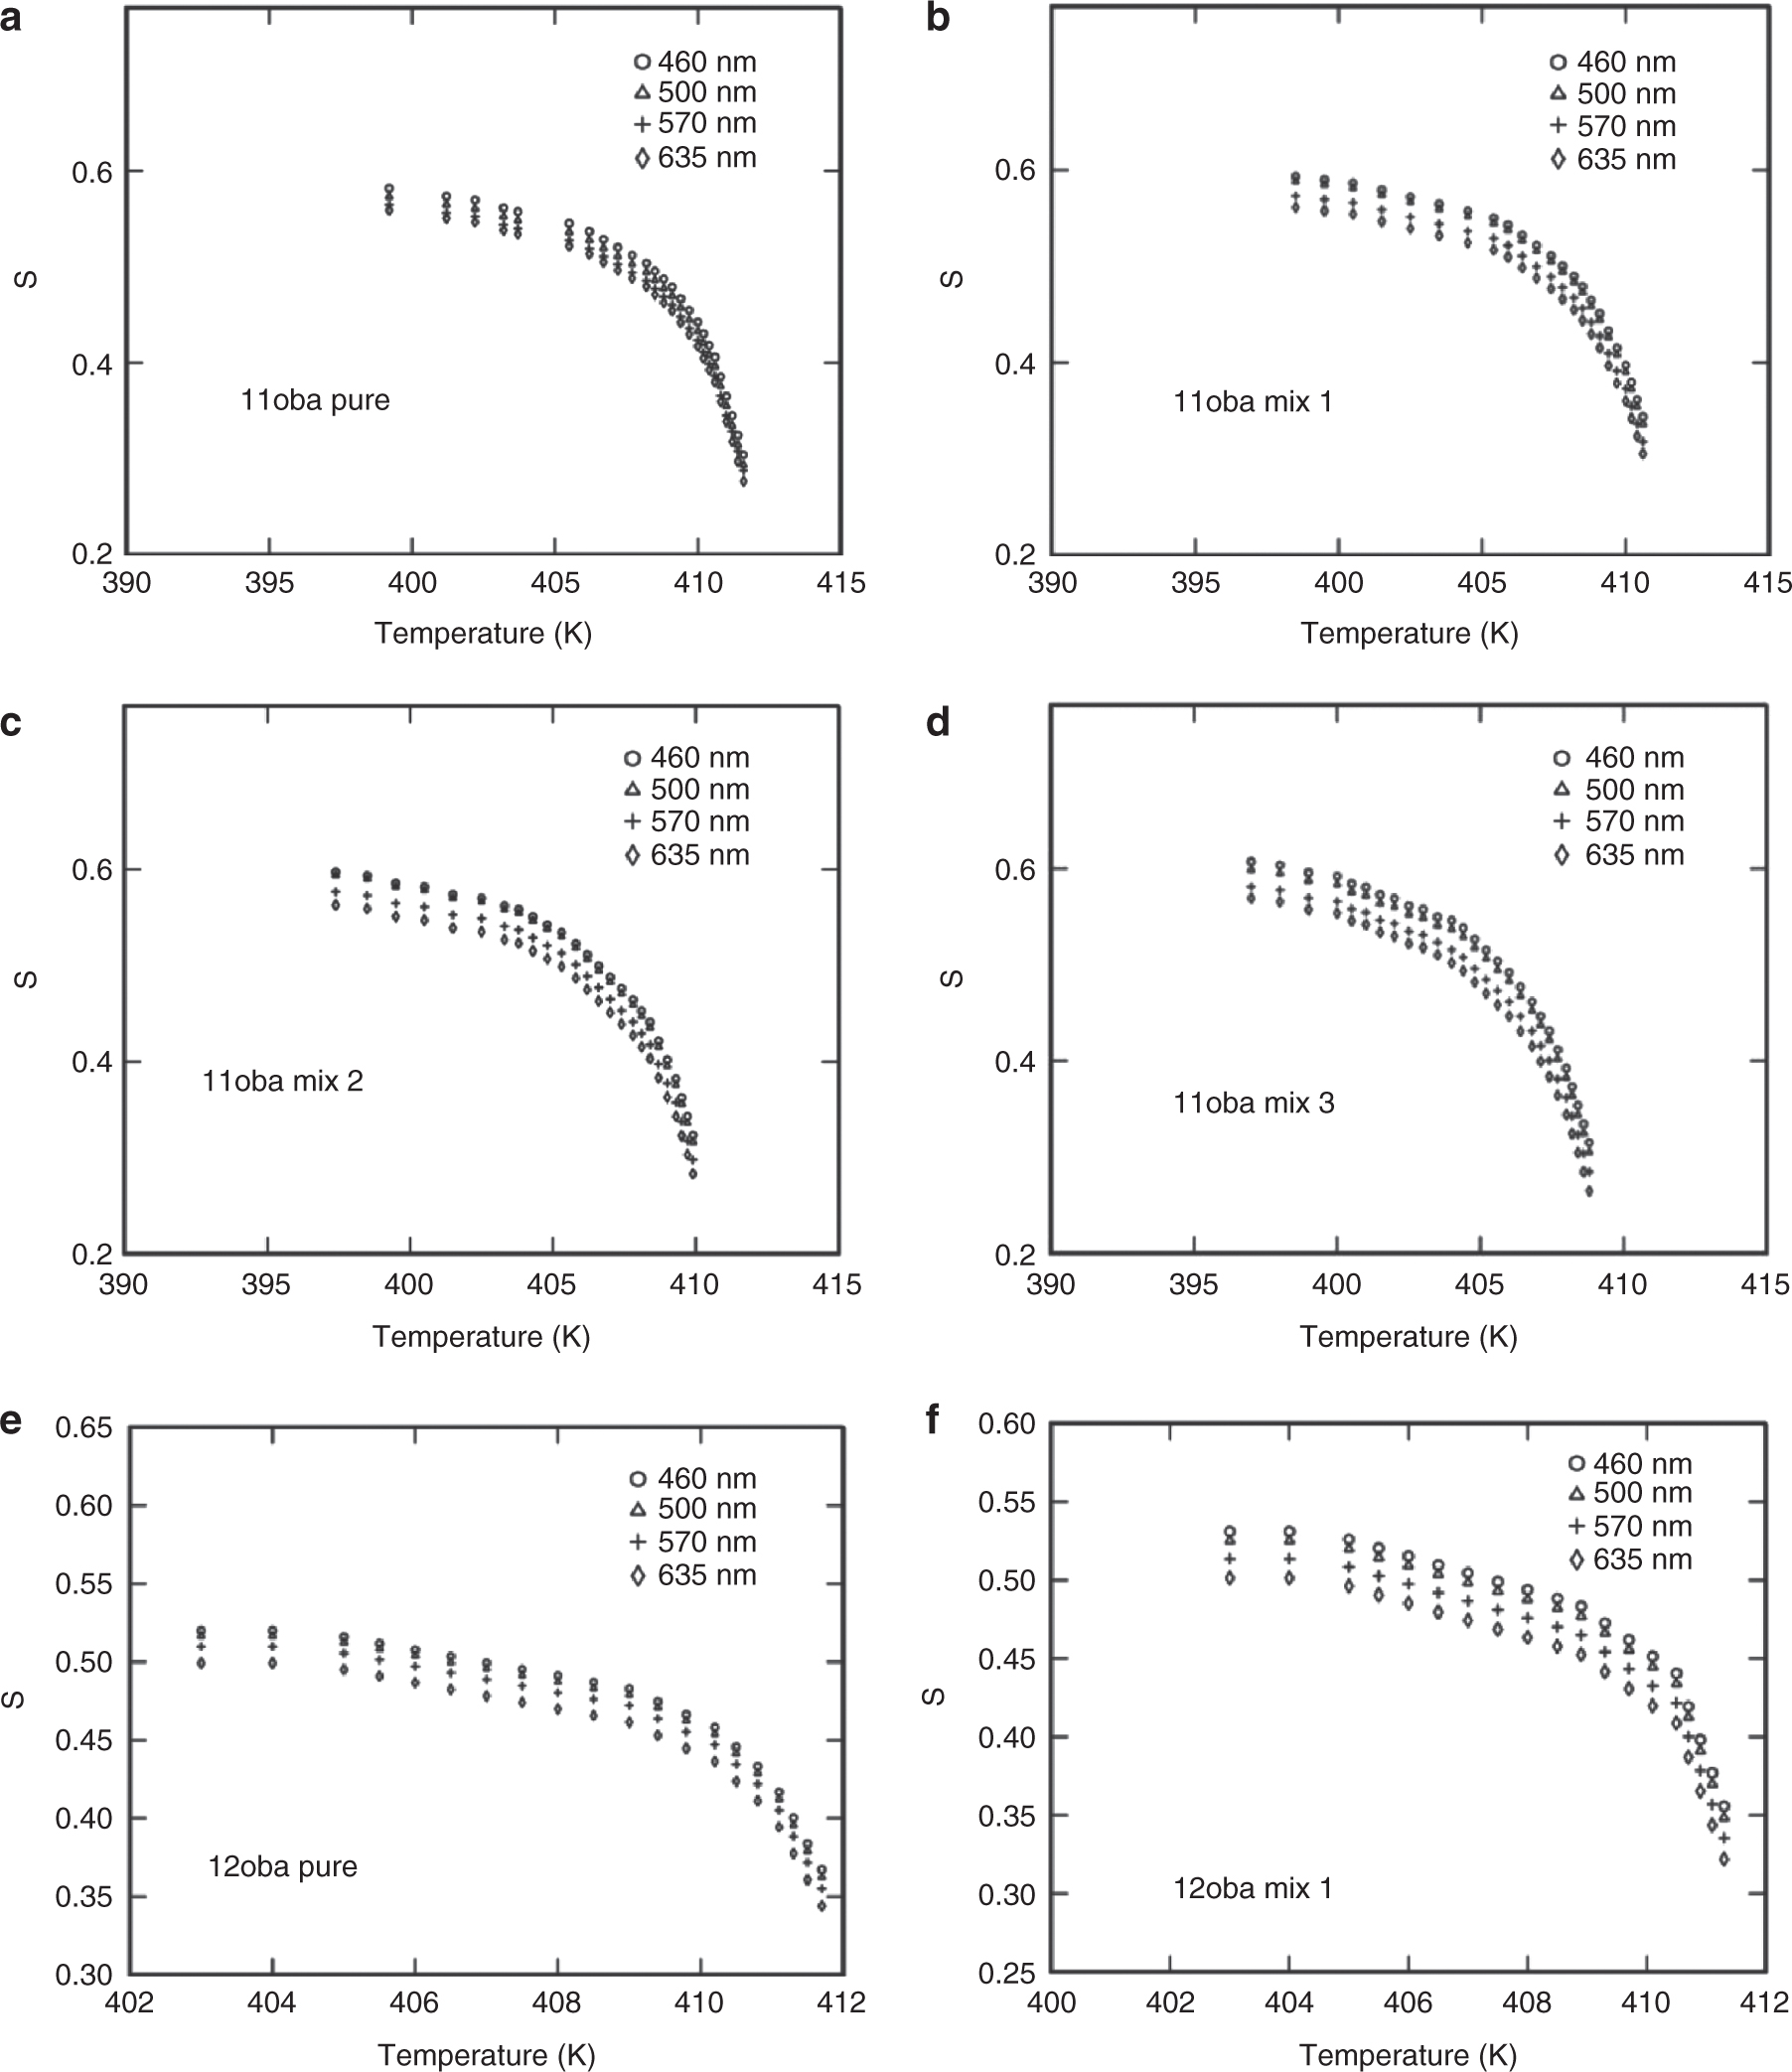
The order parameter values for 11oba and 12oba pure and with dispersed citrate-capped Gnps are presented in Figure 8a and j. Similarly, the variations of the order parameter of 11oba and 12oba pure and mix 1, mix 2, mix 3 and mix 4 across temperature are shown in Figure 8l and n, respectively.

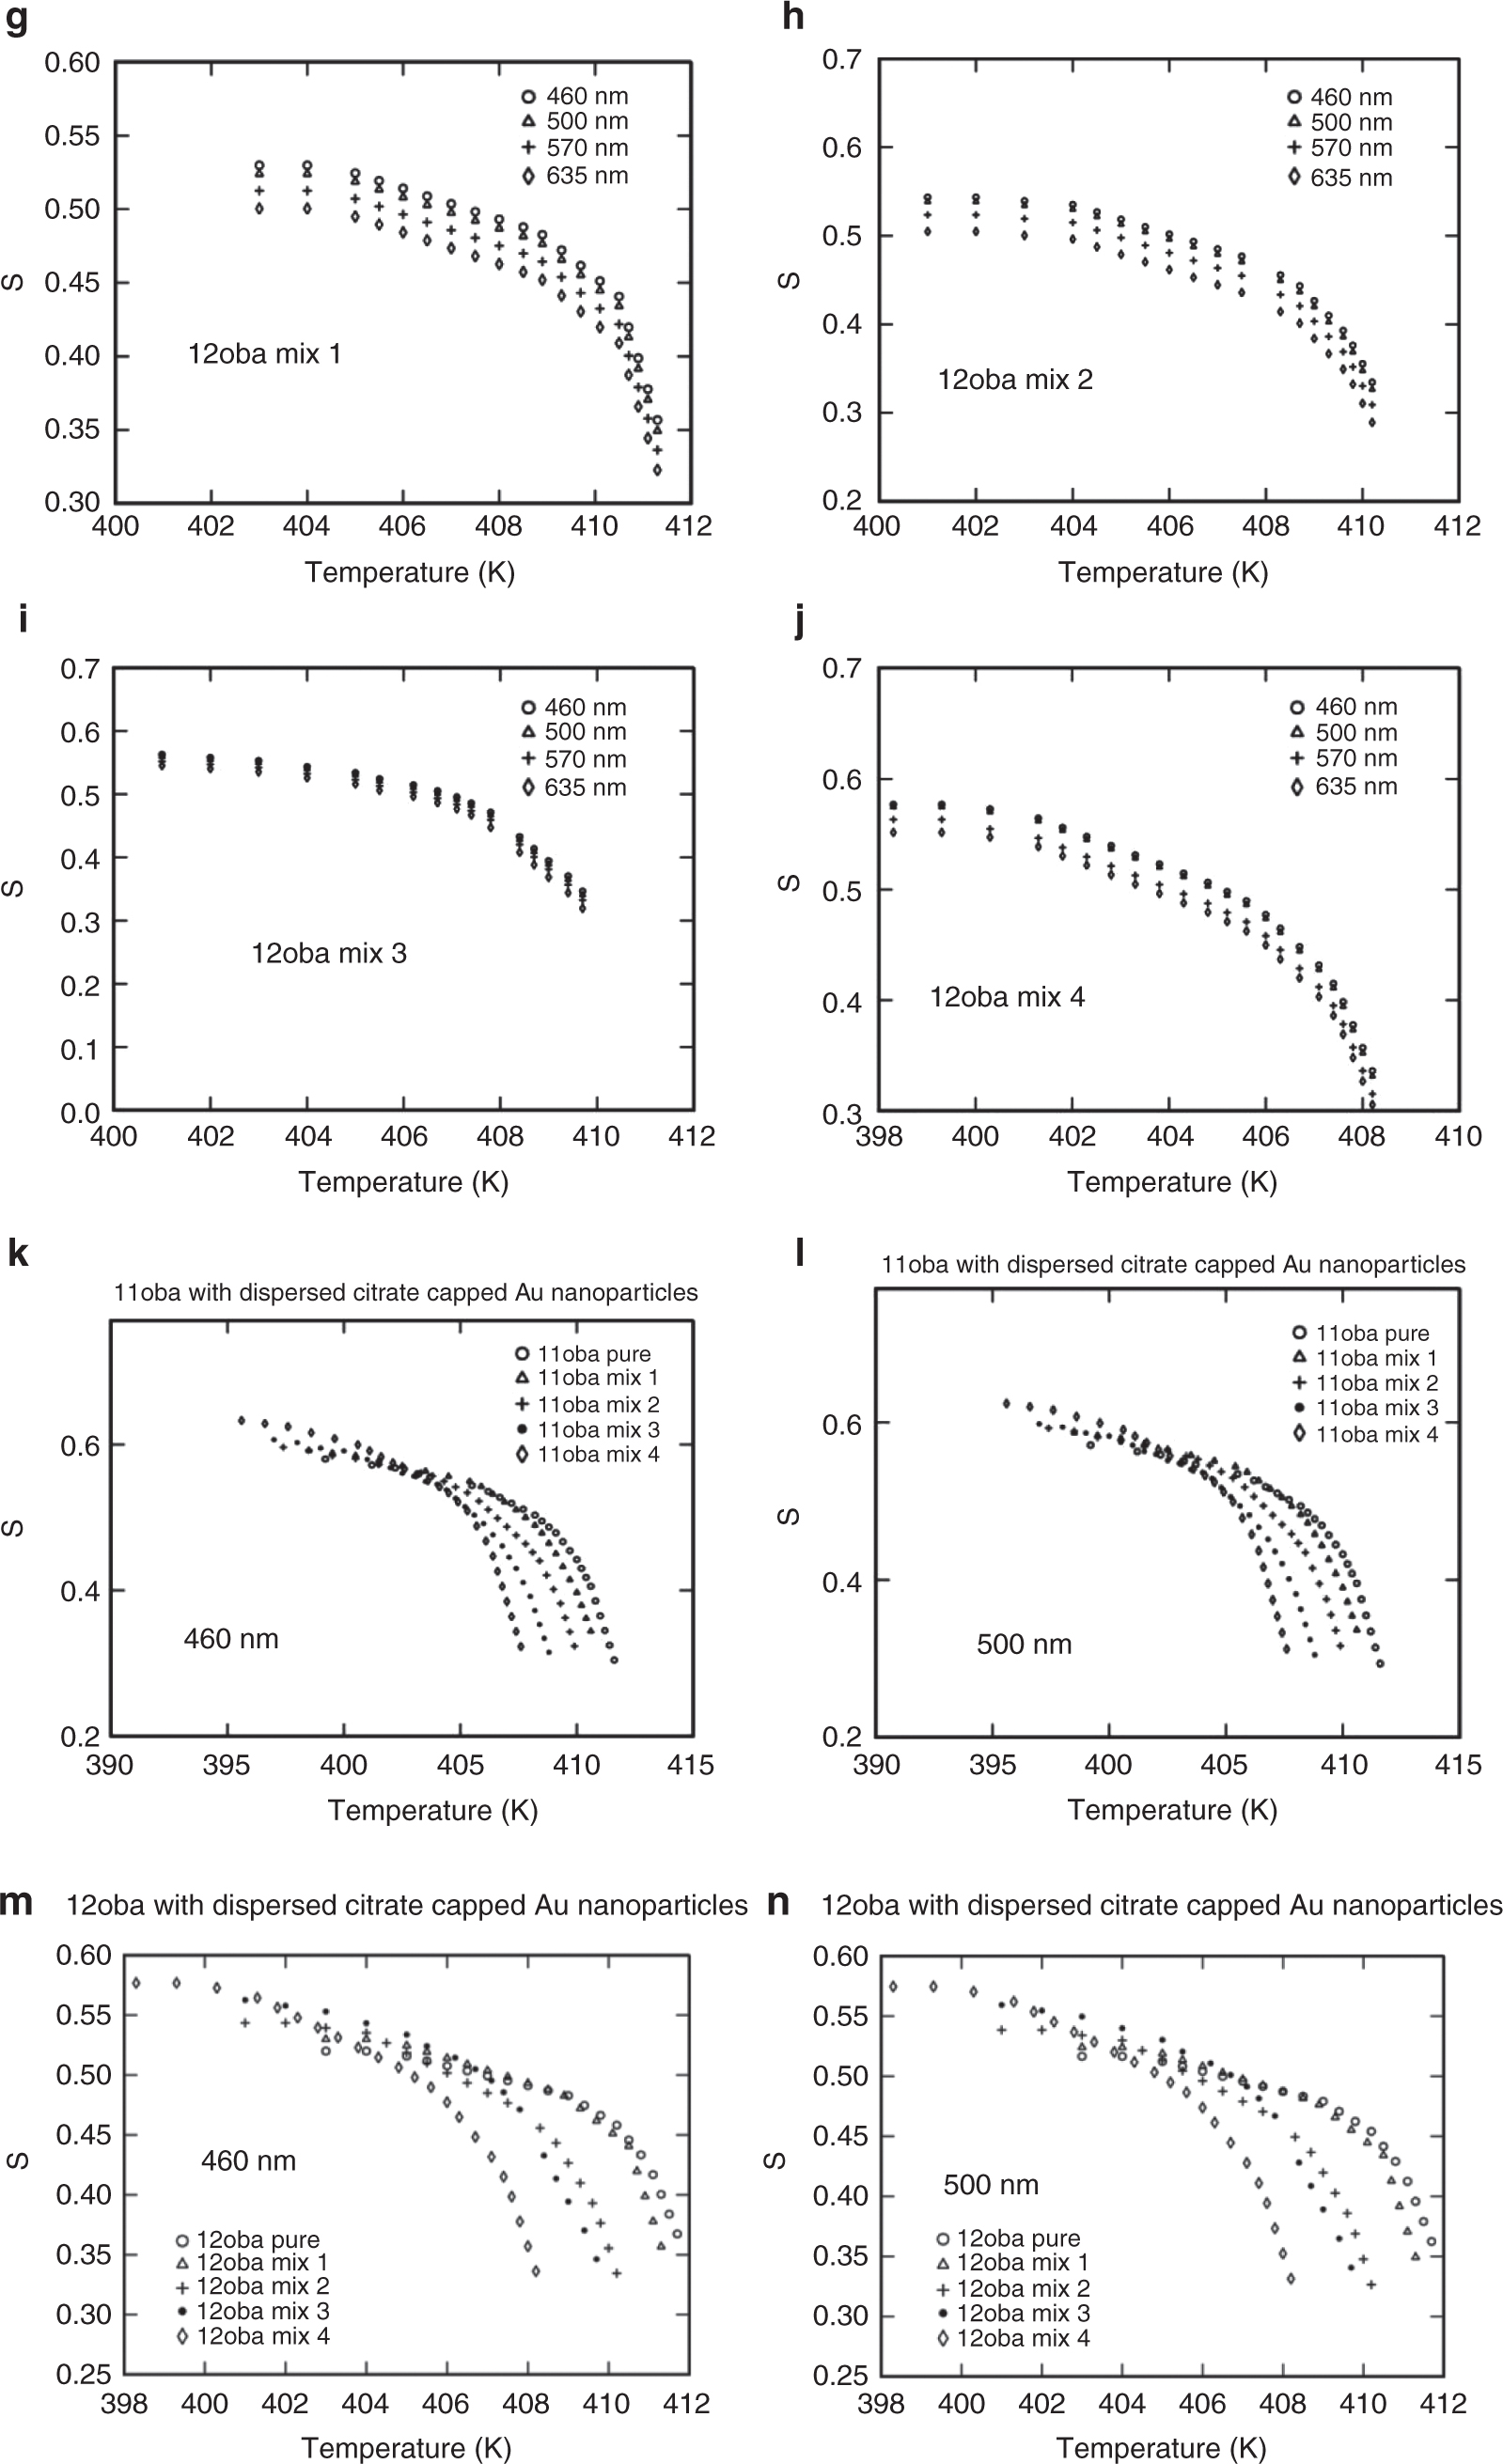
Order parameter S: (a) S vs. temperature in 11oba pure at various wavelengths from the Kuczynski model. (b) S vs. temperature in 11oba mix 1 at various wavelengths from the Kuczynski model. (c) S vs. temperature in 11oba mix 2 at various wavelengths from the Kuczynski model. (d) S vs. temperature in 11oba mix 3 at various wavelengths from the Kuczynski model. (e) S vs. temperature in 11oba mix 4 at various wavelengths from the Kuczynski model. (f) S vs. temperature in 12oba pure at various wavelengths from the Kuczynski model. (g) S vs. temperature in 12oba mix 1 at various wavelengths from the Kuczynski model. (h) S vs. temperature in 12oba mix 2 at various wavelengths from the Kuczynski model. (i) S vs. temperature in 12oba mix 3 at various wavelengths from the Kuczynski model. (j) S vs. temperature in 12oba mix 4 at various wavelengths from the Kuczynski model. (k) S vs. temperature in 11oba with dispersed citrate-capped Gnps at various concentrations from the Kuczynski model at 460 nm. (l) S vs. temperature in 11oba with dispersed citrate-capped Gnps at various concentrations from the Kuczynski model at 500 nm. (m) S vs. temperature in 12oba with dispersed citrate-capped Gnps at various concentrations from the Kuczynski model at 460 nm. (n) S vs. temperature in 12oba with dispersed citrate-capped Gnps at various concentrations from the Kuczynski model at 500 nm.
3.6.2 Vuks Isotropic Field Model
From the data of the refractive indices ne and no, the microscopic order parameter S is also determined from the Vuks model [48], which considers the local field of the molecule is isotropic. The relevant equation for the order parameter S from the Vuks relation is given by
where
α is the mean value of the molecular polarizability and Δα is the anisotropy of the molecular polarizability. The graph drawn log (
3.6.3 Haller Approximation Method
The order parameter also determined from the Haller’s approximation method [49] by excluding the effect of the molecular internal field within LC is given by
3.6.4 Effective Geometry Parameter Model
In this method, the order parameter could be obtained in terms of the effective geometry parameter, αeg = no/ne, using following equation, order parameter is calculated.
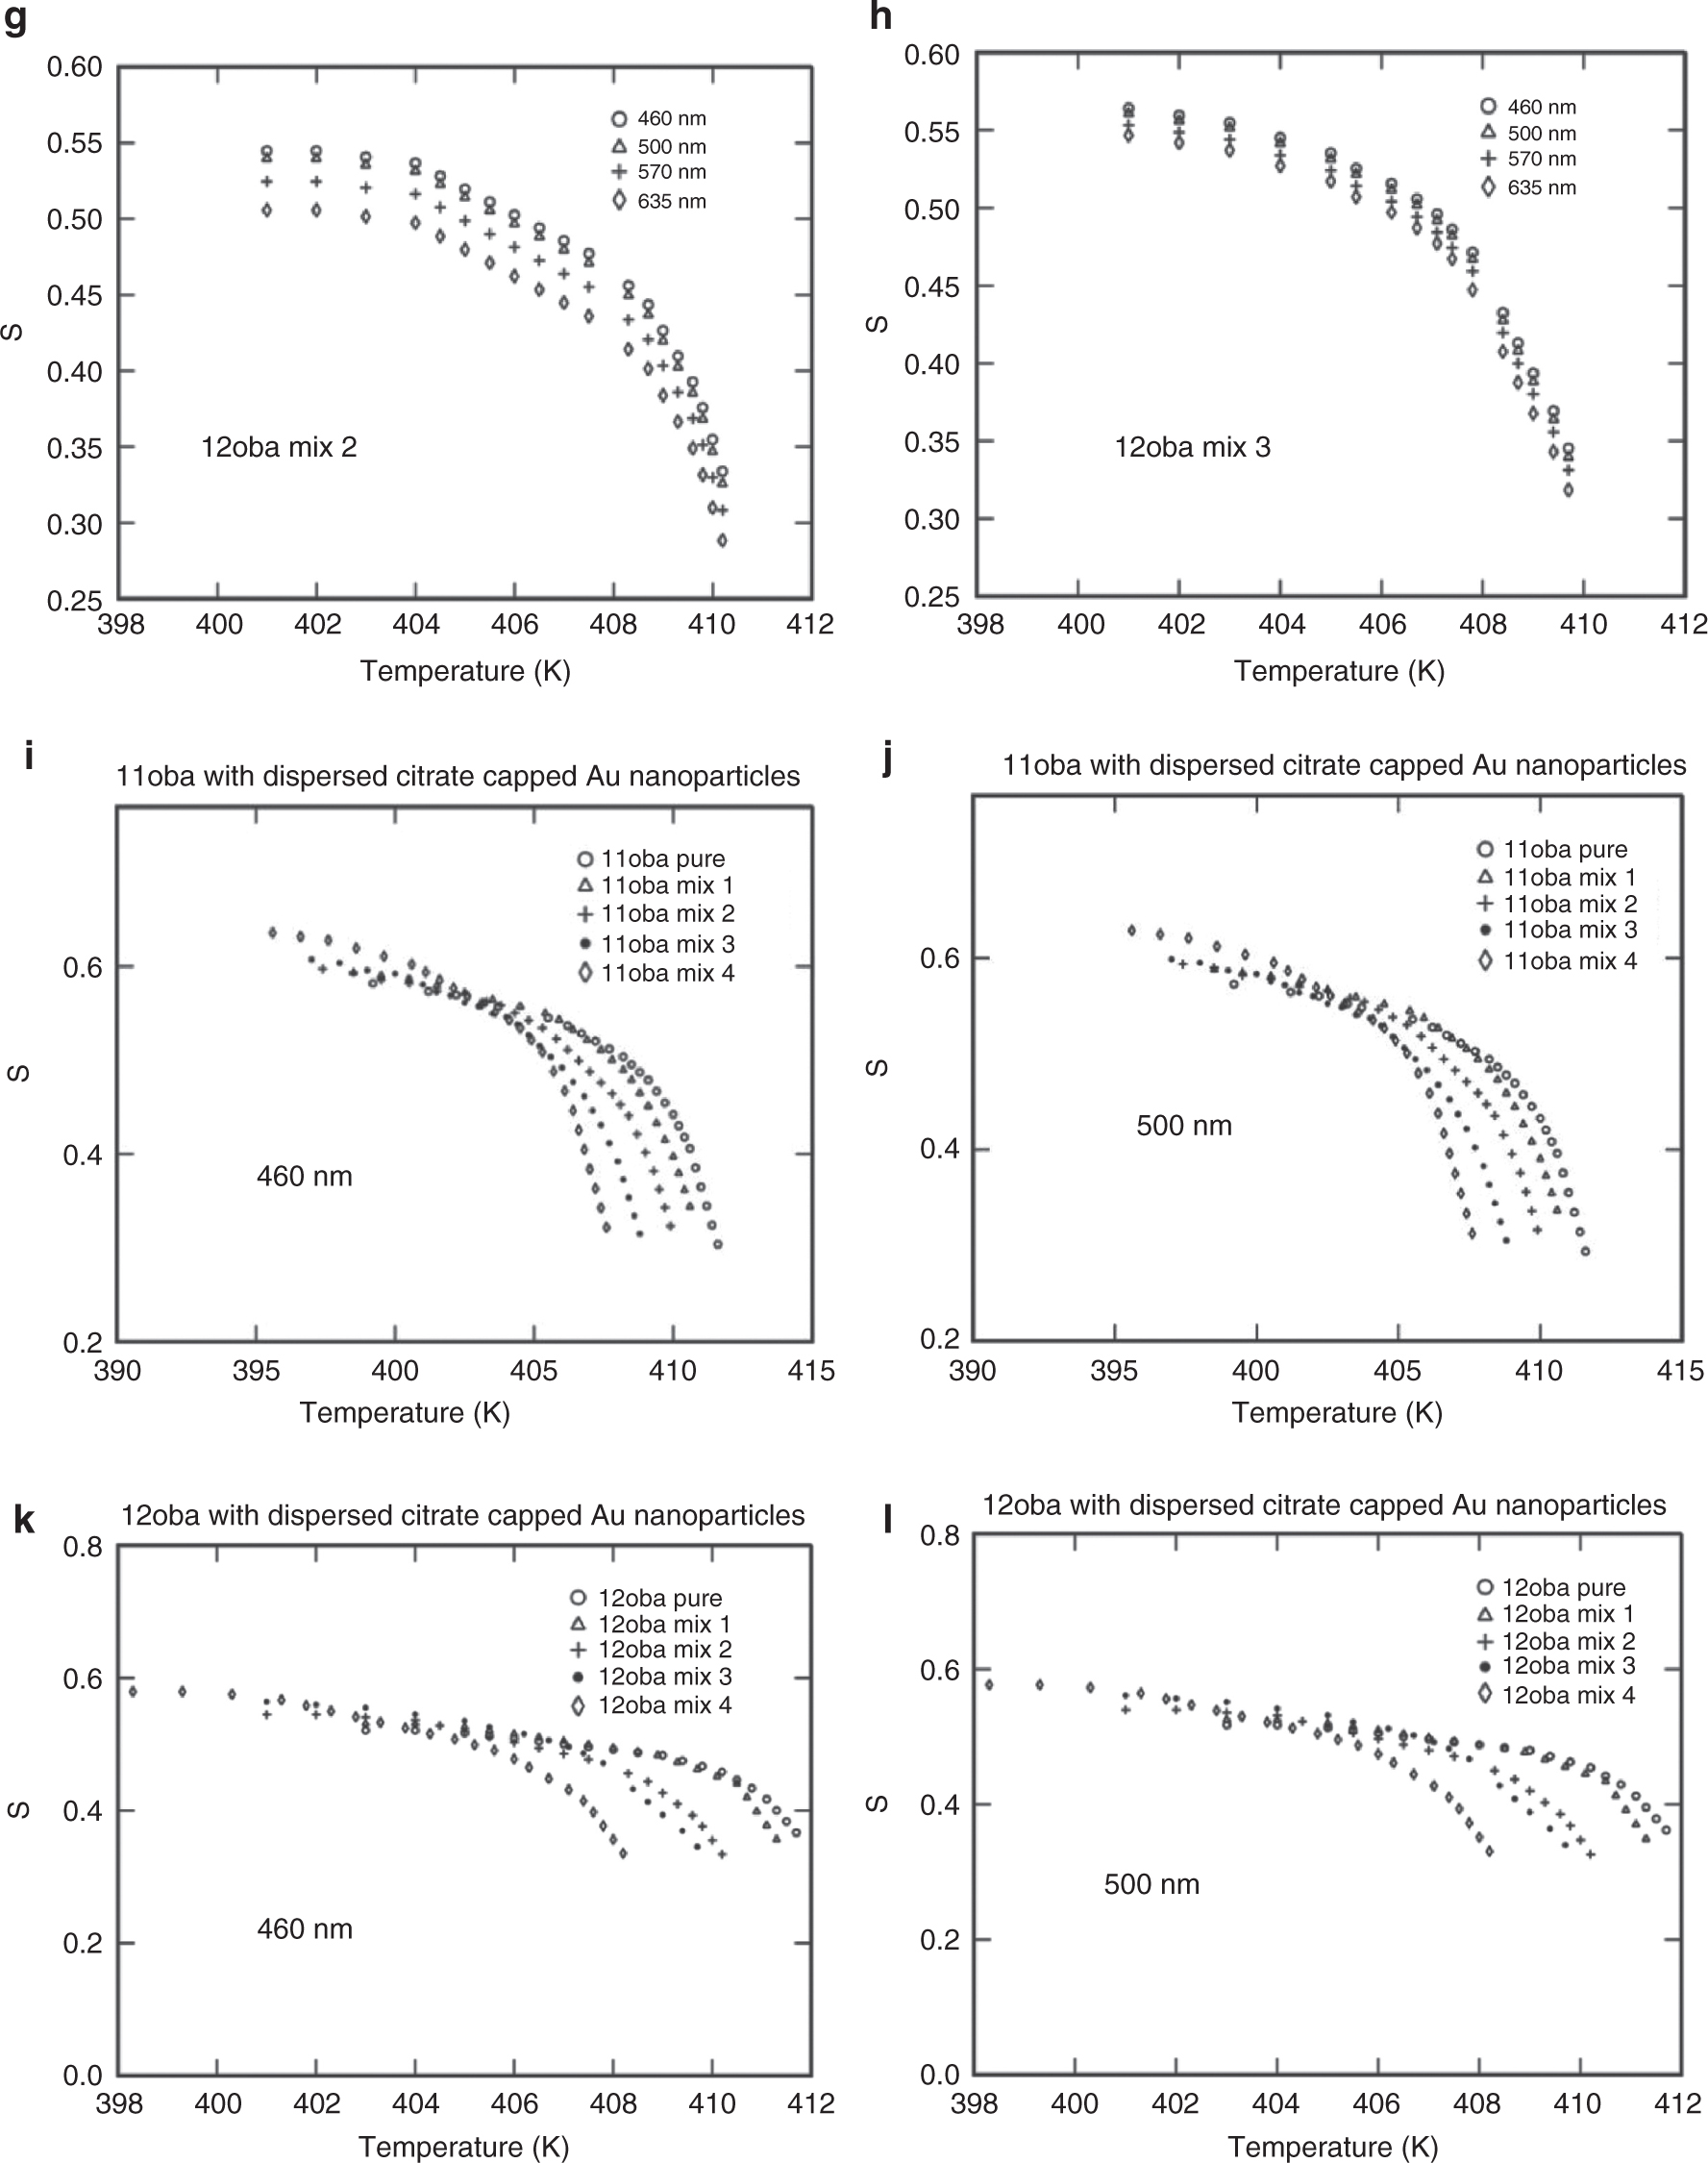
The same procedure for the determination of S for the above three methods is repeated for all the four wavelengths (460, 500, 570 and 635 nm). The values of S obtained nearly agree with the values obtained from the Kuczynski method. The variations of S with respect to temperature at various wavelengths and various mixtures from the Kuczynski, Vuks, Haller and effective geometry parameter models are shown in Figures 8a–n, 9a–j, 10a–f, 11a–l and 12a–d.
(a) S vs. temperature in 11oba pure at various wavelengths from the Vuks model. (b) S vs. temperature in 11oba mix 1 at various wavelengths from the Vuks model. (c) S vs. temperature in 11oba mix 2 at various wavelengths from the Vuks model. (d) S vs. temperature in 11oba mix 3 at various wavelengths from the Vuks model. (e) S vs. temperature in 12oba pure at various wavelengths from the Vuks model. (f) S vs. temperature in 12oba mix 1 at various wavelengths from the Vuks model. (g) S vs. temperature in 12oba mix 2 at various wavelengths from the Vuks model. (h) S vs. temperature in 12oba mix 3 at various wavelengths from the Vuks model. (i) S vs. temperature in 11oba with dispersed citrate-capped Gnps at various concentrations from the Vuks model at 460 nm. (j) S vs. temperature in 12oba with dispersed citrate-capped Gnps at various concentrations from the Vuks model at 460 nm.

(a) S vs. temperature in 11oba pure at various wavelengths from the Haller extrapolation model. (b) S vs. temperature in 11oba mix 3 at various wavelengths from the Haller extrapolation model. (c) S vs. temperature in 11oba mix 4 at various wavelengths from the Haller extrapolation model. (d) S vs. temperature in 12oba pure at various wavelengths from the Haller extrapolation model. (e) S vs. temperature in 12oba mix 3 at various wavelengths from the Haller extrapolation model. (f) S vs. temperature in 12oba mix 4 at various wavelengths from the Haller extrapolation model.
(a) S vs. temperature in 11oba pure at various wavelengths from the effective geometry parameter method. (b) S vs. temperature in 11oba mix 1 at various wavelengths from the effective geometry parameter method. (c) S vs. temperature in 11oba mix 2 at various wavelengths from the effective geometry parameter method. (d) S vs. temperature in 11oba mix 3 at various wavelengths from the effective geometry parameter method. (e) S vs. temperature in 12oba pure at various wavelengths from the effective geometry parameter method. (f) S vs. temperature in 12oba mix 1 at various wavelengths from the effective geometry parameter method. (g) S vs. temperature in 12oba mix 2 at various wavelengths from the effective geometry parameter method. (h) S vs. temperature in 12oba mix 3 at various wavelengths from the effective geometry parameter method. (i) S vs. temperature in 11oba with dispersed citrate-capped Gnps at various concentrations from the effective geometry parameter method. (j) S vs. temperature in 11oba with dispersed citrate-capped Gnps at various concentrations from the effective geometry parameter method. (k) S vs. temperature in 12oba with dispersed citrate-capped Gnps at various concentrations from the effective geometry parameter method. (l) S vs. temperature in 12oba with dispersed citrate-capped Gnps at various concentrations from the effective geometry parameter method.
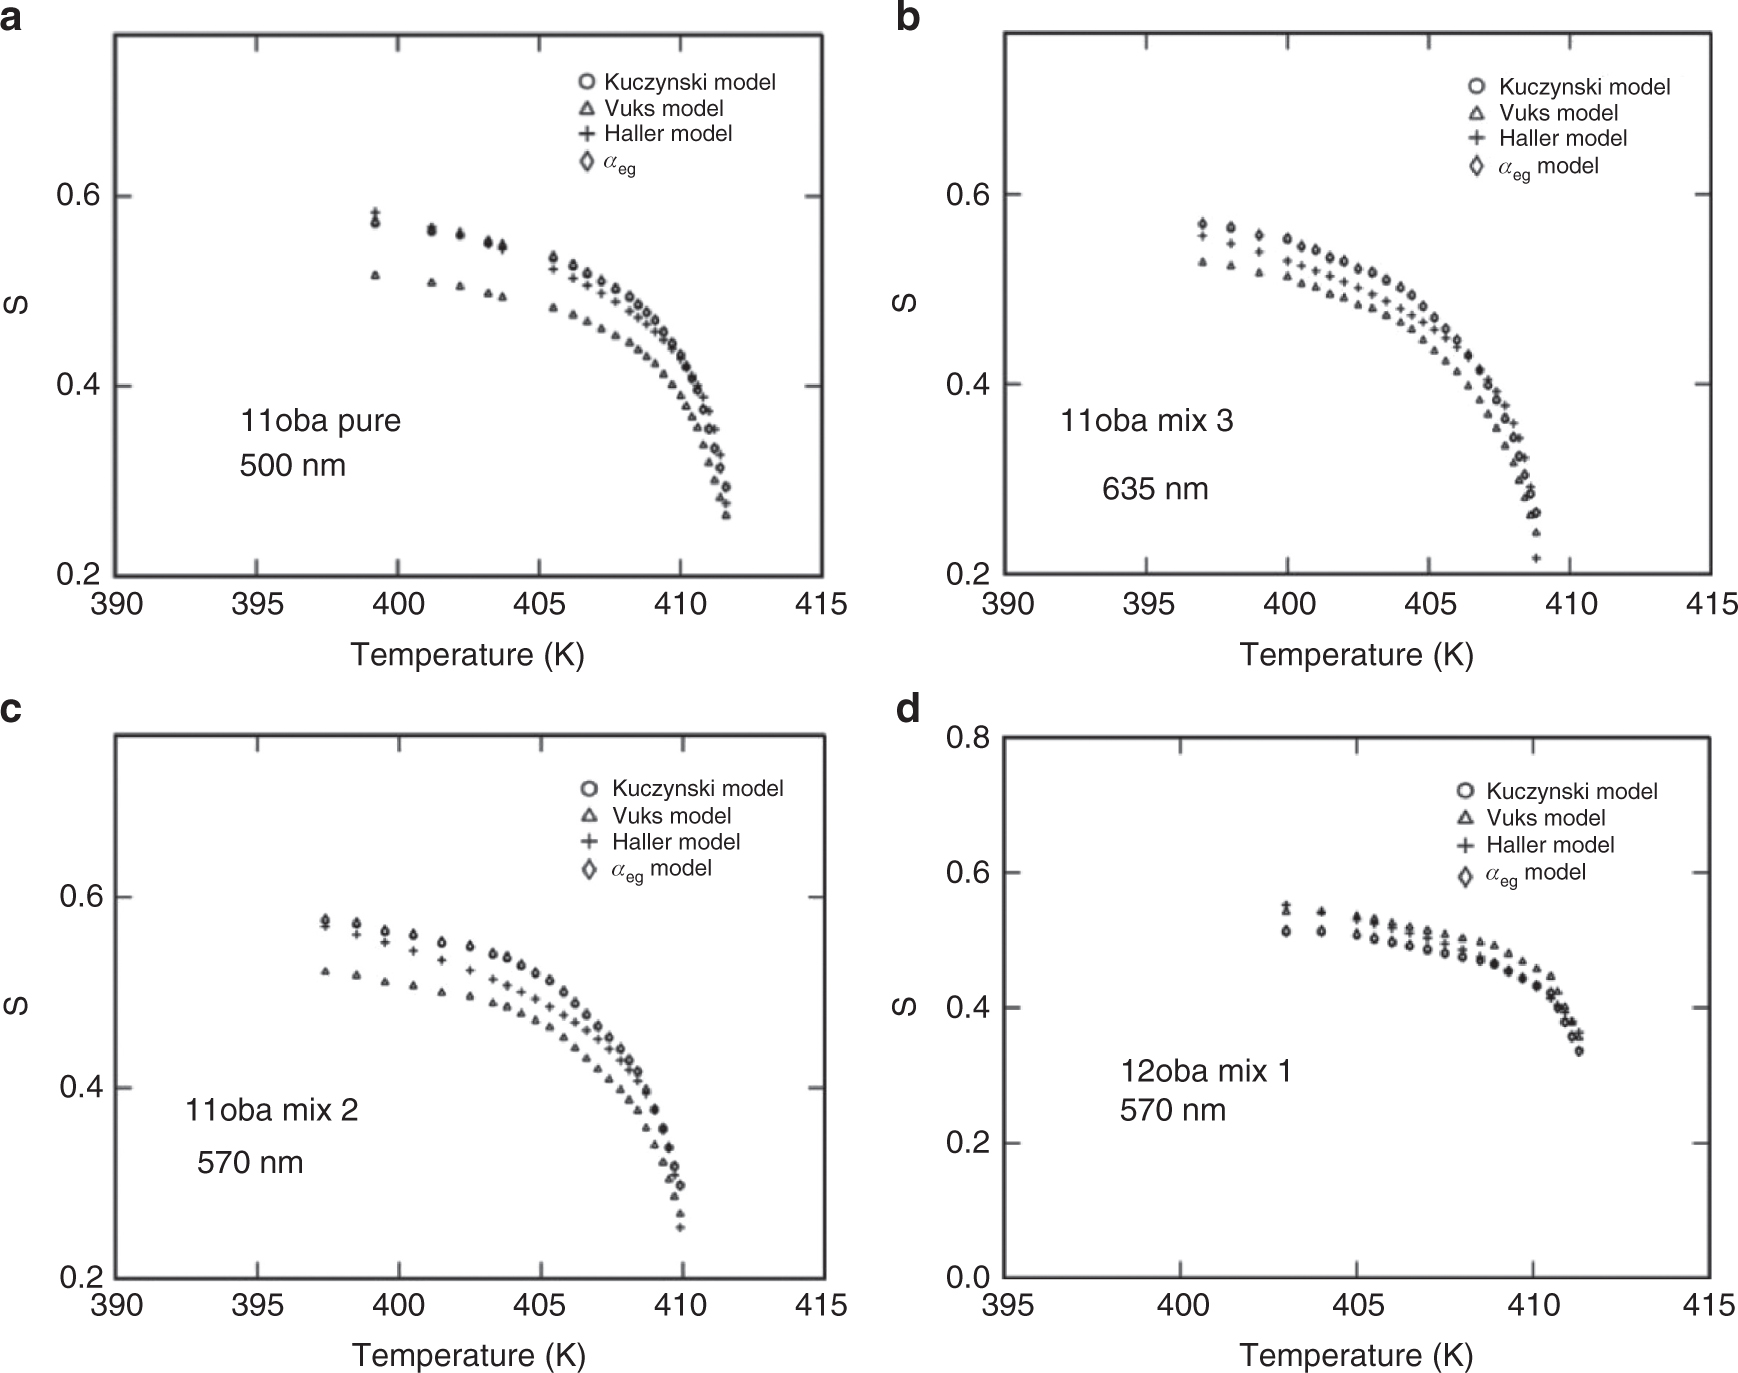
Variation of order parameter S in four models in 11oba and 12oba with dispersed citrate-capped Gnps: (a) Comparison of S among four models in 11oba pure at 500 nm. (b) Comparison of S among four models in 11oba mix 3 at 635 nm. (c) Comparison of S among four models in 11oba mix 2 at 570 nm. (d) Comparison of S among four models in 12oba mix 1 at 570 nm.
The dispersed citrate-capped Gnps induce realignment of neighboring 11oba and 12oba molecules, which produce more tendency to align the rod-like molecules along the direction of the director (optic axis) in the nematic phase, i.e. rotational isotropy of the molecules at the isotropic to nematic transition is broken, and they tend to well aligned due to the dispersion of citrate-capped Gnps. This increases the view angle more useful in display devices.
The order parameter S estimated from Δn, birefringence in perfect order (Kuczynski method) is compared with the values of S obtained from the Vuks, Haller and Effective geometry parameter methods; it is found that the percentage of deviation in S is almost less than 11 % in different concentrations in the stabilized nematic region, which is found to be reasonable (shown in Tab. 4).
Percentage of deviation of order parameter S in 11oba and 12oba in various mixtures.
| Compound | Wavelength | % of deviation of order parameter S in various models with respect to the Kuczynski model from | ||
|---|---|---|---|---|
| Vuks method | Haller’s method | Effective geometry model αeg | ||
| 11oba pure | 460 nm | 10.72 | 2.05 | 0.29 |
| 500 nm | 9.68 | 2.07 | 0.30 | |
| 570 nm | 8.97 | 2.15 | 0.30 | |
| 635 nm | 8.61 | 2.17 | 0.29 | |
| 11oba mix 1 | 460 nm | 10.19 | 2.23 | 0.24 |
| 500 nm | 9.99 | 2.43 | 0.22 | |
| 570 nm | 9.80 | 2.43 | 0.21 | |
| 635 nm | 8.82 | 2.57 | 0.21 | |
| 11oba mix 2 | 460 nm | 10.68 | 0.20 | 0.18 |
| 500 nm | 10.70 | 0.46 | 0.19 | |
| 570 nm | 9.40 | 0.63 | 0.17 | |
| 635 nm | 8.06 | 3.11 | 0.18 | |
| 11oba mix 3 | 460 nm | 10.09 | 0.41 | 0.12 |
| 500 nm | 9.43 | 0.38 | 0.12 | |
| 570 nm | 7.24 | 0.40 | 0.16 | |
| 635 nm | 7.14 | 1.35 | 0.14 | |
| 11oba mix 4 | 460 nm | 11.16 | 3.98 | 0.46 |
| 500 nm | 10.4 | 3.06 | 0.75 | |
| 570 nm | 7.88 | 3.82 | 0.54 | |
| 635 nm | 4.81 | 3.37 | 0.44 | |
| 12oba pure | 460 nm | 4.83 | 7.27 | 0.17 |
| 500 nm | 4.38 | 6.80 | 0.17 | |
| 570 nm | 4.53 | 7.02 | 0.18 | |
| 635 nm | 4.73 | 7.23 | 0.18 | |
| 12oba mix 1 | 460 nm | 6.34 | 7.00 | 0.23 |
| 500 nm | 5.94 | 6.95 | 0.23 | |
| 570 nm | 5.72 | 7.69 | 0.21 | |
| 635 nm | 5.07 | 8.21 | 0.22 | |
| 12oba mix 2 | 460 nm | 5.02 | 5.37 | 0.24 |
| 500 nm | 4.18 | 6.13 | 0.23 | |
| 570 nm | 4.11 | 6.95 | 0.21 | |
| 635 nm | 4.99 | 8.48 | 0.22 | |
| 12oba mix 3 | 460 nm | 2.29 | 2.40 | 0.27 |
| 500 nm | 0.84 | 2.02 | 0.29 | |
| 570 nm | 0.38 | 2.08 | 0.27 | |
| 635 nm | 1.93 | 2.05 | 0.28 | |
| 12oba mix 4 | 460 nm | 4.75 | 2.38 | 0.40 |
| 500 nm | 4.23 | 1.50 | 0.38 | |
| 570 nm | 4.35 | 2.54 | 0.43 | |
| 635 nm | 4.50 | 1.78 | 0.36 | |
4 Conclusions
In the present investigation, we studied the effect of dispersed citrate-capped Gnps with various concentrations on LC 11oba and 12oba from the nematic to near clearing temperatures. The confirmation of citrate-capped Gnps is evident from the EDS data of the SEM and with UV spectral study. A new GMSD technique was used to identify the phase transition temperatures, which are complimentary to DSC. As per the proposed results, even though DSC is not available, GMSD gives more appropriate data from image analysis.
Because of the dispersion of citrate-capped Gnps, there is no unusual change in their textures, but the transition temperatures at the nematic phase reduced slightly in each concentration. At the I-N transition, i.e. in the high temperature regions, the difference in the values of birefringence will be smaller and increases more prominently in the low temperature region, i.e. in the region of well-stabilized nematic phase. The δn values at the stabilized nematic region are enhanced from 2.8 % to 18.9 % in 11oba and from 5.6 % to 22.1 % in 12oba for various wavelengths and with relatively increased concentrations of dispersed citrate-capped Gnps. Similarly, the order parameter S values of 11oba and 12oba obtained from the Kuczynski method, the Vuks model, the Haller extrapolation model and the effective geometry parameter method are found to be enhanced approximately from 1.99 % to 9.5 % for 11oba and from 1.2 % to 11 % for 12oba with the dispersion of citrate-capped Gnps at various wavelengths with respect to various concentrations of nanoparticles. The dispersion of citrate-capped Gnps provides long-range inter-particle interaction of molecules of LCs and citrate-capped Gnps, and as a result, this interaction enhances the orientation and local ordering of LC molecules. Thereby, the birefringence and orientation order parameter of LC molecules increase, which in turn improve the view angle. This will be beneficial in many LC display applications.
References
[1] C.-J. Hsu, L.-J. Lin, M.-K. Huang, and Chi-Yen Huang, Crystals 7, 287 (2017).10.3390/cryst7100287Suche in Google Scholar
[2] V. N. Vijayakumar and M. L. N. Madhu Mohan, Physica B Condens Matter 406, 4139 (2011).10.1016/j.physb.2011.08.014Suche in Google Scholar
[3] L. Mukhyalo and I. Pinkevych, Liq. Cryst. 34, 577 (2007).10.1080/02678290500248160Suche in Google Scholar
[4] L. Fumaiki, K. I. Inoue, N. Toshima, S. Kobayashi, and K. Takatoh, Jpn. J. Appl. Phys. 46, L796 (2007).10.1143/JJAP.46.L796Suche in Google Scholar
[5] P. Swathi, P. A. Kumar, and V. G. K. M. Pisipati, Liq. Cryst. 2000, 665 (2000).Suche in Google Scholar
[6] M. Ramakrishna Nanchara Rao, P. V. Datta Prasad, and V. G. K. M. Pisipati, Mol. Cryst. Liq. Cryst. 528, 49 (2010).10.1080/15421406.2010.504515Suche in Google Scholar
[7] P. V. Datta Prasad, M. Ramakrishna, N. Rao, and V. G. K. M. Pisipati, Mol. Cryst. Liq. Cryst. 511, 112 (2009).10.1080/15421400903048701Suche in Google Scholar
[8] M. Okumuş, J. Mol. Liq. 266, 529 (2018).10.1016/j.molliq.2018.06.111Suche in Google Scholar
[9] A. Gowda, and S. Kumar, Materials 11, 382 (2018).10.3390/ma11030382Suche in Google Scholar PubMed PubMed Central
[10] F. V. Podgornov, M. Gavrilyak, A. Karaawi, V. Boronin, and W. Haase, Liq. Cryst. 45, 1594 (2018).10.1080/02678292.2018.1458256Suche in Google Scholar
[11] D. Seok Kim, A. Suh, S. Yang, and D. Ki Yoon, J. Colloid Interface Sci. 513, 585 (2018).10.1016/j.jcis.2017.11.033Suche in Google Scholar PubMed
[12] P. J. Jessy, S. Radha, and N. Patel, J. Mol. Liq. 255, 215 (2018).10.1016/j.molliq.2018.01.160Suche in Google Scholar
[13] H.-G. Park, E.-M. Kim, G.-S. Heo, H.-C. Jeong, J. H. Lee, et al., Opt. Mater. 75, 252 (2018).10.1016/j.optmat.2017.10.031Suche in Google Scholar
[14] K. K. Pandey, P. K. Tripathi, A. K. Misra, and R. Manohar, Results Phys. 8, 1119 (2018).10.1016/j.rinp.2018.01.051Suche in Google Scholar
[15] F. Li, O. Buchnev, C. I. Cheon, A. Glushchenko, V. Reshetnyak, et al., Phys. Rev. Lett. 97, 147801 (2006).10.1103/PhysRevLett.97.147801Suche in Google Scholar PubMed
[16] G. Ya. Guba, Yu. A. Reznikov, N. Yu. Lopukhovich, V. M. Ogenko, V. Yu. Reshetnyak, et al., Mol. Cryst. Liq. Cryst. 251, 303 (1994).10.1080/10587259408027213Suche in Google Scholar
[17] T. Zhang, C. Zhong, and J. Xu, Jpn. J. Appl. Phys. 48, 055002 (2009).10.1143/JJAP.48.055002Suche in Google Scholar
[18] D. E. Martire, G. A. Oweimreen, G. I. Ågren, S. G. Ryan, and H. T. Peterson, J. Chem. Phys. 64, 1456 (1976).10.1063/1.432415Suche in Google Scholar
[19] M. C. Rao, Int. J. Chem. Tech. Res. 6, 1904 (2014).Suche in Google Scholar
[20] A. Malik, A. Choudhary, P. Silotia, and A. M. Biradar, J. Appl. Phys. 110, 064111 (2011).10.1063/1.3642087Suche in Google Scholar
[21] L. J. Martinez-Miranda, K. M. Traister, I. Meléndez-Rodríguez, and L. Salamanca-Riba, Appl. Phys. Lett. 97, 223301 (2010).10.1063/1.3511736Suche in Google Scholar
[22] E. Nowinowski-Kruszelnicki, L. Jaroszewicz, Z. Raszewski, L. Soms, W. Piecek, et al., Opto-Electron. Rev. 20, 315 (2012).10.2478/s11772-012-0045-7Suche in Google Scholar
[23] E. Nowinowski-Kruszelnicki, J. Kedzierski, Z. Raszewski, L. Jaroszewicz, R. Dabrowski, et al., Opt. Appl. 42, 167 (2012).Suche in Google Scholar
[24] R. Dąbrowski, P. Kula, and J. Herman, Crystals 3, 443 (2013).10.3390/cryst3030443Suche in Google Scholar
[25] G. Pathak, R. Katiyar, K. Agrahari, A. Srivastava, R. Dabrowski, et al., Opt.-Electron. Rev. 26, 11 (2018).10.1016/j.opelre.2017.11.005Suche in Google Scholar
[26] Y. A. Garbovskiy and A. V. Glushchenko. Sol. Stat. Phys. 62, 1 (2011).10.1016/B978-0-12-374293-3.00001-8Suche in Google Scholar
[27] H. Qi, B. Kinkead, V. M. Marx, H. R. Zhang, and T. Hegmann, Chem Phys Chem. 10, 1211 (2009).10.1002/cphc.200800765Suche in Google Scholar PubMed
[28] R. K. Shukla, A. Sharma, T. Mori, T. Hegmann, and W. Haase, Liq. Cryst. 43, 695 (2016).10.1080/02678292.2016.1140239Suche in Google Scholar
[29] V. G. K. M. Pisipati, D. Madhavi Latha, P. Pardhasaradhi, and P. V. Datta Prasad, Liq. Cryst. Today 23, 70 (2014).10.1080/1358314X.2014.945245Suche in Google Scholar
[30] J. Turkevitch, P. C. Stevenson, and J. Hillier, Discuss. Faraday Soc. 11, 55 (1951).10.1039/df9511100055Suche in Google Scholar
[31] G. W. Gray, Molecular Structures and Properties of Liquid Crystals, Academic Press, New York 1962.Suche in Google Scholar
[32] J. Mock, D. Smith, and S. Schultz, Nano Lett. 3, 485 (2003).10.1021/nl0340475Suche in Google Scholar
[33] R. K. N. R. Manepalli, G. Giridhar, P. Pardhasaradhi, P. Jayaprada, M. Tejaswi, et al., Mater. Today Proc. 5, 2666 (2018).10.1016/j.matpr.2018.01.047Suche in Google Scholar
[34] P. Pardhasaradhi, B. T. P. Madhav, M. Venugopala Rao, R. K. N. R. Manepalli, and V. G. K. M. Pisipati, Phase Trans. 89, 902 (2015).10.1080/01411594.2015.1091074Suche in Google Scholar
[35] M. Tejaswi, M. C. Rao, R. K. N. R. Manepalli, B. T. P. Madhav, P. Pardhasaradhi, et al., Rasayan J. Chem. 10, 69 (2017).Suche in Google Scholar
[36] I. Haller, H. A. Huggins, H. R. Lilienthal, and T. R. McGuire, J. Phys. Chem. 73, 950 (1973).10.1021/j100626a020Suche in Google Scholar
[37] M. Ramakrishna Nanchara Rao, P. V. Datta Prasad, V. G. K. M. Pisipati, and D. Madhavi Latha, Solid State Phenom. 181–182, 102 (2012).10.4028/www.scientific.net/SSP.181-182.102Suche in Google Scholar
[38] B. R. Rajeswari, P. Pardhsaradhi, M. Ramakrishna Nanchara Rao, P. V. Datta Prasad, D. MadhaviLatha, et al., Solid State Phenom. 181–182, 75 (2012).10.4028/www.scientific.net/SSP.181-182.75Suche in Google Scholar
[39] P. Jayaprada, M. C. Rao, P. Pardhasaradhi, P. V. Datta Prasad, R. K. N. R. Manepalli, et al., Optik Int. J. Light Electron Opt. 185, 1226 (2019).10.1016/j.ijleo.2019.04.060Suche in Google Scholar
[40] H. Eskalen, Ş. Özgan, Ü. Alver, and S. Kerli, Acta Phys. Pol. A No. 127, 3 (2015).10.12693/APhysPolA.127.756Suche in Google Scholar
[41] H. J. Kim, Y. G. Kang, H. G. Park, K. M. Lee, S. Yang, et al., Liq. Cryst. 38, 871 (2011).10.1080/02678292.2011.584637Suche in Google Scholar
[42] A. Ranjkesh, J.-C. Choi, J.-S. Park, M.-K. Park, S. Kiani, et al., Mol. Liq. 6838 (2017).Suche in Google Scholar
[43] H. E. J. Neugebauer, Can. J. Phys. 32, 1 (1954).10.1139/p54-001Suche in Google Scholar
[44] W. Maier and Z. Z. Saupe, Naturforsch, 15a, 287 (1960).10.1515/zna-1960-0401Suche in Google Scholar
[45] W. Kuczynski, B. Zywucki, and J. Malecki, Mol. Cryst. Liq. Cryst. 381, 1 (2002).10.1080/713738745Suche in Google Scholar
[46] B. J. Zywucki and W. Kuczynski, IEEE J. Trans. Dielec. Elec. Insl. 8, 512 (2001).10.1109/94.933375Suche in Google Scholar
[47] M. Ramakrishna, N. Rao, P. V. Datta Prasad, and V. G. K. M. Pisipati, Mol. Cryst. Liq. Cryst. 528, 49 (2010).10.1080/15421406.2010.504515Suche in Google Scholar
[48] M. F. Vuks, Optic. Spectros. 20, 361 (1966).10.1176/appi.psychotherapy.1966.20.2.361Suche in Google Scholar
[49] I. Haller, Solid State Chem. 10, 103 (1975).10.1016/0079-6786(75)90008-4Suche in Google Scholar
©2019 Walter de Gruyter GmbH, Berlin/Boston
Artikel in diesem Heft
- Frontmatter
- Dynamical Systems & Nonlinear Phenomena
- Bifurcation Dynamics and Pattern Formation of a Three-Species Food Chain System with Discrete Spatiotemporal Variables
- Effects of Constant and Space-Dependent Viscosity on Eyring–Powell Fluid in a Pipe: Comparison of the Perturbation and Explicit Finite Difference Methods
- Hydrodynamics
- Natural Convection Flow of Power-Law Fluids over a Heated Horizontal Plate Surface
- Quantum Theory
- Proposal for a New Quantum Theory of Gravity II
- Solid State Physics & Materials Science
- Synthesis and Non-Destructive Characterization of Zinc Selenide Thin Films
- Optical Properties of Liquid Crystalline Alkoxy Benzoic Acids with Dispersed Citrate-Capped Gold Nanoparticles
- Investigations of Physical Properties of XTiH3 and Implications for Solid State Hydrogen Storage
- Study of the Absorption Properties of Terahertz Wave in the Plasma Medium
- Structural, Mechanical and Electronic Properties of o-BC6N