First-Principles Study of Electronic and Elastic Properties of Hexagonal Layered Crystal MoS2 Under Pressure
-
Jiao-Nan Yuan
 ,
Xiu-Qing Zhang
,
Xiu-Qing Zhang

Abstract
The structural, electronic, and elastic properties of hexagonal layered crystal MoS2 under pressure are investigated using first-principles calculations within the local density approximation (LDA). The calculated lattice parameters a0, c0, and cell volume V0 of MoS2 are in good agreement with the available experimental data. Our calculations show that MoS2 is an indirect band gap semiconductor and there is a vanishing anisotropy in the rate of structural change at around 25 GPa, which is consistent with the experimental result. We also analyse the partial density of states (PDOS) of MoS2 at 0 and 14 GPa, which indicate that the whole valence bands of MoS2 are mainly composed by the Mo-4d and S-3s states at 0 GPa, while they are mainly composed by the Mo-4p, Mo-4d, and S-3p states at 14 GPa. The electronic charge density difference maps show the covalent characteristic of Mo–S, and the bonding properties of MoS2 are investigated by using the Mulliken overlap population. In addition, the elastic constants Cij, bulk modulus B, shear modulus G, Young’s modulus Y, the Debye temperature ΘD, and hardness H of MoS2 are also obtained successfully. It is found that they all increase monotonically with the increasing pressure.
1 Introduction
Gapless graphene is a very promising two-dimensional (2D) material, and it has limitations for its applications in nanoelectronics and nanophotonics. This leads to the finding of other 2D materials with finite band gap, such as transition metal dichalcogenides (TMDs) [1]. The TMDs materials have attracted growing attention due to their exotic properties and potential applications in electrical, mechanical, thermal, and optical fields. Depending on the combination of metal and chalcogen, the TMDs offer a wide rang of 2D materials: metals [2], superconductors [3], Mott’s insulators [4], charge-density-wave systems [5], and semiconductors [6]. Many studies show that they are promising for use as catalysts [7], lubricants [8], or as an important material used in lithium batteries [9], phototransistors [10], and nanoelectronics [11].
As a member of transition metal disulfides, molybdenum disulfide (MoS2) has emerged as an excellent candidate for the study of fundamental physics in 2D materials. The geometric and electronic structures of graphene adsorption on MoS2 monolayer have been studied by density functional theory [12]. Lu et al. [13] investigated the strain-dependent electronic and magnetic properties of 2D monolayer and bilayer MoS2 by using first-principles calculations. They found that electronic properties of monolayer and bilayer MoS2 were sensitive to the magnitude and direction of strain. This sensitivity stemmed from the change in the Mo–S bond length. Zhou et al. [14] investigated the MoS2-based nanostructures including atomic defects, nanoholes, nanodots, and antidots with spin-polarised density functional theory. In addition, the thermal transport properties of MoS2 thin films were also presented [15]. Recently, we have investigated the phonon vibrations and thermal properties of MoS2 [16]. Our results show that no imaginary phonon frequency is observed in the whole Brillouin zone (BZ), indicating that the bulk MoS2 is dynamically stable. However, many properties of bulk MoS2 under pressure, such as electronic and elastic properties, are not in-depth studied.
In this work, we perform a systematical study on the structural, electronic, and elastic properties of bulk MoS2 at 0 GPa and under pressures. It is expected that the present study will greatly help to give a deep insight into this material and can be a guide for its applications. The rest of the article is organised as follows: Theoretical methods and computational details are given in Section 2. Results and discussions for the structural, elastic, and electronic properties are presented in Section 3. Finally, summary of our main results are given in Section 4.
2 Theoretical Method and Computation Details
We employ the plane-wave pseudopotential density functional method, as implemented in the Cambridge Serial Total Energy Package (CASTEP) [17, 18] to study the structural and elastic properties of MoS2. In our electronic structure calculations, we employ the ultrasoft pseudopotential introduced by Vanderbilt [19] to describe the interactions between the electrons and the ion cores. The exchange-correlation potential used is the Ceperley–Alder type [20] parameterised by Perdew and Zunger [21] within the local density approximation (LDA). To confirm the convergence of the calculations for the Brillouin-zone sampling, we have carefully investigated the dependences of the total energy on the cut-off energy from 200 to 400 eV and the k-point set mesh according to the Monkhorst–Pack grid from 1×1×2 to 9×9×2 at 0 GPa for MoS2. It can be found that when the k-point set mesh is fixed in 5×5×2, the change in total energy is <1 eV when the cut-off energy is higher than 290 eV. On the other hand, when the cut-off energy is fixed in 290 eV, the convergence in total energy is very good when the k-point set mesh is beyond 5×5×2. Thus, in consideration of computational accuracy, the electronic wave functions are expanded in a plane wave basis set with an energy cut-off of 290 eV. A 5×5×2 Monkhorst–Pack mesh [22] is used in the Brillouin-zone sampling. Pseudo atomic calculations are performed in the case of Mo-4s24p64d55s1 and S-3s23p4. The tolerances for the geometry optimisation are 1×10⁻⁵ eV/atom for the energy, 0.03 eV/Å for the force, 0.001 Å for the ionic displacement, and 0.05 GPa for the stress. In the elastic constants calculation, the convergence criteria are 2×10⁻⁶ eV/atom for the energy, 0.006 eV/Å for the force, 2.0×10⁻⁴ Å for the ionic displacement, and 0.003 GPa for the maximum strain. It is found that these parameters and methods are sufficient for obtaining well-converged results.
3 Results and Discussion
3.1 Crystal Structure and Equation of States
At ambient conditions, MoS2 is a hexagonal layered crystal with the space group of P63/mmc (No. 194). Mo atom is located at the 2c Wyckoff position (0.3333, 0.6667, 0.250), and S atom is located at the 4f Wyckoff position (0.3333, 0.6667, 0.623) [23]. The hexagonal layered crystal structure of MoS2 is illustrated in Figure 1, which shows that there are two MoS2 molecules with the dihexagonal dipyramidal shape in the unit cell. In order to determine the ground state of MoS2, we adopt the following procedure: Firstly, we select a series of different axial ratios c/a near the experimental ratio of hexagonal structure. For a given ratio c/a, a series of different lattice parameters a and c are set to calculate the total energies E and the corresponding primitive cell volumes V, and then obtained the lowest energy Emin for the given ratio c/a. This procedure is repeated over a wide range of c/a. Finally, by fitting the Emin−V data to the Vinet Murnaghan equation of state (EOS) [24],
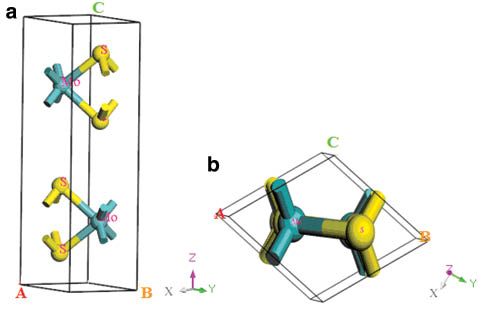
The hexagonal structure of MoS2: (a) side view and (b) top view, where green and yellow spheres in the sketch represent the Mo atoms and S atoms, respectively. The grey, green, and magenta arrows represent the X, Y, and Z directions, respectively.
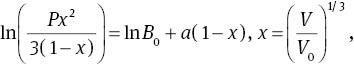
where V=V(0, T) is the zero-pressure equilibrium volume, derived by integration of the thermodynamic definition of the thermal expansion coefficient α(T)=V−1(∂V/∂T)
B0 and
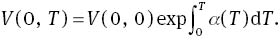
In Figure 2, we illustrate the pressure dependences of the normalised lattice parameters a/a0, c/c0, and the normalised cell volume V/V0 of MoS2, where a0, c0, and V0 are the zero pressure equilibrium lattice parameters, together with the experimental results by Nayak et al. in their XRD experiment using a symmetric DAC [27]. Our results show that below 5 GPa the rate of reduction of lattice parameters with pressure is different along in-plane and cross-plane directions: the equilibrium ratio c/c0 decreases more quickly than a/a0, which indicates that the compressibility along c axis is larger than along a axis. This anisotropy vanishes above 25 GPa, which is well consistent with the experimental data [28] and the theoretic result by Guo et al. from the projector augmented wave method [29]. Our calculated lattice parameters are also in agreement with the experimental data of Bandaru et al. in their X-ray diffraction experiments [30]. Also, in Figure 2, it can be seen that as the pressure increases from 0 to 25 GPa, the c/a ratio decreases by 8.08 %. The basal plane linear compressibility, d(lnc)/dP=−0.007 GPa−1 is about 3.5 times as large as the interlayer value d(lna)/dP=−0.002 GPa−1, which suggests that lattice constant c is more sensitive to pressure than lattice constant a.
The normalised parameters a/a0, c/c0, V/V0, and ratio c/a of MoS2 at T=0 K as a function of pressure. Our results are presented by the solid line and the experiment results by the dot line.
All the results described earlier show that the LDA method is suitable for investigating the geometrical structure of the hexagonal layered crystal MoS2. Thus, in the following, we will apply the LDA method to study the electronic structure and elastic properties of the hexagonal layered crystal MoS2.
3.2 Electronic Properties
As is known that band structure and density of states (DOSs) play an important role in analysing the physical properties of materials. The first step to explore the electronic properties of MoS2 is to study its band structure. Our study shows that the MoS2 is an indirect band gap semiconductor. The calculated band gap of hexagonal structure at 0 GPa is about 0.902 eV, suggesting that MoS2 is a narrow band gap semiconductor. This value is higher than the reported gap of 0.79 eV by Li et al. [26] and 0.8 eV by Shidpour and Manteghian [31], but it more agrees with the value of 1.03 eV presented by Nayak et al. with the Perdew, Burke and Emzerhof - Generalized Gradient Approximation (PBE-GGA) methods [27] and the experimental value of 1.29 eV presented by Peelaers and Van de Walle [32]. The existing difference of band gap in our result may be addressed to the poor description of conventional density functional theory, the presence of artificial self-interaction, and the absence of the derivative discontinuity in the exchange-correlation potential of LDA methods.
The DOS is also important for understanding the bonding properties. Therefore, the total DOS (TDOS) and PDOS of MoS2 are obtained at 0 and 14 GPa. As is clearly shown in Figure 3a, at 0 GPa, the lower valence bands (located at −15.7 ∼ −11.8 eV) are composed by S-3s states, and the upper valence bands (located at −7.404 ∼ 0 eV) are formed by S-3p and Mo-4d states, while the whole valence bands are mainly composed by the Mo-4d and S-3s states. The conduction bands are mainly from S-3p and Mo-4d states that located at 0.5 ∼ 9.6 eV. The width of S-3p band is 6.475 eV in valence band and 3.678 eV in conduction band. In addition, the width of the Mo-4p band is 6.64 eV in valence band and 3.908 eV in conduction band. Our results are consistent with those reported by Lebegue and Eriksson [33]. At 14 GPa (Fig. 3b), the lower valence bands are composed by S-3s states (located at −15.9 ∼ −12.8 eV) and Mo-4s states (located at −16.4 ∼ −12.6 eV); the upper valence bands are formed by S-3p (located at −8.2 ∼ −1.1 eV), Mo-4p (located at −8.4 ∼ −0.3 eV), and Mo-4d (located at −8.2 ∼ −0.5 eV) states, while the whole valence bands are mainly composed by the Mo-4p, Mo-4d, and S-3p states. The conduction bands are mainly from S-3p states (located at 0.6 ∼ 4.6 eV), Mo-4s states (located at 5.1 ∼ 8.9 eV), Mo-4p states (located at 0.1 ∼ 4.9 and 5.4−9.2eV), and Mo-4d states (located at 0.1 ∼ 4.9 eV). The width of S-3p band is 7.045 eV in valence band and 4.026 eV in conduction band. In addition, the width of the Mo-4p band is 8.126 eV in valence band and 9.058 eV in conduction band. From the two figures, it can be seen that the Mo-4s and Mo-4p states also contribute to the valence and conduction bands, and the whole valence bands expand towards the lower-energy area with the pressure changing from 0 to 14 GPa.
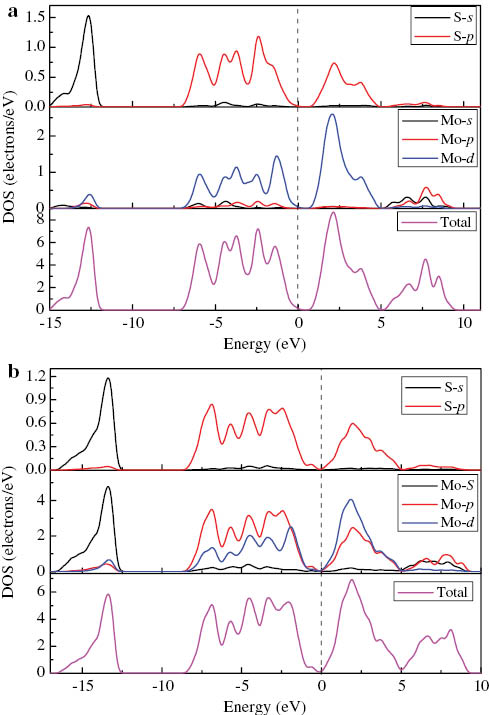
Calculated TDOS and PDOS of MoS2 at (a) 0 and (b) 14 GPa.
We make further investigations on the bonding properties of MoS2 by the Mulliken overlap population [34], the Hirshfeld analysis, and electron density map. Mulliken’s charge Qm(A) of A atom and the overlap population nm(AB) for AB bond are defined as follows:
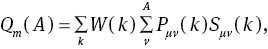
where Pμν(k) and Sμν(k) are the density matrix and the overlap matrix, respectively. μ and ν are the orbital on A and B, respectively. W(k) is the weight associated the calculated k points in the Brillouin zone. Usually, the magnitude and sign of Qm(A) characterise the iconicity of A atom in the crystal, and nm(AB) can be used to measure the covalent bonding strength approximately. In Table 1, we present the calculated Mulliken and Hirshfeld charges of MoS2. Our Mulliken population analysis is consistent with Fu et al. from the LDA method [35]. Both results imply that the Mo atom obtains electrons, while S atoms lost electrons in the MoS2, which is obviously unreasonable. But this can certify the conclusions that Mulliken populations seem to give an unreasonable physical picture of the charge distribution in compounds and Mulliken populations can have unphysical negative values [38]. Our Hirshfeld charge analysis implies that every Mo atom lost 0.2 electrons, while S atoms obtain 0.1 electrons. Though they seriously deviate from their nominal valence, these huge differences lie in that the Hirshfeld analysis is not a strict way in deciding the valence of an atom [39]. So, the Hirshfeld analysis is a more reasonable result. Table 1 shows the calculated bond length of Mo−S bonds 2.387 Å, which is well consistent with the other theoretical values of 2.43 [36] and 2.384 Å [37].
Populations analysis of MoS2.
| Analysis | Mulliken | Hirshfeld | ||||||||
|---|---|---|---|---|---|---|---|---|---|---|
| Structure | Atom | s | p | d | Total | Charge (e) | Bond | Population | Length (Å) | Charge (e) |
| Present | S | 1.84 | 4.13 | – | 5.97 | 0.03 | Mo–S | 1.06 | 2.387 | −0.10 |
| Fu et al.a | S | 1.83 | 4.13 | – | 5.96 | 0.04 | ||||
| Present | Mo | 2.45 | 6.53 | 5.08 | 14.06 | −0.06 | Mo–S | 1.06 | 2.387 | 0.20 |
| Fu et al.a | Mo | 2.46 | 6.54 | 5.08 | 14.08 | −0.08 | ||||
| Mo–S | 2.43b 2.384c | |||||||||
aLDA calculations by Fu et al. [35], bGGA-PW91 calculations by Yue et al. [36], and cLDA calculations by Molina-Sánchez and Wirtz [37].
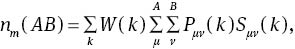
To display these bonding properties more visually, we plot the charge density difference of MoS2 in Figure 4 at both 0 (a) and 14 GPa (b). In general, many isolated atoms are connected together to form a solid and liquid through such as chemical bond. The electron density difference here denotes the difference in the electron density between bonded atoms and isolated atoms. The figures reveal that there is a significant electron density in the core regions of Mo atoms but a less value in interstitial areas. The electronic charge density difference map shows some charges begin to accumulate on the red regions between the site of Mo and S, which shows the covalent characteristic of Mo–S. This result agrees with the analysis of the Milliken population. In addition, it can be seen that Mo atoms locate at the blue regions, implying that Mo atoms lost electrons. The two figures show no difference about the electron density between 0 and 14 GPa, but the electron charge becomes more and more converged between two neighbouring layers at 14 GPa. The result may be due to that the existing interlayer van del Waals (vdW) interaction increases as the pressure increases.
Electronic charge density difference map calculated of MoS2 at (a) 0 and (b) 14 GPa.
3.3 Elastic Properties
Elastic stiffness tensor is related to stress tensor and strain tensor by Hooke’s law. To calculate the elastic constants under pressures, we assume the symmetry-dependent strains to be non-volume conserving, which are appropriate for the calculations of the elastic sound velocities. The elastic constants Cijkl with respect to the finite strain variables are defined as [40]
where σij and ekl are the applied stress and Eulerian strain tensors, and X and x are the coordinates before and after the deformation, respectively. When the pressure P is considered,
where cijkl denotes the second-order derivatives with respect to the infinitesimal strain. Elastic tensor Cijkl has generally 21 independent components. However, this number is greatly reduced when taking into account the symmetry of crystal. For the hexagonal structure MoS2, it is reduced to five components, i.e., C11, C12, C13, C33, and C44.
The calculated elastic constants are listed in Table 2, together with experimental [41] and previously calculated values [26, 42–44]. We obtain overall good agreement with experiment, especially for C11, C33, and C44, which are all determined from neutron scattering data [41]. For C12, our result shows a positive number, and [26, 42] reported the same positive sign, while [43, 44] obtained a negative sign. For C13, the range of values reported by the different theoretical calculations is large, but our results are in more agreement with the calculations that inclusion of vdW interactions. The elastic constants of MoS2 as a function of pressure are shown in Figure 5. It is found that the independent elastic constants of MoS2 increase monotonically with pressure. C11 and C33 vary rapidly as pressure increases, and C13, C12, and C44 behave moderately. The obtained elastic constants are a little different from the theoretical values by Li et al. [26]. This may be due to the small difference of the selected exchange-correlation energy that the Ceperley–Alder type parameterised by Perdew and Zunger within the LDA is used in our calcaulations, while Li et al. selected the generalised gradient approximation with PBE scheme. The criteria for the mechanical stability for hexagonal structure under pressure P are [45]
Elastic constants (GPa) of MoS2 obtained using different methods.
| Present | Exp.a | HSE06-D2b | GGAc | GGAd | Periodic HFe | Periodic HFd | LDAd | |
|---|---|---|---|---|---|---|---|---|
| C11 | 240.69 | 238 | 238 | 211 | 211 | 255 | 218 | 240 |
| C12 | 53.64 | −54 | 64 | 49 | −62 | −38 | −21 | −63 |
| C13 | 8.5 | 23 | 12 | 3 | 26 | 17 | 39 | 32 |
| C33 | 56.11 | 52 | 57 | 37 | 42 | 35 | 59 | 53 |
| C44 | 26.10 | 19 | 18 | 30 | 19 | 15 | 30 | 26 |
aRef. [41], bRef. [42], cRef. [26], dRef. [43], and eRef. [44].
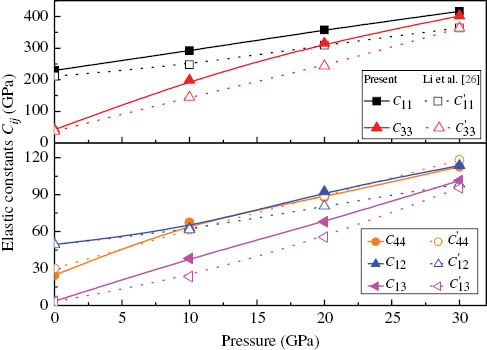
The calculated elastic constants Cij of MoS2 as a function of pressure P. The solid lines represent our results, and the dot lines represent the calculated results by Li et al. from GGA-PBE method.
where
The bulk modulus B, shear modulus G, and Young’s modulus Y can affect physical quality of materials. Bulk modulus B is closely relative to the cohesive energy or bonding energy of atoms in crystals, so it can be used as a measure to describe the average atomic bond strength [46]. Shear modulus G is an important parameter related to the hardness of a material [47]. While Young’s modulus Y is a gauge of the stiffness of a solid, which is in a function of atomic bond strength [48]. For the hexagonal structure MoS2, the bulk modulus B and the shear modulus G can be deduced from [49]
where C66=(C11 − C12)/2. Young’s modulus Y and Poisson’s ratio σ can be calculated by
where G and B are expressed as: B=(BV +BR)/2 and G=(GV+GR)/2. The calculated results are listed in Table 3. The calculated bulk modulus B at 0 GPa is in agreement with experimental data [25] and other theoretical data [26]. It can be seen from Table 3 that the elastic moduli increase gradually with the increase in pressure, that is to say, increasing pressure can improve the hardness of the materials.
Calculated elastic bulk modulus B (GPa), shear modulus G (GPa), Young’s modulus Y (GPa), B/G, the Debye temperature ΘD(K), and hardness H(GPa) of MoS2 at 0 GPa and under pressures.
| P | B | G | Y | B/G | ΘD | H | |
|---|---|---|---|---|---|---|---|
| 0.00 | Present | 50.86 | 46.76 | 107.381 | 1.09 | 278.35 | 14.46 |
| XRD exp.a | 47.65 ± 0.3 | ||||||
| XRD exp.c | 53.4 ± 1 | ||||||
| Li et al.b | 59.13 | 51.05 | 200.000 | 1.16 | |||
| 10.00 | Present | 115.17 | 89.80 | 213.822 | 1.28 | 376.31 | 26.26 |
| Li et al.b | 91.53 | 76.20 | 230.239 | 1.20 | |||
| 20.00 | Present | 164.69 | 112.84 | 275.588 | 1.46 | 418.18 | 31.28 |
| Li et al.b | 136.18 | 100.37 | 280.976 | 1.36 | |||
| 30.00 | Present | 207.36 | 135.01 | 332.797 | 1.54 | 453.74 | 36.57 |
| Li et al.b | 185.85 | 126.51 | 321.018 | 1.47 | |||
| 40.00 | Present | 244.59 | 163.33 | 400.776 | 1.50 | 495.45 | 44.76 |
| Li et al.b | 205.09 | 139.65 | 1.47 |
aXRD experiment by Chi et al. [25], bGGA-PBE calculations by Li et al. [26], and cXRD experiment by Aksoy et al. [28].
Based on the assumptions that bulk modulus B represents the resistance to fracture deformation and shear modulus G represents the resistance to plastic deformation, Pugh [50] proposed the ratio B/G to distinguish ductility and brittleness of a material. The critical value that separates ductile and brittle materials is about 1.75. If B/G>1.75, the material exhibits in a ductile manner; otherwise, it behaves in a brittle manner. In this work, the calculated values of B/G of MoS2 at ambient pressure is 1.09, indicating that MoS2 is brittle at 0 GPa. When the applied pressure increases, the values of B/G become bigger, that is to say, pressure can reduce the brittleness of MoS2. To further investigate the stiffness of MoS2, the microhardness parameter (H) denoting the resistance of the physical object against compression of the contacting parts is proposed [51],
As is known, the Debye temperature is an important fundamental parameter and is closely related to many physical properties of solids, such as the specific heat and melting temperature. From our elastic constants, we can obtain the elastic Debye temperature (Θ). The Debye temperature can be estimated from [52]
where ℏ is Planck’s constant, κ is Boltzmann’s constant, NA is Avogadro’s number, n is the number of atoms per formula unit, M is the molecular mass per formula unit, ρ is the density, and Vm is obtained from [50]
VS and Vl are the shear and longitudinal sound velocities, respectively. The average shear and longitudinal sound velocities can be calculated from Navier’s equations
At 0 K and 0 GPa, we yield Θ = 278.35 K from the elastic constants of MoS2. The obtained Debye temperatures of MoS2 are also listed in Table 3. It is noted that as pressure increases, the Debye temperatures increase monotonically. For materials, usually, the higher the Debye temperature, the larger the microhardness. Therefore, the Debye temperatures also show a larger microhardness with an increasing pressure. The obtained longitudinal, shear, and average wave velocities are illustrated in Figure 6. It is shown that with the increasing pressure, the longitudinal wave velocities Vl increases fast at first, and then gently. The shear wave velocity VS and average wave velocity Vm change slowly with the elevated pressure.
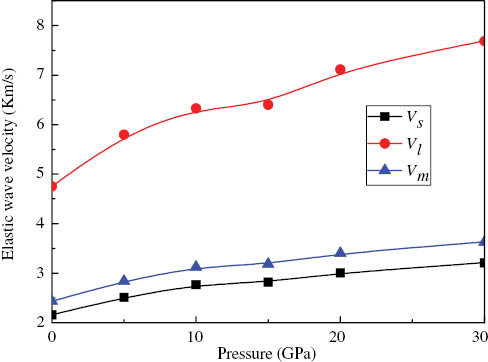
Wave velocities of MoS2 as a function of pressure. Longitudinal wave velocity Vl (the red line), average wave velocity Vm (the blue line), and shear wave velocity VS (the black line).
To quantify the mechanical anisotropy of MoS2, we calculate the bulk modulus Ba along a axis with the c axis fixed and the bulk modulus Bc along c axis with the a axis fixed, which are defined as follows [53]
where Λ=2(C11 + C12) + 4C13α + C33α2 and
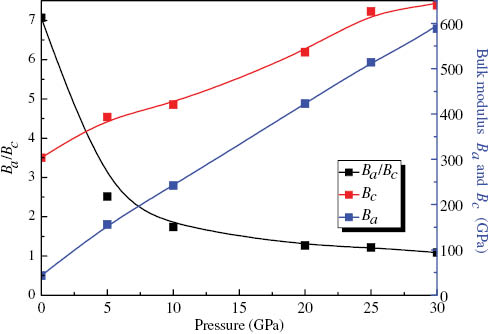
Bulk modulus Ba (the blue line) and Bc (the red line) as well as Ba/Bc (the black line) versus pressure along the a and c axes.
4 Conclusions
In summary, we have investigated the structural, electronic, and elastic properties of MoS2 under pressure by using first-principles calculations within the LDA. The calculated lattice parameters and cell volume of MoS2 are in good agreement with the available experimental data. The band structures, DOSs, elastic constants, elastic modulus, elastic wave velocities, the Debye temperatures, and hardness of MoS2 are obtained. The calculated band gap of MoS2 at 0 GPa is about 0.902 eV. Analysis on the PDOS indicates that the whole valence bands are mainly composed by the Mo-4d and S-3s states at 0 GPa, while they are mainly composed by the Mo-4p, Mo-4d, and S-3p states at 14 GPa. The electronic charge density difference map shows the covalent characteristic of Mo-S, which agrees with the analysis of the Milliken population. The calculated Mo–S bonds length of MoS2 is 2.39 Å, which is consistent with other theoretical values. It is shown that with the increasing pressure, the longitudinal wave velocity increases fast at first, and then gently. The shear wave velocity and average wave velocity change slowly with the elevated pressure. The microhardness of MoS2 also increases with the increasing pressure. Moreover, the elastic constants of MoS2 increase monotonically, and the anisotropies decrease with the increasing pressure.
Acknowledgments
The authors would like to thank the support by the National Natural Science Foundation of China (Grant Nos. 11174214 and 11204192) and the NSAF Joint Fund Jointly set up by the National Natural Science Foundation of China and the Chinese Academy of Engineering Physics (Grant Nos. U1230201 and U1430117). We also acknowledge the support for the computational resources by the State Key Laboratory of Polymer Materials Engineering of China in Sichuan University.
References
[1] S. Bhattacharyya and A. K. Singh, Phys. Rev. B 86, 075454 (2012).10.1103/PhysRevB.86.075454Suche in Google Scholar
[2] Y. Ding, Y. Wang, J. Ni, L. Shi, S. Shi, et al., Physica B 406, 2254 (2011).10.1016/j.physb.2011.03.044Suche in Google Scholar
[3] E. Morosan, H. W. Zandbergen, B. S. Dennis, J. W. G. Bos, Y. Onose, et al., Nat. Phys. 2, 544 (2006).10.1038/nphys360Suche in Google Scholar
[4] A. F. Kusmartseva, A. Akrap, H. Berger, L. Forro, and E. Tutis, Nat. Mater. 7, 960 (2008).10.1038/nmat2318Suche in Google Scholar
[5] W. Z. Hu, G. Li, J. Yan, H. H. Wen, G. Wu, et al., Phys. Rev. B 76, 45 (2007).Suche in Google Scholar
[6] S. W. Han, H. Kwon, S. K. Kim, S. Ryu, W. S. Yun, et al., Phys. Rev. B 84, 45 (2011).10.1103/PhysRevB.84.045409Suche in Google Scholar
[7] T. F. Jaramillo, K. P. Gensen, J. Bonde, J. H. Nielsen, S. Horch, et al., Science 317, 100 (2007).10.1126/science.1141483Suche in Google Scholar PubMed
[8] S. Aralihalli and S. Biswas, Tribol. Lett. 49, 61 (2013).10.1007/s11249-012-0042-5Suche in Google Scholar
[9] X. Fang, C. Hua, X. Guo, Y. Hu, Z. Wang, et al., Electrochim. Acta. 81, 155 (2013).10.1016/j.electacta.2012.07.020Suche in Google Scholar
[10] H. Zeng, J. Dai, W. Yao, D. Xiao, and X. Cui, Nat. Nanotechnol. 7, 490 (2012).10.1038/nnano.2012.95Suche in Google Scholar
[11] S. Kim, A. Konar, W. S. Hwang, J. H. Lee, J. Lee, et al., Nat. Commun. 3, 1011 (2012).10.1038/ncomms2018Suche in Google Scholar
[12] Y. D. Ma, Y. Dai, M. Guo, C. W. Niu, and B. B. Huang, Nanoscale 3, 3883 (2011).10.1039/c1nr10577aSuche in Google Scholar PubMed
[13] P. Lu, X. J. Wu, W. L. Guo, and X. C. Zeng, Phys. Chem. Chem. Phys. 14, 13035 (2012).10.1039/c2cp42181jSuche in Google Scholar
[14] Y. G. Zhou, P. Yang, H. Y. Zu, F. Gao, and X. T. Zu, Phys. Chem. Chem. Phys. 15, 10385 (2013).10.1039/c3cp50381jSuche in Google Scholar
[15] C. Muratore, V. Varshney, J. J. Gengler, J. J. Hu, J. E. Bultman, et al., Phys. Chem. Chem. Phys. 16, 1008 (2014).10.1039/C3CP53746CSuche in Google Scholar
[16] J. N. Yuan, Z. L. Lv, Q. Lu, Y. Cheng, X. R. Chen, et al., Solid State Sci. 40, 1 (2015).10.1016/j.solidstatesciences.2014.12.004Suche in Google Scholar
[17] M. D. Segall, P. J. D. Lindan, M. J. Probert, C. J. Pickard, P. J. Hasnip, et al., J. Phys. Condens. Matt. 14, 2717 (2002).10.1088/0953-8984/14/11/301Suche in Google Scholar
[18] S. J. Clark, M. D. Segall, C. J. Pickard, P. J. Hasnip, M. J. Probert, et al., Z. Kristallogr. 220, 567 (2005).10.1524/zkri.220.5.567.65075Suche in Google Scholar
[19] D. Vanderbilt, Phys. Rev. B 41, 7892 (1990).10.1103/PhysRevB.41.7892Suche in Google Scholar
[20] D. M. Ceperley and B. J. Alder, Phys. Rev. Lett. 45, 566 (1980).10.1103/PhysRevLett.45.566Suche in Google Scholar
[21] J. Perdew and A. Zunger, Phys. Rev. B 23, 5048 (1981).10.1103/PhysRevB.23.5048Suche in Google Scholar
[22] H. J. Monkhorst and J. D. Pack, Phys. Rev. B 13, 5188 (1976).10.1103/PhysRevB.13.5188Suche in Google Scholar
[23] V. Petkov, S. J. L. Billinge, P. Larson, S. D. Mahanti, T. Vogt, et al., Phys. Rev. B 65, 092105 (2002).10.1103/PhysRevB.65.092105Suche in Google Scholar
[24] P. Vinet, J. H. Rose, J. Ferrante, and J. R. Smith, J. Phys. Condens. Matt. 1, 1941 (1989).10.1088/0953-8984/1/11/002Suche in Google Scholar
[25] Z. H. Chi, X. M. Zhao, H. D. Zhang, A. F. Goncharov, S. S. Lobanov, et al., Phys. Rev. Lett. 113, 036802 (2014).10.1103/PhysRevLett.113.036802Suche in Google Scholar
[26] W. Li, J. F. Chen, Q. Y. He, and T. Wang, Physica B 405, 2498 (2010).10.1016/j.physb.2010.03.022Suche in Google Scholar
[27] A. P. Nayak, S. Bhattacharyya, J. Zhu, J. Liu, X. Wu, et al., Nat. Commun. 5, 3731 (2014).10.1038/ncomms4731Suche in Google Scholar
[28] R. Aksoy, Y. Ma, E. Selvi, M. C. Chyu, A. Ertas, et al., J. Phys. Chem. Solids 67, 1914 (2006).10.1016/j.jpcs.2006.05.058Suche in Google Scholar
[29] H. H. Guo, T. Yang, P. Tao, Y. Wang, and Z. D. Zhang, J. Appl. Phys. 113, 013709 (2013).10.1063/1.4772616Suche in Google Scholar
[30] N. Bandaru, R. S. Kumar, D. Sneed, O. Tschauner, J. Baker, et al., J. Phys. Chem. C 118, 3230 (2014).10.1021/jp410167kSuche in Google Scholar
[31] R. Shidpour and M. Manteghian, Chem. Phys. 360, 97 (2009).10.1016/j.chemphys.2009.04.015Suche in Google Scholar
[32] H. Peelaers and C. G. Van de Walle, Phys. Rev. B 86, 241401(R) (2012).10.1103/PhysRevB.86.241401Suche in Google Scholar
[33] S. Lebegue and O. Eriksson, Phys. Rev. B 79, 115409 (2009).10.1103/PhysRevB.79.115409Suche in Google Scholar
[34] R. S. Mulliken, J. Chem. Phys. 23, 1833 (1955).10.1063/1.1740588Suche in Google Scholar
[35] Y. D. Fu, X. X. Feng, M. F. Yan, K. Wang, and S. Y. Wang, Physica B 426, 103 (2013).10.1016/j.physb.2013.06.003Suche in Google Scholar
[36] Q. Yue, J. Kang, Z. Z. Shao, X. A Zhang, S. L. Chang, et al., Phys. Lett. A 376, 1166 (2012).10.1016/j.physleta.2012.02.029Suche in Google Scholar
[37] A. Molina-Sánchez and L. Wirtz, Phys. Rev. B 84, 155413 (2011).10.1103/PhysRevB.84.155413Suche in Google Scholar
[38] A. E. Reed, R. B. Weinstock, and F. Weinhold, J. Chem. Phys. 83, 735 (1985).10.1063/1.449486Suche in Google Scholar
[39] T. Lu and F. W. Chen, Acta. Phys. Chim. Sin. 28, 1 (2012).Suche in Google Scholar
[40] D. C. Wallace, Thermodynamics of Crystals, Wiley, New York 1972.10.1119/1.1987046Suche in Google Scholar
[41] J. Feldman, J. Phys. Chem. Solids 37, 1141 (1976).10.1103/PhysRevLett.37.1141Suche in Google Scholar
[42] H. Peelaers and C. G. Van de Walle, J. Phys. Chem. C 118, 12073 (2014).10.1021/jp503683hSuche in Google Scholar
[43] T. Todorova, V. Alexiev, R. Prins, and T. Weber, Phys. Chem. Chem. Phys. 6, 3023 (2004).10.1039/B402993NSuche in Google Scholar
[44] V. Alexiev, R. Prins, and T. Weber, Phys. Chem. Chem. Phys. 2, 1815 (2000).10.1039/a909293eSuche in Google Scholar
[45] M. Born and K. Huang, Dynamical Theory and Experiment I, Springer-Verlag, Berlin 1982.Suche in Google Scholar
[46] K. A. Gschneidner, Solid State Phys. 16, 275 (1964).10.1016/S0081-1947(08)60518-4Suche in Google Scholar
[47] D. M. Teter, MRS Bull. 23, 22 (1998).10.1557/S0883769400031420Suche in Google Scholar
[48] A. Q. Morrison, E. D. Case, F. Rena, A. J. Baumann, D. C. Kleinow, et al., Mater. Chem. Phys. 134, 973 (2012).10.1016/j.matchemphys.2012.03.100Suche in Google Scholar
[49] A. Reuss, Z. Angew. Math. Mech. 9, 49 (1929).10.1002/zamm.19290090104Suche in Google Scholar
[50] S. F. Pugh, Philos. Mag. 45, 823 (1954).10.1080/14786440808520496Suche in Google Scholar
[51] E. S. Yousef, A. El-Adawy, and N. El-KheshKhany, Solid State Commun. 139, 108 (2006).Suche in Google Scholar
[52] O. L. Anderson, J. Phys. Chem. Solids. 24, 909 (1963).10.1016/0022-3697(63)90067-2Suche in Google Scholar
[53] P. Ravindran, L. Fast, P. A. Korzhavyi, B. Johnnsson, J. Wills, et al., J. Appl. Phys. 84, 4891 (1998).10.1063/1.368733Suche in Google Scholar
©2015 by De Gruyter
Artikel in diesem Heft
- Frontmatter
- On the Fermi–Walker Derivative for Inextensible Flows
- Group Theoretical Analysis and Invariant Solutions for Unsteady Flow of a Fourth-Grade Fluid over an Infinite Plate Undergoing Impulsive Motion in a Darcy Porous Medium
- Dirac Bound States of the Killingbeck Potential Under External Magnetic Fields
- Dielectric Relaxation Studies of Ternary Mixture of Dimethyl Phthalate and Heptanol in Benzene Solution in the Microwave Region
- Application of Rabinowitsch Fluid Model for the Mathematical Analysis of Peristaltic Flow in a Curved Channel
- 1H and 13C NMR and Electrical Conductivity Studies on New Ionic Plastic Crystals of Tetraalkylammonium Tetraethylborate
- First-Principles Study of Electronic and Elastic Properties of Hexagonal Layered Crystal MoS2 Under Pressure
- Interaction Behaviours Between Soliton and Cnoidal Periodic Waves for the Cubic Generalised Kadomtsev–Petviashvili Equation
- Emission of Gravitational Waves from a Magnetohydrodynamic Dynamo in the Center of the Sun
- Theoretical Studies of the Local Structures and EPR Parameters for the Rhombic Cu2+ Center in Cu0.5Zr2(PO4)3 Phosphate
- Multi-Soliton and Rational Solutions for the Extended Fifth-Order KdV Equation in Fluids
- Hydromagnetic Flow and Heat Transfer of a Jeffrey Fluid over an Oscillatory Stretching Surface
- Rapid Communication
- Note on the Equivalence of Variable Separation Solutions Based On the Improved tanh-Function Method