Hydrogen-bonding in mono-, di- and tetramethylammonium dihydrogenphosphites
-
Matthias Kogler


Abstract
The crystal structures of methylammonium and dimethylammonium dihydrogenphosphite (MA⋅H2PO3, I2/a and DMA⋅H2PO3,
1 Introduction
In our current line of research, we synthesized the 1:1 mono-, di-, tri- and tetramethylammonium salts of phosphorous acid
where M stands for a monovalent cation. The non-hydrous mono- and dimethylammonium (MA and DMA) salts crystallized at 280 and 255 K, respectively. In contrast, the trimethylammonium salt remained an oil even at 255 K. The tetramethylammonium (TMA) salt, on the other hand, crystallized at 280 K with one molecule of crystal water, which was introduced by the TMAOH⋅5H2O reactant.
As a routine analysis method, we determined the crystal structures of the crystalline salts at 100 K. In contrast to MA⋅H2PO3 and DMA⋅H2PO3, whose structures were trivially solved and refined, crystals of TMA⋅H2PO3⋅H2O were threefold twins of orthorhombic individuals with a pseudo-cubic symmetry. Since the crystals were optically isotropic at room temperature, we likewise determined their structure at higher temperatures. Indeed, at 150 and 200 K the crystals adopt a cubic symmetry.
The phase transition between the orthorhombic low-temperature (LT) and cubic high-temperature (HT) phases is due to the ordering of the hydrogen bonding network on cooling. Ordering of hydrogen bonding is one of the most important causes of order-disorder phase transitions in the solid state, the most well studied example probably being the potassium dihydrogen phosphate family of compounds [1]. The members of this family are ferroelectric below and paraelectric above the phase transition temperature.
In this work we present the order-disorder phase transition of TMA⋅H2PO3⋅H2O. It will be analyzed in the light of symmetry reduction and the topology of the hydrogen bonding network. Moreover, the hydrogen bonding networks MA⋅H2PO3 and DMA⋅H2PO3 are discussed briefly.
2 Experimental
2.1 Synthesis and crystal growth
2.1.1 MA⋅H2PO3
3.53 g (38 mmol) 33%wt ethanolic MeNH2 were added to 3.02 g (37 mmol) H3PO3 with stirring. The immediately precipitated white powder redissolved owing to heat of reaction. On cooling to 280 K, crystals of MA⋅H2PO3 formed. The sample was single-phase according to X-ray powder diffraction (XRPD).
2.1.2 DMA⋅H2PO3
4.26 g (38 mmol) 40%wt aqueous Me2NH was added to 3.01 g (37 mmol) H3PO3 with stirring. The solution was dried one day in vacuo over H2SO4. The residue crystallized at 255 K. Phase purity could not be established using standard XRPD procedures owing to the deliquescence of the sample.
2.1.3 Me3NH⋅H2PO3
6.19 g (37 mmol) 35%wt ethanolic Me3N was added to 3.07 g (37 mmol) H3PO3 with stirring. The solution was immediately attached to a vacuum pump (10−4 mbar) for two days. The resulting viscous liquid did not crystallize even at 255 K for a prolonged time. Cooling using liquid N2 led to formation of a glass, which melted when warming to 255 K. Analogous reaction from aqueous Me3N and drying for two days at 10−4 mbar likewise afforded an oil, which didn’t crystallize at 255 K. Likewise, drying in a vacuum desiccator over KOH followed by cooling did not result in crystallization.
2.1.4 TMA⋅H2PO3⋅H2O
3.09 g (37 mmol) H3PO3 and 6.64 g (37 mmol) TMAOH⋅5H2O were dissolved in MeOH. Excess MeOH and water was removed in vacuum (10−4 mbar) for two days. Crystallization was induced by cooling to 280 K. XRPD analysis was not attempted owing to the deliquescence of the crystals.
2.2 Data collection and reduction
The crystals were immersed in perfluorinated polyether oil and quickly attached to Kapton micro mounts under a polarizing microscope. Mounting crystals of TMA⋅H2PO3⋅H2O posed a challenge, because the cubic crystals are optically isotropic at room temperature and possess an index of refraction close to that of the employed polyether. Thus, the crystals were cut with a knife into reasonable sized fragments without visual feedback and then moved out of the oil to assess their shape and size.
Intensity data were collected in a dry stream of nitrogen on a Bruker Kappa Apex II diffractometer system equipped with a CCD detector using graphite monochromatized sealed tube MoKα radiation. Frame data were converted to intensity values using Saint-Plus and a correction for absorption effects was applied using the multi-scan approach implemented in Sadabs [2]. MA⋅H2PO3 and DMA⋅H2PO3 crystals were immersed directly into a 100 K N2 stream. TMA⋅H2PO3⋅H2O crystals diffracted poorly when cooled quickly below phase transition temperature. Therefore, the TMA⋅H2PO3⋅H2O crystal described herein was mounted at 250 K and then measured at 200, 150 and 100 K with a cooling rate of 240 K/h before each measurement.
The structures were solved with Shelxt [3] and refined against F2 using Shelxl [4]. H atoms attached to C were placed at calculated positions and refined as riding on their parent atoms. H atoms attached to P and N were refined freely and the P–H, N–H and O–H distances restrained to 1.350 (1) Å (P) and 0.870 (1) Å (N, O). The water and phosphonate O atoms in the HT structure of TMA⋅H2PO3⋅H2O were refined as positionally disordered about two positions. The total occupancy was constrained to 1 and the occupancy of both minor positions constrained to the same value. Likewise, a phosphonate O atom was refined as positionally disordered in DMA⋅H2PO3, owing to a distinct peak in the difference Fourier map, which could not be explained by other means.
Since the low-temperature (LT) structure of TMA⋅H2PO3⋅H2O has orthorhombic P212121 symmetry, the directions of three axes can in principle be chosen arbitrarily among the three directions of the 21screw axes. Formally, this is described by the affine normalizer [5] of P212121, which contains affine transformations that permutate the axes. However, the conventional cell choice fixes the orientation of the basis according to the a < b < c condition on the cell parameters, with the caveat that the b and c parameters are very close (ca. 9.61 vs. 9.63 Å or less than 0.2% difference) and their order might have been mis-determined owing to twinning. For consistency reasons, this setting was used for the LT phase.
In contrast, the high-temperature (HT) structure of TMA⋅H2PO3⋅H2O features the cubic P213 symmetry, which is devoid of the fourfold rotation of the cubic primitive (cP) lattice. Therefore, the structure can be described in two orientations, which are related by this fourfold rotation and the conventional cell choice does not give precedence over one of the two. In this case, the orientation was chosen in such a way that the coordinates of the HT phase are comparable to those of the LT phase. Thereto, the coordinate system had to be rotated by 90° about [100] with respect to the setting arbitrarily chosen by the diffractometer software.
More data collection and structure refinement data are collected in Table 1. Model data are deposited in the CIF format at the CCDC and can be retrieved using the deposition numbers listed at the bottom of Table 1.
Data collection and structure refinement details.
| MA⋅H2PO3 | DMA⋅H2PO3 | TMA⋅H2PO3⋅H2O | TMA⋅H2PO3⋅H2O | |
|---|---|---|---|---|
| Crystal data | ||||
| Chemical formula | CH8NO3P | C2H10NO3P | C4H16NO4P | C4H16NO4P |
| Mr | 113.05 | 127.08 | 173.15 | 173.15 |
| Temperature (K) | 100 | 100 | 100 | 150 |
| Crystal system, space group | Monoclinic, I2/a | Monoclinic, P21/c | Orthorhombic, P212121 | Cubic, P213 |
| a, b, c (Å) | 8.2503 (5), 12.5988 (7), 9.6822 (5) | 5.6086 (13), 11.554 (2), 9.544 (2) | 9.4907 (18), 9.6078 (19), 9.6270 (18) | 9.639 (2), 9.639 (2), 9.639 (2) |
| β (°) | 93.252 (4) | 96.556 (5) | 90 | 90 |
| V (Å3) | 1004.78 (10) | 614.4 (2) | 877.8 (3) | 895.6 (6) |
| Z | 8 | 4 | 4 | 4 |
| Radiation type | Mo Kα | Mo Kα | Mo Kα | Mo Kα |
| μ (mm−1) | 0.43 | 0.36 | 0.28 | 0.28 |
| Crystal size (mm) | 0.30 × 0.17 × 0.02 | 0.40 × 0.25 × 0.12 | 0.32 × 0.30 × 0.17 | 0.32 × 0.30 × 0.17 |
| Data collection | ||||
| Diffractometer | Bruker KAPPA APEX II CCD | Bruker KAPPA APEX II CCD | Bruker KAPPA APEX II CCD | Bruker KAPPA APEX II CCD |
| Absorption correction | Multi-scan (SADABS) | Multi-scan (SADABS) | Multi-scan (SADABS) | Multi-scan (SADABS) |
| Tmin, Tmax | 0.442, 0.497 | 0.220, 0.272 | 0.441, 0.493 | 0.441, 0.493 |
| No. of measured, independent and observed [ | 12364, 2252, 2024 | 9350, 2739, 2385 | 10019, 2478, 2360 | 9200, 870, 847 |
| Rint | 0.029 | 0.022 | 0.032 | 0.028 |
| Refinement | ||||
| 0.811 | 0.815 | 0.706 | 0.704 | |
| 0.022, 0.062, 1.06 | 0.025, 0.072, 1.06 | 0.038, 0.085, 1.24 | 0.021, 0.058, 1.08 | |
| No. of parameters | 72 | 86 | 113 | 49 |
| No. of restraints | 5 | 4 | 4 | 4 |
| 0.57, −0.35 | 0.43, −0.32 | 0.54, −0.49 | 0.20, −0.11 | |
| Twin operations | – | – | – | |
| Twin volume fractions | – | – | 63.9:25.5:10.6 (8) | – |
| Flack parameter | – | – | −0.04(3) | −0.08(3) |
| CCDC number | 2036785 | 2036786 | 2036787 | 2036788 |
3 Results and discussion
3.1 General remarks
The structures of the crystals under investigation follow the expected building mechanisms. The H2
P–O distances in the crystals under investigation and LiH2PO3[6]. The O atom of the hydrogen bond donating hydroxyl fragment is O3. The hydrogen bond acceptor of the hydoroxyl group is O2. The HT phase of TMA⋅H2PO3⋅H2O is not listed because the H2
| Crystal | P1–O1 (Å) | P1–O2 (Å) | P1–O3 (Å) |
|---|---|---|---|
| MA⋅H2PO3 | 1.5041 (5) | 1.5077 (5) | 1.5743 (6) |
| DMA⋅H2PO3 | 1.503 (2) | 1.4999 (6) | 1.5728 (6) |
| TMA⋅H2PO3⋅H2O, 100 K | 1.481 (4) | 1.496 (4) | 1.568 (4) |
| LiH2PO3 | 1.497 (2) | 1.506 (2) | 1.586 (2) |
All structures are simple in the sense that the asymmetric unit contains at most one formula unit (
3.2 MA⋅H2PO3 and DMA⋅H2PO3
The main building blocks of MA⋅H2PO3 and DMA⋅H2PO3 are infinite chains of H2
![Figure 1: Chains of hydrogen bonded H2PO3−${\text{PO}}_{3}^{-}$ ions in (a) MA⋅H2PO3 and (b) DMA⋅H2PO3 extending along [100] viewed down [001] and [100] (left and right, respectively). P (pink), O (red) and C (gray) atoms are represented by ellipsoids drawn at the 50% probability levels, H atoms (white) by sphere of arbitrary radius. H⋯O hydrogen bonds are represented by dashed lines. In the [100] views, the direction of P–H-bonds are indicated by arrows. The minor (ca. 5%) positions of O1 in DMA⋅H2PO3 are omitted for clarity.](/document/doi/10.1515/zkri-2020-0088/asset/graphic/j_zkri-2020-0088_fig_001.jpg)
Chains of hydrogen bonded H2
Variations of such hydrogen-bonded chains of H2
In MA⋅H2PO3, the MA ion donates with all three ammonium H atoms to three distinct chains, thus forming a triperiodic network (Figure 2(a)). The DMA ion in DMA⋅H2PO3, on the other hand, possesses only two ammonium Hs, and each ion therefore connects only two chains, ultimately leading to a diperiodic hydrogen bonding network, which extends parallel to (100) (Figure 2(b)).
![Figure 2: The crystal structures of (a) MA⋅H2PO3 and (b) DMA⋅H2PO3 viewed down [001]. a- and c-glide planes are represented by the usual symbols, viz. dashed (intrinsic translation parallel to the drawing plane) and dotted (perpendicular to the drawing plane) lines, respectively. Atom color codes as in Figure 1, N atoms are blue.](/document/doi/10.1515/zkri-2020-0088/asset/graphic/j_zkri-2020-0088_fig_002.jpg)
The crystal structures of (a) MA⋅H2PO3 and (b) DMA⋅H2PO3 viewed down [001]. a- and c-glide planes are represented by the usual symbols, viz. dashed (intrinsic translation parallel to the drawing plane) and dotted (perpendicular to the drawing plane) lines, respectively. Atom color codes as in Figure 1, N atoms are blue.
In DMA⋅H2PO3, the DMA ion donates only to the O atom of H2
3.3 TMA⋅H2PO3⋅H2O
3.3.1 HT phase
The HT phase of TMA⋅H2PO3⋅H2O crystallizes in the cubic P213 symmetry. The TMA cation, the H2
Since the O atom of the water molecule is located (on average) on the threefold axis, it is formally connected to 3 H atoms, which therefore must feature an occupancy of
Thus, every H2O molecule and every H2 resulting on average in a site with 3 symmetry. The H2O molecules on a threefold axis in the [111]direction connects to three H2
The situation is analogous for the H2 and likewise connects to H2O molecules located on threefold axes in precisely the other directions.
Combining these fragments, a rather complex triperiodic hydrogen bonding network is formed. In the free space of this network are located the TMA anions, which do not partake in hydrogen bonding owing to a lack of donor and acceptor groups (Figure 3). The view down [111] shows the threefold symmetry.
![Figure 3: The cubic HT phase of TMA⋅H2PO3⋅H2O viewed down (a) [100] and (b) [111]. Atom colors as in Figure 2. The TMA ions are omitted in (b) for clarity. Threefold rotation and screw rotation axes in (b) are are indicated by the usual symbols [13]. The minor positions of the O atoms (ca. 7%) are omitted for clarity.](/document/doi/10.1515/zkri-2020-0088/asset/graphic/j_zkri-2020-0088_fig_003.jpg)
The cubic HT phase of TMA⋅H2PO3⋅H2O viewed down (a) [100] and (b) [111]. Atom colors as in Figure 2. The TMA ions are omitted in (b) for clarity. Threefold rotation and screw rotation axes in (b) are are indicated by the usual symbols [13]. The minor positions of the O atoms (ca. 7%) are omitted for clarity.
The intricate triperiodic hydrogen bonding network can be conveniently represented using a labeled quotient graph [14], where every node represents an ion or molecule and all its translationally equivalents: Here, P and O nodes stand for H2
The graph above is arranged in the form of a cube to highlight the cubic 23 point symmetry: P and O nodes on the same space diagonal of the cube are located on threefold axes in the same direction in the actual structure. However, to trace paths in the graph, a planarized version such as is more convenient. The dotted arrows in Eq. (5) indicate the walk around a face of the “cube”. However, such a cycle in the graph does not correspond to a cycle in the actual hydrogen bonding network. Indeed, summation of the voltages in the case above leads to a lattice translation in the [001] direction for every full cycle. Thus, the indicated path corresponds to a helicoidal structure with period four (with respect to translational equivalence) about an 21 axis. These helices extend in the three main directions ⟨100⟩. An example of each direction is shown in Figure 4 by blue ([100]), green ([010]) and yellow ([001]) backdrops. Each direction corresponds to a pair of opposing faces in the “cube” and each face of such a pair corresponds to two opposite orientations of the chain.
![Figure 4: The HT phase of TMA⋅H2PO3⋅H2O viewed down [100], with TMA ions omitted for clarity. The same projection is given twice to avoid overlap of the colored regions. Atom colors as in Figure 1. 21 screw rotations axes are indicated by the usual symbols [13]. Examples of helicoidal chains of the hydrogen-bonding network with two H2PO3−$\mathrm{P}{\mathrm{O}}_{\mathrm{3}}^{-}$ ions and two water molecules per translation period are highlighted by green, blue and yellow regions. An example of a ten-node cycle is highlighted in red. The minor positions of the O atoms (ca. 7%) are omitted for clarity.](/document/doi/10.1515/zkri-2020-0088/asset/graphic/j_zkri-2020-0088_fig_004.jpg)
The HT phase of TMA⋅H2PO3⋅H2O viewed down [100], with TMA ions omitted for clarity. The same projection is given twice to avoid overlap of the colored regions. Atom colors as in Figure 1. 21 screw rotations axes are indicated by the usual symbols [13]. Examples of helicoidal chains of the hydrogen-bonding network with two H2
The shortest actual cycle in the structure is obtained by combining two walks about two opposing faces of the “cube” as depicted in because paths on opposing faces screw in opposing directions. In this path, the sum of the voltages is the zero translation. Note that the edge that is crossed twice in the graph corresponds to two different bonds in the actual structure, which are related by a lattice translation. Such a ten-node cycle is highlighted by red color in Figure 4(b) and shown in Figure 5. The translationally equivalent H2
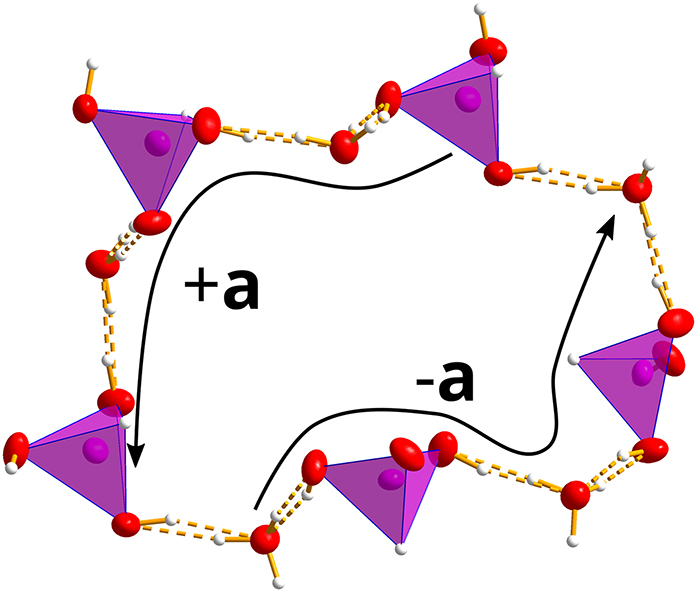
A ten-node cycle in TMA⋅H2PO3⋅H2O. Atom colors as in Figure 1. The two four-node helix fragments (from H2O to H2O and from H2
In addition to the disordered hydrogen bonding, distinct electron density in the difference Fourier maps showed that the H2O molecule features additional, most likely dynamical, disorder. Both positions are located on the three fold rotation axis. Refinement of the occupancies of both positions, while constraining the sum to 1 led to a 93:70 (5) ratio. The O atoms of the H2

Disorder of a water molecule connecting two H2
3.3.2 LT phase
On cooling, both disorders of the HT phase (hydrogen bonding network and positional disorder) are “frozen”. The minor position of the positional disorder is never realized and for every H2
Under the assumption that the LT phase is fully ordered, all threefold rotation axes are lost on cooling, because a threefold rotation is incompatible with the symmetry of H2O and H2
A priori, we can of course not rule out that the LT phase is partially disordered and thus still features threefold rotations. The observed lattice is in principle compatible with R3 symmetry with with cell parameters analogous to the HT phase. However, overall the diffraction data was more consistent with an ordered orthorhombic P212121 structure than any other model. The point symmetry of the intensity data was more in line with an orthorhombic than a rhombohedral space group (Rint = 2.8% for P212121 vs. Rint > 10% for R3). Moreover, a very convincing model was obtained in the P212121 space group, featuring no disorder and the expected geometry of the ordered H2
The P212121 space group has no special positions, thus the symmetries of the TMA cation, the H2
Site symmetry group and occupancy of atoms in the HT and LT phases of TMA⋅H2PO3⋅H2O. Methyl Hs are not listed and positional disorder of the O atoms is ignored. Ow designates the water molecule, other O atoms belong to the H2
| LT | HT | ||||
|---|---|---|---|---|---|
| Atom | Site symmetry group | Occ. | Atom | Site symmetry group | Occ. |
| P1 | 3 | 1 | P1 | 1 | 1 |
| Hp1 | 3 | 1 | Hp1 | 1 | 1 |
| O1 | 1 | 1 | O1 | 1 | 1 |
| O2 | 1 | 1 | |||
| O3 | 1 | 1 | |||
| Ho1 | 1 | Ho3 | 1 | 1 | |
| Ow | 3 | 1 | Ow | 1 | 1 |
| Hw1 | 1 | Hw1 | 1 | 1 | |
| Hw2 | 1 | 1 | |||
| N1 | 3 | 1 | N1 | 1 | 1 |
| C1 | 3 | 1 | C1 | 1 | 1 |
| C2 | 1 | 1 | C2 | 1 | 1 |
| C3 | 1 | 1 | |||
| C4 | 1 | 1 | |||
Since the hydrogen bonding is ordered in the LT phase, it can be represented by the directed graph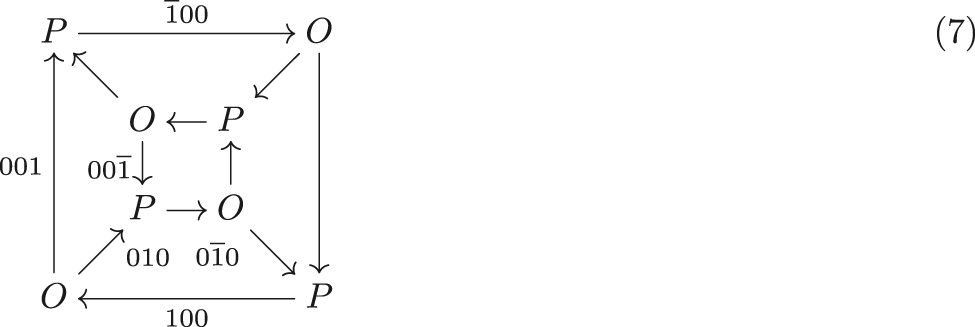 where an → arrow indicates a directed O–H⋯O bond. Accordingly, every O (H2O) node has two outgoing and one incoming edge and vice-versa for P (H2
![Figure 7: Hydrogen bonding network in the LT phase of TMA⋅H2PO3⋅H2O viewed down [100]. Color codes of atoms and helices as in Figure 4. Directed hydrogen bonds in the highlighted areas are indicated by arrows.](/document/doi/10.1515/zkri-2020-0088/asset/graphic/j_zkri-2020-0088_fig_007.jpg)
Hydrogen bonding network in the LT phase of TMA⋅H2PO3⋅H2O viewed down [100]. Color codes of atoms and helices as in Figure 4. Directed hydrogen bonds in the highlighted areas are indicated by arrows.
3.3.3 Twinning
The cubic 23 point group of the HT phase is a merohedry, which means that it is of a lower symmetry than the
For twinning to occur, there needs to be a continuity of either an arbitrary substructure [17] or in the form of full layers as in the order-disorder (OD) theory [18], which apparently is not the case here. Note that the OD theory is unrelated to the order-disorder type of phase transition described herein.
The 222 point group of the LT phase is a subgroup of index
Since the translation lattice remains in principle unchanged during the phase transition (neglecting the small deviation from cubic metrics), the twinning is by pseudo-merohedry. This means that the twin index is n = 1, i.e. all three twin individuals possess diffraction spots at (approximately) the same location in reciprocal space. The deviation from cubic metrics causes a splitting of reflections, which is expressed by the twin obliquity ω, the angle of the three-fold [111] rotation axis to the normal of the (111) plane. For the orthorhombic lattice of the LT phase of TMA⋅H2PO3⋅H2O it calculates as
which, using the cell parameters of the LT phase, gives
3.4 Conclusion and outlook
The structure of TMA⋅H2PO3⋅H2O is seemingly trivial with only one third (HT) or one (LT) formula unit in the asymmetric unit. Nevertheless, owing to the cubic symmetry a surprisingly intricate hydrogen bonding network is formed. An analysis of the hydrogen-bonding topology and the symmetry relations clears the fog and simplifies these complexities, which arise from simple building principles. Tracing paths in a planarized voltage graph significantly facilitates the identification of infinite motifs in a triperiodic network. Moreover, in this case, the order-disorder phase transition can be represented by mapping directed and undirected graphs.
In general, for unsubstituted and methyl-substituted ammonium salts of dihydrogenphosphite the readiness to crystallize decreases with the number of hydrogens in the ammonium cation, showing the significance of hydrogen bonding in this system. In contradiction to this trend, we couldn’t crystallize the trimethylammonium salt, whereas TMA crystallized inside an extended hydrogen bonding network formed by water and H2
Acknowledgments
The constructive feedback of two anonymous referees is highly appreciated and distinctly improved the manuscript.
Author contributions: All the authors have accepted responsibility for the entire content of this submitted manuscript and approved submission.
Research funding: None declared.
Conflict of interest statement: The authors declare no conflicts of interest regarding this article.
References
1. Schmidt, V. H. Ferroelectrics 1987, 72, 157; https://doi.org/10.1080/00150198708017945.Search in Google Scholar
2. Bruker AXS Inc. APEXII, SAINT and SADABS: Madison, Wisconsin, USA, 2020.Search in Google Scholar
3. Sheldrick, G. M. Acta Crystallogr. A 2015, 71, 3; https://doi.org/10.1107/s2053273314026370.Search in Google Scholar
4. Sheldrick, G. M. Acta Crystallogr. C 2015, 71, 3; https://doi.org/10.1107/s2053273314026370.Search in Google Scholar
5. Koch, E., Fischer, W., Müller, U., Aroyo, M. I. Normalizers of space groups and their use in crystallography. In International Tables for Crystallography; IUCr: Chester, Vol. A, 2016; p. 826.10.1107/97809553602060000933Search in Google Scholar
6. Johansson, G. B., Lindqvist, O. Acta Crystallogr. B 1976, 32, 412; https://doi.org/10.1107/s0567740876003130.Search in Google Scholar
7. Jeffrey, G. A. An Introduction to Hydrogen Bonding; Oxford University Press: Oxford, 1997.Search in Google Scholar
8. Kratotochvíl, B., Podlahová, J., Hašek, K. Acta Crystallogr. C 1983, 39, 326.10.1107/S010827018300459XSearch in Google Scholar
9. Melichar, Z., Kratochvíl, B., Podlahová, J., Petříček, V., Malý, K., Císařová, I. Acta Crystallogr. C 1984, 40, 720; https://doi.org/10.1107/s0108270184005473.Search in Google Scholar
10. Sghyar, M., Durand, J., Cot, L., Rafiq, M. Acta Crystallogr. C 1991, 47, 8; https://doi.org/10.1107/s010827019000659x.Search in Google Scholar
11. Sghyar, M., Durand, J., Cot, L., Rafiq, M. Acta Crystallogr. C 1990, 46, 1378; https://doi.org/10.1107/s0108270189013703.Search in Google Scholar
12. Ouarsal, R., Tahiri, A. A., Bali, B. E., Lachkar, M., Bolte, M. Acta Crystallogr. E 2002, 58, i19; https://doi.org/10.1107/s1600536802000806.Search in Google Scholar
13. Hahn, Th., Aroyo, M. I. Space-group symmetry. In Aroyo, M. I., Ed. International Tables for Crystallography; IUCr: Chester, Vol. A, 2016; p. 144.10.1107/97809553602060000114Search in Google Scholar
14. Eon, J.-G. Acta Crystallogr. A 2011, 67, 68; https://doi.org/10.1107/s0108767310042832.Search in Google Scholar
15. Müller, U. Z. Anorg. Allg. Chem. 2004, 630, 1519; https://doi.org/10.1002/zaac.200400250.Search in Google Scholar
16. Grimmer, H., Nespolo, M. Z. Kristallogr. 2006, 221, 28; https://doi.org/10.1524/zkri.2006.221.1.28.Search in Google Scholar
17. Nespolo, M., Souvignier, B. Cryst. Res. Technol. 2015, 50, 442; https://doi.org/10.1002/crat.201400480.Search in Google Scholar
18. Dornberger-Schiff, K., Grell-Niemann, H. Acta Crystallogr. 1961, 14, 167; https://doi.org/10.1107/s0365110x61000607.Search in Google Scholar
19. Nespolo, M. Z. Kristallogr. 2004, 219, 57; https://doi.org/10.1524/zkri.219.12.773.55868.Search in Google Scholar
© 2020 Matthias Kogler and Berthold Stöger, published by De Gruyter, Berlin/Boston
This work is licensed under the Creative Commons Attribution 4.0 International License.
Articles in the same Issue
- Frontmatter
- In this issue
- Original papers
- Phase stability analysis of shocked ammonium dihydrogen phosphate by X-ray and Raman scattering studies
- Effect of solution acidity on the crystallization of polychromates in uranyl-bearing systems: synthesis and crystal structures of Rb2[(UO2)(Cr2O7)(NO3)2] and two new polymorphs of Rb2Cr3O10
- Novel tetrazole PtII and PdII complexes with enhanced water solubility: synthesis, structural characterization and evaluation of antiproliferative activity
- Hydrogen-bonding in mono-, di- and tetramethylammonium dihydrogenphosphites
- Photophysical property change of N-(5-bromo-salicylidene)-3-aminoethylpyridine monohydrated crystals via dehydration phase transition