Two approaches for measurement uncertainty estimation: which role for bias? Complete blood count experience
-
Hatice Bozkurt Yavuz

 ,
Süleyman Caner Karahan
,
Hüseyin Yaman
,
Asım Örem
und
Yüksel Aliyazıcıoğlu
,
Süleyman Caner Karahan
,
Hüseyin Yaman
,
Asım Örem
und
Yüksel Aliyazıcıoğlu

Abstract
Objectives
Measurement uncertainty is described as a magnitude indicates the distribution of the measurement results. AACB Guideline suggests that bias should not be included in the uncertainty calculation contrary to Nordtest Guideline. The aim of the study is to calculate the uncertainty values of certain complete blood count (CBC) parameters and evaluate the contribution of bias.
Methods
This retrospective study was performed with the quality control data of January–December 2017 of two different CBC autoanalyser models (Beckman Coulter LH780 and DXH800). Measurement uncertainties were calculated according to AACB and Nordtest Guidelines. Imprecision, i.e. measurement uncertainty, varies with concentration. Imprecision values of user manuals, as performance characteristics of autoanalyzers, were used for assessment.
Results
User manuals imprecision values of different levels of platelets are between 3.3 and 14%. As the concentrations of platelets decrease, imprecision is observed to increase. This is expected to be parallel with measurement uncertainty. Contrary to user manuals, uncertainty values of AACB found to be so close to each other (between 3.41% and 4.80%), regardless of concentration level. However Nordtest guideline is more compatible with user manuals (between 6.97% and 15.35%).
Conclusions
When evaluated with the performance expectations, bias should be used in measurement uncertainty. Calculation of uncertainty for different concentration level is also important.
Amaç
Ölçüm belirsizliği, bir büyüklük olarak ölçüm sonuçlarının dağılımını ifade eder. AACB Kılavuzu, Nordtest Kılavuzunun aksine, biasın belirsizlik hesaplamasına dahil edilmesini önermemektedir. Çalışmanın amacı, belirli tam kan sayımı (CBC) parametrelerinin belirsizlik değerlerini hesaplamak ve biasın katkısını değerlendirmektir.
Gereç ve Yöntemler
Bu retrospektif çalışma, iki farklı CBC otoanalizör modelinin (Beckman Coulter LH780 ve DXH800) Ocak-Aralık 2017 kalite kontrol verileriyle gerçekleştirildi. Ölçüm belirsizlikleri AACB ve Nordtest Kılavuzlarına göre hesaplandı. İmpresizyon, dolayısıyla ölçüm belirsizliği, konsantrasyona göre değişir. Belirsizlik sonuçlarını değerlendirmede otoanalizörlerin kullanım kılavuzlarında yer alan impresizyona dayalı performans özellikleri kullanılmıştır.
Bulgular
Farklı trombosit düzeylerinin kullanım kılavuzlarındaki impresizyon değerleri %3.3-%14 arasındadır. Trombosit konsantrasyonu düştükçe impresizyon artar. Bunun ölçüm belirsizliği ile paralel olması beklenir. Kullanım kılavuzlarının aksine, AACB’ye göre hesaplanan belirsizlik değerleri, konsantrasyon seviyesinden bağımsız olarak birbirine çok yakın (%3.41–%4.80 arasında) bulundu. Bununla birlikte, Nordtest kılavuzunun sonuçları,otoanalizörlerin kullanım kılavuzları ile daha uyumlu bulundu (%6.97–%15.35 arasında).
Sonuç
Performans beklentileri ile değerlendirildiğinde, ölçüm belirsizliğinde bias kullanılmalıdır. Farklı konsantrasyon seviyeleri için belirsizliğin ayrı ayrı hesaplanması da önemlidir.
Introduction
The result of a measurement is only an approximate estimation of the value of the measurand. Therefore, it is completed with an expression of the uncertainty of this estimate [1]. Measurement uncertainty indicates a range of values that cover the measured parameter’s exact value [2], [3]. When the measurement uncertainty is available with the test result, it provides information about the result’s quality [4]. Laboratories should determine their measurement uncertainty values for parameters they analyze as a requirement of ISO 15189.
There is no clear consensus about the calculation of measurement uncertainty and there are different approaches. Calculation methods can be divided into two main approaches, bottom-up and top-down. In the bottom-up approach, all factors and the effect-on rates are included in calculating the uncertainty one by one. On the other hand, top-down approach uses present analytical performance data obtained from quality control materials [5], [6].
The top–down approach is reasonably preferred, as it is easier to apply. But there is also no consensus on how to apply the top–down approach. ISO 15189 does not mandate any particular procedure. On the other hand, ISO Technical Specifications 20914 is based on precision results and calibration uncertainty and recommends the correction of bias or the inclusion bias uncertainty in the uncertainty calculation [7]. There are different views on the inclusion and exclusion of bias [8], [9].
Australasian Association of Clinical Biochemists Uncertainty of Measurement Working Group (AACB) and Handbook For Calculation of Measurement Uncertainty in Environmental Laboratories (Nordtest Guideline) are written according to the top–down approach [10], [11].
AACB Guideline advises at least six months of imprecision of IQC data to calculate measurement uncertainty and does not recommend using bias [10]. On the contrary, the Nordtest guideline equation uses bias, imprecision and the participant number of the EQA and the imprecision of IQC [11]. Both recommend calculating measurement uncertainty separately for different concentration levels of the measurand.
Complete blood count (CBC) is one of the most common laboratory tests. It is preferred for diagnosis and follow-up of a wide range of diseases such as anemia, infectious diseases, certain cancers, bleeding conditions, allergies and immunodeficiencies [12]. Every parameter reported under CBC headline may help the physicians to diagnose different diseases.
Analytical imprecision varies depending upon the concentration of the analyte [11]. Therefore, measurement uncertainty is also expected to have different values at different concentrations. Analytical imprecision, hence measurement uncertainty, is particularly greater at the concentration of lower and the upper limit of measurement [13]. User manuals have no information about measurement uncertainty but includes performance characteristics of autoanalyzers as imprecision.
The study aims to calculate the measurement uncertainty values of certain CBC parameters with two different top–down approaches and compare them via imprecision values of user manuals, as performance characteristics of autoanalyzers. To the best of our knowledge, there is no study in the literature which compares measurement uncertainty guidelines and shows the effect of bias by using CBC parameters and the difference in imprecision values between concentration levels.
Materials and methods
This retrospective study was performed in Karadeniz Technical University Farabi Hospital with the approval of the ethical committee. Quality control data of 2017 (January 2017 to December 2017) were used for calculating measurement uncertainty values of four CBC autoanalysers.
Measurement uncertainties were calculated for each of the two Beckman Coulter LH780 (Miami, USA) (enumerated as R1 and R2) available in the routine laboratory and two Beckman Coulter DXH 800 (Miami, USA) (enumerated as E1 and E2) available in the emergency laboratory. Measurement methods are as follows for both autoanalyzer models: Coulter Principle for white blood cell count (WBC), red blood cell count (RBC) and platelet count (PLT). hemoglobin (HGB) is measured photometrically, mean corpuscular volume (MCV) and red cell distribution width (RDW) are derived from RBC histogram. Mean platelet volume (MPV) is derived from PLT histogram, Hematocrit (HCT), mean corpuscular hemoglobin (MCH), mean corpuscular hemoglobin concentration (MCHC) are calculated parameters [14], [15]. Calibration samples of both autoanalyzer models do not have any uncertainty value for parameters.
Three levels (low, medium, high) of IQC of CBC parameters were carried out by Beckman Coulter 5C and 6C Cell Control for LH780 models and DXH800 models. Quality control samples changed monthly but mean (target) values of samples obtained from the manufacturer were close to each other. 13 and 12 different lot series were used for IQC for LH780 and DXH800 models, respectively. “n” is the number IQC sample, pooled IQC CV calculated as:
For each level separately.
EQA program was BIO-RAD External Quality Assurance Services Hematology Program. WBC, RBC, HGB, HCT, PLT, MCV, MCH, MCHC, RDW, MPV are evaluated by EQA. Therefore, these parameters were included in the study.
Expanded measurement uncertainty found by multiplying pooled imprecision value by coverage factor in the equation for two sided estimation at 95% confidence interval:
In accordance with AACB guide.
We used peer group results of EQA reports for all bias, CV% and participants numbers for Nordtest guide equations. Nordtest recommends using bias values of EQA results as a Root Mean Square-bias (RMSbias) value. RMSbias, where the “n” is the number of EQA sample, is found with the equation:
Additionally, EQA samples have their uncertainty, named as u (c ref). CV% of external quality control and participants number (pn) can be used for calculation u (c ref) as:
Coverage factor k=2 is chosen for two-sided estimation at a 95% confidence interval. The guide calculates measurement uncertainty in two steps. We made these two steps into one equation as follows:
To calculate measurement uncertainty separately for different concentration levels of the measurand, we classified EQA samples retrospectively according to their mean levels. Thus, we divided the EQA samples into three groups (low, medium, high) in accordance with the three levels of IQC. Averages of mean values of IQCs are given in Table 1. If three or more EQA results close to a certain concentration level, we calculated measurement uncertainty for that level with the Nordtest guideline. If two or less results were available, we accepted insufficient EQA results to calculate measurement uncertainty with the Nordtest guideline.
Internal quality control mean (target) values of autoanalyzers.
| Unit | Beckman Coulter LH-780 (R1–R2) | Beckman Coulter DXH-800 (E1–E2) | |||||
|---|---|---|---|---|---|---|---|
| Low | Medium | High | Low | Medium | High | ||
| WBC | ×109/L | 3.5 | 9 | 20 | 3.5 | 9 | 20 |
| RBC | 106/μL | 1.75 | 4.1 | 5.2 | 1.7 | 4.1 | 5.3 |
| HGB | g/L | 48 | 123 | 155 | 48 | 120 | 160 |
| HCT | % | 14 | 36 | 46.5 | 14.3 | 36 | 48 |
| MCV | fL | 80 | 88 | 88 | 83 | 90 | 90 |
| MCH | pg | 27 | 29 | 30 | 27 | 30 | 30 |
| MCHC | g/L | 330 | 340 | 340 | 320 | 340 | 340 |
| RDW | % | 15 | 15 | 16 | 15 | 15 | 16.5 |
| PLT | ×109/L | 70 | 210 | 400 | 70 | 220 | 420 |
| MPV | fL | 10 | 10.5 | 11 | 10 | 10 | 10 |
-
WBC, white blood cell count; RBC, red blood cell count; HGB, hemoglobin; HCT, hematocrit; MCV, mean corpuscular volume; MCH, mean corpuscular hemoglobin; MCHC, mean corpuscular hemoglobin concentration; RDW, red cell distribution width; PLT, platelet count; MPV, mean platelet volume; R1–R2, two Beckman Coulter LH-780 autoanalyzers run in routine laboratory; E1–E2, two Beckman Coulter DXH-800 autoanalyzers run in emergency laboratory.
User manuals of analyzers do not have measurement uncertainty values but show within-run precision values. Although they are different concepts, imprecision values and measurement uncertainty values are parallel due to the equations. Also, the imprecision values reflect the test performance. For the tests that perform good, the measurement uncertainty value is expected to be low. So we use user manuals to evaluate our results.
Results
Measurement uncertainty percentages (%) of WBC, RBC, HGB, HCT, PLT of two Beckman Coulter LH-780 model auto analyzers are shown in Table 2. Table 3 shows the measurement uncertainty of the same parameters in the Beckman Coulter DXH-800 model. Graph 1 and Graph 2 show the measurement uncertainty percentages of PLT and WBC of different levels and guides, respectively.
Beckman Coulter LH-780 Complete Blood Count Autoanalyzer measurement uncertainty percentages.
| Autoanalyzer | Concentration | Guideline | WBC | RBC | HGB | HCT | PLT |
|---|---|---|---|---|---|---|---|
| R1, % | Low | AACB | 4.79 | 1.54 | 1.94 | 2.70 | 4.74 |
| Nordtest | 7.94 | x | x | x | 12.20 | ||
| Medium | AACB | 2.72 | 1.12 | 1.02 | 2.56 | 3.92 | |
| Nordtest | 4.80 | 1.72 | 1.56 | 3.57 | 6.97 | ||
| High | AACB | 1.35 | 1.22 | 1.03 | 2.43 | 3.59 | |
| Nordtest | x | 2.26 | 2.25 | 4.11 | x | ||
| R2, % | Low | AACB | 5.17 | 1.74 | 2.07 | 2.80 | 4.63 |
| Nordtest | 8.05 | x | x | x | 15.35 | ||
| Medium | AACB | 2.62 | 1.26 | 1.01 | 2.08 | 4.24 | |
| Nordtest | 5.47 | 2.11 | 1.28 | 4.02 | 8.77 | ||
| High | AACB | 1.62 | 1.29 | 0.94 | 2.15 | 3.81 | |
| Nordtest | x | 3.01 | 2.01 | 4.71 | x |
-
WBC, white blood cell count; RBC, red blood cell count; HGB, hemoglobin; HCT, hematocrit; PLT, platelet count; AACB, Australasian Association of Clinical Biochemists Uncertainty of Measurement Working Group Measurement Uncertainty Guideline; Nordtest, Handbook For Calculation of Measurement Uncertainty in Environmental Laboratories Guideline; R1 and R2, two Beckman Coulter LH-780 autoanalyzers run in routine laboratory; x, insufficient EQA result to calculate measurement uncertainty with Nordtest guideline.
Beckman Coulter DXH-800 complete blood count autoanalyzers measurement uncertainty percentages.
| Autoanalyzer | Concentration | Guideline | WBC | RBC | HGB | HCT | PLT |
|---|---|---|---|---|---|---|---|
| E1, % | Low | AACB | 4.01 | 2.55 | 2.36 | 3.10 | 4.80 |
| Nordtest | 5.78 | x | x | x | 6.90 | ||
| Medium | AACB | 3.34 | 2.11 | 1.74 | 2.61 | 3.69 | |
| Nordtest | 3.90 | 4.11 | 2.54 | 3.49 | 7.02 | ||
| High | AACB | 2.55 | 2.03 | 1.66 | 2.56 | 4.10 | |
| Nordtest | x | 4.48 | 3.17 | 5.11 | x | ||
| E2, % | Low | AACB | 3.10 | 2.38 | 2.70 | 3.16 | 4.36 |
| Nordtest | 5.97 | x | x | x | 9.72 | ||
| Medium | AACB | 2.79 | 2.19 | 1.70 | 2.56 | 3.41 | |
| Nordtest | 5.35 | 3.46 | 2.65 | 3.68 | 5.70 | ||
| High | AACB | 2.34 | 2.11 | 1.46 | 2.65 | 3.47 | |
| Nordtest | x | 3.01 | 2.61 | 3.73 | x |
-
WBC, White Blood Cell Count; RBC, Red Blood Cell Count; HGB, Hemoglobin; HCT, Hematocrit; PLT, Platelet Count; AACB, Australasian Association of Clinical Biochemists Uncertainty of Measurement Working Group Measurement Uncertainty Guideline; Nordtest, Handbook For Calculation of Measurement Uncertainty in Environmental Laboratories Guideline; E1 and E2, two Beckman Coulter DXH-800 autoanalyzers run in emergency laboratory; x, insufficient EQA result to calculate measurement uncertainty with Nordtest guideline.
IQC mean values of all three levels of MCH, MCHC, MCV, MPV, RDW parameters are so close to each other (Table 1). Therefore, we calculate measurement uncertainty values for only one level for these parameters (Table 4).
Measurement uncertainty percentages of MCH, MCHC, MCV, MPV, RDW.
| MCV | MCH | MCHC | RDW | MPV | ||
|---|---|---|---|---|---|---|
| AACB, % | ||||||
| R1 | 2.12 | 1.70 | 2.62 | 2.86 | 1.66 | |
| R2 | 1.86 | 1.68 | 2.52 | 2.98 | 1.68 | |
| E1 | 1.93 | 1.84 | 2.37 | 2.61 | 1.56 | |
| E2 | 1.92 | 1.68 | 2.40 | 2.58 | 1.62 | |
| Nordtest, % | ||||||
| R1 | 3.85 | 2.88 | 4.58 | 4.81 | 6.93 | |
| R2 | 4.30 | 3.07 | 5.27 | 4.99 | 7.67 | |
| E1 | 2.42 | 3.47 | 3.22 | 3.33 | 6.69 | |
| E2 | 2.34 | 3.94 | 4.17 | 3.70 | 6.00 | |
-
MCV, mean corpuscular volume; MCH, mean corpuscular hemoglobin; MCHC, mean corpuscular hemoglobin concentration; RDW, red cell distribution width; MPV, mean platelet volume; AACB, Australasian Association of Clinical Biochemists Uncertainty of Measurement Working Group Measurement Uncertainty Guideline; Nordtest, Handbook For Calculation of Measurement Uncertainty in Environmental Laboratories Guideline; R1 and R2, two Beckman Coulter LH-780 autoanalyzers run in routine laboratory; E1 and E2, two Beckman Coulter DXH-800 autoanalyzers run in emergency laboratory.
Imprecision values of IQC for all parameters differs between 0.47 % (Beckman Coulter LH-780, HGB, level of 155 g/L) and 2.41% (Beckman Coulter DXH-800, PLT, level of 70 × 109/L).
The maximum RMSbias value is 7.29% and belongs to PLT in Beckman Coulter LH-780 at level of 70 × 109/L. The minimum RMSbias value is 0.37% and belongs to HGB Beckman Coulter LH-780, at the level of 123 g/L. RMSbias values of EQA for other parameters differ between these percentages.
u (c ref) values of EQA for all parameters differs between 0.1 % (Beckman Coulter LH-780, HGB, level of 155 g/L) and 0.8 % (Beckman Coulter DXH-800, PLT, level of 70 × 10⁹/L).
Conclusion
Analytical performance of auto analyzers depends upon concentration levels of the measurand and in hematology auto analyzers, CV values increase as the platelet count decreases [16]. There is no consensus for evaluating measurement uncertainty values, so it is hard to estimate which approach gives more confidential results. However, in our study, PLT and WBC results revealed striking data especially when evaluated with the concentration-imprecision relationship.
It is considered that the user manuals have one and only imprecision value for most parameters, while there are different imprecisions at different concentrations of PLT and WBC. For WBC at 0.5–2 × 10⁹/L concentration level CV% ≤5%; at 5–10 × 109/L concentration level CV≤3% in user manual of Beckman Coulter DXH-800. LH-780 user manual gives unique CV for WBC as ≤1.7% at 9–11 × 10⁹/L concentration level. For PLT in the user manual of Beckman Coulter LH-780 CV≤3.3% for the level of 280–320 × 10⁹/L; CV≤6.6% for the level of 90–110 × 10⁹/L; CV≤14% for the level of 10–15 × 109/L. And in user manual Beckman Coulter DXH-800 CV≤3.5% for the level of 200–400 × 10³/μL; CV≤12% for the level of 10–12 × 109/L for PLT [14], [15]. The repeatability of DXH800 is slightly better than LH780 at low concentration levels of PLT. In agreement with the literature, it is seen that the imprecisions of auto analyzers increase in the user manuals as the PLT and WBC levels decrease. Auto analyzers perform better at higher levels of PLT and WBC; measurement uncertainty values are also expected to be compatible with this situation.
The measurement uncertainty value calculated with the AACB guideline can be expected to be more correlated with the imprecision values of the user manuals than those calculated with Nordtest because imprecision is the one and only variable that requires to calculate measurement uncertainty with AACB. However, in our study CV% values of IQC are so close to each other, regardless of concentration level, in both autoanalyzers for PLT. Therefore measurement uncertainty values calculated with AACB guideline were close to each other, contrary to expectations. But the part of our study performed with the Nordtest guideline is compatible with user manuals. Although 10–15 × 109/L level of PLT does not have IQC and EQA, it is obvious that the uncertainty calculated with the Nordtest guideline increases as the concentration of PLT decreases (Figure 1).
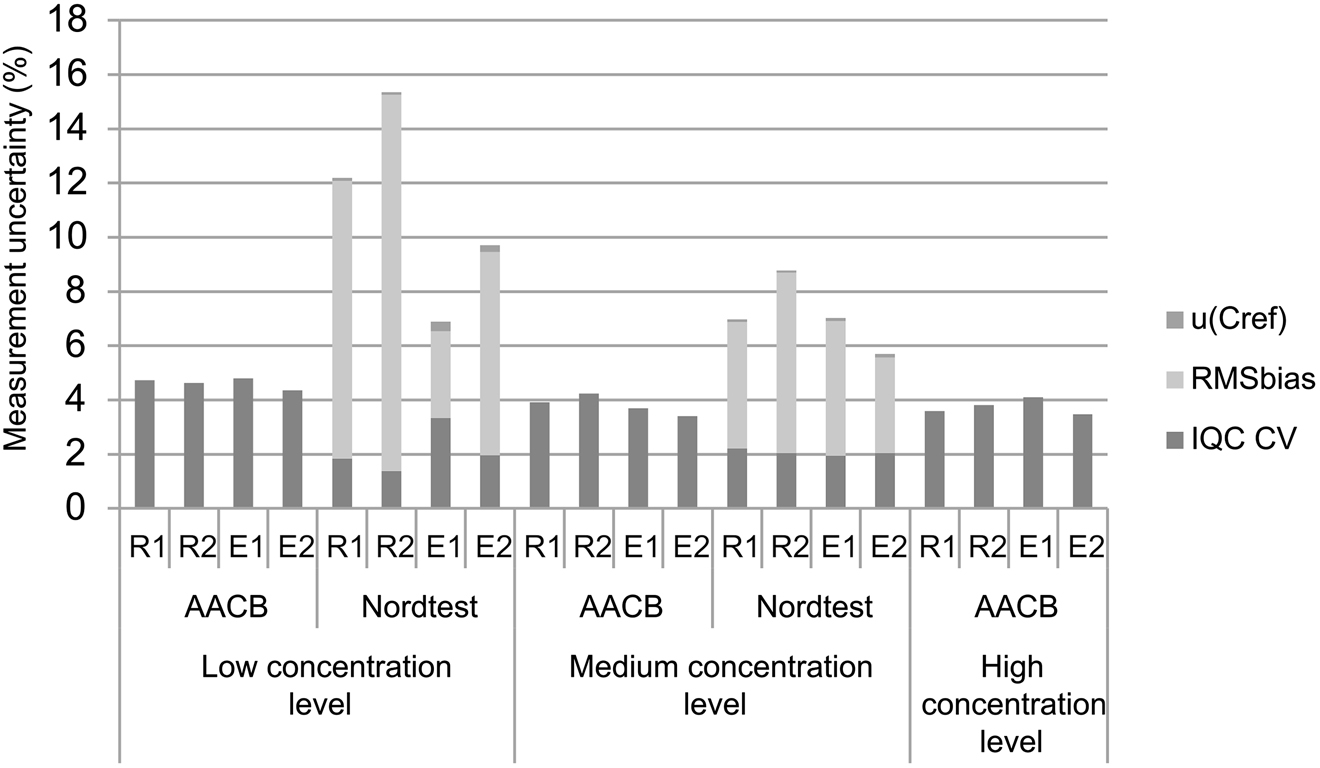
Measurement uncertainty of PLT of four autoanalyzers with two different guideline, with contribution rates of RMSbias, u (c ref) and imprecision of IQC. AACB, Australasian Association of Clinical Biochemists Uncertainty of Measurement Working Group Measurement Uncertainty Guideline; Nordtest, Handbook for Calculation of Measurement Uncertainty in Environmental Laboratories Guideline; u (C ref), uncertainty of external quality assurance sample; RMSbias, root mean square bias; IQC CV, imprecision of internal quality control; R1 and R2, two Beckman Coulter LH-780 autoanalyzers run in routine laboratory; E1 and E2, two Beckman Coulter DXH-800 autoanalyzers run in emergency laboratory.
PLT and related parameters provide information about bleeding disorders and the risk of thrombosis [17], [18]. Low levels of our IQC (70 × 109/L) may be the most clinically important levels of PLT because the diagnostic threshold of thrombocytopenia is close to that level. Moreover, the indication of platelet transfusion is distinctly lower than that value. Guidelines often recommend a platelet count threshold of 50 × 109/L before major surgery. The prophylactic platelet transfusion threshold is accepted as 10 × 109/L for uncomplicated thrombocytopenic patients [19]. So calculation and reporting of measurement uncertainty of lower levels are more important than higher levels.
IQC imprecision of WBC is pretty lower than imprecision of user manuals. However, it was compatible with user manuals in terms of differences in concentration levels. On the other hand, lower IQC imprecision results in lower measurement uncertainty percentages than expected. In the user manual of DXH-800, CV≤3% for the concentration of medium level of WBC. Thus measurement uncertainty can be expected as ≤6% with AACB. In fact, uncertainties calculated with AACB were nearly half of the expected value, but Nordtest results are more compatible with expected uncertainty results (Figure 2).

Measurement uncertainty of WBC of four autoanalyzers with two different guideline, with contribution rates of RMSbias, u (c ref) and imprecision of IQC. AACB, Australasian Association of Clinical Biochemists Uncertainty of Measurement Working Group Measurement Uncertainty Guideline; Nordtest, Handbook for Calculation of Measurement Uncertainty in Environmental Laboratories Guideline; u (C ref), uncertainty of external quality assurance sample; RMSbias, root mean square bias; IQC CV, imprecision of internal quality control; R1 and R2, two Beckman Coulter LH-780 autoanalyzers run in routine laboratory; E1 and E2, two Beckman Coulter DXH-800 autoanalyzers run in emergency laboratory.
Nordtest guideline suggests at least six interlaboratory comparison results within a reasonable time interval, but in the examples of guideline, three results are used to calculate RMSbias value. It is hard to find six results for each level in one year. Padoan et al. [9] have not calculated measurement uncertainties for certain parameters in a study designed with Nordtest Guideline and indicated this situation with the words of ‘surveys per year are low’ but they did not give exact number of surveys. We accepted that three EQA samples could be used to estimate RMSbias, based on the examples in the guideline. In our study, the measurement uncertainty values could not be calculated according to the Nordtest guideline since there were not enough EQA samples at the high levels of WBC and PLT and low RBC, HGB, HCT. In order to overcome this problem, it can be attempted to reach a sufficient number of EQA samples for a certain level by increasing the time interval. A single-bias value may not reflect the quality of measurement, so we do not recommend calculating measurement uncertainty with a single bias.
The use of imprecision is common in both guides. However, Nordtest uses it in a Pythagorean equation (Eq. 5), so the importance of CV% of IQC decreases in Nordtest guideline in proportion to AACB. By using the bias values, the uncertainty values calculated with the Nordtest guide are generally higher than those calculated with AACB guide.
Manufacturer within-run precision recommendations for parameters other than PLT were <2.2% in LH780 model, and <5% in DXH800 model. Our imprecision values are convenient to these recommendations.
Although three levels of IQC samples are used, we have observed that only quality control of the values close to the reference range of the MCH, MCHC, MCV, MPV, RDW are appropriately performed. This is the same in terms of EQA and IQC. We do not have sufficient data about the analytical performance of pathological levels of these tests, which have an important role in determining the etiology of anemia. It may also cause suspicion to clinical studies committed with these parameters. This is an issue that the manufacturers of IQC and EQA samples and us as the experts who decide which quality control material to be used in the laboratory should pay attention.
In conclusion, we reached the most striking findings when calculating the measurement uncertainty of the PLT parameter. These findings show the importance of the use of bias in the calculation of measurement uncertainty and representing the novelty of this study.
References
1. JCGM 100:2008. Evaluation of measurement data: guide to the expression of uncertainty in measurement (GUM); 1995, Available from: www.bipm.org [Accessed 11 May 2017].Suche in Google Scholar
2. Adams, TM. A2LA-guide for estimation of measurement uncertainty in testing; 2002.Suche in Google Scholar
3. Badrick, T, Hawkins, RC, Wilson, SR, Hickman, PE. Uncertainty of measurement: what it is and what it should Be. Clin Biochem Rev 2005;26:155–8.Suche in Google Scholar
4. Plebani, M, Sciacovelli, L, Bernardi, D, Aita, A, Antonelli, G, Padoan, A. What information on measurement uncertainty should be communicated to clinicians, and how? Clin Biochem 2018;57:18–22. https://doi.org/10.1016/j.clinbiochem.2018.01.017.Suche in Google Scholar PubMed
5. Lee, JH, Choi, JH, Youn, JS, Cha, YJ, Song, W, Park, AJ. Comparison between bottom-up and top-down approaches in the estimation of measurement uncertainty. Clin Chem Lab Med 2014. https://doi.org/10.1515/cclm-2014-0801.Suche in Google Scholar PubMed
6. Milinković, N, Ignjatović, S, Šumarac, Z, Majkić-Singh, N. Uncertainty of measurement in laboratory medicine. J Med Biochem 2018;37:279–88. https://doi.org/10.2478/jomb-2018-0002.Suche in Google Scholar PubMed PubMed Central
7. ISO/TS 20914. Medical laboratories: practical guidance for the estimation of measurement uncertainty, 1st ed. Geneva: ISO; 2019.Suche in Google Scholar
8. Thienpont, LM. Calculation of measurement uncertainty—why bias should Be treated separately. Clin Chem 2008;54:9. https://doi.org/10.1373/clinchem.2008.107797.Suche in Google Scholar PubMed
9. Padoan, A, Antonelli, G, Aita, A, Sciacovelli, L, Plebani, M. An approach for estimating measurement. Clin Chem Lab Med 2017;55:1696–701. https://doi.org/10.1515/cclm-2016-0896.Suche in Google Scholar PubMed
10. White, GH, Farrance, I. Uncertainty of measurement in quantitative medical testing: a laboratory implementation guide, Australia, 2004.Suche in Google Scholar
11. Magnusson, B, Naykki, T, Hovind, H, Krysell, M. Handbook for calculation of measurement uncertainty in environmental laboratories. NordTest Report TR 537, Nordtest, Finland, 2012.Suche in Google Scholar
12. George-Gay, B, Parker, K. Understanding the complete blood count with differential. J Perianesth Nurs 2003;18:96–114. https://doi.org/10.1053/jpan.2003.50013.Suche in Google Scholar PubMed
13. Dahlin, JL, Sittampalam, GS, Coussens, NP, et al.. Basic guidelines for reporting non-clinical data. In: Markossian, S, Sittampalam, GS, Grossman, A, et al., editors. Assay guidance manual. Bethesda, MD: Eli Lilly & Company and the National Center for Advancing Translational Sciences; 2004.Suche in Google Scholar
14. COULTER LH 780 System, Reference. Available from: https://www.beckmancoulter.com/download/file/wsr-32377/773021AD?type=pdf [Accessed 21 Jan 2019].Suche in Google Scholar
15. Instructions for Use, UniCel DxH series with system manager software Coulter cellular analysis system. Available from: https://www.udh.med.sa/advices/DxH_Operator_Manual.pdf [Accessed 5 May 2019].Suche in Google Scholar
16. Gioia, M, Da Rin, G, Manenti, B, Birindelli, S, Ciardelli, ML, Gentile, R, et al.. Multicenter evaluation of analytical performances of platelet counts and platelet parameters: Carryover, precision, and stability. Int J Lab Hematol 2020;42:552–64. https://doi.org/10.1111/ijlh.13204.Suche in Google Scholar PubMed
17. Palta, S, Saroa, R, Palta, A. Overview of the coagulation system. Indian J Anaesth 2014;58:515–23. https://doi.org/10.4103/0019-5049.144643.Suche in Google Scholar PubMed PubMed Central
18. Krashin, E, Cohen, O, Pereg, D, Lishner, M, Leader, A. Mean platelet volume and risk of thrombotic and bleeding complications in patients with Philadelphia chromosome negative myeloproliferative neoplasms. Blood Coagul Fibrinolysis 2018;29:288–93. https://doi.org/10.1097/mbc.0000000000000717.Suche in Google Scholar PubMed
19. Squires, JE. Indications for platelet transfusion in patients with thrombocytopenia. Blood Transfus 2015;13:221–6. https://doi.org/10.2450/2014.0105-14.Suche in Google Scholar PubMed PubMed Central
© 2021 Hatice Bozkurt Yavuz et al., published by De Gruyter, Berlin/Boston
This work is licensed under the Creative Commons Attribution 4.0 International License.
Artikel in diesem Heft
- Frontmatter
- Review Article
- Overview of COVID-19’s relationship with thrombophilia proteins
- Research Articles
- Is it possible to determine antibiotic resistance of E. coli by analyzing laboratory data with machine learning?
- Detection of circulating prostate cancer cells via prostate specific membrane antigen by chronoimpedimetric aptasensor
- Two approaches for measurement uncertainty estimation: which role for bias? Complete blood count experience
- Is there any relationship between C-reactive protein/albumin ratio and clinical severity of childhood community-acquired pneumonia
- Comparison of nitric oxide and adrenomedullin levels of children with attention deficit hyperactivity disorder and anxiety disorder
- Performance evaluation of internal quality control rules, EWMA, CUSUM, and the novel machine learning model
- Are serum molecular markers more effective than the invasive methods used in the diagnosis of breast cancers?
- HIF-1 inhibitors: differential effects of Acriflavine and Echinomycin on tumor associated CA-IX enzyme and VEGF in melanoma
- Evaluation of BD Vacutainer Eclipse and BD Vacutainer Ultra-Touch butterfly blood collecting sets in laboratory testing
- The effects of various strength training intensities on blood cardiovascular risk markers in healthy men
- Is there any relationship between LGALS3 gene variations and histopathological criteria in laryngeal squamous cell carcinoma (LSCC)?
- Expression levels of BAP1, OGT, and YY1 genes in patients with eyelid tumors
- Association of bitter and sweet taste gene receptor polymorphisms with dental caries formation
- Case Report
- Glucose-6-phosphate dehydrogenase gene Ala365Thr mutation in an Iraqi family with confusing clinical differences
- Acknowledgment
- Acknowledgment