The distribution indices of erythrocytes: which one for acute ischemic stroke?
-
Nahide Ekici Günay

 and
Nurullah Günay
and
Nurullah Günay

Abstract
Background
The erythrocytes distribution indices are reported from same histogram but they have different reference intervals and calculated by distinct measurements.
Objectives
To explore whether the RDW-CV and RDW-SD values may predictive and prognostic significance in ischemic stroke patients and to clarify the relation each of these indices with stroke severity and 3-months survival.
Materials and methods
Cumulative survival rates were calculated with the Kaplan-Meier method, and life curves were compared to RDW-CV, RDW-SD quartiles. The risk factors were described with a multivariable cox proportional hazard model.
Results
In acute ischemic stroke, RDW-CV was more specific and RDW-SD was more sensitive (92% vs. 80%) (52% vs. 48%). RDW-CV values higher than 14.7% are associated with 11-fold increase in the risk of stroke; and the level of RDW-CV does show a linear relationship with the severity of stroke. However, when we evaluated RDW-SD, higher 43.55 fL RDW-SD values was have 16-fold increase in severity of stroke and have a relatively high linear relationship with stroke severity scores to RDW-CV.
Conclusions
RDW-CV and RDW-SD levels have different prognostic poor outcomes for interpreting in ischemic stroke events approach and these should be used alone and comparatively with the AIS predictive and prognostic approach.
Öz
Amaç
Eritrosit dağılım indeksleri (RDW-CV ve RDW-SD) aynı histogram grafiğinden rapor edilir. Ancak bunların farklı referans aralıkları vardır ve farklı ölçümlerle hesaplanırlar. Bu çalışmada, iskemik inme hastalarında eritrosit indekslerinin öngörücü ve prognostik önemi olup olmadığını araştırmak, bu indekslerin her birinin inme şiddeti ve 3 aylık sağkalım ile ilişkisini inceleme amaçlandı.
Gereç ve Yöntem
Multivariable Cox regresyon hazard modeli ile iskemik inme için risk faktörleri tanımlandı. Kaplan-Meier yöntemi ile kümülatif sağkalım oranları hesaplandı ve RDW-CV ve RDW-SD çeyreklerine göre yaşam eğrileri ile karşılaştırıldı.
Bulgular
Akut iskemik inmede RDW-CV daha spesifiktir ve RDW-SD daha duyarlıdır (sırasıyla% 92 ve % 80) (% 52 ve % 48). %14,7’den yüksek RDW-CV değerleri inme riskindeki 11 kat artışla ilişkiliydi ve inme ciddiyeti ile doğrusal bir ilişki göstermektedir. 43.55 fL üzerindeki RDW-SD değerleri 16 kat daha yüksek tehlike oranlarına sahiptir ve RDW-CV’ye göre inme şiddeti skorları ile daha yüksek bir doğrusal ilişki göstermektedir.
Sonuç
RDW-CV ve RDW-SD düzeyleri iskemik inmeye yaklaşımda farklı prognostik kötü sonuçlara sahiptir. Bu indeksler AIS öngörücü ve prognostik yaklaşımda tek başına ve karşılaştırmalı olarak kullanılmalıdırlar.
Introduction
Stroke constitutes the vast majority of cerebrovascular deaths and is ranked fifth among death causes when considered separately from cancer, chronic lower respiratory tract diseases and other cardiovascular diseases such as involuntary injuries/accidents [1]. Ischemic stroke constitutes 87% of all stroke events and it leads to serious neurological disabilitys [2]. Hereby, understanding of the pathophysiological mechanisms of stroke and providing management in risk factors is important.
Increased red blood cell distribution width (RDW) predicted mortality and outcome after acute ischemic stroke (AIS) however, the underlying mechanisms are unclear. Some inflammatory, hematologic, and coagulation related laboratory parameters have been related with poor outcome measures of stroke including lower hemoglobin concentration [3], increased hematocrit [4], high mean platelet volume [5], high C reactive protein [6], high white blood cell (WBC) and neutrophil count [7]. These among useful parameters of the whole blood count, RDW has recently investigated as an independent and strong predictive factor in vary pathologies, including some infections, diabetes, cancer, and acute coroner syndrome [8].
RDW’s high levels make a sign the existence of anisocytosis which is concerned to impairment of erythropoiesis and reduction of erythrocytes [9], finding chronic inflammation and increase of oxidative stress levels, and this may significantly aggravates to development of atherosclerotic diseases [10], [11].
Currently, hematology analyzers give two distinct results with two different calculation methods as the standard deviation of red blood cell distribution width (RDW-SD) (direct measurement) and variation coefficient of red blood cell distribution width (RDW-CV) [12]. The RDW-CV is a calculation based on both the mean cell size and the width of the distribution curve. It is computed by dividing the standard deviation of the mean cell size by the MCV of the red blood cells and multiplying by 100 to turn to a percentage (Figure 1) [13].

Equation 1.
Histogram based RDW-CV calculation method.
Because it is a calculation, the RDW-CV is dependent not only on the mean corpuscular volume (MCV) of the red cell population but also the width of the distribution curve and may not projected the actual variation in red cell size.
The RDW-SD is real measurement of the red cell distribution curve’s width of in femtoliters. The width of the distribution curve is measured at the point that is 20% level the baseline. Since the RDW-SD is an original measurement, it is not influenced by the MCV and more accurately express the red cell size variance [14].
The main purpose of interest of this study was to investigate whether alteration of the parameters of RDW-CV and RDW-SD of patients who has had an acute ischemic stroke. The second objective is to examine the effect of these RDW parameters on the 3-months survival separately and compare them with each other.
Materials and methods
Study design and patient selection
This retrospective observational study was based on all consecutive patients admitted to emergency department of the Erciyes University Hospital, Kayseri (Turkey) with a diagnosis of spontaneous acute ischemic stroke, between January 2017 and June 2018. The study was conducted in collaboration with Health Sciences University and Erciyes University and design was approved by local Ethic Committee (approval number: 96681246/13).
Exclusion criteria were as followed: (1) Those who were admitted to the hospital after 24 h of stroke; (2) those with any bacterial or viral infection history until 2 weeks before stroke; (3) those who previously had stroke stories; (4) transient ischemic attack (TIA) patients; (5) immunosuppressive drug users (such as steroids); (6) patients with hematologic disease history, thalassemia; (7) a history of malignancy; (8) other prior systemic diseases including; history of autoimmune disease, uremia, liver cirrhosis; (9) patients with intra-cerebral hemorrhagic ischemia and patients with infra-tentorial infarcts which due to greater contribution to mortality [15] (10) patients in whom not properly sample collection on admission, or died during these.
Laboratory assays and clinical information
The stroke diagnosis was based on performed clinical examination and the magnetic resonance imaging scan or computed tomographic (CT) scan of the brain in all patients within 24 h from event. A non-contrast CT brain scan was also used to rule out hemorrhagic stroke.
The blood samples of patients collected by antecubital vein puncture into dipotassium ethylene diamine tetra acetic acid (EDTA) tubes and worked within 60 min upon admission to the ED. The samples were stored at room temperature during the time between venipuncture and processing. The samples were analyzed by both optical fluorescence methods and electrical impedance in automated hematology analysis system (Sysmex XN-9000, Sysmex Corporation, Kobe, Japan) [16]. All the serum biochemical parameters were assayed using an automatic biochemical analyzer (Roche Cobas Automatic Analyzer 6000, Roche Diagnostics, Rotkreuz, Switzerland). All hematologic and biochemical analyzes were performed according to CLIA-based quality control procedures which were arranged according to Sigma-metrics performance criteria.
Stroke severity was assessed with National Institutes of Health stroke Scale Score (NIHSS) at admission time [17]. Medical history of patients (recurrent stroke story, cardiovascular disease, hypertension, diabetes mellitus and chronic obstructive pulmonary disease, with demographic data (age and gender) were recorded. Vital signs including systolic blood pressure (SBP) and diastolic blood pressure (DBP) were obtained. Comorbidity was assessed for AIS and non-AIS groups by using a Cumulative Illness Rating Scale-Geriatric (CIRS-G) [18].
Hemoglobin (HGB), mean red blood cell size (MCV), hemoglobin amount per red blood cell (MCH), hemoglobin amount relative to the size of the red cell (MCHC), white blood cell (WBC), neutrophil (Neu), lymphocyte (Lym), platelet, plateletecrit, mean platelet volume (MPV), platelet distribution width (PDW), lipid profiles (high-density lipoprotein, low-density lipoprotein, triglyceride) were measured.
For the diagnosis of arterial hypertension, The Seventh Report of the Joint National Committee on Prevention, Detection, Evaluation, and Treatment of High Blood Pressure (JNC-7) clarifications were applied [19]. Diabetes mellitus diagnose was confirmed according to the American Diabetes Association criteria [20]. TIA was described as full evanescence of symptoms and signs within 24 h without consideration if infarction was evident on neuroimaging.
Baseline records from cohort data of all stroke events during 3 months (90 days) were recorded. Death events from ischemic stroke were defined as endpoint. Patients who interrupted or inaccessible data record were defined as “censored cases”. A non-AIS control group was consisted of age and sex matched voluntary persons from who’s admitted to geriatric outpatient department for routinely check-up program.
Statistical analyses
Statistical analyses were performed using SPSS Statistics 24.0 software (SPSS Inc., Chicago, IL, USA). The Shapiro-Wilk test was used to test the normality of distribution. Continuous variables were reported as mean±standard deviation or median (interquartile range). Qualitative variables and categorical data are showed as percentage or frequency and differences among these variables were assessed by the chi-square (χ2) test. For comparing the results in AIS and the non-AIS control group independent samples t-test was performed. Comparison among AIS patient groups was analyzed with the Kruskal-Wallis and the Mann–Whitney U-tests. The correlations between RDW-CV and RDW-SD and stroke severity and other variables were analyzed by Spearman rank correlation. The receiver operating characteristic (ROC) curve was plotted to evaluate the predictive value of RDW-CV and RDW-SD parameters, which are independent stroke risk factors in patients with acut ischemic stroke. The patients were separated in four groups according to each of RDW-CV and RDW-SD in quartiles. A Bonferroni correction was used when multiple comparisons for pair of each parameters quartiles. The all groups were compared using Pearson χ2 and Kruskal-Wallis tests. Cumulative incidence of endpoint event was calculated with the Kaplan-Meier method, incidence curves were plotted and compared with a Tarone–Ware, Breslow (Generalized Wilcoxon) and long rank tests. A Kaplan-Meier life curves plotted and test of equality of survival distributions for the different levels of RDW-SD and RDV-CV were compared, a post-hoc analysis of longrank test was made for multiple comparisons of survival curves.
A multivariable Cox proportional hazard model were applied and the gender variable with significance into univariate analysis were included. Collinearty diagnostics within variables was applied before the regression model was build. The risk of developing ischemic stroke was described as a hazard ratio (HR) and 95% CI. p-Value less than 0.05 was considered statistically significant for all statistical analyses.
Results
Initially, a total of 461 patients with acute cerebrovascular events were included to study. After the exclusion criteria, 342 cases were selected in the final analysis as patient group. A control group (n=99) was consisted of age and sex compatible (Figure 2). Finally, 441 patients were included in our analysis.

Flowchart of patient exclusion criteria.
It was observed that the each RDW parameters (RDW-SD and RDV-CV) in the AIS patients were significantly higher than of mean and median values in non-AIS group (both p<0.001) (Figure 3).

The status of RDW-CV and RDW-SD parameters according to groups.
The RDW-CV values at admission displayed a diagnostic accuracy for predicting patients with unfavorable outcome after 3 months, demonstrating an AUC of 0.725 (95% CI 0.675–0.775). The RDW-CV diagnostic cut-off was 13.95% with 48% sensitivity and 92% specificity. On the other hand, for RDV-SD values diagnostic threshold, with 52% sensitivity and 80% specificity was 43.55 (AUC 692, 95% CI 0.640–0.743) (Figure 4).
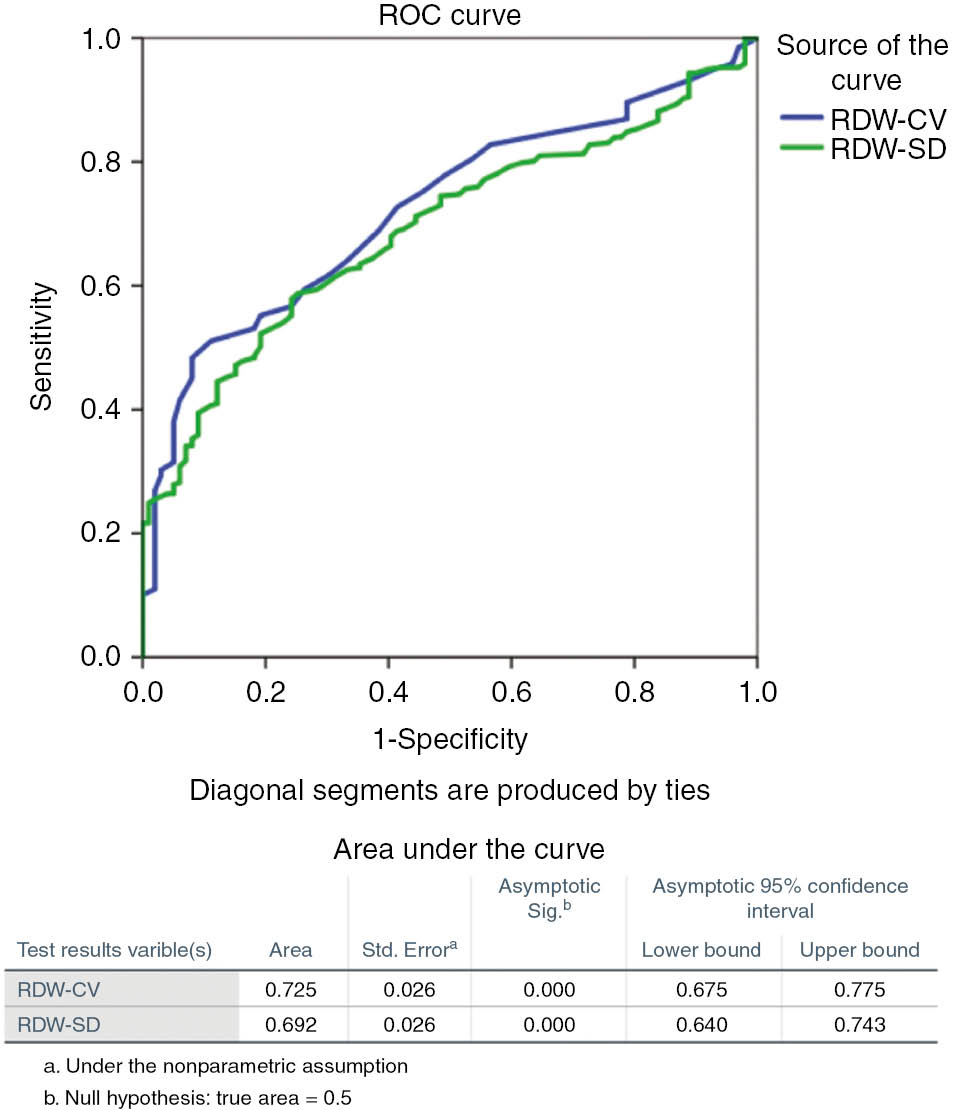
AUC comparison between RDW-CV and RDW-SD for ischemic stroke.
Table 1 summarizes the main demographic, laboratory, clinical data of patients, presented for the overall population. There were no significant differences in sex, age, random blood glucose, LDL, triglycerides, MCV, MCH, MCHC, neutrophil levels. Also, there were no differences between the comorbidity types of the groups and those of CIRS-G scores. The hemoglobin levels were significantly higher in males than females in both groups (p<0.001) whereas AIS group’s hemoglobin levels were significantly lower than non-AIS group (p<0.001). MCH and MCHC levels were not different in patient and control group. White blood cell counts and lymphocyte percents were also significantly higher in AIS patients (p<0.001). High density lipoprotein (HDL-C) levels were significantly lower in AIS patients (p<0.01), while total cholesterol levels were significantly higher (p<0.05).
Demographic and clinical characteristics at baseline.
| Non-AIS group (n=99) | AIS group (n=342) | p-Valueb | |
|---|---|---|---|
| F (n=47)/M (n=52) | F (n=170)/M (n=172) | ||
| Age (years) (median (IQR) | 68 (18) | 70 (24) | 0.367 |
| Gender (female-%) | 49–49.5 | 170–49.7 | 0.951 |
| SBP (mmHg) (mean±SD) | 135±20 | 154±32 | <0.05 |
| DBP (mmHg) (mean±SD) | 76±11 | 72±10 | 0.186 |
| Laboratory parameters | |||
| RBG (mg/dL) median (IQR) | 139 (38) | 123 (43) | 0.104 |
| T.CHOL (mg/dL) (mean±SD) | 149±24 | 178±32 | <0.05 |
| HDL-C (mg/dL) (mean±SD) | 44±5 | 39±6 | <0.01 |
| LDL-C (mg/dL) (mean±SD) | 124±26 | 123±39 | 0.210 |
| TRIG (mg/dL) median (IQR) | 129 (103) | 107 (90) | 0.098 |
| MCV (fL) (mean±SD) | 80.9±13.7 | 84.1±9.8 | <0.05 |
| MCH (pg) (mean±SD) | 27.4±3.7 | 27.1±4.1 | 0.786 |
| MCHC (g/L) (mean±SD) | 32.1±1.9 | 32.1±1.7 | 0.906 |
| WBC (×109/L median) (IQR) | 8.8 (4.22) | 7.5 (2.24) | <0.001 |
| Neu (% median) (IQR) | 56 (13.3) | 68.6 (20.4) | 0.338 |
| Lym (% median) (IQR) | 32.7 (10.3) | 22.4 (19.8) | <0.001 |
| HGB (mg/dL) Female (mean±SD)/Male (mean±SD)/pb | 13.6±0.95/15.7±1.1.08 /<0.001b | 12.35±2.1/13.79±2.24/ <0.001b | <0.001 |
| RDW-CV (%) (mean±SD)/median (IQR) Female (mean±SD)/Male (mean±SD)/pb | 13.03±0.91/12.8 (1) 13.03±0.68/13.03±1.17 /0.262 | 14.45±2.46/13.9 (2.2) 14.83±2.72/14.08±2.13 /<0.001b | <0.001 |
| RDW-SD (fL) (mean±SD)/median (IQR) Female (mean±SD)/Male (mean±SD)/pb | 41.04±4.74/41 (3) 40.86±5.73/41.28±2.93/ 0.497 | 45.34±7.36/43.7 (7) 45.66±6.92/45.04±7.77/ 0.169 | <0.001 |
| Comorbidity (type)a | |||
| COPD (n/%) | 15/15.5 | 54/15.7 | 0.241 |
| Hypertension (n, %) | 34/34.3 | 136/39.7 | 0.114 |
| Diabetes (n, %) | 31/31.3 | 132/38.6 | 0.085 |
| Cardiovascular disease (n, %) | 40/40.4 | 153/44.7 | 0.092 |
| CIRS-Ga | 4 (2–5) | 5 (2–6) | 0.098 |
F, Female; M, male; SBP, systolic blood pressure; DBP, diastolic blood pressure; RBG, random blood glucose; T. CHOL, total cholesterol; HDL-C, high-density lipoprotein cholesterol; LDL-C, low-density lipoprotein cholesterol; TRIG, triglyceride; CIRS-G, Cumulative Illness Rating Scale-Geriatric. aMore disease per patient possible; WBC, white blood cell; Neu, neutrophil; Lym, lymphocyte; HGB, hemoglobin; MCV, mean red blood cell size; MCH, hemoglobin amount per red blood cell; MCHC, amount of hemoglobin relative to the size of the red cell; COPD, chronic obstructive pulmonary disease; RDW-SD, standard deviation of red blood cell distribution width; RDW-CV, variation coefficient of red blood cell distribution width; bsignificant difference between female and male gender.
The correlations of RDW parameters were showed in Table 2. A statistically positive correlation was found between the RDW-SD and blood pressure in the ischemic stroke patients (p<0.05). The stroke severity score (NIHSS) was showed a significant linear relationship with RDW-CV (r=0.525; p<0.001) and RDW-SD (r=0.798; p<0.001) (Figure 5).
The correlations of RDW parameters per group.
| Parameters | AIS patients | Non-AIS group | ||||||
|---|---|---|---|---|---|---|---|---|
| RDW-SD | RDW-CV | RDW-SD | RDW-CV | |||||
| r | p-Value | r | p-Value | r | p-Value | r | p-Value | |
| Age | 0.271a | <0.001 | 0.392a | <0.001 | 0.127 | 0.210 | 0.164 | 0.106 |
| SBP (mmHg) (mean±SD) | 0.201b | <0.05 | 0.454 | 0.365 | 0.062 | 0.258 | 0.084 | 0.562 |
| Lymphocyte (%) | 0.332a | <0.001 | 0.334a | <0.001 | −0.081 | 0.424 | −0.084 | 0.408 |
| WBC (109/L) | 0.159a | 0.002 | 0.167a | 0.003 | 0.130 | 0.785 | −0.028 | 0.199 |
| Hemoglobin (g/dL) | −0.394a | <0.001 | −0.541a | <0.001 | 0.084 | 0.409 | −0.167 | 0.098 |
| MCV (fL) | −0.310b | 0.075 | 0.250 | <0.05 | −0.059 | 0.425 | 0.244 | 0.368 |
| MCH (pg) | −0.098 | 0.308 | 0.241 | 0.592 | 0.043 | 0.355 | 0.118 | 0.458 |
| MCHC (g/dL) | 0.120 | 0.635 | 0.063 | 0.752 | 0.057 | 0.297 | 0.073 | 0.297 |
| Plateletecrit (%) | −0.130b | 0.018 | 0.085 | 0.125 | −0.020 | 0.847 | 0.081 | 0.427 |
| Platelet (109/L) | −0.193a | <0.001 | 0.010 | 0.860 | −0.006 | 0.949 | 0.018 | 0.858 |
| MPV (fL) | 0.256a | 0.005 | 0.120b | 0.029 | −0.017 | 0.870 | 0.062 | 0.540 |
| PDW (fL) | −0.130b | 0.018 | 0.085 | 0.125 | −0.013 | 0.901 | 0.129 | 0.203 |
| NIHSS (score) | 0.798a | <0.001 | 0.525a | <0.001 | − | − | − | − |
aCorrelation is significant at the 0.01 level (2-tailed). bCorrelation is significant at the 0.05 level (2-tailed). RDW-SD, standard deviation of red blood cell distribution width; RDW-CV, variation coefficient of red blood cell distribution width; SBP, Systolic blood pressure; WBC, white blood cell; MCV, mean red blood cell size; MCH, hemoglobin amount per red blood cell; MCHC, amount of hemoglobin relative to the size of the red cell; MPV, mean platelet volume; PDW, platelet distribution width; NIHSS, National Institutes of Health Stroke Scale Score.

Acute ischemic stroke survival by RDW- SD and RDW-CV quartiles.
The 90-days mortality of patients was 18.7% (n=64/342) and increased from 3.3% to 29.7% from the first quartile (<12.6) to the last RDW-CV quartile (>14.7). For RDW-SD, 90-days mortality rate was 2.7% in first quartiles and was 34.4% last quartiles (Figure 6 and Tables 3 and 4).

Linear correlation graphs of RDW-SD and RDW-CV with NIHSS.
Means and medians for survival time and case processing summary.
| Meana | ||||||||
|---|---|---|---|---|---|---|---|---|
| Estimate | Std. error | 95% CI | Total n | n of Events | Censored | |||
| Lower bound | Upper bound | n | Percent | |||||
| RDW-CV (%) | ||||||||
| 11.6–12.6 | 87.6 | 1.7 | 84.3 | 91 | 60 | 2 | 58 | 96.7% |
| 12.7–13.6 | 83.4 | 2 | 79.4 | 87.4 | 94 | 10 | 84 | 89.4% |
| 13.7–14.6 | 73.9 | 3.5 | 67 | 80.8 | 77 | 17 | 60 | 77.9% |
| >14.7 | 67.7 | 3.5 | 60.9 | 74.6 | 101 | 30 | 71 | 70.3% |
| Overall | 77.2 | 1.6 | 74.1 | 80.2 | 342 | 64 | 278 | 81.3% |
| RDW-SD (fL) | ||||||||
| <42 | 87.9 | 1.2 | 85.5 | 90.3 | 112 | 3 | 109 | 97.3% |
| 42.1–44 | 79.7 | 3.1 | 73.6 | 85.9 | 68 | 10 | 58 | 85.3% |
| 44.1–50 | 70.9 | 3.3 | 64.5 | 77.4 | 92 | 26 | 66 | 71.7% |
| >50 | 63.8 | 4.4 | 55.2 | 72.5 | 70 | 24 | 46 | 65.7% |
| Overall | 77.2 | 1.6 | 73.7 | 79.8 | 342 | 64 | 278 | 81.3% |
aEstimation is limited to the largest survival time (days) if it is censored. n, Patients count; RDW-CV, variation coefficient of red blood cell distribution width; RDW-SD, standard deviation of red blood cell distribution width.
Risk of first ever acute ischemic stroke severity predicted by multivariable cox proportional hazard model.
| Variables in the equation | ||||||||
|---|---|---|---|---|---|---|---|---|
| B | SE | Wald | df | Sig. | Exp(B) | 95% CI for Exp(B) | ||
| Lower | Upper | |||||||
| RDW-CV (%) | ||||||||
| Q 1 (11.6–12.6) | 19.110 | 3 | 0.000 | |||||
| Q 2 (12.7–13.6) | 1.191 | 0.775 | 2.364 | 1 | 0.124 | 3.291 | 0.721 | 15.023 |
| Q 3 (13.7–14.6) | 2.031 | 0.749 | 7.349 | 1 | 0.007 | 7.619 | 1.755 | 33.073 |
| Q 4 (>14.7) | 2.403 | 0.733 | 10.762 | 1 | 0.001 | 11.059 | 2.631 | 46.479 |
| Gendera | −0.229 | 0.263 | 0.761 | 1 | 0.383 | 0.795 | 0.475 | 1.331 |
| RDW-SD (fL) | ||||||||
| Q 1 (<42) | 24.000 | 3 | 0.000 | |||||
| Q 2 (42.1–44) | 1.832 | 0.658 | 7.743 | 1 | 0.005 | 6.245 | 1.719 | 22.694 |
| Q 3 (44.1–50 | 2.485 | 0.610 | 16.574 | 1 | 0.000 | 11.995 | 3.627 | 39.673 |
| Q 4 (>50) | 2.779 | 0.613 | 20.551 | 1 | 0.000 | 16.106 | 4.844 | 53.559 |
| Gendera | 0.143 | 0.253 | 0.319 | 1 | 0.572 | 1.153 | 0.703 | 1.892 |
aVariable entered on step 1: gender. RDW-CV, Variation coefficient of red blood cell distribution width; RDW-SD, standard deviation of red blood cell distribution width.
RDW-SD values of <42 fL (first quartiles) was significantly different from all quartiles in pairwise Mantel-Cox comparisons. Pairwise comparisons of RDW-SD and RDW-CV quartiles were showed in Table 5.
Pairwise comparisons of RDW-SD and RDW-CV quartiles.
| RDW-SD quartiles (fL) | <42 | 42.1–44 | 44.1–50 | >50 | |||||
|---|---|---|---|---|---|---|---|---|---|
| χ2 | Sig. | χ2 | Sig. | χ2 | Sig. | χ2 | Sig. | ||
| Log rank (Mantel-Cox) | <42 | 10.143 | 0.001 | 27.061 | 0.000 | 35.339 | 0.000 | ||
| 42.1–44 | 10.143 | 0.001 | 3.245 | 0.072 | 6.442 | 0.011 | |||
| 44.1–50 | 27.061 | 0.000 | 3.245 | 0.072 | 1.102 | 0.294 | |||
| >50 | 35.339 | 0.000 | 6.442 | 0.011 | 1.102 | 0.294 | |||
| RDW-CV quartiles (%) | 11.6–12.6 | 12.7–13.6 | 13.7–14.6 | >14.7 | |||||
| χ2 | Sig. | χ2 | Sig. | χ2 | Sig. | χ2 | Sig. | ||
| Log rank (Mantel-Cox) | 11.6–12.6 | 2.646 | 0.104 | 9.718 | 0.002 | 15.828 | 0.000 | ||
| 12.7–13.6 | 2.646 | 0.104 | 4.533 | 0.033 | 11.64 | 0.001 | |||
| 13.7–14.6 | 9.718 | 0.002 | 4.533 | 0.033 | 1.445 | 0.229 | |||
| >14.7 | 15.828 | 0.000 | 11.64 | 0.001 | 1.445 | 0.229 | |||
χ2, Chi-square value; RDW-CV, variation coefficient of red blood cell distribution width; RDW-SD, standard deviation of red blood cell distribution width.
RDW-CV levels were significantly higher in females than males in the AIS group (p<0.001), while there was no difference between males and females in the AIS group in terms of RDW-SD levels. In the non-AIS group, both RDW parameters did not show any differences among the gender. There was no statistical difference between male and female gender in terms of acute ischemic stroke for RDW-SD and RDW-CV. While RDW-CV is relatively more effective on male gender survival, RDW-SD is more influential on female survival times, but there is no gender effect on total survival for RDW-SD [p=0.572; HR=0.867 (0.528–1.422)] and RDW-CV [p=0.383; HR=0.795 (0.475–1.331)]. The mean RDW-CV is quartiles and age [p=0.049; HR=1.024 (0.528–1.422) per 1 year], with a mean RDW-SD quartiles and age [p=0.038; HR=1.051 (0.522–1.201) per 1 year], and Cox is identified as a potential risk factors for AIS in the proportional hazard model, respectively.
RDW-CV values higher than 14.7% are associated with 11 fold increase in the risk of stroke [p<0.001; HR=11.06 (2.631–46.479)]; and the level of RDW-CV does show a linear relationship with the severity score of stroke. So, RDW-CV values not only predicted the occurrence of ischemic stroke but also with stroke severity. Besides, RDW-SD, the other erythrocyte index, was found to be associated with a 16-fold increase in stroke severity score when >50 fL [p<0.001; HR=16.11 (4.844–53.559)].
Discussion
The RDW expression in the literature has been used to indicate RDV-CV, and the vast majority previous stroke-related work has been done with it. In order to clarify the relationship of the erythrocyte anisocytosis in stroke mechanisms, it may be useful to examine the RDW-CV and RDW-SD separately.
According to the findings of our study, in stroke predictability, RDW-SD was relatively more sensitive and RDW-CV was relatively more specific. The effect of RDW-CV and RDW-SD levels on survival time percentages and hazard ratios due to each other were found to be differently. Also, we found that the increase in the probability of death by RDW-SD is relatively more and the effect of RDW-SD on stroke severity scores (NIHSS) is stronger. In other words, we suggested that the increase in death probability with elevated RDW-SD was greater than with elevated RDV-CV, and that the effect of elevated RDW-SD on stroke severity was stronger than high levels of RDV-CV.
To our best knowledge, our research based on the scope of comparison of these RDW indices has made first study in the literature for AIS patients, because it did not encounter any other similar study.
RDW is commonly measured, inexpensive and widely available and may reflect overall inflammation in AIS. RDW is a robust predictor of the risk of all cause patient mortality in first ever AIS patients. Although the mechanism of RDW-mortality relationship is not clear, the association of RDW with AIS development and subsequent mortality may be related to chronic inflammation and inflammation contributing to the pathophysiology of the disease [21], [22]. RDW is defined as a chronic disease and co-morbidity marker [23] and associated with oxidative stress have been reported [24]. It has been suggested that alterations in erythrocyte morphology are due to oxidative stress and chronic inflammation [25].
It has been suggested that RDW levels are affected by aging, lifestyle, and disease, and associated with cardiovascular health, nutrition, genetic factors, immune state, and oxygen delivery [26].
In healthy individuals, RDW-CV and RDW-SD are parameters that are acting in the same direction and generally associated with compatible each other. These are reported from the same histogram graph, however have different reference intervals (The reference range for RDW-SD is 39–46 fL, and RDW-CV is 11.6–14.6%, in adults) and are calculated with different formula. These parameters vary in parallel in healthy individuals, but due to this calculation difference, the same RDW-CV values in different individuals and in different diseases do not correspond to the same RDW-SD, even if they are of the same age and gender. When considered together with the MCV parameter used in formulation, we can say that the levels of RDW-CV changed depending on the patient’s previously anemia status and age. In the interpretation of chronic disease due to anemia or anemia due to chronic illness, it may need to evaluate RDD-CV in separate categories with RDW-SD. Indeed, hemoglobin and MCV levels were significantly different between our patients and control groups.
Inflammation markers have been associated with the stroke early phase in the activation of immune responses [27]. Platelets have great importance as also an inflammation marker in the pathogenesis of stroke. Anti-platelet agents generally used in practice for ischemic stroke treatment and prevention [28]. In our study, RDW-SD, but not RDW-CV, showed more strong correlation with platelet indices known to be inflammatory markers [29], [30]. This result also suggests the presence of only an anemia unrelated inflammatory response in stroke development. The total comorbidity scores of our patients were not different from the control group, despite the use of a scoring not involving anemia. However, in the control group, no association of the named platelet indices with both RDW parameters was observed. In CIRS-G have was no scoring of the anemia parameters, and perhaps because of this we could not find any difference in terms of total comorbidity between the groups. We therefore recommend that different disease scorings, including the RDW-CV and RDW-SD parameters, be established.
While RDW-CV is more sensitive and effective in detecting anisocytosis at microcytic MCV intervals, it has been shown that the RDW-SD MCV range is more sensitive and effective when it is normocytic [31]. A red cells homogenous population with a narrow distribution curve and low MCV may have an elevated RDW-CV while a red cells heterogeneous population with a broad distribution curve and a high MCV may have a normal RDW-CV [32]. As a matter of fact, the MCV values in the AIS patient group were no different from the non-AIS group. This may support to clarify the relatively stronger effect of RDW-SD on survival and stroke severity.
Hemoglobin levels were significantly lower in AIS patients than in non-AIS patients, both in women and men. AIS patients’ MCV levels were correlated with RDW-CV. We could interpret this result as a consequence of the difference of MCV levels in the stroke and non-stroke groups. Increased RDW values were found in recurrent stroke patients, when compared to persons with first ever stroke and found to be predictive of intensive care unit mortality [33] and of poor outcome in ischemic stroke [34]. The particularly exclusion of recurrent stroke cases known to be associated with higher RDW levels, in this study, may be a determinant of the relatively different hazard ratios, cut-off values and sensitivity values found for RDW-CV.
Infra-tentorial infarction known to have high mortality [15] or known to cause RDW elevation; intra-cerebral hemorrhage [35], serious infection [36], malignancy [37], thalassemia [32] patients were excluded from the study. In fact, RDW levels are elevated when thalassemia is heterozygous. However, RDW levels are in normal ranges in other thalassemia types. But we removed all patients diagnosed with thalassemia before the study because (even if the number of patients with thalassemia is statistically insignificant) there were also patients with whom we could not reach the knowledge of thalassemia typology in the anamnesis patient exclusion process. These exclusions stand out as a solid aspect of our work.
There were main limitations of our study. Firstly; this study was carried out in a single hospital setting including Turkish patients, and results may not be generalized to other cohorts. Secondly; given the intrinsic limitations of the all retrospective studies, other information is the lack of data about other possible determinants of RDW; erythropoietin, transferrin saturation, ferritin, reticulocyte, vitamin B12, folic acid level, iron and iron binding capacity. Data about patient receiving any blood transfusion were not obtained. Also, inflammatory indices related red blood cell life span and iron metabolism; such as erythrocyte sedimentation rate and C-reactive protein could not be achieved.
Increased baseline RDW-CV and higher baseline RDW-SD are independently predicting subsequent risk of poor outcome in with AIS. For these parameters, there should be individual disease risk and specific prognostic definitions and also should be interpreted separately for ischemic stroke disease. It must be pointed out that the RDW-CV and RDW-SD levels may have different cut-off values and different prognostic poor outcomes for interpreting in ischemic stroke events approach. These are known as complementary parameters, but both should be used alone and comparatively with the AIS predictive and prognostic approach. In order to shed light on the underlying mechanism of the differing relationships of these two parameters, it is necessary to further study with different instruments with multi-center and different measurement principles with larger sample numbers.
Compliance with ethical standards
This protocol was approved by the Ethics Committee of Erciyes University.
As this was a retrospective no-risk research, formal patient informed consent was not required.
This research did not receive any specific grant from funding agencies in the public, commercial, or not-for-profit sectors.
All procedures performed in research involving human participants were in accordance with the ethical standards of the institutional research committee and with the 1964 Helsinki declaration and its later amendments or comparable ethical standards.
No potential conflict of interest was declared.
References
1. Benjamin E, Blaha MJ, Chiuve SE, Cushman M, Das SR, Deo R, et al. Heart disease and stroke statistics-2017 update: a report from American Heart Association. Circulation 2017;135:146–e603.10.1161/CIR.0000000000000485Search in Google Scholar
2. VanBussel EF, Jeerakathil T, Schrijvers AJ. The process flow and structure of an integrated stroke strategy. Int J Integr Care 2013;13:25.10.5334/ijic.888Search in Google Scholar
3. Panwar B, Judd SE, Warnock DG, McClellan WM, Booth JN,Muntner P, et al. Hemoglobin concentration and risk of incident stroke in community-living adults. Stroke 2016;47:2017–24.10.1161/STROKEAHA.116.013077Search in Google Scholar
4. Dobrynina LA, Kalashnikova LA, Shabalina AA, Kostyreva MV, Shamtieva KV. Indicators of homeostasis, inflammation and homocysteine in ischemic stroke in young age. Zh Nevrol PsikhiatrIm S SKorsakova 2017;117:25–33.10.17116/jnevro201711712225-33Search in Google Scholar
5. Arevalo-Lorido JC, Carretero-Gomez J, Alvarez-Oliva A, Gutierrez-Montano C, Fernandez-Recio JM, Najarro-Díez F. Mean platelet volume in acute phase of ischemic stroke, as predictor of mortality and functional outcome after 1 year. J Stroke Cerebrovasc Dis 2013;22:297–303.10.1016/j.jstrokecerebrovasdis.2011.09.009Search in Google Scholar
6. Pinho J, Marques SA, Freitas E, Araújo J, Taveira M, Alves JN, et al. Red cell distribution width as a predictor of 1-year survival in ischemic stroke patients treated with intravenous thrombolysis. Thromb Res 2018;164:4–8.10.1016/j.thromres.2018.02.002Search in Google Scholar
7. Chiu NL, Kaiser B, Nguyen YV, Welbourne S, Lall C, Cramer SC. The volume of the spleen and its correlates after acute stroke. J Stroke Cerebrovasc Dis 2016;25:2958–61.10.1016/j.jstrokecerebrovasdis.2016.08.012Search in Google Scholar
8. Lippi G, Mattiuzzi C, Cervellin G. Learning more and spending less with neglected laboratory parameters: the paradigmatic case of red blood cell distribution width. Acta Biomed 2017;87:323–8.Search in Google Scholar
9. Evans T, Jehle D. The red blood cell distribution width. J Emmerg Med 1991;9:71–4.10.1016/0736-4679(91)90592-4Search in Google Scholar
10. King GL, Loekan MR. Hyperglycaemia-induced oxidative stress in diabetic complications. Histochem Cell Biol 2004;122:333–8.10.1007/s00418-004-0678-9Search in Google Scholar PubMed
11. Tesfamarin B, Cohen RA. Free radicals mediate endothelial cell dysfunction caused by elevated glucose. Am J Physiol 1992;263:321–6.10.1152/ajpheart.1992.263.2.H321Search in Google Scholar
12. Constantino BT. Red cell distribution width, revisited. Lab Med 2013;44:2–9.10.1309/LMZ1GKY9LQTVFBL7Search in Google Scholar
13. Munro BH. Statistical methods for health care research, 5th ed. New York, NY: Lippincott Williams and Wilkins, 2005.Search in Google Scholar
14. Bain BJ, Bates I, Laffan M, Lewis SM, editors. Dacie and Lewis practical haematology, 11th ed. Churchill Livingstone, Elsevier, 2012:14–5.10.1016/B978-0-7020-3408-4.00002-3Search in Google Scholar
15. Das S, Chandra Ghosh K, Malhotra M, Yadav U, Sankar Kundu S, Kumar Gangopadhyay P. Short term mortality predictors in acute stroke. Ann Neurosci 2012;19:61–7.10.5214/ans.0972.7531.12190203Search in Google Scholar PubMed PubMed Central
16. Lippi G, Pavesi F, Bardi M, Pipitone S. Lack of harmonization of red blood cell distribution width (RDW). Evaluation of four hematological analyzers. Clin Biochem 2014;47:1100–3.10.1016/j.clinbiochem.2014.06.003Search in Google Scholar PubMed
17. Lyden P, Brott T, Tilley B, Welch KM, Mascha EJ, Levine S, et al. Improved reliability of the NIH Stroke Scale using video training. NINDS TPA Stroke Study Group. Stroke 1994;25:2220–6.10.1161/01.STR.25.11.2220Search in Google Scholar PubMed
18. Fleming ST, Sabatino SA, Kimmick G, Wu XC, Hwang W, Wilson JF, et al. Developing a clam-based version of the ACE-27 comorbidity index: a comparison with medical record review. Med Care 2011;49:752–60.10.1097/MLR.0b013e318215d7ddSearch in Google Scholar PubMed
19. Chobanian AV, Bakris GL, Black HR, Cushman WC, Green LA, Izzo Jr JL, et al. The seventh report of the joint national committee on prevention, detection, evaluation, and treatment of high blood pressure: the JNC 7 report. J Am Med Assoc 2003;289:2560–72.10.1001/jama.289.19.2560Search in Google Scholar PubMed
20. Lepor NE. An update on diagnostic criteria for diabetes and the metabolic syndrome. Rev Cardiovasc Med 2004;5:182–5.Search in Google Scholar
21. Libby P. Inflammation in atherosclerosis. Nature 2002;420: 868–74.10.1038/nature01323Search in Google Scholar PubMed
22. Perlstein TS, Weuve J, Pfeffer MA, Beckman JA. Red blood cell distribution width and mortality risk in a community-based prospective cohort. Arch Intern Med 2009;169:588–94.10.1001/archinternmed.2009.55Search in Google Scholar PubMed PubMed Central
23. Zurauskaite G, Meier M, Voegeli A, Koch D, Haubitz S, Kutz A, et al. Biological pathways underlying the association of red cell distribution width and adverse clinical outcome: results of a prospective cohort study. PLoS One 2018;13:e0191280.10.1371/journal.pone.0191280Search in Google Scholar PubMed PubMed Central
24. Semba RD, Patel KV, Ferrucci L, Sun K, Roy CN, Guralnik JM, et al. Serum antioxidants and inflammation predict red cell distribution width in older women: the Women’s Health and Aging Study I. Clin Nutr 2010;29:600–4.10.1016/j.clnu.2010.03.001Search in Google Scholar PubMed PubMed Central
25. Gyawali P, Richards RS, Tinley P, Nwose EU, Bwititi PT. Hemorheological parameters better classify metabolic syndrome than novel cardiovascular risk factors and peripheral vascular disease marker. Clin Hemorheol Microcirc 2016;64:1–5.10.3233/CH-152033Search in Google Scholar PubMed
26. Kozlitina J, Garcia CK. Red blood cell size is inversely associated with leukocyte telomere length in a large multi-ethnic population. PLoS One 2012;7:e51046.10.1371/journal.pone.0051046Search in Google Scholar PubMed PubMed Central
27. Fann DY, Lee SY, Manzanero S, Tang SC, Gelderblom M, Chunduri P, et al. Intravenous immunoglobulin suppresses NLRP1 and NLRP3 inflammasome-mediated neuronal death in ischemic stroke. Cell Death Dis 2013;4:790.10.1038/cddis.2013.326Search in Google Scholar PubMed PubMed Central
28. Cevik O, Baykal AT, Sener A. Platelets proteomic profiles of acute ischemic stroke patients. PLoS One 2016;11:e0158287.10.1371/journal.pone.0158287Search in Google Scholar PubMed PubMed Central
29. Woo J, Lau E, Kay R, Lam CW, Cheung CK, Swaminathan R, et al. A case control study of some hematological and biochemical variables in acute stroke and their prognostic value. Neuroepidemiology 1990;9:315–20.10.1159/000110794Search in Google Scholar PubMed
30. Ayas ZÖ, Can U. Alteration of mean platelet volume in the pathogenesis of acute ischemic stroke: cause or consequence? Ideggyogy Sz 2018;71:49–56.10.18071/isz.71.0049Search in Google Scholar PubMed
31. Caporal FA, Comar SR. Evaluation of RDW-CV, RDW-SD, and MATH-1SD for the detection of erythrocyte anisocytosis observed by optical microscopy. J Bras Patol Med Lab 2013;49:324–31.10.1590/S1676-24442013000500005Search in Google Scholar
32. Flynn MM, Reppun TS, Bhagavan NV. Limitations of red blood cell distribution width (RDW) in evaluation of microcytosis. Am J Clin Pathol 1986;8:445–9.10.1093/ajcp/85.4.445Search in Google Scholar PubMed
33. Meynaar IA, Knook AH, Coolen S, Le H, Bos MM, van der Dijs F, et al. Red cell distribution width as predictor for mortality in critically ill patients. Neth J Med 2013;71:488–93.Search in Google Scholar
34. Turcato G, Cappellari M, Follador L. Red blood cell distribution width is an independent predictor of outcome in patients undergoing thrombolysis for ischemic stroke. Semin Thromb Hemost 2017;43:30–5.10.1055/s-0036-1592165Search in Google Scholar PubMed
35. Kömürcü Ö, Avcı A, Gülen M, Özer Aİ, Koçer M, Ülger H, et al. The prognostic role of MPV and RDW in patients with spontaneous intracerebral hemorrhage. Acta Medica Mediterr 2017;33:527–33.Search in Google Scholar
36. Jandial A, Kumar S, Bhalla A, Sharma N, Varma NS. Elevated red cell distribution width as a prognostic marker in severe sepsis: a prospective observational study. Indian J Crit Care Med 2017;21:552–62.10.4103/ijccm.IJCCM_208_17Search in Google Scholar PubMed PubMed Central
37. Ellingsen TS, Lappegård J, Skjelbakken T, Brækkan SK, Hansen JB. Impact of red cell distribution width on future risk of cancer and all-cause mortality among cancer patients – the Tromsø Study. Haematologica 2015;100:387–9.10.3324/haematol.2015.129601Search in Google Scholar PubMed PubMed Central
©2020 Walter de Gruyter GmbH, Berlin/Boston
Articles in the same Issue
- Frontmatter
- Review Article
- Establishing and using reference intervals
- Research Articles
- Evaluation of the clinical chemistry tests analytical performance by using different models and specifications
- Impact of preventive actions on rejection rates in the preanalytical period
- Comparison of some biochemical tests in different blood collection tubes in hemodialysis patients
- Evaluation of percentage recovery together with modified reference range in hyperprolactinemia
- Fractalkine (CX3CL1) and its receptor (CX3CR1) in children with hypertrophic adenoid and chronic otitis media with effusion
- Neutrophil gelatinase-associated lipocalin as a potential biomarker for pulmonary thromboembolism
- Diagnostic values of neutrophil/lymphocyte ratio, platelet/lymphocyte ratio and procalcitonin in early diagnosis of bacteremia
- The distribution indices of erythrocytes: which one for acute ischemic stroke?
- Evaluating serum elastin levels in striae gravidarum
- Spectrum of BRCA1/BRCA2 variants in 1419 Turkish breast and ovarian cancer patients: a single center study
- Investigation of effect of vitamin D receptor, calcium-sensing receptor and β-catenin on cutaneous squamous cell carcinoma
- Hepatotoxicity and nephrotoxicity following long-term prenatal exposure of paracetamol in the neonatal rat: is betaine protective?