Influence of pegylated interferon and ribavirin on insulin resistance and metabolic factors in chronic hepatitis C
-
Zeynep Altın

 ,
Ayfer Çolak
,
Betül Koyuncu
,
Ayfer Çolak
,
Betül Koyuncu

Abstract
Background
In this study it was aimed to evaluate the effect of pegylated interferon alfa-2a/2b and ribavirin, which are used for treatment of chronic hepatitis C (CHC), on insulin resistance and metabolic factors.
Materials and methods
A total of 104 CHC patients aged 20–75 years with available serum insulin data at 0 and 48 weeks, and hepatitis C virus (HCV)-RNA data at 0, 12, 24, 48 and 72 weeks were included in the study. All clinical para-meters were assessed according to the therapy response.
Results
Among 104 patients, sustained virologic response (SVR) was achieved in 55 cases. A statistically significant difference was noted between SVR and non-SVR groups regarding γ-glutamyltranspeptidase (GGT), insulin level plus homeostasis model assessment (HOMA) score and insulin resistance at week 48, log HCV-RNA and stage of fibrosis.
Conclusion
Insulin resistance is accepted to have a negative effect on SVR. Insulin resistance may improve once SVR is achieved. Presence of IR at week 48 has been found associated with SVR. In this context, it can be advocated that insulin resistance at week 48 may be a predictive factor for prediction of SVR at week 72.
Öz
Amaç
Bu çalışmada, kronik hepatit C tedavisinde kullanılan pegile interferon alfa 2a/2b ve ribavirinin insulin direnci ve metabolik faktörler üzerine etkileri incelenmiştir.
Materyal ve Metotlar
Çalışmaya yaşları 20 ile 75 arasında değişen, 0 ve 48. haftalara ait insulin değerleri ile birlikte 0, 12, 24, 48 ve 72. haftalardaki HCV-RNA değerleri mevcut olan toplam 104 kronik hepatit C hastası dahil edilmiştir. Tüm klinik parametreler tedavi yanıtına göre değerlendirilmiştir.
Bulgular
Kalıcı virolojik yanıt (KVY) 104 hastanın 55’inde elde edilebilmiştir. KVY elde edilen ve edilemeyen gruplar arasında GGT, HCV-RNA düzeyi, fibrozis evresi ve 48. haftadaki insulin düzeyi, insulin direnci ve HOMA skoru arasında istatistiksel olarak anlamlı ilişki tespit edilmiştir.
Sonuç
İnsulin direncinin KVY üzerinde negatif etkisi olduğu kabul edilmektedir. SVR elde edildiğinde ise insulin direnci düzelebilmektedir. İnsülin direncinin 48. haftadaki varlığı, KVY ile ilişkili bulunmuştur. Bu bağlamda; 48. haftada mevcut olan insulin direncinin, 72. haftadaki KVY konusunda öngördürücü olacağı söylenebilir.
Introduction
As reported in the literature, approximately 3% of world population – which equals to 170–200 million people – is infected with hepatitis C virus (HCV) [1]. HCV is responsible for the indicated percentages of cases with acute viral hepatitis (20%), chronic viral hepatitis (70%), viral hepatitis ending with cirrhosis (40%), hepatocellular cancer (HCC) (60%) and cases requiring liver transplantation (30%) in developed countries [1], [2], [3], [4].
Interferon was the first agent used in the monotherapy of chronic hepatitis C (CHC) in 1990. In 1998, interferon and ribavirin combination was shown to be more effective than interferon alone. Efficacy of interferon alpha was limited due to its fast clearance and short half-life. Thus, pegylated forms were developed to extend its short half-life. Following head-to-head comparisons, pegylated interferon (PEG-IFN) and ribavirin combination started to be the standard therapy. Response rates of 50–60% and 80–90% were achieved with this therapy in patients with genotype 1 and also genotype 2 and 3, respectively [5], [6], [7]. This combination therapy may cause flu-like symptoms, fatigue, hair loss, anemia, leucopenia and thrombocytopenia. Although less frequently; acute psychosis, convulsions, autoimmune reactions, hyperthyroidism and hypothyroidism may also be seen [8]. Early discontinuation of therapy may come up owing to side effects in 10–20% of the cases [9].
Hepatitis C virus adversely affects metabolic functions, primarily lipid metabolism [10]. It has also been shown that insulin resistance develops during treatment [11]. At the same time, the development of insulin resistance has been shown to have an adverse effect on sustained virologic response (SVR). Although there is a lot of work on the effects of combined treatment, it is not clear which patients can achieve SVR. In this study, we aimed to determine whether changes in insulin resistance at weeks 0 and 48 could predict SVR.
Materials and methods
A total of 104 CHC patients aged 20–75 years with available serum insulin (at 0 and 48 weeks) and HCV-RNA (at 0, 12, 24, 48 and 72 weeks) levels who applied to Izmir Ataturk Research and Training Hospital, Department of Gastroenterology between 01 January 2005 and 01 November 2012 were included in the study. Local Ethics Committee approval was taken. These parameters were assessed according to the groups categorized based on response to therapy (SVR, relapse and non-responders). Inclusion and exclusion criteria were as follows:
Inclusion criteria: having diagnosed with CHC, completion of therapy
Exclusion criteria: poor follow-up, diabetes mellitus, chronic renal failure, any solid organ or hematologic malignancy, HIV positivity, and pregnancy.
Clinical and laboratory assessments
For biochemical analyses, all the serum samples were drawn into gel separator tubes (Vacutainer SST, Beckton Dickinson, France) between 08.00 and 08.30 a.m. after a 12-h fasting. The blood samples were allowed to clot and then centrifuged at 2500 RCF for 10 min at room temperature. Routine biochemical measurements were performed in the with enzymatic method on the Abbott Architect c16000 Autoanalyzer (Abbott Diagnostics, Abbott Park, IL, USA). Insulin concentrations were measured by the electrochemiluminescence immunoassay (ECLIA) on an Elecsys E-170 analyzer (Roche Diagnostics Ltd., Basel, Switzerland). Low-density lipoprotein (LDL) cholesterol was calculated by Friedewald’s formula. Insulin resistance was calculated using the homeostasis model assessment of insulin resistance (HOMA-IR), using the formula: fasting insulin (μIU/mL)×fasting glucose (mg/dL)/405.
Patients’ records concerning body weight, body mass index (BMI), waist circumference, uric acid, glucose, total cholesterol, triglyceride, high-density lipoprotein (HDL) and LDL cholesterol, aspartate aminotransferase (AST), alanine aminotransferase (ALT), γ-glutamyltranspeptidase (GGT), creatinine, insulin levels, hematologic parameters, liver biopsy and upper abdominal ultrasonography reports were obtained via patient recording system. Statistical analyses were performed.
Histologic assessment
Pathologic samples were assessed by pathologists blind both to patients and their histories. Adequate sample was defined as a biopsy material of more than 15 mm or those obtained from at least 10 complete portal fields. Samples were classified with respect to Ishak grading system. Steatosis was defined, and stratified based on the percentage of hepatocytes with fat droplets as: none: <5%, mild 5–33%, mild to moderate 33–66%, and severe >66%.
Antiviral therapy schedule
Patients were administered PEG-IFN-2a (Pegasys; Roche, Basel, Switzerland) as 180 μg/week and ribavirin (1000 mg/day, and 1200 mg/day for those with a body weight <75 kg, and >75 kg, respectively) during 48 weeks. Treatments were stopped if “virologic response” defined as undetectable HCV-RNA via PCR at week 24 was achieved.
Statistical methods
Continuous variables were denoted as mean±standard deviation, while categorical ones as frequencies and percentages. ANOVA, t-test and χ2 tests were used. Multiple logistic regression analysis was used to evaluate the effect of treatment on SVR. Age, BMI, insulin resistance (IR) at week 48, log HCV-RNA and fibrosis were used in this model. Presence of IR at week 48 and fibrosis were used as categorical variables. Hosmer-Lemeshow test was used for model consistency. Only one of the variables that are correlated with each other was included in the model. All analyses were performed in “Statistical Packages for the Social Sciences – SPSS 13.0 version”.
Results
Records of 182 patients who had successfully completed therapy were assessed. Patients with type II diabetes (n=39), genotype 2/3 HCV (n=8), missing data concerning insulin levels at week 48 (n=17), and those undergoing antiviral therapy (n=14) were excluded from the study. A total of 104 genotype I CHC patients including 93 with available liver biopsy results who successfully completed therapy were included in the study.
Basic demographic data of the patients are shown in Table 1. Patient population consisted of 40 male and 64 female patients with an overall mean age of 52.1±11.8 years. Twenty-eight (26.9%) patients had normal body weight, while the remaining patients were overweight (n=46: 44.2%) or obese (n=30: 28.8%). Cholesterol parameters were within normal limits. Mean plasma glucose value at week 0 was 95.24±11.83 mg/dL, while it was 92.84±12.68 mg/dL at week 48. Insulin levels were 16.17±11.45 mIU/L and 16.02±16.27 mIU/L at weeks 0 and 48, respectively. Also, mean HOMA-IR scores were 3.81±2.69 and 3.84±4.45 – which were quite high – at weeks 0 and 48, respectively. IR was 53.9% (n=56) and 44.2% (n=46) at weeks 0, and 48, respectively. Arterial hypertension and metabolic syndrome were not noted in large majority of patients. Genotype Ib was responsible for in 98 (94.2%) patients while genotype Iain 6 (5.8%).
Demographic data of CHC patients.
| Variable | HCV (n=104) |
|---|---|
| Gender (M/F) | 40/64 |
| Age (years) | 52.1±11.8 (55; 22–71)a |
| Body mass index (kg/m2) | 27.93±4.86 (27.1; 17.6–42.2)a |
| Body mass index | |
| <25 | 28 (26.9%) |
| 25–29.9 | 46 (44.2%) |
| >30 | 30 (28.8%) |
| Waist circumference (cm) | 96.97±11.96 (97; 73–130)a |
| AST (IU/L) | 53.40±30.82 (47; 17–214)a |
| ALT (IU/L) | 65.51±43.57 (53.5; 13–316)a |
| GGT (IU/L) | 61.10±57.17 (43.5; 10–301)a |
| Platelet counts (×103/μL) | 208.5±68.2 (201; 21–424)a |
| Triglyceride (mg/dL) | 160.02±32.75 (160; 94–246)a |
| Total cholesterol (mg/dL) | 109.78±52.50 (96; 23–400)a |
| LDL-cholesterol (mg/dL) | 92.59±34.33 (89; 22–220)a |
| HDL-cholesterol (mg/dL) | 46.35±14.71 (44.5; 16–106)a |
| Blood glucose on week 0 (mg/dL) | 95.24±11.83 (95; 68–125)a |
| Blood glucose on week 48 (mg/dL) | 92.84±12.68 (94.5; 71–142)a |
| Insulin on week 0 (pU/mL) | 16.17±11.45 (12.5; 2.0–52.2)a |
| Insulin on week 48 (pU/mL) | 16.02±16.27 (12.3; 2.0–131)a |
| HOMA-IR at week 0 | 3.81±2.69 (3.09; 0.40–12.53)a |
| HOMA-IR at week 48 | 3.84±4.45 (2.69; 0.37–38.18)a |
| Insulin resistance at week 0 (%) | 56 (53.9%) |
| Insulin resistance at week 48 (%) | 46 (44.2%) |
| Arterial hypertension (yes %/no %) | 20 (19.2%)/84 (80.8%) |
| Metabolic syndrome (yes %/no %) | 20 (19.2%)/84 (80.8%) |
| Viral genotype (1a/1b) | 6/98 |
| Rapid viral response (yes/no) | 29/75 |
| Early viral response (yes/no) | 58/46 |
| SVR/non-SVR | 55/49 |
| Grade of steatosis (n=93) | n (%) |
| 1 (5–33%) | 70 (75.3) |
| 2 (>33–66%) | 15 (16.1) |
| 3 (>66%) | 8 (8.6) |
| Histologic activity index (n=93) | n (%) |
| 0 (0) | 31 (33.3) |
| 1 (1–8) | 41 (44.1) |
| 2 (9–18) | 21 (22.6) |
| Stage of fibrosis (n=93) | n (%) |
| 0 (0) | 10 (10.8) |
| 1 (1–2) | 33 (35.5) |
| 2 (3–4) | 26 (28.0) |
aMean±standard deviation (median; minimum–maximum).
Among 93 patients who underwent liver biopsy; mild, moderate and severe steatosis was noted in 75.3%, 16.1% and 8.6% of the patients, respectively. Histologic activity index was 0 in 31 (33.3%), 1 in 41 (44.1%) and 2 in 21 (22.6%) patients. Fibrosis stage was 0 in 10 (10.8%), 1 in 33 (35.5%), 2 in 26 (28.2%) and 3 in 24 (25.8%) patients. Correlation between pre-, and post-treatment HOMA scores and metabolic factors are shown in Table 2. HOMA score at week 0 was found to be correlated with levels of triglyceride, GGT and stage of fibrosis (p=0.022, 0.001, and 0.001, respectively). HOMA score at week 48 was found to be correlated with age (p=0.001), waist circumference (p<0.001), levels of GGT (p<0.001), triglyceride (p=0.013), HDL-cholesterol (p=0.042) and stage of fibrosis (p=0.002).
Correlation between HOMA and variables.
| HOMA-IR at week 0 | HOMA-IR at week 48 | |||
|---|---|---|---|---|
| r | p-Value | r | p-Value | |
| Age (years) | 0.164 | 0.096 | 0.314 | 0.001 |
| Body mass index (kg/m2) | 0.084 | 0.397 | 0.113 | 0.254 |
| Waist circumference (cm) | 0.061 | 0.602 | 0.464 | <0.001 |
| AST (IU/L) | 0.149 | 0.132 | 0.192 | 0.050 |
| ALT (IU/L) | 0.095 | 0.336 | 0.123 | 0.215 |
| GGT (IU/L) | 0.224 | 0.022 | 0.369 | <0.001 |
| Total cholesterol (mg/dL) | –0.068 | 0.496 | –0.103 | 0.298 |
| Triglyceride (mg/dL) | 0.320 | 0.001 | 0.243 | 0.013 |
| LDL-cholesterol (mg/dL) | –0.125 | 0.208 | 0.030 | 0.759 |
| HDL-cholesterol (mg/dL) | –0.187 | 0.058 | –0.200 | 0.042 |
| Log10 HCV-RNA | –0.003 | 0.972 | 0.068 | 0.494 |
| Platelet counts (×103/μL) | –0.153 | 0.121 | –0.142 | 0.150 |
| Grade of steatosis | –0.024 | 0.817 | 0.058 | 0.579 |
Significant p-values are marked in bold.
Among a total of 104 patients, 55 were in SVR, and 49 in non-SVR group. HCV-RNA levels of non-SVR group were higher than those of SVR group. No significant relationship was found between SVR and non-SVR groups regarding gender, age, BMI, and levels of total cholesterol, triglyceride, LDL-cholesterol, HDL-cholesterol, fasting plasma glucose, insulin, HOMA score at week 0, platelet counts, arterial hypertension, grades of steatosis and histologic activity index in univariate analyses (Table 3). However, also in univariate analyses, statistically significant associations were noted between the two groups regarding GGT, insulin levels, and presence of IR at week 48, log HCV-RNA levels and stages of fibrosis (p<0.05). In the majority of non-SVR groups, stage 3–4 fibrosis was detected, while fibrosis was absent or low in the majority of cases with SVR (Figure 1). In multivariate analyses; log HCV-RNA, triglyceride levels, and presence of IR at week 48 had influence on SVR (p<0.05) while age, BMI and stage of fibrosis did not.
Comparison of uni- and multivariate analyses in SVR and non-SVR groups (13.7).
| Variable | SVR (n=55) | Non-SVR (n=49) | p-Value | Multivariate analysis, OR (95% CI) | p-Value |
|---|---|---|---|---|---|
| Gender (M/F) | 22/33 | 18/31 | 0.733 | ||
| Age (year) | 50.2±13.2 (53) | 54.2±9.8 (57) | 0.133 | 0.988 (0.943–1.035) | |
| Body mass index (kg/m2) | 27.2±5.2 (26.6) | 28.7±4.3 (28.4) | 0.117 0.277 | 0.951 (0.859–1.051) | 0.325 |
| <25 | 18 | 10 | |||
| 25–29.9 | 24 | 22 | |||
| >30 | 13 | 17 | |||
| Waist circumference (cm) | 94.96±12.1 (96) | 100±12.3 (98.5) | 0.073 | ||
| AST (IU/L) | 52.16±26.66 (46) | 54.80±35.13 (47) | 0.945 | ||
| ALT (IU/L) | 67.75±38.26 (56) | 63.00±49.14 (52) | 0.278 | ||
| GGT (IU/L) | 47.1±42.1 (38) | 76.8±67.42 (60) | 0.003 | ||
| T. Cholesterol (mg/dL) | 161.5±32.1 (162) | 158.7±33.7 (150) | 0.625 | ||
| Triglyceride (mg/dL) | 118.0±63.5 (103) | 100.5±34.8 (95) | 0.275 | 1.012 (1.001–1.023) | 0.039 |
| LDL (mg/dL) | 92.42±30.39 (90) | 92.78±38.60 (87) | 0.958 | ||
| HDL (mg/dL) | 45.58±14.27 (43) | 47.20±15.29 (46) | 0.379 | ||
| Glucose at week 0 (mg/dL) | 94.73±10.74 (96) | 95.82±13.03 (93) | 0.642 | ||
| Insulin at week 0 (IU/L) | 17.9±14.4 (13.6) | 23.4±17.7 (17.9) | 0.062 | ||
| Glucose at week 48 (mg/dL) | 94.3±12.4 (94) | 95.4±13.0 (96) | 0.700 | ||
| Insulin at week 48 (IU/L) | 13.5±17.7 (9.3) | 18.9±14 (13.7) | 0.003 | ||
| HOMA-IR at week 0 | 3.54±2.80 (2.59) | 4.09±2.5 6 (3.43) | 0.906 | ||
| HOMA-IR at week 48 | 3.29±5.12 (2.45) | 4.44±3.49 (3.23) | 0.003 | ||
| IR – at week 0, n (%) | 26 (47.3) | 28 (57.1) | 0.315 | ||
| IR – at week 48, n (%) | 18 (32.7) | 28 (57.1) | 0.012 | 0.281 (0.099–0.796) | 0.017 |
| Platelet counts (×103/μL) | 214.7±72.7 (207) | 201.7±62.7 (197) | 0.333 | ||
| Genotype (1a/1b) | 2/53 | 4/45 | 0.286 | ||
| Lg10 HCV RNA | 5.65±0.99 (5.65) | 5.98±0.64 (6.05) | 0.045 | 0.455 (0.253–0.820) | 0.009 |
| Hypertension (yes/no) | 8/47 | 12/37 | 0.199 | ||
| Metabolic syndrome (yes/no) | 12/43 | 8/41 | 0.478 | ||
| Histologic evaluation | (n=49) | (n=44) | |||
| Steatosis (grade) | 0.266 | ||||
| 1 (5–33%) | 41 | 29 | |||
| 2 (>33–66%) | 6 | 9 | |||
| 3 (>66%) | 3 | 5 | |||
| Histologic activity index | 0.310 | ||||
| 0 (0) | 18 | 13 | |||
| 1 (1–8) | 18 | 23 | |||
| 2 (9–18) | 13 | 8 | |||
| Fibrosis (stage) | 0.038 | 0.366 (0.120–1.116) | 0.077 | ||
| 0 (0) | 8 | 2 | |||
| 1 (1–2) | 21 | 12 | |||
| 2 (3–4) | 9 | 17 | |||
| 3 (5–6) | 11 | 13 |
Significant p-values are marked in bold.
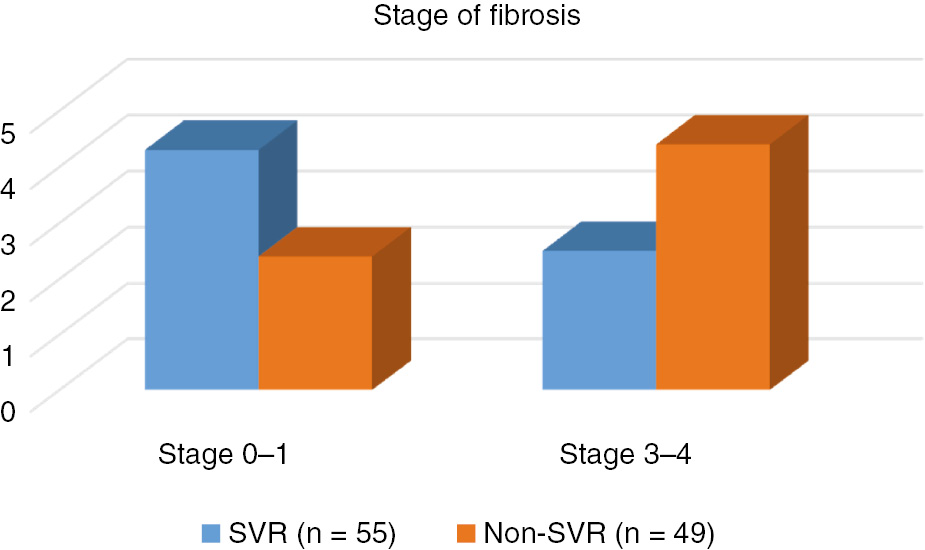
Comparison of fibrosis in SVR and non-SVR groups (p=0.038).
Discussion
IR is prevalently seen in CHC patients [1], [2]. Hepatic inflammation, activated inflammatory cytokines and molecules disrupting insulin and lipid stimulation are the factors that cause IR in CHC patients, while weight gain and lack of exercise in general population [3].
Many studies are conducted on efficacy of HOMA score – a test that assesses beta cell secretion functions and IR by measuring fasting blood glucose and insulin levels easily particularly in wide patient populations – on CHC patients [12], [13], [14]. In the literature, frequency of IR in CHC patients is reported between 29% and 56% with respect to HOMA (scores between 2 and 3) values [1], [14], [15]. We – as many other researchers advocated – agreed on a HOMA score of ≥3 to indicate IR [12], [13], [14], [15], [16], [17]. Similar to literature, we found HOMA score more than 3 in 53.9% of our patients.
Hepatosteatosis, which is frequently seen in patients with CHC, has been reported to be an independent risk factor for the progression of the disease [17]. HCV core protein stimulates lipid peroxidation and production of reactive oxygen radicals. It also regulates secretion of VLDL, triglyceride and apolipoprotein B. So that HCV directly promotes hepatic steatosis. It has been shown in transgenic mice that IR occurred before onset of hepatic steatosis. Besides, it is advocated that hepatosteatosis may stimulate IR [18], [19], [20]. Steatosis of grade II and III was detected in 24.7% of our patients. No difference in grade of steatosis was detected between SVR and non-SVR groups.
It has been shown that IR negatively affects antiviral therapy in genotype I, II and III CHC patients. IR promotes HCV replication by increasing hepatic fat accumulation. HCV replication alter response to antiviral therapy negatively. On the other side, HCV core protein regulates suppressor cytokine signaling (SOCS-3). SOCS-3 causes IR by easing proteosomal degradation of insulin receptor substrates 1 and 2 (IRS-1 and IRS-2). It also deteriorates response to antiviral therapy by inhibiting interferon-alpha expression [20], [21], [22], [23]. SVR could not be achieved in 49 (47.1%) patients. During pretreatment evaluation increased number of patients with high HOMA scores were detected in non-SVR compared to SVR group.
IR is one of important markers that decrease response to therapy [1], [24], [25]. Eslam et al. [19] found that genotype I CHC patients with a HOMA score of less than 2 had higher response rates [OR: 2, 16 95% CI: 1.51–3.08] [19]. In different studies, IR rates were found to change with regard to therapy and to get better as HCV infection resolved [19], [20], [21], [22], [23], [24], [25]. In our study, similar to the literature, approximately 15% of the patients with IR in SVR group had their IR resolved while no change was noted in IR rate in non-SVR group.
Association between IR and progression of fibrosis in CHC patients was also shown [26]. Hepatocytes have crucial role in degradation of insulin. It was noted that – as the fibrosis progresses – insulin clearance diminished which resulted in high insulin levels [25]. On the other side, IR stimulates connective tissue growth factor by influencing hepatic stellate cells. This rise in growth factor production may induce progression of fibrosis by increasing the amount of extracellular matrix [23]. Besides, increase in the concentration of hepatic lipids also promotes progression of fibrosis by increasing free oxygen radicals [17]. In conclusion, it can be inferred that insulin – by numerous ways – accelerates development of fibrosis and as a paradox, fibrosis leads to an increase in insulin levels by inhibiting its degradation. Indeed, 53.8% of our patients had high grade fibrosis. Patients with high grade fibrosis was more numerous in non-SVR group (p=0.038).
Conclusion
IR is one of the factors that negatively affects SVR. IR may resolve as SVR is achieved. Although there is a lot of work related with the effects of IR on SVR, it is not clear which patients can achieve SVR. Presence of IR at week 48 has been found associated with SVR. In this context, it can be advocated that insulin resistance at week 48 may be a predictive factor for prediction of SVR at week 72. Thus, amelioration of IR detected before therapy at week 48 may predict SVR at week 72. Further multicenter studies with greater number of patients are needed to clarify this issue.
Abbreviations: BMI, Body mass index; AST, aspartate aminotransferase; ALT, alanine aminotransferase; GGT, γ-glutamyltranspeptidase; LDL, low-density lipoprotein; HDL, high-density lipoprotein; HOMA-IR, homeostasis model assessment of insulin resistance; metabolic syndrome, ATP III criteria are defined as follows: waist circumference >102 cm and >88 cm for male and female patients, respectively; blood pressure >130/85 mmHg or diagnosis of controlled hypertension under treatment; triglyceride >150 mg/dL; HDL<40 mg/dL and <50 mg/dL for male and female, respectively; fasting plasma glucose>100 mg/dL or diagnosis of controlled diabetes mellitus under treatment.
Conflict of interest statement: The authors declare no conflict of interest.
References
1. Marcellin P. Management of patients with viral hepatitis. Paris, France: APHC.Search in Google Scholar
2. Consensus Conference. Treatment of hepatitis C. Guidelines. Gastroenterol Clin Biol 2002;26:B312–20.Search in Google Scholar
3. Fried MW, Shiffman ML, Reddy KR, Smith C, Marinos G, Gonçales FL Jr, et al. Peginterferon alfa-2a plus ribavirin for chronic hepatitis C virus infection. N Engl J Med 2002;347:975–82.10.1056/NEJMoa020047Search in Google Scholar
4. Cornberg M, Manns MP, Wedemeyer H. Hepatitis C, standard of care. In: Mauss S, Berg T, Rockstroh J, Sarrazin C, Wedemeyer H, editors. Hepatology, a clinical textbook. Germany: Flying Publisher, 2009, pp. 183–98.Search in Google Scholar
5. Grace MJ, Bordens RW, Cutler DL. Peginterferons for the treatment of chronic hepatitis C. Hepatol Rev 2005;2:3–9.10.1517/17425247.2.2.219Search in Google Scholar
6. Aspinall RJ, Pockros PJ. Review article: the management of side effects during therapy for hepatitis C. Aliment Pharmacol Ther 2004;20:917–29.10.1111/j.1365-2036.2004.02192.xSearch in Google Scholar
7. Thomas DL, Lemon SM. Hepatitis C. In: Mandell GL, Bennett JE, Dolin R, editors. Principles and practice of infectious diseases, 6th ed. Philadelphia: Churchill Livingstone, 2005, pp. 1950–81.10.1016/S1089-3261(05)70203-8Search in Google Scholar
8. Cãruntu FA, Benea L. Acute hepatitis C virus infection: diagnosis, pathogenesis, treatment. J Gastrointestin Liver Dis 2006;15:249–56.Search in Google Scholar
9. Chevaliez S, Pawlotsky JM. Hepatitis C virus: virology, diagnosis and management of antiviral therapy. World J Gastroenterol 2007;13:2461–6.10.3748/wjg.v13.i17.2461Search in Google Scholar PubMed PubMed Central
10. Butt AA, Umbleja T, Andersen JW, Sherman KE, Chung RT; ACTG A5178 Study Team. Impact of peginterferon alpha and ribavirin treatment on lipid profiles and insulin resistance in hepatitis C virus/HIV-coinfected persons: the AIDS Clinical Trials Group A5178 Study. Clin Infect Dis 2012;55:631–8.10.1093/cid/cis463Search in Google Scholar PubMed PubMed Central
11. Chien CH, Lin CL, Hu CC, Chang JJ, Chien RN. Clearance of hepatitis C virus improves insulin resistance during and after peginterferon and ribavirin therapy. J Interferon Cytokine Res 2015;35:981–9.10.1089/jir.2014.0200Search in Google Scholar PubMed
12. Ozaras R, Tahan V. Acute hepatitis C: prevention and treatment. Expert Rev Anti-infect Therap 2009;7:351–61.10.1586/eri.09.8Search in Google Scholar PubMed
13. Velt BJ, Heathcote EJ, Wedemeyer H, Reichen J, Hofmann WP, Zeuzem S, et al. Sustained virologic response and clinical outcomes in patients with chronic hepatitis C and advanced fibrosis. Ann Intern Med 2007;147:677–84.10.7326/0003-4819-147-10-200711200-00003Search in Google Scholar PubMed
14. Ghany MG, Nelson DR, Strader DB, Thomas DL, Seeff LB. An update on treatment of genotype 1 chronic hepatitis C virus infection: 2011 practice guideline by the American Association for the Study of Liver Diseases. Hepatology 2011;54:1433–44.10.1002/hep.24641Search in Google Scholar PubMed PubMed Central
15. Foster GR, Hezode C, Bronowicki JP, Carosi G, Weiland O, Verlinden L, et al. Telaprevir alone or with peginterferon and ribavirin reduces HCV RNA in patients with chronic genotype 2 but not genotype 3 infections. Gastroenterology 2011;141:881–9.10.1053/j.gastro.2011.05.046Search in Google Scholar PubMed
16. Lasser L, Langlet P. What is the optimal duration of therapy in patients with hepatitis C genotype 2 or 3 infection? A review. Acta Gastro-enterol Belg 2008;71:298–302.Search in Google Scholar
17. Deltenre P, Louvet A, Lemoine M, Mourad A, Fartoux L, Moreno C, et al. Impact of insulin resistance on sustained response in HCV patients treated with pegylated interferon and ribavirin: a meta-analysis. J Hepatol 2011;55:1187–94.10.1016/j.jhep.2011.03.010Search in Google Scholar PubMed
18. Yu ML, Dai CY, Huang JF, Chiu CF, Yang YH, Hou NJ, et al. Rapid virological response and treatment duration for chronic hepatitis C genotype 1 patients: a randomized trial. Hepatology 2008;47:1884–93.10.1002/hep.22319Search in Google Scholar PubMed
19. Eslam M, Aparcero R, Kawaguchi T, Del Campo JA, Sata M, Khattab MA, et al. Meta-analysis: insulin resistance and sustained virological response in hepatitis C. Aliment Pharmacol Ther 2011;34:297–305.10.1111/j.1365-2036.2011.04716.xSearch in Google Scholar PubMed
20. Delgado-Borrego A, Jordan SH, Negre B, Healey D, Lin W, Kamegaya Y, et al. Reduction of insulin resistance with effective clearance of hepatitis C infection: results from the HALT-C trial. Clin Gastroenterol Hepatol 2010;8:458–62.10.1016/j.cgh.2010.01.022Search in Google Scholar PubMed PubMed Central
21. Eslam M, Aparcero R, Mousa YI, Grande L, Shaker Y, Ali A, et al. Insulin resistance impairs viral dynamics independently of ethnicity or genotypes. J Clin Gastroenterol 2012;46:228–34.10.1097/MCG.0b013e31822a2dc6Search in Google Scholar PubMed
22. Conjeevaram HS, Wahed AS, Afdhal N, Howell CD, Everhart JE, Hoofnagle JH, et al. Changes in insulin sensitivity and body weight during and after peginterferon and ribavirin therapy for hepatitis C. Gastroenterology 2011;140:469–77.10.1053/j.gastro.2010.11.002Search in Google Scholar PubMed
23. Desbois AC, Cacoub P. Diabetes mellitus, insulin resistance and hepatitis C virus infection: a contemporary review. World J Gastroenterol 2017;23:1697–711.10.3748/wjg.v23.i9.1697Search in Google Scholar PubMed PubMed Central
24. Gitto S, Cicero AF, Loggi E, Giovannini M, Conti F, Grandini E, et al. Worsening of serum lipid profile after direct acting antiviral treatment. Ann Hepatol 2018;17:64–75.10.5604/01.3001.0010.7536Search in Google Scholar PubMed
25. Conteduca V, Sansonno D, Russi S, Pavone F, Dammacco F. Therapy of chronic hepatitis C virus infection in the era of direct-acting and host-targeting antiviral agents. J Infect 2014;68:1–20.10.1016/j.jinf.2013.08.019Search in Google Scholar PubMed
26. Zhu Y, Chen S. Antiviral treatment of hepatitis C virus infection and factors affecting efficacy. World J Gastroenterol 2013;19:8963–73.10.3748/wjg.v19.i47.8963Search in Google Scholar PubMed PubMed Central
©2019 Walter de Gruyter GmbH, Berlin/Boston
Articles in the same Issue
- Frontmatter
- Review Article
- Measurement uncertainty in laboratory medicine: the bridge between medical and industrial metrology
- Short Communication
- Investigation of beta globin gene mutations in Syrian refugee patients with thalassemia major
- Research Articles
- A practical ID-LC-MS/MS method for the most commonly analyzed steroid hormones in clinical laboratories
- Distribution of drug-metabolizing enzymes coding genes CYP2D6, CYP3A4, CYP3A5 alleles in a group of healthy Turkish population
- Molecular detection of Bacillus anthracis: evaluation of the efficiency of DNA extraction and a novel dry PCR
- Serum and cord blood-methylated arginine levels in gestational diabetic subjects
- Association of oxidative stress marker ischemia modified albumin and polycystic ovary syndrome in adolescent and young girls
- Influence of pegylated interferon and ribavirin on insulin resistance and metabolic factors in chronic hepatitis C
- Importance of biochemical parameters in order to predict clinical severity in patients diagnosed with Crimean-Congo haemorrhagic fever
- Evaluation of plasma VEGF and sVEGFR-1 levels in patients with diabetes mellitus receiving insulin treatment
- The effect of Ramadan fasting on renal functions in patients with chronic kidney disease
- Effect of food azo-dye tartrazine on physiological functions of pancreas and glucose homeostasis
- Ameliorating oxidative stress and inflammation by Hesperidin and vitamin E in doxorubicin induced cardiomyopathy
- Alteration in cholinesterases, γ-aminobutyric acid and serotonin level with respect to thiamine deficiency in Swiss mice
- Case Report
- Discordant troponin I value in a young woman: a case report with review of literature
- Letter to the editor
- Vitamin D test results in a public hospital in mid-January