Associations between anthropometric outcomes and fat percentage with physical performance in professional soccer players: a cutoff points approach
-
Pedro Schons

 ,
Artur Avelino Birk Preissler
,
Rafael Grazioli
,
Júlio B. Mello
,
Guilherme Droescher de Vargas
,
Lucas Moraes Klein
,
Alexandra Ferreira Vieira
and
Eduardo L. Cadore
,
Artur Avelino Birk Preissler
,
Rafael Grazioli
,
Júlio B. Mello
,
Guilherme Droescher de Vargas
,
Lucas Moraes Klein
,
Alexandra Ferreira Vieira
and
Eduardo L. Cadore

Abstract
With a plethora of anthropometric and body composition measurements, may be challenging for soccer technical staff determining the most suitable protocol for their players.
Objectives
Therefore, the aim of the study was to analyze the correlations of anthropometric measures and fat percentage obtained by different protocols with the physical performance of male professional soccer players. Additionally, the study aimed to propose cutoff points for anthropometric measures and fat percentage.
Methods
Fifty-two male soccer players (24.60 ± 4.98 years) from a state championship’s second division participated. The sum of skinfolds and fat percentage were obtained using four reference protocols (Pollock seven-skinfolds, Jackson and Pollock three-skinfolds, Jackson and Pollock three-skinfolds of the upper limbs, and Faulkner four-skinfolds). Physical performance was assessed by squat jump, counter movement jump, 30 cm drop jump, 20 m sprint, and YoYo intermittent recovery level 1 (YoYoIRL1) tests. Pearson, Spearman, and ROC curve analysis were used considering α<0.05 as significance level.
Results
Significant correlations occurred between the abdominal skinfold (r=−0.579), chest, abdominal, and front thigh skinfolds sum (rho=−0.518), and the Jackson and Pollock fat percentage protocol using these skinfolds (r=−0.534) with the YoYoIRL1 (all p<0.001). Cutoff points for these measurements were determined to be 20 mm (area under the curve (AUC)=0.800, sensitivity=92.7 %, specificity=63.6 %), 33 mm (AUC=0.783, sensitivity=68.3 %, specificity=81.8 %), and 13 % (AUC=0.787, sensitivity=95.1 %, specificity=54.5 %), respectively.
Conclusions
Therefore, the soccer technical staff can implement these measures, largely associated with physical performance, in players with characteristics similar to the evaluated group. The proposed cut-off points provide a practical alternative for integration into other monitoring strategies.
Introduction
Soccer requires players to excel in physical, technical, tactical, and psychological aspects [1]. Physical training has prioritized improving anaerobic fitness to adapt to the increasing prevalence of high-intensity actions in a sport that also requires aerobic actions [2]. Additionally, anthropometric and body composition measurements may correlate with the anaerobic and aerobic performance of soccer players [3], [4], [5], [6], [7]. Therefore, these measures are often monitored to enhance or maintain optimal values for professional soccer players.
Body mass and skinfolds assessment are anthropometric methods used to evaluate the body composition, as skinfold values have been utilized to estimate the percentage of body fat [8]. Various calculations are used to estimate body fat percentage in men’s soccer routines [9], including Pollock protocol with seven skinfolds, variations of the Jackson and Pollock protocol with three skinfolds [10], and the Faulkner protocol with four skinfolds [11], which are widely utilized by Brazilian soccer teams as well as by sports scientists [12]. The body fat percentages assessed by these protocols showed correlations ranging from r=0.82 to 0.88 with the body fat percentage measured by Dual-Energy X-ray Absorptiometry (DXA) in soccer players [13], 14]. These protocols vary in the number and location of skinfold sites and in their equations, which can produce different fat percentage values for the same athlete and, consequently, different associations with performance. With a plethora of existing approaches [9], it may be challenging for soccer technical staff determining the most suitable protocol for their players. In line with this, a practical protocol is needed considering the chaotic schedule typically seen in the soccer scenario, which limits the logistics of applying a set of assessments that require a significant amount of time.
Studies have observed associations among anthropometric measurements and fat percentage with soccer players physical performance, but there is no consensus on its associations [3], [4], [5], [6], [7]. Excess fat mass increases the energy cost of movement and may reduce relative strength and power, potentially impairing both aerobic and anaerobic performance [15]. The decrease in relative strength and power adds to other factors that also influence performance, such as playing position, training history, and nutrition. To the best of our knowledge, there is a lack of research examining the correlations between different protocols for summing skinfolds, fat percentage calculations, and the physical performance in professional male soccer players. This analysis could assist soccer technical staff in selecting anthropometric measurement and fat percentage protocols that are most strongly associated with physical performance. In addition, if strong correlations are identified, it will also be possible to suggest cut-off points for anthropometric measurements and fat percentage protocols. These measurements can support decision-making during periods when fitness testing is not feasible, while respecting that they may differ across teams, leagues, and countries.
Due to the above-mentioned gaps on this topic and considering the potential practical application, this study aimed to analyze the correlations of anthropometric measures and fat percentage obtained by different protocols with the physical performance of male professional soccer players. Additionally, this study also aimed to propose cutoff points for anthropometric measures and fat percentage. Based on previous studies [3], [4], [5], [6], [7], it was hypothesized that anthropometric measurements and the fat percentage obtained by the different protocols would be correlated with the physical performance of professional soccer players. The summary of this article is presented in Figure 1.

Graphical representation of this study. Key points: (1) this study bridges applied sports science and practice by identifying anthropometric and fat percentage measures most strongly associated with professional soccer players’ physical performance, focusing on mechanisms related to aerobic capacity and body composition. (2) Fifty-two male professional soccer players were assessed for body composition (skinfolds and fat percentage) and performance (jumps, sprint, and YoYo IRL1), with cutoff points derived through receiver operating characteristic (ROC) analysis. (3) Abdominal skinfold (20 mm), sum of chest-abdomen-thigh skinfolds (33 mm), and fat percentage (13 %) (Jackson & Pollock three-skinfold protocol) emerged as practical thresholds with translational application for fitness monitoring and decision-making in professional soccer. Figure created with BioRender.
Materials and methods
Participants
A total of 52 male soccer players (24.60 ± 4.98 years) participated in this study, including 15 forwards, 10 full-backs, 16 midfielders, and 11 central defenders. All players competed in state championship’s second division. The sample size was determined using G*Power 3.1 (Heinrich Heine, Düsseldorf, Germany). The statistical test selected for the sample size estimation was the correlation: bivariate normal model (two-tailed), considering 80 % power and a correlation coefficient (r=−0.38) between the sum of eight skinfolds and the distance covered on the YoYo intermittent recovery level 1 (IRL1) among male soccer players in a Brazilian state competition [7]. This calculation indicated the requirement for 52 players. Male soccer players from three Brazilian teams, all based in the state of Rio Grande do Sul, competing in the same regional professional competition, were included. The players were in the initial phase of the tournament’s pre-season preparation. Teams engage in regular training sessions, occurring five to six days per week, with an average duration of 1 h and 10 min per session. The team’s medical clearance determined eligibility. The goalkeepers were excluded from the analysis. Participants were informed of the risks and benefits of the assessment prior to data collection. Participants provided their written consent. The study (No. 2.903.811) received approval from the ethics committee of Federal University of Rio Grande do Sul and adhered to the ethical guidelines of the Declaration of Helsinki by the World Medical Association, as published in the British Medical Journal on July 18, 1964.
Procedures
Initially, players were invited to participate, and the study’s objectives and methodology were explained. Subsequently, participants signed a free and informed consent form. The technical committee was instructed to avoid high-load training sessions before the tests. Additionally, players were advised to maintain their regular dietary habits. Age, body mass, stature, and skinfold measurements were taken to analyze the players’ anthropometric profile and fat percentage. Following these measures, players completed 5 min of dynamic stretching and 5 min of exercises simulating vertical jumps. After the squat jump (SJ), countermovement jump (CMJ), and 30 cm drop jump (DJ), players moved to the soccer field for another 5-min specific warm-up for the sprint test. Finally, players performed the 20 m sprint test and the YoYo IRL1 tests.
Anthropometric profile and fat percentage
Initially, players reported their age and stood barefoot on a scale (G-TECH – Accumed Produtos Médico Hospitalares Ltda, Duque de Caxias, Brazil) with a resolution of 100 g to measure body mass. To measure stature, players assumed an orthostatic position against a wall with a vertically fixed measuring tape with a resolution of 1 cm. Skinfold measurements (triceps, biceps, chest, subscapular, middle axillary, supraspinale, abdominal, front thigh, and medial calf) were taken on the right side of the body using a body fat plicometer (CESCORF, Porto Alegre, Brazil) with a resolution of 0.1 mm. Measurements were conducted twice, and the average was recorded by the same experienced evaluator for subsequent data processing. All measurements were performed using ISAK (International Society for the Advancement of Kinanthropometry) standardized procedures.
The data were processed using an Excel spreadsheet (MICROSOFT CORPORATION – Washington, USA) created by the researchers. The sum of the skinfolds was calculated by adding the measurements obtained from the nine skinfold sites. Moreover, four additional sums of skinfolds were calculated. The sum of four skinfolds corresponding to the Faulkner protocol (triceps, subscapular, supraspinale, and abdominal) [11]; the sum of seven skinfolds corresponding to the Pollock protocol (chest, middle axillary, triceps, subscapular, abdominal, supraspinale, and front thigh) [16]; the sum of three skinfolds corresponding to the Jackson and Pollock protocol (chest, abdominal, and front thigh) [16]; and the sum of three skinfolds corresponding to the Jackson and Pollock protocol (chest, triceps, and subscapular) [16]. The Faulkner protocol [11] was employed to calculate the percentage of fat, while others were used to determine body density [16]. Subsequently, the obtained body density values were utilized to calculate the percentage of fat using the Siri equation [17]. The protocols used are detailed in the Supplementary Material.
Vertical jumps
Players were instructed to perform three attempts for each type of jump assessed. There was a 30-s interval between attempts, with a 2-min break between different types of jumps. A contact mat was used for evaluation (JUMP SYSTEM, CEFISE, Nova Odessa, Brazil). For the SJ assessment, players began from an upright position with hips and knees flexed approximately 90°, and hands remained on hips. Upon command, players swiftly extended their hip and knee to perform the jump without using countermovement [18], 19]. For CMJ, players started from an upright position with hands on their waist. Upon command, players swiftly flexed their hip and knee (approximately 90°), followed by a ballistic extension of these joints for jumping [18], 19]. For the DJ assessment, players began from an upright position with hands-on waist and atop a 30 cm box. Then, players jumped from the box, and upon touching the contact mat with their feet, swiftly flexed their hips and knees, followed by the extension of these joints to perform the jump [20]. Players were encouraged to jump as high as possible with minimal contact time.
Jump heights were calculated using the Jump System 1.0 software (JUMP SYSTEM, CEFISE, Nova Odessa, Brazil). The calculation used was h=g × t2/8, where “h” is the height, “g” is the value of the acceleration due to gravity, and “t” is the flight time. The highest height attained in each jump was used for analysis. The data from the current study yielded intraclass correlation coefficients and Cronbach’s α coefficients for SJ (0.970; 0.988), CMJ (0.975; 0.988), and DJ (0.956; 0.982).
20 m sprint
The 20 m sprint test measured the players’ speed. Timing was done using a photocell system placed at both the start and end of the route, with a 1 ms resolution (CEFISE, São Paulo, Brazil). The photocells were positioned at a height of 100 cm from the ground. Players completed two attempts with a 3-min interval between them. They commenced from a position 30 cm away from the first photocell while standing up with the leg preferably in front. They sprinted at maximum intensity until passing the last photocell, allowing the timing system to capture the time taken to cover 20 m [21], [22], [23]. An audible signal marked the start of the test. Players were directed to continue running beyond the last photocell to a cone positioned 5 m away. This instruction ensured the maintenance of their speed until the completion of the test. For data analysis, the shortest time in seconds from the two attempts was utilized. The average speed on the course was calculated by dividing the distance covered in the test by the running time and then converting it to kilometers per hour. The data from the current study resulted in intraclass correlation coefficients and Cronbach’s α coefficients of 0.906 and 0.948, respectively.
YoYo IRL1
Players performed a 20 m run, initiated by an audible signal from a stereo sound system. After covering 40 m, players engaged in 10 s of active recovery by walking. Cones were used to mark the beginning and end of both the 20 and 5 m active recovery lanes. The interval between audible signals decreased progressively during the test, prompting players to increase their running speed. Participation in the test concluded for players if they were unable to sustain the intensity and/or experienced two consecutive failures to reach the designated line in synchronization with the audio beep [24]. The total distance covered by the players was recorded for the evaluation of performance.
Statistical analysis
Intraclass correlation coefficients 2.k and Cronbach’s alpha reliability coefficients were utilized to evaluate the intertrial reliability of physical performance tests among players. Descriptive analysis included variables such as mean, 95 % confidence interval of the mean, standard deviation, and coefficient of variation. Normality was assessed using the Shapiro-Wilk test. Pearson’s product-moment correlation test was employed for normally distributed data, while Spearman’s correlation coefficient test was utilized for non-normally distributed data. Correlation values were categorized as trivial (0), small (0.1–0.3), moderate (0.3–0.5), large (0.5–0.7), very large (0.7–0.9), nearly perfect (0.9–1), and perfect (1.0) [25]. The 95 % confidence interval of the correlation was reported. Statistical significance was defined as α<0.05. Data analysis was conducted using SPSS program (version 22.0; IBM Corp., Armonk, NY, USA).
To establish cutoff points, anthropometric variables with a correlation exceeding 0.50 with physical performance were selected. The area under the receiver operating characteristic (ROC) curves was computed for abdominal skinfold, sum of three skinfolds (chest, abdominal, and front thigh), and fat percentage [utilizing the Jackson and Pollock protocol (chest, abdominal, and front thigh)] as continuous variables (one by one), with the distance in the YoYo IRL1 test classified by 20-percentile as the outcome. Analyses aimed to ensure that the lower limit of the 95 % confidence interval of the area under the ROC curve was not below 0.50. Additionally, values of the area under the ROC curve surpassing 70 % (0.700) were deemed acceptable. Cutoff points were determined based on the optimal balance between sensitivity and specificity, where the highest sum of sensitivity and specificity was identified.
Results
Descriptive data regarding anthropometric measurements, fat percentage, and physical performance of 52 professional soccer players are presented in Table 1.
Descriptive data on anthropometric measurements, percentage of fat, and physical performance of 52 professional soccer players.
| Mean | SD | 95 % CI | CV, % | |||
|---|---|---|---|---|---|---|
| Lower | Upper | |||||
| Age, years | 24.60 | ± | 4.98 | 23.24 | 25.95 | 20 |
| Stature, cm | 179.02 | ± | 6.85 | 177.16 | 180.88 | 4 |
| Body mass, kg | 76.86 | ± | 9.34 | 74.32 | 79.40 | 12 |
| Triceps, mm | 7.25 | ± | 2.49 | 6.57 | 7.93 | 34 |
| Biceps, mm | 4.75 | ± | 1.56 | 4.33 | 5.17 | 33 |
| Chest, mm | 6.98 | ± | 2.35 | 6.34 | 7.62 | 34 |
| Subscapular, mm | 10.02 | ± | 2.18 | 9.43 | 10.61 | 22 |
| Middle axillary, mm | 7.91 | ± | 2.84 | 7.14 | 8.69 | 36 |
| Supraspinale, mm | 8.37 | ± | 3.46 | 7.43 | 9.31 | 41 |
| Abdominal, mm | 14.56 | ± | 5.48 | 13.07 | 16.05 | 38 |
| Front thigh, mm | 11.06 | ± | 4.33 | 9.88 | 12.23 | 39 |
| Medial calf, mm | 6.72 | ± | 2.31 | 6.09 | 7.35 | 34 |
| S9SKF, mm | 77.62 | ± | 22.61 | 71.47 | 83.76 | 29 |
| S4SKF, mm | 40.19 | ± | 11.80 | 36.99 | 43.40 | 29 |
| S7SKF, mm | 66.14 | ± | 19.78 | 60.77 | 71.52 | 30 |
| S3SKFa, mm | 32.60 | ± | 10.94 | 29.62 | 35.57 | 34 |
| S3SKFb, mm | 24.25 | ± | 5.74 | 22.69 | 25.81 | 24 |
| Fat – Faulkner – 4SKF, % | 11.93 | ± | 1.81 | 11.44 | 12.42 | 15 |
| Fat – Pollock – 7SKF, % | 8.88 | ± | 3.20 | 8.01 | 9.75 | 36 |
| Fat – Jackson and Pollock – 3SKFa, % | 9.21 | ± | 3.50 | 8.26 | 10.16 | 38 |
| Fat – Jackson and Pollock – 3SKFb, % | 9.16 | ± | 2.68 | 8.44 | 9.89 | 29 |
| SJ, cm | 37.17 | ± | 4.56 | 35.93 | 38.41 | 12 |
| CMJ, cm | 39.46 | ± | 4.59 | 38.21 | 40.71 | 12 |
| 30 cm DJ, cm | 38.88 | ± | 4.64 | 37.62 | 40.14 | 12 |
| 20 m sprint, km/h | 23.97 | ± | 0.91 | 23.72 | 24.22 | 4 |
| YoYo IRL1, m | 1,987.69 | ± | 625.81 | 1,817.60 | 2,157.79 | 32 |
-
CI, confidence interval mean; SD, standard deviation; CV, coefficient of variation; S9SKF, sum of nine skinfolds; S4SKF, sum of four skinfolds (triceps, subscapular, supraspinale, and abdominal); S7SKF, sum of seven skinfolds (chest, middle axillary, triceps, subscapular, abdominal, supraspinale, and front thigh); S3SKFa, sum of three skinfolds (chest, abdominal, and front thigh); S3SKFb, sum of three skinfolds (chest, triceps, and subscapular); SJ, squat jump; CMJ, counter movement jump; DJ, drop jump; IRL1, intermittent recovery level 1.
A heatmap illustrating the correlations between anthropometric measurements, percentage of fat, and the physical performance of 52 professional soccer players is presented in Table 2. All p values and 95 % confidence intervals of the correlations can be found in the supplementary material (link to supplementary material). Body mass exhibited a significant correlation only with distance in the YoYo IRL1 test (r=−0.339, moderate; p=0.014; 95 % CI=−0.560, −0.073).
Heatmap of the correlations of anthropometric measurements and percentage of fat with the physical performance of 52 professional soccer players. Colors closer to white represent values closer to 0 and colors closer to red represent values closer to −1 of the Pearson or Spearman correlation coefficients.
| SJ, cm | CMJ, cm | 30 cm DJ, cm | 20 m sprint, km/h | YoYo IRL1, m | |
|---|---|---|---|---|---|
| Body mass, kg | 0.024 | −0.020 | −0.059 | −0.126 | −0.339* |
| Triceps, mm | −0.300* | −0.365* | −0.347* | −0.169 | −0.267 |
| Biceps, mm | −0.225 | −0.210 | −0.303* | −0.260 | −0.180 |
| Chest, mm | −0.038 | −0.171 | −0.199 | −0.137 | −0.438* |
| Subscapular, mm | −0.104 | −0.173 | −0.221 | −0.190 | −0.348* |
| Middle axillary, mm | −0.118 | −0.266 | −0.250 | −0.187 | −0.386* |
| Supraspinale, mm | −0.100 | −0.213 | −0.190 | −0.163 | −0.362* |
| Abdominal, mm | −0.174 | −0.218 | −0.297* | −0.230 | −0.579* |
| Front thigh, mm | −0.155 | −0.262 | −0.247 | −0.192 | −0.352* |
| Medial calf, mm | −0.096 | −0.250 | −0.283* | −0.016 | −0.147 |
| S9SKF, mm | −0.165 | −0.287* | −0.290* | −0.230 | −0.435* |
| S4SKF, mm | −0.176 | −0.273 | −0.265 | −0.227 | −0.471* |
| S7SKF, mm | −0.159 | −0.282* | −0.280* | −0.232 | −0.468* |
| S3SKFa, mm | −0.125 | −0.248 | −0.245 | −0.209 | −0.518* |
| S3SKFb, mm | −0.182 | −0.275* | −0.302* | −0.225 | −0.419* |
| Fat – Faulkner – 4SKF, % | −0.176 | −0.273 | −0.265 | −0.227 | −0.471* |
| Fat – Pollock – 7SKF, % | −0.237 | −0.316* | −0.388* | −0.283* | −0.475* |
| Fat – Jackson and Pollock – 3SKFa, % | −0.205 | −0.294* | −0.359* | −0.265 | −0.534* |
| Fat – Jackson and Pollock – 3SKFb, % | −0.272 | −0.327* | −0.422* | −0.268 | −0.401* |
-
*, significant correlation (p<0.05); S9SKF, sum of nine skinfolds; S4SKF, sum of four skinfolds (triceps, subscapular, supraspinale, and abdominal); S7SKF, sum of seven skinfolds (chest, middle axillary, triceps, subscapular, abdominal, supraspinale, and front thigh); S3SKFa, sum of three skinfolds (chest, abdominal, and front thigh); S3SKFb, sum of three skinfolds (chest, triceps, and subscapular); SJ, squat jump; CMJ, counter movement jump; DJ, drop jump; IRL1, intermittent recovery level 1.
The weakest significant correlations of physical performance with skinfolds, the sum of skinfolds, and fat percentage were observed for the following pairs: medial calf skinfold and DJ height (rho=−0.283, small; p=0.042; 95 % CI=−0.516, −0.011), sum of the three skinfolds (chest, triceps, and subscapular) and CMJ height (rho=−0.275, small; p=0.048; 95 % CI=−0.510, −0.002), and fat percentage obtained using the Pollock protocol that utilizes seven skinfolds (chest, middle axillary, triceps, subscapularis, abdominal, supraspinale, and front thigh) and speed in the 20 m sprint (r=−0.283, small; p=0.042; 95 % CI=−0.516, −0.011), respectively.
The strongest significant correlations of physical performance with skinfolds, the sum of skinfolds, and fat percentage were observed for the following pairs: abdominal skinfold and distance in the YoYo IRL1 test (r=−0.579, large; p<0.001; 95 % CI=−0.736, −0.364), sum of the three skinfolds (chest, abdominal, and front thigh) and the distance in the YoYo IRL1 test (rho=−0.518, large; p<0.001; 95 % CI=−0.693, −0.286), and fat percentage obtained using the Jackson and Pollock protocol that utilizes three skinfolds (chest, abdominal, and front thigh) and distance in the YoYo IRL1 (r=−0.534, large; p<0.001; 95 % CI=−0.704, −0.305), respectively.
Correlations between abdominal skinfold, sum of nine skinfolds, and percentage of fat obtained using different protocols with the distance in the YoYo IRL1 test of 52 professional soccer players are depicted in Figure 2.
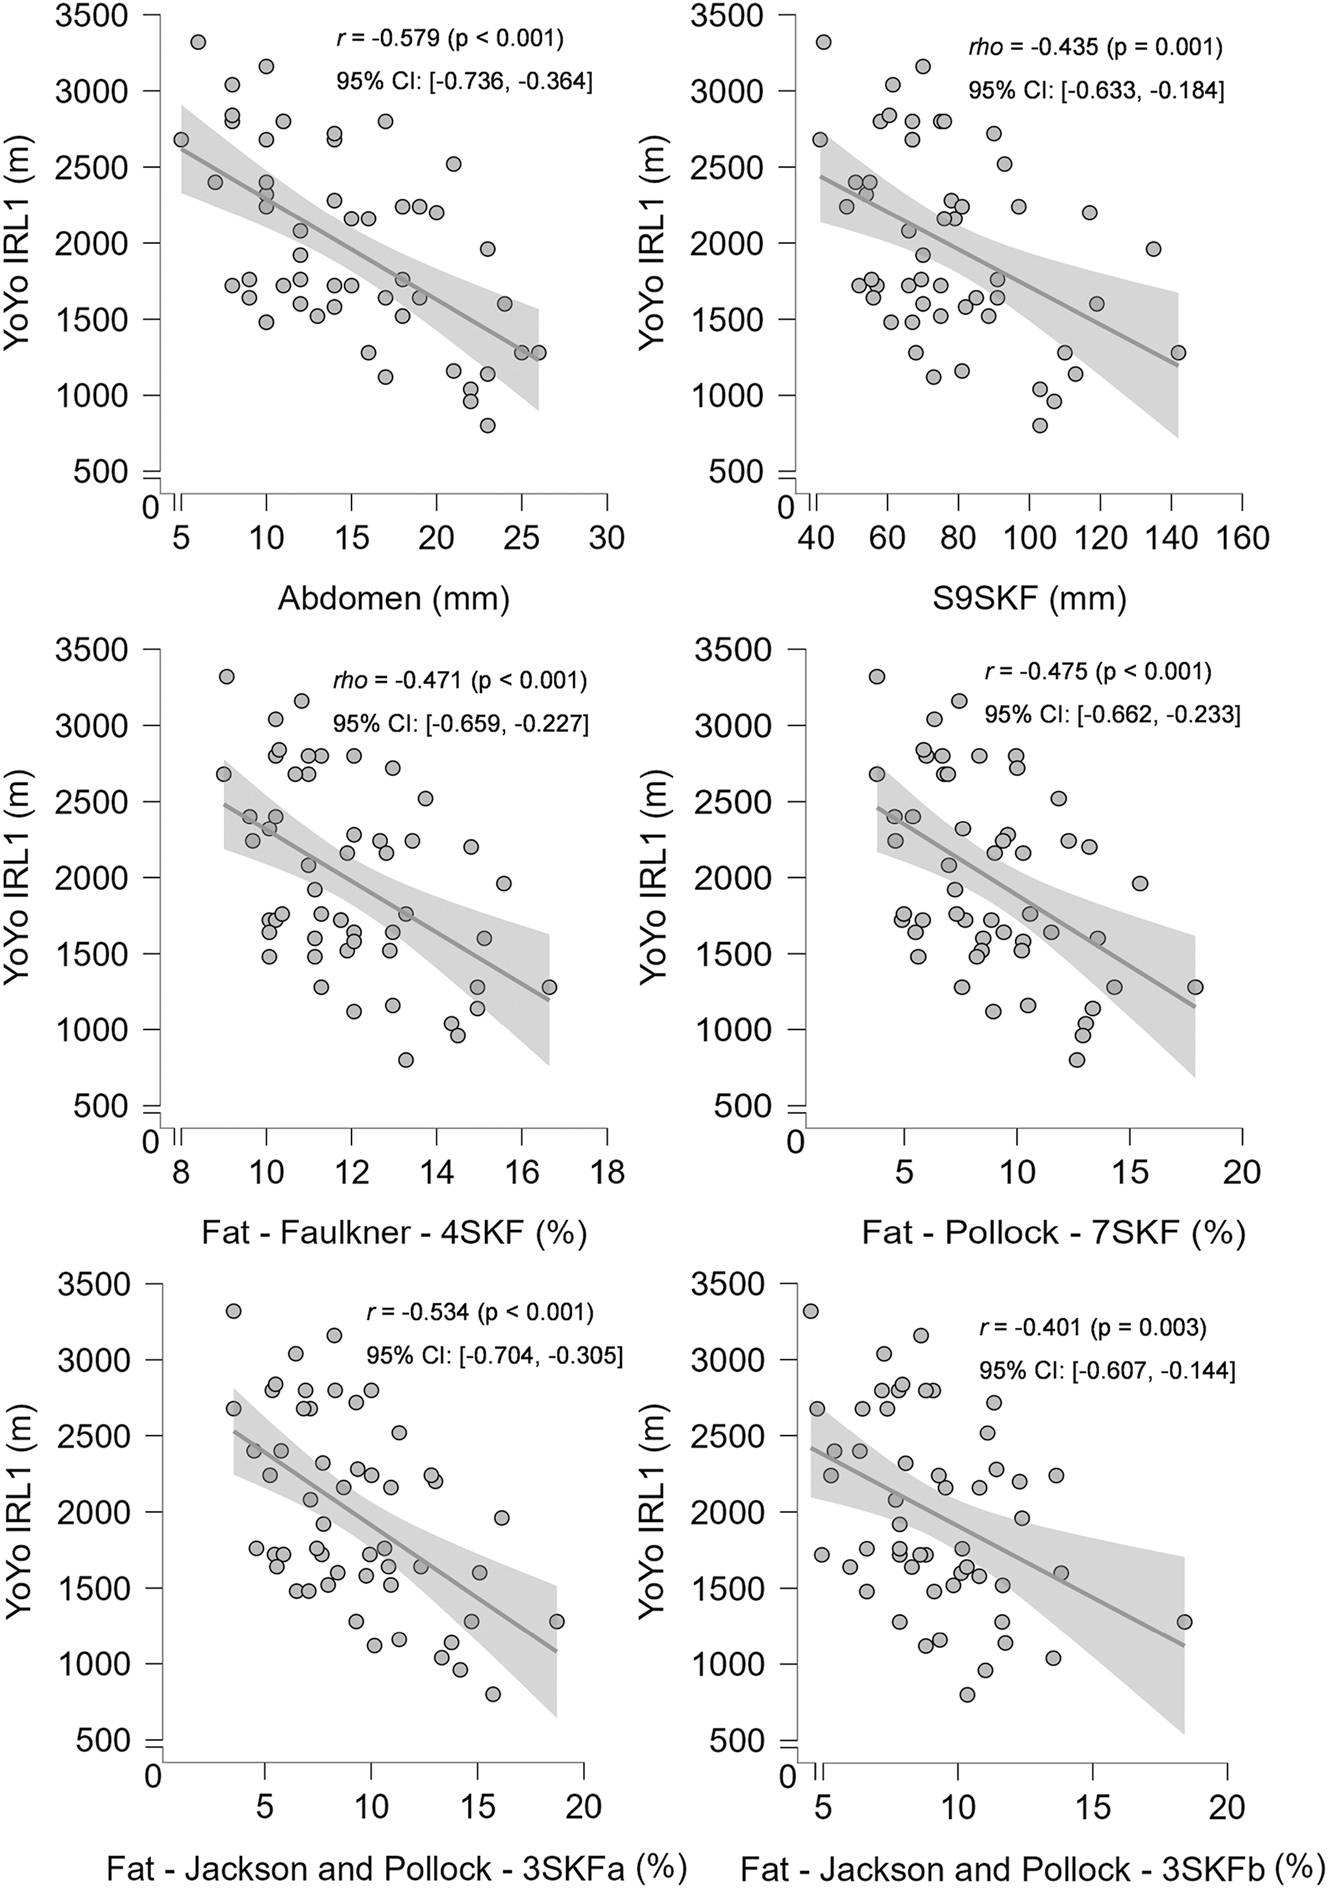
Significant correlations of abdominal skinfold, sum of nine skinfolds, and percentage of fat obtained by different formulas with the distance in the YoYo IRL1 of 52 professional soccer players. r, Pearson correlation coefficient; rho, Spearman correlation coefficient; p, significance level; IC, 95 % confidence interval; 9SKF, nine skinfolds; 4SKF, four skinfolds (triceps, subscapular, supraspinale, and abdominal); 7SKF, seven skinfolds (chest, middle axillary, triceps, subscapular, abdominal, supraspinale, and front thigh); 3SKFa, three skinfolds (chest, abdominal, and front thigh); 3SKFb, three skinfolds (chest, triceps, and subscapular); IRL1, intermittent recovery level 1.
Finally, the ROC curve analysis presented in Figure 3 revealed cutoff points based on strong correlations between specific anthropometric measures and fat percentage with performance on the YoYo IRL1 test: 20 mm for abdominal skinfold (area under the curve (AUC)=0.800, sensitivity=92.7 %, specificity=63.6 %), 33 mm for the sum of three skinfolds (chest, abdominal, and front thigh) (AUC=0.783, sensitivity=68.3 %, specificity=81.8 %), and 13 % for fat percentage obtained using the Jackson and Pollock protocol that utilizes three skinfolds (chest, abdominal, and front thigh) (AUC=0.787, sensitivity=95.1 %, specificity=54.5 %). Consequently, players with equal or greater values may experience declines in performance on the YoYo IRL1 test.
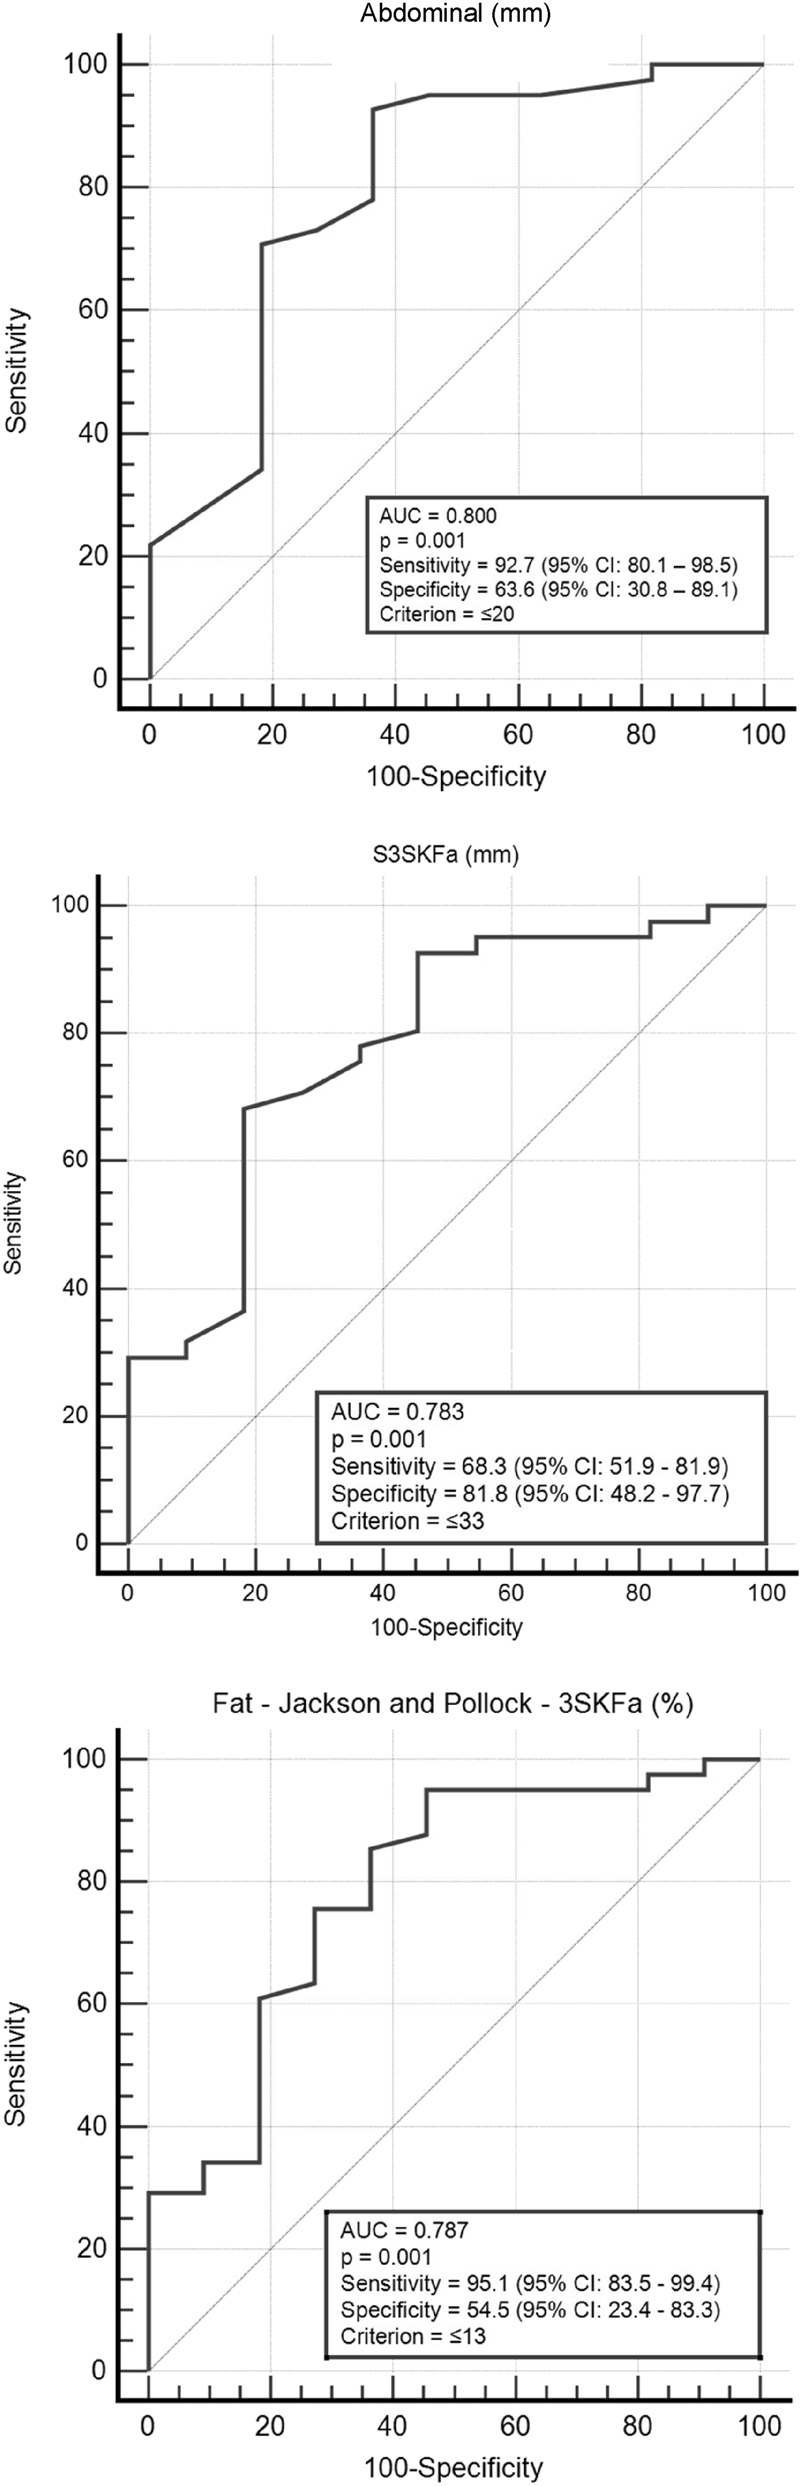
Analysis of the receiver operating characteristic (ROC) curve of the variables that showed strong correlations with performance on the YoYo IRL1. p, significance level; IC, 95 % confidence interval; IRL1, intermittent recovery level 1; 3SKFa, three skinfolds (chest, abdominal, and front thigh).
Discussion
The main findings of the present study indicate that the body mass of soccer players exhibited a moderate negative correlation with YoYo IRL1 test distance. In addition, large negative correlations were observed between the abdominal skinfold, the sum of skinfolds for chest, abdominal, and front thigh, and the fat percentage determined by the Jackson and Pollock protocol using these skinfolds with the YoYo IRL1 test distance. Considering such associations, cutoff points for these measurements were determined as 20 mm for abdominal skinfolds, 33 mm for the sum of three skinfolds, and 13 % for fat percentage.
Body mass was only correlated with YoYo IRL1 distance, partially agreeing with our hypothesis. In contrast, similar studies did not find this correlation in aerobic field tests [3], 7]. The limitation of using body mass to identify players’ body composition may account for the observed differences. Previous studies agree with our results regarding correlations between body mass and jumping and sprinting performance [3], 7], but there is no consensus for sprint evaluation [4]. A study that found a significant weak correlation between body mass with sprint performance used a large sample size [4], which may explain the observed differences. Therefore, greater body mass was associated with lower YoYo IRL1 performance, possibly reflecting the additional effort required in aerobic actions. The soccer technical staff should exercise caution in interpreting and utilizing these correlations, as the correlation found in the present study was moderate, and the literature presents contradictory findings.
Concerning skinfolds, the only strong correlation identified was between abdominal skinfold and distance covered in the YoYo IRL1. Moderate and small correlations were also observed between skinfolds with YoYo IRL1 distance and jumping. Consequently, our hypothesis was partially supported. A similar study revealed a strongest correlation between abdominal skinfold thickness and maximum speed in VO2max testing [5]. Another study did not find a correlation between skinfold and the maximum speed obtained in the VAMEVAL test, jump tests, or 20 m sprints among players from the Qatar national team [3]. The high homogeneity of players selected for a country’s national team [3] may have influenced the emergence of this contrasting outcome with our findings. As a result, only the correlation with the 20 m sprint [3] fully aligns with the findings from our study. Greater abdominal skinfolds were associated with lower performance, suggesting that fat accumulation in this region may negatively affect actions predominantly relying on the aerobic system, such as the YoYo IRL1 test. More fat tissue means an additional non-functional weight that will require more energy to move and produce more heat from the increased metabolic rate, which explains the negative association with YoYo IRL1 performance.
The sum of skinfolds for the chest, abdominal, and front thigh, as well as the fat percentage determined by the Jackson and Pollock protocol using these skinfolds, exhibited large correlations with the distance in the YoYo IRL1 test. Other protocols also showed correlations with the YoYo IRL1 test, aligning with the proposed hypothesis. However, this result was not observed with all other physical tests, which means that our hypothesis was partially accepted for the anaerobic tests. A similar study reported a correlation between the sum of skinfolds and the distance in the YoYo IRL1 test [7]; notwithstanding, the literature does not corroborate this finding when another aerobic field test is utilized [3]. The use of a different field test, as well as the fact that players were members of the national team, and possibly more physically homogeneous [3], may help explain the opposite results. Moderate, small, or non-significant correlations between the sum of skinfolds and performance in jumping and the 20 m sprint were identified in the present study, and these findings are corroborated by previous studies [3], 7]. Similar to the literature [4], the present study found a small correlation between the percentage of fat obtained by the Pollock seven-fold protocol and the 20 m sprint, while the other protocols did not show any correlation. Therefore, the sum of skinfolds for the chest, abdominal, and front thigh, as well as the fat percentage determined by the Jackson and Pollock protocol using these skinfolds, are suggested as anthropometric measures that show large associations with performance in soccer players. In addition, performance in aerobic activities appears to be the most affected by higher sums of skinfolds and fat percentage.
Consistently monitoring the performance of professional soccer players demands effort and precision from the coaching staff. Therefore, cutoff points were established based on the distance performance in the YoYo IRL1 test. The determined cutoff points are 20 mm for abdominal skinfolds, 33 mm for the sum of three skinfolds (chest, abdominal, and front thigh), and 13 % for fat percentage obtained using the Jackson and Pollock method with these three skinfolds. Therefore, players with values equal to or greater than the cutoff points were associated with lower YoYo IRL1 performance, indicating a negative relationship between higher fat measures and aerobic capacity, potentially affecting their performance in training and games [26]. The mechanism that may explain this relationship is the fact that excess body fat increases non-functional mass, reducing relative VO2max by limiting oxygen uptake per kilogram. It also raises the energy cost of running, decreasing movement efficiency and accelerating fatigue during repeated [15]. Hence, our recommendation is to utilize these easily applicable cutoff points to ensure that soccer players do not exceed these thresholds, thereby maintaining optimal performance, while acknowledging that these values may vary across teams, leagues, and countries.
The present study has some limitations that should be acknowledged. The association between fat mass and players’ performance was assessed using physical tests, which is different from performance on the pitch. Therefore, further studies should investigate the association between fat accumulation, assessed through direct methods, and physical performance during soccer matches. In addition, the results were obtained during the pre-season, so its applicability to other periods of the season remains uncertain. The results should also be generalized with caution due to the sample’s geographic, sample size, and competitive homogeneity. Moreover, the fat prediction equations utilized, validated in other populations, may have limited accuracy for soccer players. Despite these limitations, this study proposes protocols for evaluating markers associated to body composition that strongly correlate with physical performance. This finding supports the soccer technical staff choice due to the potential impact of body fat measures on physical performance. Moreover, to our knowledge, this study is the first to propose cutoff points for assessing fat percentage in relation to poorer performance on a test requiring aerobic fitness, facilitating the interpretation of the results by the soccer technical staff. Serving as an incentive to conduct studies that validate findings in external populations or longitudinal studies.
Conclusions
In summary, aerobic performance, as assessed by the Yo-Yo IRL1 test, is significantly more influenced by fat accumulation than anaerobic performance, measured by field tests. Specifically, the present findings suggest abdominal skinfold thickness, the sum of skinfolds for the chest, abdominal, and front thigh, or using fat percentage determined by the Jackson and Pollock protocol with these skinfolds as anthropometric outcomes to be assessed, as they exhibit the highest correlation with distance in the YoYo IRL1 test. Furthermore, employing cutoff points of 20 mm for abdominal skinfold thickness, 33 mm for the sum of skinfolds for the chest, abdominal, and front thigh, and 13 % for fat percentage determined by the Jackson and Pollock protocol (chest, abdominal, and front thigh) facilitates quick interpretation by soccer technical staff and male soccer players.
Practical application
As practical application of this study, coaches should be aware that aerobic performance is significantly more influenced by fat accumulation compared to anaerobic performance. Additionally, abdominal skinfold thickness, the sum of skinfolds for the chest, abdominal, and front thigh, and fat percentage determined by the Jackson and Pollock protocol show the highest correlation with YoYo IRL1 test performance. Finally, using cutoff points of 20 mm for abdominal skinfold thickness, 33 mm for the sum of skinfolds for the chest, abdominal, and front thigh, and 13 % for fat percentage determined by the Jackson and Pollock protocol (chest, abdominal, and front thigh) for quick and easy interpretation by soccer technical staff and players. These measurements can assist in decision-making during periods when cardiorespiratory fitness testing is not feasible.
Funding source: Conselho Nacional de Desenvolvimento Científico e Tecnológico
Acknowledgments
We are grateful to Research Group on Strength Training (GPTF) for their valuable discussions and comments. Additionally, we appreciate the collaboration of the soccer teams and players who participated in the study.
-
Research ethics: The study (No. 2.903.811) received approval from the ethics committee of Federal University of Rio Grande do Sul and adhered to the ethical guidelines of the Declaration of Helsinki by the World Medical Association, as published in the British Medical Journal on July 18, 1964.
-
Informed consent: Participants were informed of the risks and benefits of the assessment prior to data collection. Participants provided their written consent.
-
Author contributions: All authors have accepted responsibility for the entire content of this manuscript and approved its submission. P.S. and A.A.B.P. conducted all stages of the manuscript. R.G., J.B.M., G.D.V., L.M.K., and A.F.V. contributed to data collection, analysis, and manuscript review. E.L.C. supervised the study, participated in all stages, and performed the final review.
-
Use of Large Language Models, AI and Machine Learning Tools: None declared.
-
Conflict of interest: The authors declare no conflict of interest. Eduardo Lusa Cadore serves as an editor for Translational Exercise Biomedicine, but was not involved in the handling, editorial review, or decision-making process for this manuscript.
-
Research funding: Eduardo Lusa Cadore and Pedro Schons are funded by the National Council for Scientific and Technological Development (CNPq).
-
Data availability: The datasets generated and/or analyzed during the current study are available from the corresponding author on reasonable request.
References
1. Stølen, T, Chamari, K, Castagna, C, Wisløff, U. Physiology of soccer: an update. Sports Med 2005;35:501–36. https://doi.org/10.2165/00007256-200535060-00004.Search in Google Scholar PubMed
2. Bush, M, Barnes, C, Archer, DT, Hogg, B, Bradley, PS. Evolution of match performance parameters for various playing positions in the English Premier League. Hum Mov Sci 2015;39:1–11. https://doi.org/10.1016/j.humov.2014.10.003.Search in Google Scholar PubMed
3. Brocherie, F, Girard, O, Forchino, F, Al Haddad, H, Dos Santos, GA, Millet, GP. Relationships between anthropometric measures and athletic performance, with special reference to repeated-sprint ability, in the Qatar national soccer team. J Sports Sci 2014;32:1243–54. https://doi.org/10.1080/02640414.2013.862840.Search in Google Scholar PubMed
4. Nikolaidis, PT, Ruano, MAG, De Oliveira, NC, Portes, LA, Freiwald, J, Leprêtre, PM, et al.. Who runs the fastest? Anthropometric and physiological correlates of 20 m sprint performance in male soccer players. Res Sports Med 2016;24:341–51. https://doi.org/10.1080/15438627.2016.1222281.Search in Google Scholar PubMed
5. Nikolaidis, PT, Weiss, K, Knechtle, B. Skinfold thickness variation and associations with cardiorespiratory fitness in male soccer players of different ages. Eur Rev Med Pharmacol Sci 2023;27:2200–9.Search in Google Scholar
6. Radzimiński, Ł, Szwarc, A, Padrón-Cabo, A, Jastrzębski, Z. Correlations between body composition, aerobic capacity, speed and distance covered among professional soccer players during official matches. J Sports Med Phys Fitness 2020;60:257–62. https://doi.org/10.23736/S0022-4707.19.09979-1.Search in Google Scholar PubMed
7. Schons, P, Birk Preissler, AA, Oliveira, R, Brito, JP, Clemente, FM, Droescher de Vargas, G, et al.. Comparisons and correlations between the anthropometric profile and physical performance of professional female and male soccer players: individualities that should be considered in training. Int J Sports Sci Coaching 2023;18:2004–14. https://doi.org/10.1177/17479541221131649.Search in Google Scholar
8. Miller, T. Guia para avaliações do condicionamento físico, 1a ed. Barueri: Manole; 2015.Search in Google Scholar
9. Sebastiá-Rico, J, Soriano, JM, González-Gálvez, N, Martínez-Sanz, JM. Body composition of male professional soccer players using different measurement methods: a systematic review and meta-analysis. Nutrients 2023;15:1160. https://doi.org/10.3390/nu15051160.Search in Google Scholar PubMed PubMed Central
10. Turner, A, Walker, S, Stembridge, M, Coneyworth, P, Reed, G, Birdsey, L, et al.. A testing battery for the assessment of fitness in soccer players. Strength Cond J 2011;33:29–39. https://doi.org/10.1519/SSC.0b013e31822fc80a.Search in Google Scholar
11. Faulkner, JA. Physiology of swimming and diving. Baltimore: Academic Press; 1968.Search in Google Scholar
12. Raymundo, JLP, Reckers, LJ, Locks, R, Silva, L, Hallal, PC. Perfil das lesões e evolução da capacidade física em atletas profissionais de futebol durante uma temporada. Rev Bras Ortop 2005;40:341–8.Search in Google Scholar
13. Suarez-Arrones, L, Petri, C, Maldonado, RA, Torreno, N, Munguía-Izquierdo, D, Di Salvo, V, et al.. Body fat assessment in elite soccer players: cross-validation of different field methods. Sci Med Football 2018;2:203–8. https://doi.org/10.1080/24733938.2018.1445871.Search in Google Scholar
14. Novack, LF, Ferreira, GA, Coelho, RL, Osiecki, R. Novel equations to predict body fat percentage of Brazilian professional soccer players: a case study. Motriz Rev Educ Fis 2014;20:402–7. https://doi.org/10.1590/S1980-65742014000400006.Search in Google Scholar
15. Saunders, PU, Pyne, DB, Telford, RD, Hawley, JA. Factors affecting running economy in trained distance runners. Sports Med 2004;34:465–85. https://doi.org/10.2165/00007256-200434070-00005.Search in Google Scholar PubMed
16. Jackson, AS, Pollock, ML. Practical assessment of body composition. Physician Sportsmed 1985;13:76–90. https://doi.org/10.1080/00913847.1985.11708790.Search in Google Scholar PubMed
17. Siri, WE. The gross composition of the body. Adv Biol Med Phys 1956;4:239–80. https://doi.org/10.1016/b978-1-4832-3110-5.50011-x.Search in Google Scholar PubMed
18. Bosco, C, Luhtanen, P, Komi, PV. A simple method for measurement of mechanical power in jumping. Eur J Appl Physiol Occup Physiol 1983;50:273–82. https://doi.org/10.1007/BF00422166.Search in Google Scholar PubMed
19. Linthorne, NP. Analysis of standing vertical jumps using a force platform. Am J Phys 2001;69:1198–204. https://doi.org/10.1119/1.1397460.Search in Google Scholar
20. Young, WB, Pryor, JF, Wilson, GJ. Effect of instructions on characteristics of countermovement and drop jump performance. J Strength Cond Res 1995;9:232–6. https://doi.org/10.1519/00124278-199511000-00005.Search in Google Scholar
21. Moir, G, Button, C, Glaister, M, Stone, MH. Influence of familiarization on the reliability of vertical jump and acceleration sprinting performance in physically active men. J Strength Cond Res 2004;18:276–80. https://doi.org/10.1519/R-13093.1.Search in Google Scholar PubMed
22. Little, T, Williams, AG. Specificity of acceleration, maximum speed, and agility in professional soccer players. J Strength Cond Res 2005;19:76–8. https://doi.org/10.1519/14253.1.Search in Google Scholar PubMed
23. Loturco, I, Nimphius, S, Kobal, R, Bottino, A, Zanetti, V, Pereira, LA, et al.. Change-of-direction deficit in elite young soccer players. Ger J Exercise Sport Res 2018;48:228–34. https://doi.org/10.1007/s12662-018-0502-7.Search in Google Scholar
24. Bangsbo, J, Iaia, FM, Krustrup, P. The Yo-Yo intermittent recovery test: a useful tool for evaluation of physical performance in intermittent sports. Sports Med 2008;38:37–51. https://doi.org/10.2165/00007256-200838010-00004.Search in Google Scholar PubMed
25. Hopkins, WG, Marshall, SW, Batterham, AM, Hanin, J. Progressive statistics for studies in sports medicine and exercise science. Med Sci Sports Exercise 2009;41:3–13. https://doi.org/10.1249/MSS.0b013e31818cb278.Search in Google Scholar PubMed
26. Krustrup, P, Mohr, M, Amstrup, T, Rysgaard, T, Johansen, J, Steensberg, A, et al.. The Yo-Yo intermittent recovery test: physiological response, reliability, and validity. Med Sci Sports Exercise 2003;35:697–705. https://doi.org/10.1249/01.MSS.0000058441.94520.32.Search in Google Scholar PubMed
Supplementary Material
This article contains supplementary material (https://doi.org/10.1515/teb-2025-0024).
© 2025 the author(s), published by De Gruyter on behalf of Shangai Jiao Tong University and Guangzhou Sport University
This work is licensed under the Creative Commons Attribution 4.0 International License.
Articles in the same Issue
- Frontmatter
- Section: Integrated exercise physiology, biology, and pathophysiology in health and disease
- The impact of exercise on the role of lipid droplets in maintaining health: a narrative review
- Effects of different interventions on microgravity-induced bone loss
- Section: Personalized and advanced exercise prescription for health and chronic diseases
- A therapeutic exercise program for adolescents engaged in gender diversity services: study protocol for a non-randomised clinical trial
- The role of exercise modality on psychological, behavioral, and fitness outcomes among individuals at risk of type 2 diabetes: preliminary evidence from the CHOICE pragmatic randomized trial
- Section: Physical activity/inactivity and health across the lifespan
- Serum metabolic alterations after two weeks of step-reduction and following four weeks of exercise rehabilitation in older adults: a secondary analysis of the ENDURE randomised controlled trial
- Calibration and evaluation of MET models for estimating energy expenditure using thigh and ankle-worn move 4 accelerometer
- Section: Sports medicine and movement science
- Muscular activity of hamstrings under attentional focus instructions: an electromyography based study
- Associations between anthropometric outcomes and fat percentage with physical performance in professional soccer players: a cutoff points approach