
Creatine supplementation strategies aimed at acutely increasing and maintaining skeletal muscle total creatine content in healthy, young volunteers
-
George Pittas


Abstract
Objectives
Insight regarding dietary creatine (Cr) supplementation strategies to acutely increase and maintain muscle total creatine (TCr) content is missing.
Methods
Healthy, young, men ingested 4 × 5 g Cr/day (d) for 5d, followed by 5 g/d for 28 d (Cr group, n=8). To achieve insulin mediated muscle Cr transport, another group (n=16) ingested 4 × 5 g Cr plus 95 g dextrose/d for 5d (CrCHO), and thereafter two sub-groups ingested 5 g of Cr (CrCHO1, n=8) or 5 g Cr plus 95 g dextrose/d for 28 d (CrCHO2, n=8). A fourth group ingested 4 × 5g of Cr plus 14 g protein, 7 g phenylalanine, 7 g leucine and 57 g dextrose/d for 5 d, and once/d thereafter for 28 d (CrPAC, n=8). Muscle biopsies were obtained at 0, and after 5 and 33 d.
Results
After 5 d, muscle TCr increased in Cr (p<0.001), CrCHO (p<0.001), and CrPAC (p<0.05) groups, and was numerically greatest in CrCHO; achieving a content reported to be an average maximum (150 mmol/kg). After 33 d, TCr also increased to ~150 mmol/kg in the Cr group (p<0.05), remained unchanged from 5 d in CrCHO2, and tended to decline in CrCHO1. Muscle TCr remained unchanged from 5 d in CrPAC after 33 d, being less than the Cr group (p<0.05). Muscle Cr transporter mRNA expression changed modestly, but the increase in muscle TCr after 5 d was inversely associated with fold-change in mRNA expression (r=0.502, p<0.05).
Conclusions
A maximum increase in muscle TCr is achieved after 5 d Cr ingestion alongside 95 g dextrose, and continued consumption of Cr with dextrose will maintain this maximum. Ingestion of Cr alone will achieve a high muscle TCr content too, but takes longer.
Introduction
In 1992 Harris et al. [1] published the first evidence that dietary creatine (Cr) supplementation (20–30 g Cr per day for several days) can increase muscle total Cr (TCr; the sum of phosphocreatine (PCr) and free Cr) content by up to 50 % in healthy human volunteers. The subsequent plethora of research on the effects of Cr supplementation on exercise performance unequivocally demonstrated the positive ergogenic and metabolic effects of Cr supplementation during short, high intensity exercise (for example see reviews 2], [3], [4). This has resulted in Cr becoming one of the most established supplements in the sports and fitness market.
Creatine supplementation was effective at increasing muscle TCr content in some, but not all, individuals when 4 × 5 g of Cr per day was consumed at equally spaced intervals as a beverage for 5–7 days (loading phase; [1, 5, 6]). We have previously demonstrated that insulin can further stimulate muscle Cr accumulation in healthy, young volunteers above the magnitude seen when Cr alone is ingested [7]. In addition, this stimulatory effect of insulin, which was achieved by combining a 5 g liquid bolus of Cr with a second beverage containing 93 g of simple carbohydrates on four occasions per day for 5 days, was demonstrated to increase muscle TCr content in all individuals [5], thus reducing the variation in the Cr accumulation response between individuals. It is likely however that this carbohydrate ingestion regimen is close to the limit of palatability [5]. Accordingly, Steenge et al. [8] investigated the impact of ingesting Cr in tandem with a more palatable beverage containing 50 g of protein and 47 g of carbohydrates, which was found to augment whole-body Cr retention by a magnitude similar to that observed with 95 g of simple carbohydrates. Subsequently, we reported that naso-gastric administration of Cr with a mixture containing 57 g of carbohydrate, 14 g of protein hydrolysate, 7 g of leucine and 7 g of phenylalanine (three times over a 24 h period for 3 days), stimulated insulin release and augmented whole-body creatine retention to the same extent as when 95 g of simple carbohydrate was administered at the same frequency for 3 days [9]. Although interventions were administered by oral gavage to minimize any impact of palatability on end-point measures, this study demonstrated that combining more tolerable quantities of carbohydrate and protein with relatively small quantities of insulin potentiating amino acids (leucine and phenylalanine) augmented whole body Cr retention above that seen with Cr alone in healthy, young volunteers over 3 days. By lowering the amount of carbohydrate and protein ingested, it was also hoped palatability and caloric issues associated with the ingestion of large quantities of these nutrients would be reduced.
A limited number of studies have investigated the longer-term impact of Cr supplementation on muscle TCr content following an initial muscle Cr loading phase (4 × 5 g of Cr ingested per day), and those that have present contrasting findings. Hultman et al. [10] was the first to demonstrate that ingesting 2 g of Cr per day after 6 days of muscle Cr loading was sufficient to maintain elevated muscle TCr stores for a further 30 days in healthy, young volunteers, which the authors proposed was achieved by maintaining muscle creatine delivery at a rate close to the degradation rate of muscle Cr to creatinine. In agreement Preen et al. [11] demonstrated that following initial muscle Cr loading (4 × 5 g of Cr ingested per day for 5 days), both 2 g Cr per day and 5 g Cr per day for a period of 42 days maintained elevated muscle TCr content. In contrast, neither the ingestion of 2 g Cr per day for 36 days (following a 5 day muscle Cr loading phase; [12]) or the ingestion 5 g Cr per day for 77 days (after a 7 day muscle Cr loading phase; [13]) was effective at maintaining muscle TCr content compared to immediately post muscle Cr loading. Based on these contrasting reports it is not possible to be definitive about the most effective strategies to maintain muscle creatine stores following an initial phase of Cr loading, but it is not immediately obvious to rationalize why a maintenance dose of 2–5 g Cr per day following muscle Cr loading would not be effective at maintaining muscle TCr content given the non-enzymatic degradation rate of muscle Cr to creatinine is widely accepted to be between 1 and 2 g per day (see review 2). Irrespective of this point, whilst reports outlined above have demonstrated muscle Cr accumulation can be augmented in the short-term when Cr is ingested alongside nutrients that elevate serum insulin concentration [5, 8], to our knowledge no study has investigated the longer-term impact of dietary Cr supplementation combined with insulin potentiating nutrients on muscle TCr content in healthy, young volunteers. This is of scientific and practical relevance given potential palatability issues of ingesting large quantities of insulin potentiating nutrients for more than a few days.
It has been suggested that longer-term dietary Cr supplementation may reduce muscle Cr transporter protein in human skeletal muscle [14], which may be detrimental to metabolic and physiological function. This opinion is based on in vitro cell based studies [15] and in vivo rodent studies involving 3–6 months of daily Cr feeding at a dose up to 30-fold greater than would be routinely ingested by humans (on a weight for weight basis; [16]), but nevertheless may explain the reports above that longer term dietary Cr ingestion was not effective the maintaining muscle TCr content in healthy, young volunteers [12, 13]. However, the limited evidence available demonstrates that 2–4 months of dietary Cr supplementation that was effective at increasing muscle TCr content had no impact on muscle Cr transporter content in either young or elderly human volunteers [17]. Furthermore, 8–9 days of dietary Cr supplementation that also increased muscle TCr content had no impact on muscle Cr transporter mRNA expression in healthy, young volunteers [17]. To our knowledge, no study has investigated the effects of longer-term Cr supplementation on the muscle Cr transporter mRNA expression.
In the context of this background research, in this study we hoped to confirm that following conventional acute muscle Cr loading (4 × 5 g per day for 5 days), continued ingestion of Cr at rate of 5 g per day (i.e. well above the widely reported rate of muscle Cr degradation to creatinine) was effective at maintaining an elevated muscle TCr content for a further 28 days. We also aimed to generate novel insight regarding the impact of combining each 5 g Cr bolus during conventional acute muscle Cr loading (4 × 5 g per day for 5 days) with a large bolus of simple sugars or a mixture of protein, amino acids and carbohydrate predicted to increase muscle Cr accumulation via an insulin mediated stimulatory mechanism we have previously described 5], [6], [7], [8. Furthermore, and linked to this, whether such insulin related strategies were necessary and/or could maintain elevated muscle TCr content over a further 28 days, when dietary Cr supplementation was reduced to a single 5 g per day bolus. Finally, we aimed to quantify the impact of acute and longer-term Cr supplementation on muscle Cr transporter mRNA expression given the limited published data available. Of note, the insight this research aims to deliver is of importance from a translational point of view given the muscle metabolic [18] and exercise performance 19], [20], [21 gains resulting from dietary Cr supplementation appear to be most evident when a high muscle TCr content is achieved, and the likelihood of a ‘non-response’ is minimized [5]. The summary of this study is presented in Figure 1.
![Figure 1:
Graphical representation of this study. Key points [1]: Ingestion of 4 × 5 g Cr/day for 5 days increased muscle TCr content. Moreover, continued ingestion of 5 g Cr/day for a further 28 days increased muscle TCr further to the average maximum content reported for healthy volunteers (∼150 mmol kg−1 dm) [2]. A similar average increase to ∼150 mmol kg−1 dm occurred after 5 days when 4 × 5 g Cr/day was ingested in tandem with 95 g dextrose. This was maintained for a further 28 days by ingesting 5 g Cr with 95 g of dextrose/day [3]. Ingestion of a protein, amino acid and carbohydrate formulation did not maximise muscle Cr accumulation to the same extent as Cr plus dextrose, despite a similar plasma insulin response. Figure created with BioRender.](/document/doi/10.1515/teb-2024-0032/asset/graphic/j_teb-2024-0032_fig_001.jpg)
Graphical representation of this study. Key points [1]: Ingestion of 4 × 5 g Cr/day for 5 days increased muscle TCr content. Moreover, continued ingestion of 5 g Cr/day for a further 28 days increased muscle TCr further to the average maximum content reported for healthy volunteers (∼150 mmol kg−1 dm) [2]. A similar average increase to ∼150 mmol kg−1 dm occurred after 5 days when 4 × 5 g Cr/day was ingested in tandem with 95 g dextrose. This was maintained for a further 28 days by ingesting 5 g Cr with 95 g of dextrose/day [3]. Ingestion of a protein, amino acid and carbohydrate formulation did not maximise muscle Cr accumulation to the same extent as Cr plus dextrose, despite a similar plasma insulin response. Figure created with BioRender.
Methods
Participants
Following medical screening, 32 healthy, non-vegetarian, male volunteers provided written informed consent to take part in the present experiment. All were sedentary to moderately active, Cr supplement naive and had not consumed dietary supplements of any nature for at least three months prior to entering in to the study and all were asked to maintain their habitual physical activity levels throughout the study. This study was approved by the University of Nottingham Medical School Research Ethics Committee (approval number C/6/2003) in accordance with the Declaration of Helsinki.
Protocol
Participants were randomly allocated into one of four dietary supplementation strategies in a double blind study design. One group of participants (n=8) ingested 4 × 5 g of Cr per day for 5 days, followed by 5 g Cr per day for a further 28 days (Cr group). A second cohort (n=16), ingested 4 × 5 g Cr + 95 g dextrose per day for 5 days (CrCHO), but thereafter one sub-group ingested 5 g of Cr per day for the following 28 days (CrCHO1, n=8), whilst a second subgroup ingested 5 g of Cr + 95 g dextrose per day for 28 days (CrCHO2, n=8). A fourth group of volunteers ingested 4 × 5 g of Cr + 14 g whey protein + 7 g phenylalanine + 7 g leucine + 57 g dextrose per day for 5 days, and thereafter the same supplement mixture once per day for the following 28 days (CrPAC, n=8). One volunteer withdrew from this group after the first day of supplementation, and a second volunteer after 5 days (end of loading phase). Each volunteer attributed their withdrawal to poor palatability or tolerability of the CrPAC supplement, respectively. Therefore, seven volunteers in the CrPAC group completed the loading phase of the study and six completed the whole study. Volunteer physical characteristics at baseline are described in Table 1.
Age, height, mass and body mass index (BMI) of volunteers assigned to the following intervention groups at the beginning of the study: Cr (4 × 5 g Cr per day for 5 days, followed by 5 g Cr per day for a further 28 days, n=8); CrCHO1 (4 × 5 g Cr per day + 95 g of dextrose for 5 days, followed by 5 g Cr per day for a further 28 days, n=8); CrCHO2 (4 × 5 g Cr per day + 95 g of dextrose for 5 days, followed by 5 g Cr + 95 g of dextrose per day for a further 28 days, n=8); CrPAC (4 × 5 g Cr per day + 14 g protein hydrolysate, 7 g phenylalanine, 7 g leucine, and 57 g dextrose, followed by 5 g Cr per day + 14 g protein hydrolysate, 7 g phenylalanine, 7 g leucine, and 57 g dextrose for a further 28 days, n=7).
| Group | Age, y | Height, cm | Mass, kg | BMI |
|---|---|---|---|---|
| Cr (n=8) | 20.8 ± 1.0 | 178 ± 1 | 69.9 ± 1.5 | 22.1 ± 0.5 |
| CrCHO1 (n=8) | 22.0 ± 2.6 | 181 ± 3 | 78.0 ± 2.7 | 23.9 ± 0.7 |
| CrCHO2 (n=8) | 22.8 ± 2.1 | 181 ± 3 | 77.7 ± 5.4 | 23.8 ± 1.4 |
| CrPAC (n=7) | 22.6 ± 1.6 | 178 ± 2 | 81.0 ± 5.9 | 25.5 ± 1.6 |
All volunteers were supplied with a graduated mixing container and instructed to dissolve each powder supplement in water, to a volume of 340 mL, and to consume the supplement within a 5 min period. During the initial 5 days of supplementation (muscle Cr loading phase), volunteers were instructed to consume a supplement drink every 3–4 h. Each supplement was to be ingested at least 2 h prior to and after food consumption across the course of each day in an effort to alleviate the effects of food ingestion on Cr absorption and pancreatic insulin release.
Volunteers attended the laboratory on three predetermined occasions over the course of the study (day 0 (baseline), day 6 and day 34). On each occasion, participants reported to the laboratory at approximately 8am in a fasted state, having refrained from exercise, alcohol and consumption of meat and fish products for 24 h. On arrival, participants emptied their bladder, their body mass was recorded, and they then rested in a supine position for the remainder of the visit. Following administration of local anaesthetic (1 % w/v lignocaine hydrochloride, Antigen Pharmaceutical Ltd., Roscrea, Ireland), a muscle biopsy sample was obtained from the Vastus Lateralis muscle using the Bergstrom needle biopsy technique [22]. Following removal from the limb, the muscle sample was immediately snap frozen by immersion in liquid nitrogen, and stored in liquid nitrogen until analysis was performed at a later date. Insufficient muscle was harvested from one volunteer at baseline in the CrCHO group, and one volunteer in the Cr group after 5 days supplementation.
After a short break, a 21 gauge venous cannulae was inserted retrogradely into a superficial vein on the dorsal surface of the hand following local anaesthesia (1 % w/v lignocaine hydrochloride, Antigen Pharmaceutical Ltd., Roscrea, Ireland), and patency was maintained by saline infusion (0.9 % sodium chloride BP, Baxter Healthcare Ltd., Thetford, England, UK). The hand was then placed in a warming unit (∼50 °C air temperature) for at least 15 min in order to arterialise the venous drainage of the hand [23]. Following this, an 8 mL blood sample (baseline) was taken followed immediately by the ingestion of one of the dietary supplements described above. After supplement ingestion, blood samples were collected at 15 min intervals for 60 min, and at 20 min intervals thereafter for a further 120 min (total collection time 180 min). Immediately after consumption of the supplement, each subject completed a palatability and tolerability questionnaire.
Serum and plasma analysis
Following blood sample collection, ∼4 mL was placed in a plain blood collection tube and allowed to clot for the collection of serum. The remaining blood was collected into a tube containing K3EDTA (potassium ethylenediaminietetra-acetic acid, 1.5 mg/mL) for plasma collection, mixed thoroughly and placed immediately on ice. All samples were subsequently centrifuged at 3000 rpm for 10 min, and the serum and plasma obtained was frozen (−20 °C) for serum insulin and plasma Cr determination, respectively, at a later date. Serum insulin concentration was determined using a radioimmunoassay kit (Diagnostic Products Corporation, Los Angeles, California, USA). The analytical coefficient of variation for serum insulin concentration was 2.4 % (n=10 repeat determinations). Plasma Cr concentration was determined using the high performance liquid chromatography method described by Dunnett et al. [24]. The analytical coefficient of variation for plasma Cr concentration was 1.7 % (n=10 repeat determinations).
Muscle sample analysis
Muscle samples were divided under liquid nitrogen and one piece, to be used for muscle metabolite analysis, was freeze-dried. Freeze dried muscle samples were powdered, with care being taken to remove visible connective tissue and blood, and an aliquot of powder was used for metabolite extraction in perchloric acid (subsequently neutralized by addition of KHCO3). Muscle ATP, PCr, and free Cr were determined in muscle extracts using the enzymatic spectrophotometric method described by Harris et al. [25]. Muscle ATP content was used to normalise free Cr and PCr contents (as muscle ATP did not change with time or treatment during the experiment, data not shown) to account for variation due to the presence of non-muscle constituents. The analytical coefficient of variation for muscle ATP, free Cr and PCr content was 0.8 , 2.9 and 0.9 %, respectively (n=10 repeat determinations for each).
Total RNA was extracted from 30 mg of wet muscle tissue by homogenizing in ice-cold TRIzol reagent (Invitrogen Ltd., Paisley, UK). After spectrophotometric quantification at 260 nm, first-strand cDNA was generated from 0.5 μg of the RNA using reverse transcriptase (Promega, Southampton, UK) and stored at −80 °C. Subsequent analysis involved use of predesigned Taqman primers and probes for the Cr transporter (Hs00940513) and real-time PCR using an ABI PRISM 7000 sequence detection system (Applied Biosystems, CA, USA). Briefly, fluorescent emission data were captured and triplicate mRNA concentrations were quantified from a relative standard curve using the critical threshold (Ct) value [26]. Hydroxymethylbilane synthase (HMBS; Hs00609297) was used as a housekeeping gene to compensate for variation in the amount of RNA and efficiency of reverse transcription. Ct values for HMBS were unchanged across time points and treatment (data not shown). The analytical coefficient of variation for muscle HMBS expression was 3.6 % (n=10 repeat determinations).
Statistical analysis
Variables measured pre-intervention on one occasion, such as baseline body mass and fasting insulin concentration, were compared across groups using one-way ANOVA. Responses in variables to the acute supplementation period (days 0 to 5 in groups Cr, CrCHO and CrPAC) and responses across the acute and chronic supplementation periods (day 0 to 34 in groups Cr, CrCHO1, CrCHO2 and CrPAC), were compared using mixed model, two-way ANOVA (with repeated measures) to identify significant differences within and between treatment interventions. Violation of the assumption of sphericity was assessed using Mauchly’s test and where appropriate the Greenhouse-Geisser statistic used to determine significance. Where the ANOVA indicated a significant group or group x time interaction effect, Tukeys post-hoc test was performed to locate where differences were located. The degree of association between the change in muscle TCr content and Cr transporter mRNA expression from baseline with dietary Cr supplementation was determined using the Pearson correlation coefficient (r). Statistical significance was accepted at p<0.05 and values presented refer to mean±standard error of the mean.
Results
Body mass
There was no difference in body mass between groups at day 0. However, across 33 days supplementation, there was a group difference (p<0.05); the Cr and CrCHO2 group recorded a greater body mass after 33 days compared to day 0 (p<0.05 for both), whereas CrPAC recorded an increased body mass from day 0 after 5 days (p<0.05), which remained evident after 33 days (p<0.05).
Body mass (kg) at baseline (0 days) and following 5 and 33 days of supplementation with: Cr (4 × 5 g Cr per day for 5 days, followed by 5 g Cr per day for a further 28 days); CrCHO1 (4 × 5 g Cr per day + 95 g of dextrose for 5 days, followed by 5 g Cr per day for a further 28 days); CrCHO2 (4 × 5 g Cr per day + 95 g of dextrose for 5 days, followed by 5 g Cr + 95 g of dextrose per day for a further 28 days); CrPAC (4 × 5 g Cr per day + 14 g protein hydrolysate, 7 g phenylalanine, 7 g leucine, and 57 g dextrose, followed by 5 g Cr per day + 14 g protein hydrolysate, 7 g phenylalanine, 7 g leucine, and 57 g dextrose for a further 28 days).
| Group | 0 days (kg) | 5 days (kg) | 33 days (kg) | |
|---|---|---|---|---|
| Cr | 69.9 ± 1.5 | 69.9 ± 1.5 | 70.9 ± 1.7a | |
| CrCHO | 77.9 ± 2.9 | 78.5 ± 2.8a | CrCHO1 | 75.2 ± 4.6 |
| CrCHO2 | 80.0 ± 2.1a | |||
| CrPAC | 81.0 ± 5.9 | 84.8 ± 5.6a | 86.0 ± 6.0a |
-
aRepresents significantly different from 0 days (p<0.05) within the same group.
Serum insulin concentration
Serum insulin concentration before (0 min) and for the 180 min following supplement ingestion at baseline (day 0), and following 5 and 33 days dietary supplementation is shown in Figure 2. Basal serum insulin concentration was no different between groups on any study day, but the insulin response across 180 min following supplement ingestion differed between the groups (Time x Group: p<0.01 and Group: p<0.001 at each visit). Serum insulin concentration did not change from the basal (pre-ingestion) value (∼10mU/L) in the Cr supplemented group over the 180 min of investigation on any study day. In the CrCHO group, serum insulin concentration peaked after ±45 min (63.79.3 mU/L) and was greater than Cr group from 15 to 140 min. Similarly, substantial increases in serum insulin concentration were also observed in the CrPAC group compared with Cr alone on day 0 and following 5 and 33 days supplementation (Figure 2). In the case of group CrCHO1, where Cr alone was ingested after day 5 onwards, serum insulin concentration did not change from the basal concentration recorded on day 6 and day 34, as seen in the Cr group. As expected, the CrCHO2 group, who continued to ingest Cr with 95 g of dextrose on a daily basis after day 5 to day 33, demonstrated increases in serum insulin concentration on both these study days. Between groups comparisons revealed that as expected serum insulin concentration was greater on all study days from 15 min onwards following the ingestion of Cr in conjunction with carbohydrate (CrCHO1, CrCHO2) or CrPAC when compared to Cr alone (Figure 2). Following 33 days supplementation however, the magnitude of these serum insulin responses had waned compared to baseline and after day 5.
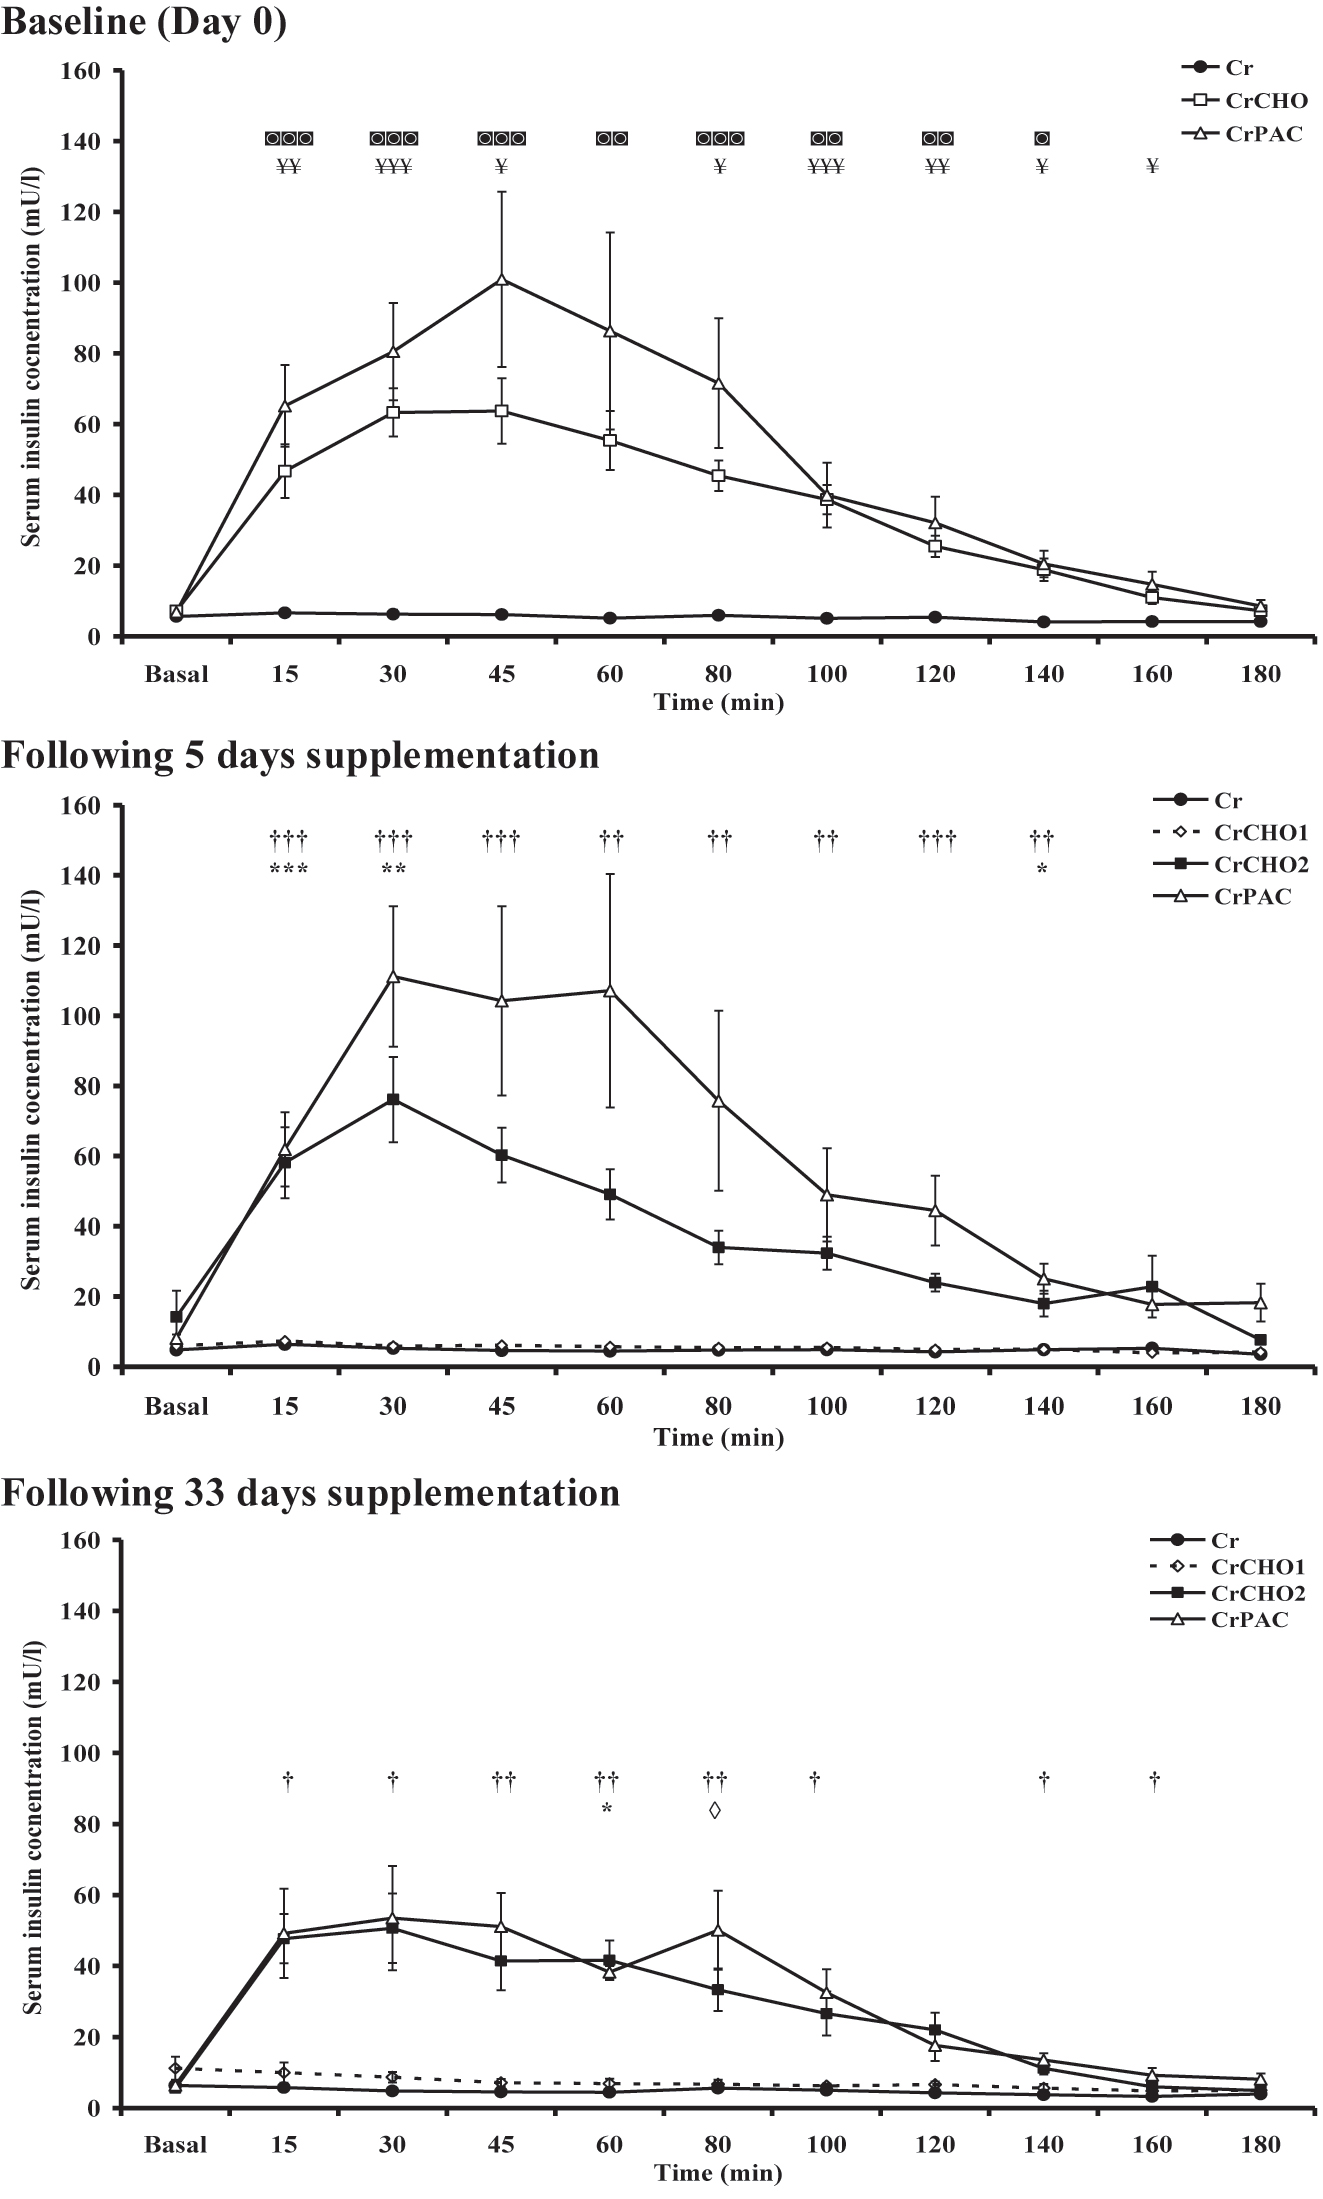
Serum insulin concentration before (basal) and for 180 min following supplement ingestion at baseline (day 0), and after 5 (day 6) and 33 (day 34) days supplementation with: Cr (4 × 5 g Cr per day for 5 days, followed by 5 g Cr per day for a further 28 days); CrCHO1 (4 × 5 g Cr per day + 95 g of dextrose for 5 days, followed by 5 g Cr per day for a further 28 days); CrCHO2 (4 × 5 g Cr per day + 95 g of dextrose for 5 days, followed by 5 g Cr + 95 g of dextrose per day for a further 28 days); CrPAC (4 × 5 g Cr per day + 14 g protein hydrolysate, 7 g phenylalanine, 7 g leucine, and 57 g dextrose, followed by 5 g Cr per day + 14 g protein hydrolysate, 7 g phenylalanine, 7 g leucine, and 57 g dextrose for a further 28 days). Following Tukey’s post-hoc testing of significant observations for the mixed model ANOVA: ¥ reflects CrCHO different from Cr; ◙ reflects CrPAC different from Cr; * reflects CrCHO2 different from Cr and CrCHO1; † reflects CrPAC different from Cr and CrCHO1; ◊ reflects CrPAC different from CrCHO1 at designated individual timepoints. The level of significant difference is depicted by one, two or three symbols: p<0.05, p<0.01, and p<0.001, respectively.
Plasma creatine concentration
Plasma Cr concentration before and for the 180 min following supplement ingestion at baseline (day 0), and following 5 and 33 days dietary supplementation is shown in Figure 3. Basal plasma Cr concentration was no different between groups on any study day. An increase in plasma Cr concentration occurred in all groups on all study days, but the pattern of response differed markedly between groups (Time × Group: p<0.001 at each visit). When considering the plasma Cr concentration within each study intervention group, the post-ingestion concentration was different across the 3 study timepoints (Cr, CrCHO2 and CrPAC: each p<0.05, CrCHO1: p<0.001), with this variable being lower on day 0 for all groups than that observed after 33 days supplementation (Cr, CrCHO2 and CrPAC: each p<0.005, CrCHO1: p<0.001; Figure 3) and lower on day 5 for CrCHO1 (p<0.001), CrCHO2 (p<0.05) and CrPAC (p<0.001). When considering differences in plasma Cr responses between study intervention groups, at baseline the increase in plasma Cr concentration was greater in the Cr group compared to CrCHO and CrPAC for up to 60–80 min following ingestion, respectively (Figure 3). A similar blunting of the plasma Cr response to ingestion was observed after day 5 of supplementation in the CrCHO2 and CrPAC study groups compared Cr ingestion alone (Cr and CrCHO1), and these blunted responses were also observed after 33 days supplementation (Figure 3). The maximum plasma creatine concentration and time to concentration maximum for the data depicted in Figure 3 are shown in Table S1.
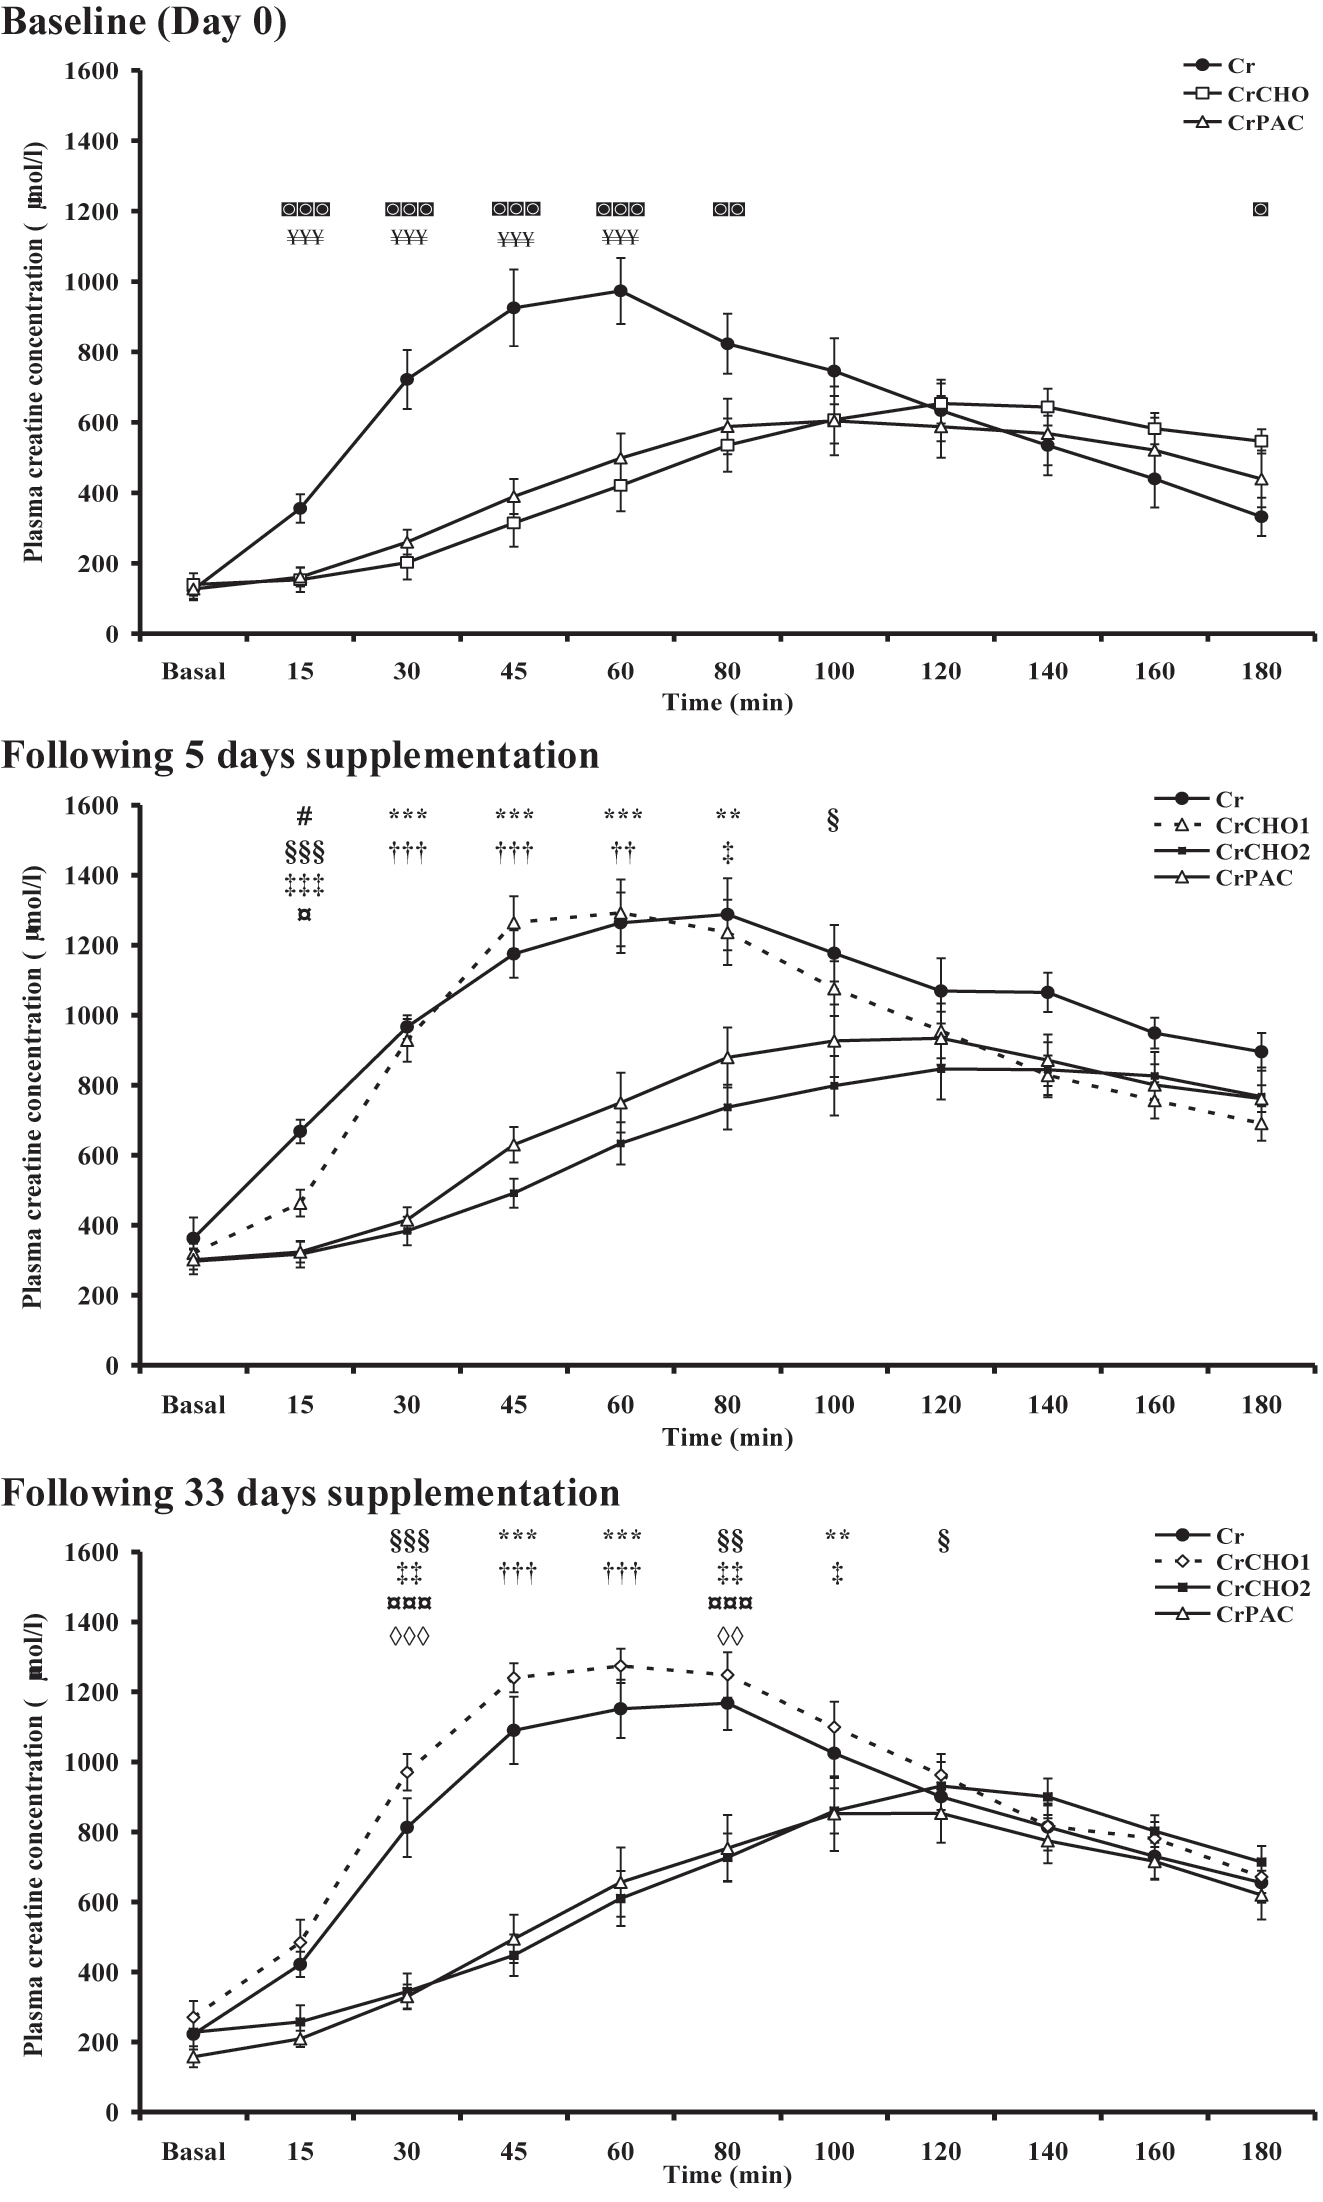
Plasma creatine concentration before (basal) and for 180 min following supplement ingestion at baseline (day 0), and after 5 (day 6) and 33 (day 34) days supplementation with: Cr (4 × 5 g Cr per day for 5 days, followed by 5 g Cr per day for a further 28 days); CrCHO1 (4 × 5 g Cr per day + 95 g of dextrose for 5 days, followed by 5 g Cr per day for a further 28 days); CrCHO2 (4 × 5 g Cr per day + 95 g of dextrose for 5 days, followed by 5 g Cr + 95 g of dextrose per day for a further 28 days); CrPAC (4 × 5 g Cr per day + 14 g protein hydrolysate, 7 g phenylalanine, 7 g leucine, and 57 g dextrose, followed by 5 g Cr per day + 14 g protein hydrolysate, 7 g phenylalanine, 7 g leucine, and 57 g dextrose for a further 28 days). Following Tukey’s post-hoc testing of significant observations for the mixed model ANOVA: ¥ reflects CrCHO different from Cr; ◙ reflects CrPAC different from Cr; # reflects Cr different from CrCHO1; ¤ reflects CrCHO2 different from CrCHO1; * reflects CrCHO2 different from Cr and CrCHO1; † reflects CrPAC different from Cr and CrCHO1; § reflects CrCHO2 different from Cr; ‡ reflects CrPAC different from Cr; ◊ reflects CrPAC different from CrCHO1 at designated individual study timepoints. The level of significant difference is depicted by one, two or three symbols: p<0.05, p<0.01, and p<0.001, respectively.
Muscle total creatine content
Muscle TCr content in each intervention group over the course of the study is depicted in Figure 4. Both Group (p<0.05) and time (p<0.001) effects were observed. In the Cr supplemented group, muscle TCr content had increased from baseline (day 0) after 5 days supplementation (p<0.001) and had increased further after 33 days supplementation (p<0.001 vs. baseline and p<0.05 vs. after 5 days). At this time-point, muscle TCr content had increased by >20 mmol kg−1 dm in seven of the eight volunteers in this study intervention group. In the CrCHO group, muscle TCr content had also increased from baseline after 5 days supplementation (p<0.001). Furthermore, when Cr and dextrose ingestion was continued for a further 28 days (albeit at considerably lower daily doses; CrCHO2), muscle TCr content remained elevated above the baseline value (p<0.001), and was no different to the tissue content recorded after 5 days supplementation. In contrast, this elevated muscle TCr content seen after 5 days supplementation was not maintained after a further 28 days supplementation in the group CrCHO1 who ingested 5 g Cr only per day during this period (p>0.05 vs. baseline). Finally, in the CrPAC group muscle TCr content increased from baseline after 5 days supplementation (p<0.05) and this content was maintained after 33 days supplementation (p<0.01 vs. baseline).
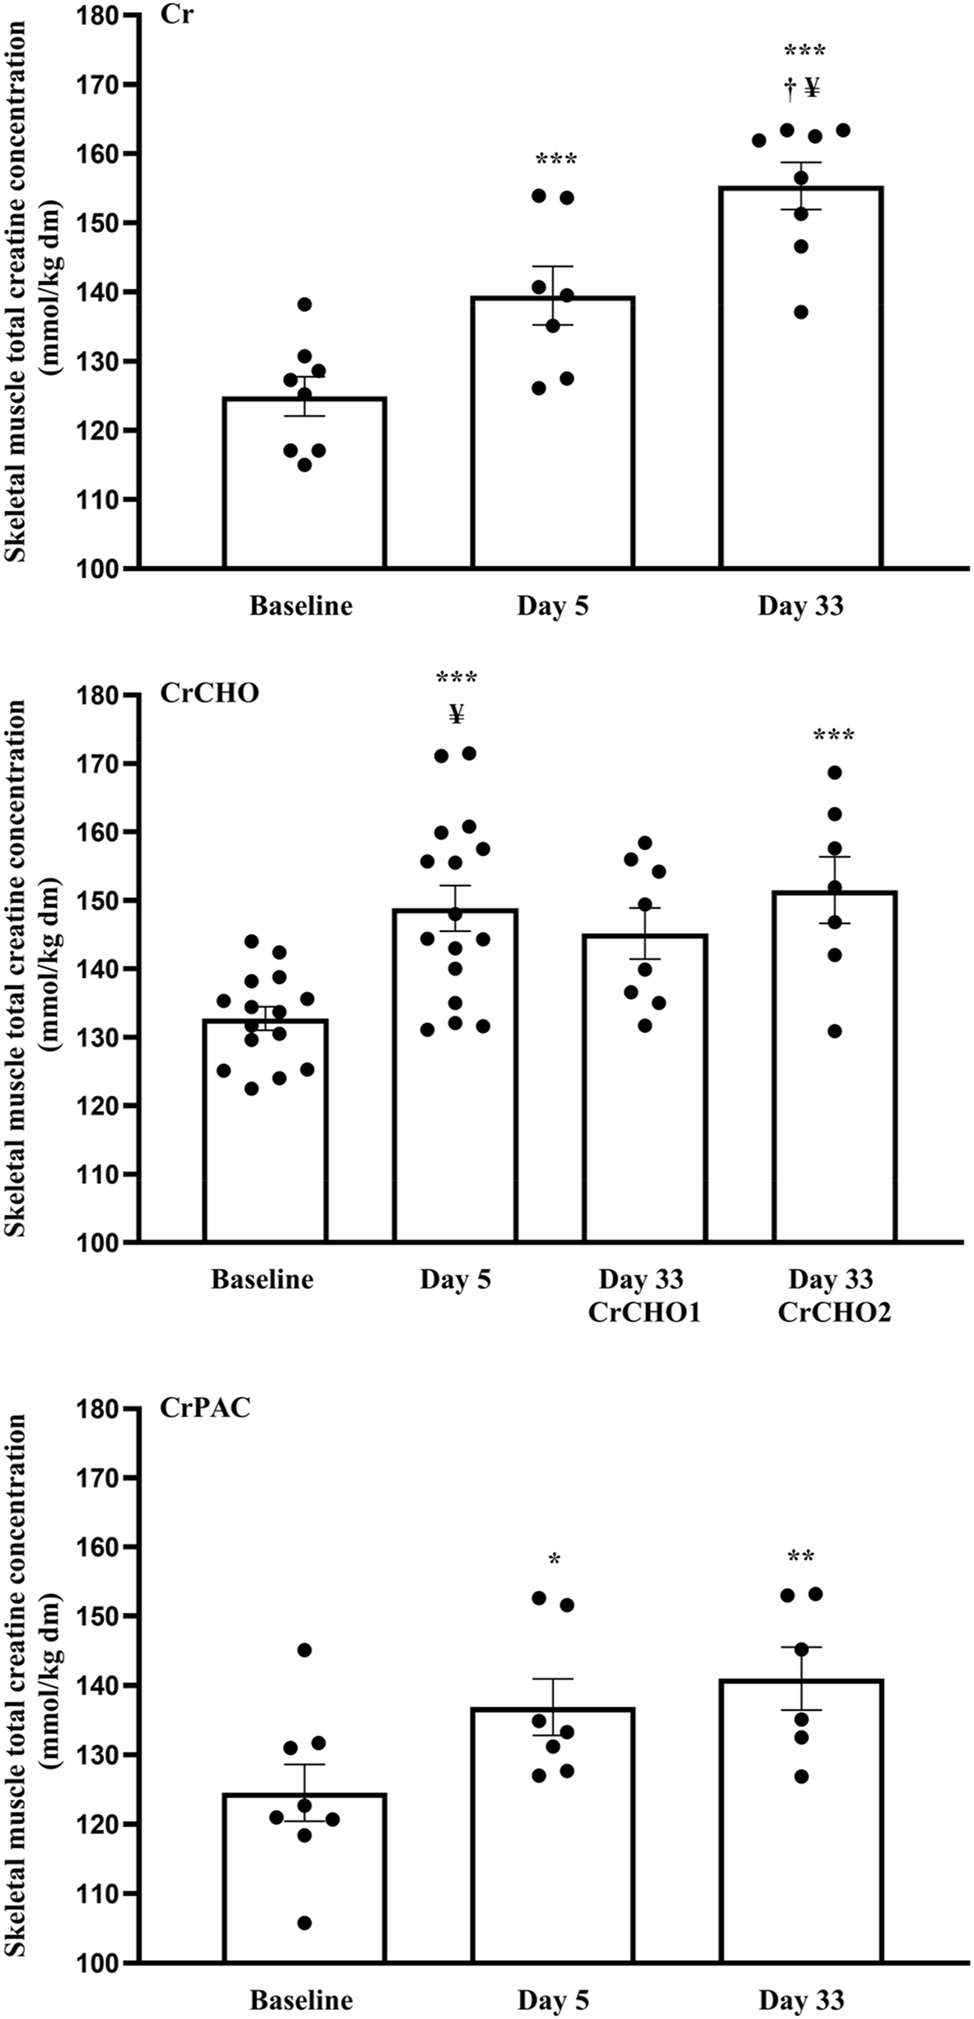
Muscle total creatine content at baseline (0 days) and following 5 and 33 days of supplementation with: Cr (4 × 5 g Cr per day for 5 days, followed by 5 g Cr per day for a further 28 days); CrCHO1 (4 × 5 g Cr per day + 95 g of dextrose for 5 days, followed by 5 g Cr per day for a further 28 days); CrCHO2 (4 × 5 g Cr per day + 95 g of dextrose for 5 days, followed by 5 g Cr + 95 g of dextrose per day for a further 28 days); CrPAC (4 × 5 g Cr per day + 14 g protein hydrolysate, 7 g phenylalanine, 7 g leucine, and 57 g dextrose, followed by 5 g Cr per day + 14 g protein hydrolysate, 7 g phenylalanine, 7 g leucine, and 57 g dextrose for a further 28 days). * (p<0.05), ** (p<0.01), *** (p<0.001) represent greater than the value at day 0 within the same study group. † (p<0.05) represents greater compared to day 5 within the same study group. ¥ (p<0.05) represents greater compared to CrPAC at that specific time-point.
Between group analysis revealed no differences in muscle TCr content at baseline (day 0). Following 5 days supplementation, muscle TCr content in the CrCHO group (148.9±3.4 mmol kg−1 dm) was greater compared to the CrPAC group (138.4±4.5 mmol kg−1 dm, p<0.05), and tended to be greater compared to the Cr group (139.5±4.2 mmol kg−1, p=0.089). After a further 28 days supplementation, muscle TCr content was greater in the Cr group (154.3±3.5 mmol kg−1 dm) compared to the CrPAC group (141.0±4.5 mmol kg−1 dm, p<0.05). Muscle TCr was also greater, on average, in the CrCHO2 group (151.5±5.1 mmol kg−1 dm) compared to CrPAC after 33 days supplementation, but this did not reach statistical significance.
Muscle PCr and free Cr content at each time-point within each study group is depicted in Table 3 for reference purposes. In the case of both, no between treatment effects were observed, but time effects were evident.
Muscle phosphocreatine (PCr) and free creatine (Cr) content at baseline (0 days) and following 5 and 33 days of supplementation with: Cr (4 × 5 g Cr per day for 5 days, followed by 5 g Cr per day for a further 28 days); CrCHO1 (4 × 5 g Cr per day + 95 g of dextrose for 5 days, followed by 5 g Cr per day for a further 28 days); CrCHO2 (4 × 5 g Cr per day + 95 g of dextrose for 5 days, followed by 5 g Cr + 95 g of dextrose per day for a further 28 days); CrPAC (4 × 5 g Cr per day + 14 g protein hydrolysate, 7 g phenylalanine, 7 g leucine, and 57 g dextrose, followed by 5 g Cr per day + 14 g protein hydrolysate, 7 g phenylalanine, 7 g leucine, and 57 g dextrose for a further 28 days).* (p<0.05), ** (p<0.01), *** (p<0.001) represent greater than the value at day 0 within the same study group. †† (p<0.01) represents greater compared to day 5 within the same study group.
| PCr, mmol·kg−1 dm | Free Cr, mmol·kg−1 dm | |||||||
|---|---|---|---|---|---|---|---|---|
| Group | 0 days | 5 days | 33 days | 0 days | 5 days | 33 days | ||
| Cr | 75.3 ± 2.1 | 81.4 ± 4.4 | 86.6 ± 2.2** | 49.1 ± 2.2 | 58.0 ± 1.3* | 67.8 ± 3.1***†† | ||
| CrCHO | 81.4 ± 1.6 | 86.1 ± 2.7 | CrCHO1 | 84.7 ± 2.3 | 51.4 ± 1.8 | 62.8 ± 2.4*** | CrCHO1 | 59.0 ± 3.2 |
| CrCHO2 | 90.0 ± 3.6 | CrCHO2 | 61.5 ± 2.9*** | |||||
| CrPAC | 75.3 ± 2.4 | 81.3 ± 3.9* | 83.8 ± 2.6 | 50.5 ± 4.8 | 57.1 ± 3.2 | 57.2 ± 3.4 | ||
Muscle creatine transporter mRNA expression
Due to muscle tissue availability being limited (complete data sets: n=3 for the Cr group; n=11 for the CrCHO group; n=4 for the CrPAC group), muscle creatine transporter mRNA expression data were pooled to allow quantification of the impact of acute and longer-term Cr supplementation on muscle Cr transporter mRNA expression (n=18 full data sets, 54 muscle biopsies). Following 5 days supplementation, during which all intervention groups experienced a significant increase in muscle TCr content, muscle Cr transporter mRNA expression had increased 1.23 fold relative to baseline (Figure 5). Furthermore, this fold change in mRNA expression was inversely associated with the increase in muscle TCr content from baseline following 5 days supplementation (n=21, r=0.502, p<0.05). Following 33 days supplementation, the fold change from baseline in muscle Cr transporter mRNA expression appeared to have declined and was lower compared to after 5 days supplementation (p<0.01, Figure 5).
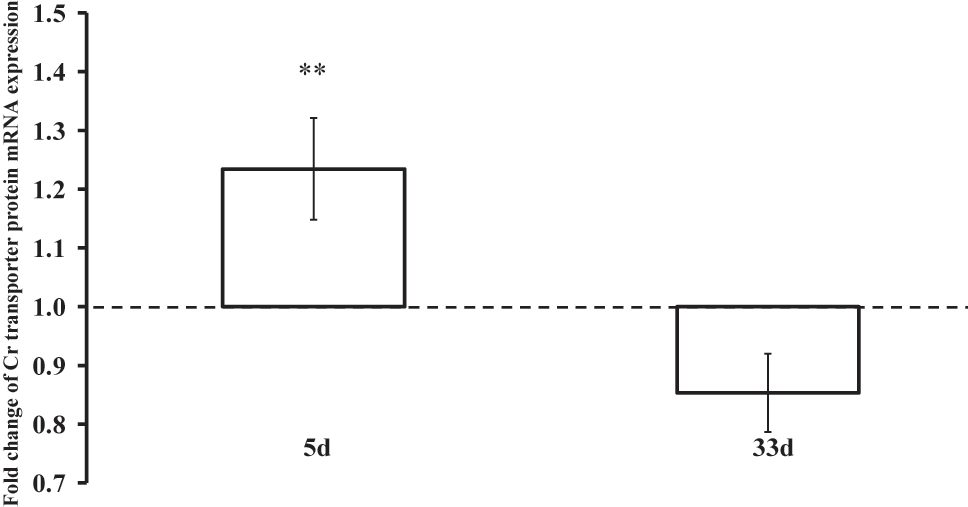
Fold change in muscle creatine transporter mRNA expression relative to baseline expression (day 0, dotted line) following 5 and 33 days of dietary Cr supplementation. **(p<0.01) represents difference in fold change expression from baseline after 5 vs. 33 days supplementation.
Discussion
It is well documented that short term dietary ingestion of Cr (∼20 g per day for 5–7 days) increases skeletal muscle TCr stores in healthy humans [1, 5, 6, 10], and can be augmented when Cr is combined with ingestion of carbohydrate and/or protein [5, 6, 8] to stimulate insulin mediated muscle creatine accumulation [7]. Despite the well documented positive effects of dietary Cr supplementation on exercise performance (for example see reviews 2, 3, 4), few studies have investigated the longer-term impact of Cr supplementation on muscle TCr content following an initial muscle Cr loading phase (4 × 5 g of Cr ingested per day), and those that have presented contrasting findings 10], [11], [12], [13. Furthermore, it has been suggested that such longer-term dietary Cr supplementation may reduce muscle Cr transporter protein in human skeletal muscle [14], which may be detrimental to metabolic and physiological function. Therefore, in this study we aimed to generate novel insight regarding the impact of different acute and longer-term dietary Cr supplementation regimens on muscle TCr accumulation in healthy volunteers. We also aimed to quantify the impact of acute and longer-term Cr supplementation on muscle Cr transporter mRNA expression in healthy volunteers, given the paucity of data on this topic. Such awareness is of importance from a translational perspective given muscle metabolic [18] and exercise performance 19], [20], [21 gains resulting from dietary Cr supplementation appear to be most evident when a high muscle TCr content is achieved, and the likelihood of a ‘non-response’ is minimized [5].
We report here that following an initial period of muscle Cr loading (4 × 5 g per day for 5 days), continued ingestion of Cr for a further 28 d at a lower dose of 5 g per day increased muscle TCr content above that observed after 5 days (Figure 4). Moreover, this magnitude of increase in muscle TCr content after 33 days was equivalent to that observed when Cr was ingested with a large bolus of simple sugars for 5 days to augment muscle Cr accumulation (Figure 4). Of note, two volunteers in the group that ingested Cr alone demonstrated an increase in muscle TCr content of greater than 20 mmol kg−1 dm after 5 days supplementation. However, this occurred in seven of the eight volunteers after day 33, which confirms that the rate of muscle Cr accumulation varies significantly between individuals [1, 19], but also importantly that the majority of individuals eventually respond to Cr feeding to the same extent when ingestion is maintained at a rate of 5 g per day. This finding is of significant practical importance, as it highlights an effective and simple strategy to increase muscle TCr content above 20 mmol kg−1 dm, which is the magnitude of accumulation that has been reported to be associated with enhanced explosive, high-intensity exercise performance 19], [20], [21 and increased post-exercise muscle PCr resynthesis [18]. Contrary to the present findings however, it has also been reported that dietary Cr feeding at the rate of 25 g per day for 7 days, and 5 g per day thereafter for 11 weeks (in conjunction with a heavy resistance exercise training protocol) was not effective at maintaining elevated muscle TCr content [13]. This anomaly is not easy to explain, even for volunteers with a body mass greater than in the current study [13], as a 5 g bolus will provide Cr at more than double the accepted rate of muscle Cr degradation to creatinine. Indeed, the ingestion of 2 or 5 g Cr per day for 30 or 60 days (following a conventional acute muscle Cr loading phase) has been shown to maintain an elevated muscle TCr content in healthy volunteers [10, 11].
The current findings confirm the ingestion of 4 × 5 g of Cr with ∼95 g of simple carbohydrates for 5 days increased muscle TCr content to ∼150 mmol kg−1 dm as shown previously [5], which is close to the maximum level of muscle TCr accumulation customarily reported during Cr feeding [1, 5, 10]. For the first time, we show that it is important to continue ingesting 5 g of Cr per day along with ∼95 g of simple carbohydrates to maintain this high muscle TCr content after 33 days (CrCHO2, Figure 4). Indeed, the ingestion of 5 g of Cr alone for a further 28 days following the ingestion of 4 × 5 g of Cr with ∼95 g of simple carbohydrates for 5 days resulted in a failure to maintain muscle TCr content significantly greater than at baseline (CrCHO1). The mechanistic basis of this observation is unclear and may be related to low study sample size, but from a practical stand-point the data suggest ingesting dietary Cr supplements along with simple sugars following a loading phase involving Cr and simple carbohydrate ingestion.
We confirm here that ingesting more tolerable quantities of carbohydrate along with protein and relatively small quantities of insulin potentiating amino acids (leucine and phenylalanine; CrPAC) was as effective at elevating serum insulin concentration as that observed with a bolus of 95 g simple sugars (Figure 2). However, muscle TCr content following 5 days of CrPAC ingestion was less than that observed when each 4 × 5 g Cr bolus was ingested alongside 95 g simple sugars over the same period (138.4±4.5 vs. 148.9±3.4 mmol kg−1 dm, respectively, p<0.05), and no greater than when 4 × 5 g Cr alone was ingested for 5 days (139.5±4.2 mmol kg−1 dm, Figure 4). Furthermore, continued ingestion of 5 g Cr per day plus 14 g protein hydrolysate, 7 g phenylalanine, 7 g leucine, and 57 g dextrose for a further 28 days was not effective at increasing muscle TCr content any further. Indeed, after 33 days supplementation muscle TCr content was less than the group that ingested Cr alone (p<0.05). This clearly presents something of an anomaly. Published data from this laboratory [9] has demonstrated that ingestion of the same CrPAC supplement used in the present study resulted in significantly less urinary Cr excretion compared to ingesting Cr alone. A serum insulin concentration above 50mU/L has been shown to stimulate muscle Cr accumulation in vivo in humans [7], and in the present study serum insulin concentration was increased to a physiologically high concentration with the CrPAC formulation for extended periods of time post-ingestion. Indeed, the increase in serum insulin concentration with the CrPAC formulation was equal, or greater, than the response observed each 4 × 5 g Cr bolus was ingested alongside 95 g simple sugars, where muscle Cr accumulation was augmented (Figure 4). Furthermore, this increase in serum insulin concentration with the CrPAC formulation, occurred concurrently with a blunting of the increase in plasma Cr concentration (Figure 3), which we have previously shown to closely correlate with skeletal muscle Cr accumulation, at least when Cr alongside 95 g of simple sugars was ingested [5]. It would appear therefore that the blunted plasma Cr responses with the CrPAC formulation, in conjunction with the smaller than expected increase in muscle TCr content, most likely reflect decreased intestinal absorption of Cr following its ingestion. This we propose may have been a consequence of nausea experienced by volunteers in this supplement group. All volunteers were asked to report adverse effects following supplement ingestion, and three of eight participants in the CrPAC group reported nausea symptoms during the loading phase soon after consumption of each supplement bolus, which persisted for two volunteers throughout the whole study. This is perhaps not surprising given ingestion of 10 g of phenylalanine has been reported to result in nausea symptoms [27], and a supplement similar in composition to the CrPAC formulated used in the present study was reported not to be well tolerated [28].
Muscle Cr transporter mRNA expression increased on average 1.23 fold from baseline following 4 × 5 g Cr ingestion per day for 5 days (pooled data), which was greater than the modest change in mRNA expression from baseline over 33 days (p<0.01, Figure 5). These small responses are in keeping with the findings of Tarnopolsky et al. [17], where no change in Cr transporter mRNA content was observed of the after 8–9 days of Cr supplementation. Perhaps of note, the increase in muscle TCr content over the initial 5 days of Cr supplementation was inversely associated with the fold-change in Cr transporter mRNA expression (r=0.502, n=21, p<0.05), i.e. the greater the increase in muscle TCr concentration the smaller the change in the Cr transporter mRNA expression. This may suggest that during the initial few days Cr ingestion (4 × 5 g per day), when muscle accumulation is greatest [1], the presence of a high plasma Cr concentration and increased muscle Cr flux may up-regulate Cr transporter mRNA expression, which is subsequently down-regulated as the muscle Cr store reaches capacity. Extracellular Cr concentration and intramuscular TCr have been shown to be determinants of muscle Cr transport in vitro [29] and in vivo [1], respectively. It would be of interest to investigate more closely the temporal relationship between plasma Cr concentration, muscle Cr accumulation and Cr transporter mRNA and protein expression during acute Cr feeding.
Limitations
All dietary supplements across the course of the study were ingested at least 2 h before and following food consumption to alleviate the effects of food ingestion on Cr absorption and pancreatic insulin release. Furthermore, no volunteer was involved in an exercise training regimen, given it could have impacted on muscle Cr accumulation [1, 30]. Nevertheless, monitoring of physical activity levels and collection of diet diaries may have been beneficial in providing some insight regarding the variation in muscle TCr accumulation observed between volunteers and over the course of the 33 days of supplement ingestion.
This study required 32 healthy, non-vegetarian, male volunteers to undergo three muscle biopsies over the course of the 34 days of highly coordinated dietary supplement ingestion. Despite the low analytical variation in the end point measures (all <4 %), it is recognised that the relatively low sample size was a limitation of the study, particularly in the CrPAC group in which one volunteer withdrew after the first day of supplementation, and a second volunteer after 5 days (end of loading phase).
Conclusions
In keeping with published data to date the ingestion of 4 × 5 g Cr per day for 5 days increased muscle TCr content in healthy, young volunteers. Continued ingestion of 5 g Cr per day for a further 28 days increased muscle TCr accumulation to the reported maximum content in human skeletal muscle of 150 mmol kg−1 dm. This highlights a Cr supplementation strategy for individuals wishing to maximise muscle Cr accumulation, whilst avoiding the ingestion of a large quantity of simple sugars undertaken to stimulate insulin mediated augmentation of muscle Cr accumulation over a 5 day period of muscle Cr loading. Nevertheless, ingestion of Cr alone will take longer to achieve the same magnitude of muscle accumulation compared to the ingestion of Cr in tandem with simple sugars. For the first time we show that an increase in muscle TCr content to 150 mmol kg−1 dm achieved by ingesting 4 × 5 g Cr per day in tandem with 95 g of dextrose can be sustained for a further 28 days by ingesting 5 g Cr plus 95 g of dextrose per day. If this maintenance strategy is not undertaken, muscle TCr may decline over 28 days even when 5 g Cr per day is ingested. The mechanistic basis of this is observation is unclear and may be explained by low sample size. Somewhat unexpectedly, the ingestion of a protein, amino acid and simple carbohydrate formulation, that was as effective at increasing serum insulin concentration as ingesting 95 g of dextrose, did not increase muscle Cr accumulation to the same extent. Finally, muscle Cr transporter mRNA expression changes modestly during dietary Cr ingestion, but the increase in muscle TCr content over 5 days supplementation (4 × 5 g Cr per day) was inversely associated with the fold-change in Cr transporter mRNA expression seen over this period (r=0.502, n=21, p<0.05). From a practical standpoint, it would appear that if a rapid increase in muscle TCr content is desired by a volunteer in an effort to quickly maximise functional and metabolic gains associated with dietary Cr supplementation, then each 5 g bolus of Cr should be ingested alongside 95 g of simple sugars. Continued consumption of this formulation, albeit at a reduced frequency, will maintain muscle TCr content close to an average maximum of 150 mmol kg−1 dm. Ingestion of Cr alone will however reach this maximum muscle TCr content, but will take longer to achieve.
Acknowledgments
This study was supported by Iovate Health Sciences Research Inc. The authors would like to thank the volunteers and staff of the David Greenfield Human Physiology Laboratory at the University of Nottingham.
-
Research ethics: This study was approved by the University of Nottingham Medical School Research Ethics Committee in accordance with the Declaration of Helsinki.
-
Informed consent: Informed consent was obtained from all individuals included in this study.
-
Author contributions: All authors have accepted responsibility for the entire content of this manuscript and approved its submission.
-
Use of Large Language Models, AI and Machine Learning Tools: None used.
-
Conflict of interest: The authors state no conflict of interest.
-
Research funding: This study was supported by the Iovate Health Sciences Research Inc.
-
Data availability: The datasets generated and/or analyzed during the current study are available from the corresponding author on reasonable request.
References
1. Harris, RC, Soderlund, K, Hultman, E. Elevation of creatine in resting and exercised muscle of normal subjects by creatine supplementation. Clin Sci 1992;83:367–74. https://doi.org/10.1042/cs0830367.Search in Google Scholar PubMed
2. Wyss, M, Kaddurah-Daouk, R. Creatine and creatinine metabolism. Physiol Rev 2000;80:1107–213. https://doi.org/10.1152/physrev.2000.80.3.1107.Search in Google Scholar PubMed
3. Casey, A, Greenhaff, PL. Does dietary creatine supplementation play a role in skeletal muscle metabolism and performance? Am J Clin Nutr 2000;72:607S–17S. https://doi.org/10.1093/ajcn/72.2.607s.Search in Google Scholar PubMed
4. Antonio, J, Candow, DG, Forbes, SC, Gualano, B, Jagim, AR, Kreider, RB, et al.. Common questions and misconceptions about creatine supplementation: what does the scientific evidence really show? J Int Soc Sports Nutr 2021;18:13. https://doi.org/10.1186/s12970-021-00412-w.Search in Google Scholar PubMed PubMed Central
5. Green, AL, Hultman, E, MacDonald, IA, Sewell, DA, Greenhaff, PL. Carbohydrate ingestion augments skeletal muscle creatine accumulation during creatine supplementation in humans. Am J Physiol 1996;271:E821–6. https://doi.org/10.1152/ajpendo.1996.271.5.e821.Search in Google Scholar
6. Green, AL, Simpson, EJ, Littlewood, JJ, MacDonald, IA, Greenhaff, PL. Carbohydrate ingestion augments creatine retention during creatine feeding in humans. Acta Physiol Scand 1996;158:195–202. https://doi.org/10.1046/j.1365-201x.1996.528300000.x.Search in Google Scholar PubMed
7. Steenge, GR, Lambourne, J, Casey, A, MacDonald, IA, Greenhaff, PL. Stimulatory effect of insulin on creatine accumulation in human skeletal muscle. Am J Physiol 1998;275:E974–9. https://doi.org/10.1152/ajpendo.1998.275.6.e974.Search in Google Scholar
8. Steenge, GR, Simpson, EJ, Greenhaff, PL. Protein- and carbohydrate-induced augmentation of whole body creatine retention in humans. J Appl Physiol 2000;89:1165–71. https://doi.org/10.1152/jappl.2000.89.3.1165.Search in Google Scholar PubMed
9. Pittas, G, Hazell, MD, Simpson, EJ, Greenhaff, PL. Optimization of insulin-mediated creatine retention during creatine feeding in humans. J Sports Sci 2010;28:67–74. https://doi.org/10.1080/02640410903390071.Search in Google Scholar PubMed
10. Hultman, E, Soderlund, K, Timmons, JA, Cederblad, G, Greenhaff, PL. Muscle creatine loading in men. J Appl Physiol 1996;81:232–7. https://doi.org/10.1152/jappl.1996.81.1.232.Search in Google Scholar PubMed
11. Preen, D, Dawson, B, Goodman, C, Beilby, J, Ching, S. Creatine supplementation: a comparison of loading and maintenance protocols on creatine uptake by human skeletal muscle. Int J Sport Nutr Exerc Metabol 2003;13:97–111. https://doi.org/10.1123/ijsnem.13.1.97.Search in Google Scholar PubMed
12. van Loon, LJC, Oosterlaar, AM, Hartgens, F, Hesselink, MKC, Snows, RJ, Wagenmakers, AJM. Effects of creatine loading and prolonged creatine supplementation on body composition, fuel selection, sprint and endurance performance in humans. Clin Sci 2003;104:153–62. https://doi.org/10.1042/cs20020159.Search in Google Scholar PubMed
13. Volek, JS, Duncan, ND, Mazzetti, SA, Staron, RS, Putukian, M, Gomez, AL, et al.. Performance and muscle fibre adaptations to creatine supplementation and heavy resistance training. Med Sci Sports Exerc 1999;31:1147–56. https://doi.org/10.1097/00005768-199908000-00011.Search in Google Scholar PubMed
14. Terjung, RL, Clarkson, P, Eichner, ER, Greenhaff, PL, Hespel, PJ, Israel, RG, et al., American College of Sports Medicine roundtable. The physiological and health effects of oral creatine supplementation. Med Sci Sports Exerc 2000;32:706–17. https://doi.org/10.1097/00005768-200003000-00024.Search in Google Scholar PubMed
15. Loike, JD, Zalutsky, DL, Kaback, E, Miranda, AF, Silverstein, SC. Extracellular creatine regulates creatine transport in rat and human muscle cells. Proc Natl Acad Sci USA 1988;85:807–11. https://doi.org/10.1073/pnas.85.3.807.Search in Google Scholar PubMed PubMed Central
16. Guerrero-Ontiveros, LM, Walliman, T. Creatine supplementation in health and disease. Effects of chronic creatine ingestion in vivo: downregulation of the expression of creatine transporter isoforms in skeletal muscle. Mol Cell Biochem 1998;184:427–37. https://doi.org/10.1007/978-1-4615-5653-4_30.Search in Google Scholar
17. Tarnopolsky, M, Parise, G, Fu, M-H, Brose, A, Parshad, A, Speer, O, et al.. Acute and moderate-term creatine monohydrate supplementation does not effect creatine transporter mRNA or protein content in either young or elderly humans. Mol Cell Biochem 2003;244:159–66.10.1007/978-1-4615-0247-0_24Search in Google Scholar
18. Greenhaff, PL, Bodin, K, Soderlund, K, Hultman, E. Effect of oral creatine supplementation on skeletal muscle phosphocreatine resynthesis. Am J Physiol 1994;266:E275–30. https://doi.org/10.1152/ajpendo.1994.266.5.e725.Search in Google Scholar PubMed
19. Casey, A, Constantin-Teodosiu, D, Howell, S, Hultman, E, Greenhaff, PL. Creatine ingestion favorably affects performance and muscle metabolism during maximal exercise in humans. Am J Physiol 1996;271:E31–7. https://doi.org/10.1152/ajpendo.1996.271.1.e31.Search in Google Scholar PubMed
20. Syrotuik, DG, Bell, GJ. Acute creatine monohydrate supplementation: a descriptive physiological profile of responders vs. nonresponders. J Strength Cond Res 2004;18:610–7. https://doi.org/10.1519/00124278-200408000-00039.Search in Google Scholar
21. Bemben, MG, Lamont, HS. Creatine supplementation and exercise performance: recent findings. Sports Med 2005;35:107–25. https://doi.org/10.2165/00007256-200535020-00002.Search in Google Scholar PubMed
22. Bergstrom, J. Muscle electrolytes in man. Determination by neutron activation analysis on needle biopsy specimens. A study on normal subjects, kidney patients and patients with chronic diarrhoea. Scand J Clin Invest 1962;14:l–110.Search in Google Scholar
23. Gallen, IW, Macdonald, IA. Effect of two methods of heating on body temperature, forearm blood flow, and deep venous oxygen saturation. Am J Physiol 1990;259:E639–43. https://doi.org/10.1152/ajpendo.1990.259.5.e639.Search in Google Scholar PubMed
24. Dunnett, M, Harris, RC, Orme, CE. Reverse-phase ion-pairing high-performance liquid chromatography of phosphocreatine, creatine and creatinine in equine muscle. Scand J Clin Invest 1991;51:137–41. https://doi.org/10.3109/00365519109091099.Search in Google Scholar
25. Harris, RC, Hultman, E, Glycogen, NL-O. Glycolytic intermediates and high-energy phosphates determined in biopsy samples of the musculus quadriceps femoris of man at rest. Methods and variance of values. Stand J Clin Lab Invest 1974;33:109–20.10.1080/00365517409082477Search in Google Scholar
26. Schmittgen, TD, Zakrajsek, BA, Mills, AG, Gorn, V, Singer, MJ, Reed, MW. Quantitative reverse transcription-polymerase chain reaction to study mRNA decay: comparison of endpoint and real-time methods. Anal Biochem 2000;285:194–204. https://doi.org/10.1006/abio.2000.4753.Search in Google Scholar PubMed
27. Kirch, ER, Kesel, RG, O’Donnell, JF, Wach, EC. Influence of ingestion of single amino acids on the level of free amino acids in human saliva. J Dent Res 1953;32:57–60. https://doi.org/10.1177/00220345530320011801.Search in Google Scholar PubMed
28. van Loon, LJC, Saris, WHM, Verhagen, H, Wagenmakers, AJM. Plasma insulin responses after ingestion of different amino acid or protein mixtures with carbohydrate. Am J Clin Nut 2000;72:96–105. https://doi.org/10.1093/ajcn/72.1.96.Search in Google Scholar PubMed
29. Fitch, CD, Shields, RP. Creatine metabolism in skeletal muscle. I. Creatine movement across muscle membranes. J Biol Chem 1966;241:3611–4. https://doi.org/10.1016/s0021-9258(18)99874-1.Search in Google Scholar
30. Robinson, TM, Sewell, DA, Hultman, E, Greenhaff, PL. Role of submaximal exercise in promoting creatine and glycogen accumulation in human skeletal muscle. J Appl Physiol 1999;87:598–604. https://doi.org/10.1152/jappl.1999.87.2.598.Search in Google Scholar PubMed
Supplementary Material
This article contains supplementary material (https://doi.org/10.1515/teb-2024-0032).
© 2024 the author(s), published by De Gruyter on behalf of Shangai Jiao Tong University and Guangzhou Sport University
This work is licensed under the Creative Commons Attribution 4.0 International License.
Articles in the same Issue
- Frontmatter
- Issue 3: Skeletal muscle, exercise, aging and chronic disease
- Section: Integrated exercise physiology, biology, and pathophysiology in health and disease
- Impact of exercise and fasting on mitochondrial regulators in human muscle
- Effectiveness of aerobic exercise interventions on balance, gait, functional mobility and quality of life in Parkinson’s disease: an umbrella review
- Creatine and strength training in older adults: an update
- Creatine supplementation strategies aimed at acutely increasing and maintaining skeletal muscle total creatine content in healthy, young volunteers
- Section: Physical activity/inactivity and health across the lifespan
- Independent mobility and physical activity among children residing in an ultra-dense metropolis
- Physical activity and cardiometabolic risk factors in sprint and jump-trained masters athletes, young athletes and non-physically active men
- Cross-sectional analysis of blood leukocyte responsiveness to interleukin-10 and interleukin-6 across age and physical activity level
- Section: Exercise and E-health, M-health, AI and technology
- Assessing core body temperature in a cool marathon using two pill ingestion strategies
- Issue 4: Preclinical and clinical approaches to translational exercise biomedicine
- Section: Integrated exercise physiology, biology, and pathophysiology in health and disease
- Nicotinic acid improves mitochondrial function and associated transcriptional pathways in older inactive males
- Exogenous Beta-guanidinopropionic acid administration enhances electromyostimulation-induced mitochondrial biogenesis in rat skeletal muscle
- How exercise shapes the anti-inflammatory environment in multiple sclerosis – a conceptual framework focusing on tryptophan-derived molecules in T cell differentiation
- Section: Personalized and advanced exercise prescription for health and chronic diseases
- Acute effects of high-intensity interval training on microvascular circulation: a case control study in uveal melanoma
- Discrepancies in walking speed measurements post-bed-rest: a comparative analysis of real-world vs. laboratory assessments
- Section: Sports medicine and movement science
- Lower-body strength, power and sprint front crawl performance
- Section: Letter to the editor
- Comment on: “A unique pseudo-eligibility analysis of longitudinal laboratory performance data from a transgender female competitive cyclist”
- Author’s response to “letter to the editor comment on: ‘A unique pseudo-eligibility analysis of longitudinal laboratory performance Data from a transgender female competitive cyclist’” by Lundberg, O’Connor, Kirk, Pollock, and Brown