Opioid prescribing habits differ between Denmark, Sweden and Norway – and they change over time
-
Lene Jarlbaek


Abstract
Background and aims
The medical use of opioids in different countries is often subject to public concern and debate, frequently based on rough figures from prescription databases made for registration of consumption. However, public access to some of these databases allow for further exploration of the prescription data, which can be processed to increase knowledge and insight into national opioid prescribing-behavior. Denmark, Sweden and Norway are considered closely related with regard to health care and culture. So, this study aims to provide a more detailed picture of opioid prescribing and its changes in the three Scandinavian countries during 2006–2014, using public assessable prescription data.
Methods
Data on dispensed opioid prescriptions (ATC; N02A, and R05DA04) were downloaded from each country’s prescription-databases. The amounts of dispensed opioids were used as proxy for consumption or use of opioids. Potential differences between dispensed prescriptions and actual use cannot be drawn from these databases. Consumption-data were converted from defined daily doses (DDDs) to mg oral morphine equivalents (omeqs). Changes in the choice of opioid-types, consumption and number of users were presented using descriptive statistics and compared.
Results
Opioid users: during the whole period, Norway had the highest, and Denmark the lowest, number of opioid users/1,000 inhabitants. From 2006 to 2014 the numbers of users/1,000 inhabitants changed from 98 to 105 in Norway, from 66 to 75 in Denmark, and from 79 to 78 in Sweden. Opioid consumption/1,000 inhabitants: The results depended much on the unit of measurement. The differences between the countries in consumption/1,000 inhabitants were small when DDDs was used as unit, while using mg omeqs significant differences between the countries appeared. Denmark had a much higher consumption of omeqs per 1,000 inhabitants compared to Sweden and Norway. Opioid consumption/user: during the whole period, Norway had the lowest, and Denmark the highest consumption/user. In 2006, the annual average consumption/user was 1979, 3615, 6025 mg omeq/user in Norway, Sweden and Denmark, respectively. In 2014 the corresponding consumption was 2426, 3473, 6361 mg omeq/user. The preferred choices of opioid-types changed during the period in all three countries. The balance between use of weak or strong opioids showed more prominent changes in Norway and Sweden compared to Denmark.
Conclusions
This study has shown how public assessable opioid prescription data can provide insight in the doctors’ prescribing behavior, and how it might change over time. The amounts of dispensed opioids, opioid prescribing habits and changes were compared between the countries, and significant differences appeared. Within each country, the overall picture of opioid consumption appeared rather stable.
Implications
Studies like this can contribute to qualify the ongoing debates of use of opioids in different nations and to monitor effects of initiatives taken by health-care authorities and health-care policy-makers.
1 Introduction
The medical use of opioids in different countries is often subject to public debate and concern, both in the individual countries and in comparisons between countries. The discussions often reflect differing views for or against [1], [2] the use of opioids in pain relief in different patient populations or different pain settings while referring to the same bottom-line results from drug use statistics. Bearing in mind the potential for serious side effects and risks, but also the favorable effects and gains of using opioids, it is important that discussions concerning the use of opioids and policy making are based on the best possible evidence. Changes in opioid use statistics can appear more or less dramatic depending on the time periods and/or the types of opioids chosen for presentation. Latest, the “opioid epidemic” or “opioid crisis” in USA are intensely debated on the basis of aggregated prescription data of changes in opioid use in USA linked with opioid misuse, increased numbers of deaths among drug addicts [3], [4] and with opioids used in the treatment of chronic non-malignant pain [5]. This has occasionally led to scare campaigns against the use of opioids and stigmatizing of opioid prescribing doctors [6], and harmful tapering of patients in stable opioid use [7]. According to the International Narcotics Control Board (INCB) [8] USA has a leading position for consumption of narcotic drugs per million inhabitants, but the Scandinavian countries are close behind, with Denmark as no. 5, Norway as no. 15 and Sweden as no. 19 in the world. Discussions of how to prescribe and use opioids based on statistics like INCB are undesirable [9]. However, important knowledge on the opioid prescribing behavior can still be drawn from detailed and public assessable information enclosed in other national prescription-databases. When aggregated opioid prescription data are used for comparisons between countries or among selected patient populations it is important to consider at least two factors in order to reduce the risk of serious flaws in the interpretations and conclusions (the risk of the ecological fallacy [10]). These factors are; (1) the potencies of the different prescribed opioid types, and (2) differences in the doctors’ preferences with regard to choices of opioid types. The underlying reason for this is the pharmacology of the chemically different opioids, which all are defined by their μ-receptor agonist action but with different potencies and pharmacokinetics, resulting in large differences in equianalgesic doses between different opioid types.
This study explores national trends and changes in prescribing behavior in Denmark, Sweden and Norway by use of public assessable data on dispensed opioids. The aim is to demonstrate how these data can qualify and provide a deeper understanding of the mechanisms behind opioid prescribing and opioid use.
This study aims to:
Compare the amounts of dispensed opioids in Denmark, Sweden and Norway during 2006–2014, using public assessable information from each nation’s annual drug-use statistics.
Compare the opioid prescribing behavior in the three Scandinavian countries, and whether it has changed during 2006–2014
2 Methods
Each of the three Scandinavian countries has nationwide and complete prescription databases containing electronically submitted information of dispensed prescriptions [11]. Each country’s prescription database can be assessed on the internet, to obtain more detailed information on the annual amount of dispensed opioids, both with regard to opioid types and number of users. In this study, the amounts of dispensed opioids are used as proxy for the amounts of opioids used. Knowledge of the exact amounts of opioids prescribed and/or administered to the single users are not available in such databases. Information of the dispensed opioids from 2006 to 2014 was downloaded via the internet from the three databases [12], [13], [14]. The period was chosen to begin in 2006, because complete data were first assessable from July 2005 in the Swedish database [11]. Only data on opioids sold in the pharmacies were included, because this use can be linked to the number of users. The amount of opioids used in hospitals, which includes less than 5% of the total consumption, cannot be related to the number of users.
The different opioid types were identified in the prescription databases by their 7-digit ATC-code (Table 1). Opioids indicated for analgesia all start with N02A. Few other opioids are also relevant as analgesics – like methadone and codeine (ATC-code: R05DA04). These drugs are not routinely included in the usual opioid use statistics, because they are indicated for other conditions than analgesia. In this study, we only used data for N02A drugs, except in the presentation of the different opioid types’ proportions of the total volume, where R05DA04 – codeine was is included, because it is commonly used as an analgesic in Denmark, and to some extent in Norway. Opioids are classified in two groups – the weak and the strong opioids. Weak opioids are codeine, tramadol and dextropropoxyphene (blue color codes in Table 1), the remainders are strong opioids.
Opioids (N02A) registered in the three Nordic countries, with DDDs, equianalgesic potencies and conversion factors between DDDs and mg omeqs.
| Color code (Fig. 3) | Opioid-type (N02A) | mg/DDDa | Equianalgesic potency in relation to oral morphineb | Conversion factorc |
|---|---|---|---|---|
 |
N02AX02 Tramadol | 300 | 0.2 | 60 |
| N02AX52 (375 mg tramadol+325 mg paracetamol) | 150 | 0.2 | 30 | |
| N02AA59 Codeine comb. | 100 | 0.1 | 10 | |
| N02AA08 Dihydrocodeine | 150 | 0.1 | 15 | |
| N02AC04 Dextropropoxiphene | 300 | 0.15 | 45 | |
| N02AC54 Dextropropoxyphene comb. | 300 | 0.15 | 45 | |
| N02AA01 Morphine | 100 | 1 | 100 | |
| N02AG01 Morphine, comb (only for injection) | 10 | 3 | 30 | |
| N02AA05 Oxycodone | 75 | 1.5 | 112.5 | |
| N02AA55 Oxycodone comb. | 75 | 1.5 | 112.5 | |
| N02AB03 Fentanyl | 0.6 | 100 | 60 | |
| N02AE01 Buprenorphine | 1.2 | 75 | 90 | |
| N02AB01 Ketobemidone | 50 | 1 | 50 | |
| N02AG02 Ketobemidone, comb. | 25 | 1 | 25 | |
| N02AA03 Hydromorphone | 4 | 7.5 | 30 | |
| N02AA04 Nicomorphine | 30 | 1 | 30 | |
| N02AB02 Pethidine | 400 | 0.1 | 40 | |
| N02AD01 pentazocine | 200 | 0.17 | 34 | |
| N02AX06 Tapentadol | 400 | 0.33 | 132 |
-
amg pr DDD for each opioid are indexed in: http://www.whocc.no/atc_ddd_index/?code=N02A.
-
bEquianalgesic potencies between oral morphine and oral opioids, except for fentanyl and buprenorphine, where the potencies refer to the transdermal route and the sublingual route, respectively.
-
cThe conversion factors are the factors used for multiplication with the sold amounts of DDDs to estimate the sold amounts of mg oral morphine equivalents (see also Ref. [15]).
-
The color codes refer to Fig. 3 where the blue colors designate the weak opioids.
Annual values for; the number of opioid users per 1,000 inhabitants, the consumption of opioids per 1,000 inhabitants, and the average amount of opioids dispensed per user per day, were calculated. The size of the populations in the three countries were downloaded from public assessable demographic databases and shown in Table 2.
The populations and proportions of people aged 65 years or older in Denmark, Sweden and Norway – during 2006–2014.
| Year | Population | Persons 65+ | % of 65+ of population | Increase in 65+ since 2006 | % Increase in 65+ since 2006 |
|---|---|---|---|---|---|
| Denmark | |||||
| 2006 | 5,450,661 | 828,061 | 15 | 0 | 0.0 |
| 2007 | 5,468,120 | 842,492 | 15 | 14,431 | 1.7 |
| 2008 | 5,484,723 | 862,022 | 16 | 33,961 | 4.1 |
| 2009 | 5,500,510 | 886,082 | 16 | 58,021 | 7.0 |
| 2010 | 5,515,575 | 914,341 | 17 | 86,280 | 10.4 |
| 2011 | 5,529,888 | 945,089 | 17 | 11,7028 | 14.1 |
| 2012 | 5,543,453 | 975,339 | 18 | 14,7278 | 17.8 |
| 2013 | 5,556,452 | 1,001,430 | 18 | 173,369 | 20.9 |
| 2014 | 5,569,077 | 1,023,083 | 18 | 195,022 | 23.6 |
| Sweden | |||||
| 2006 | 9,133,723 | 1,593,269 | 17 | 0 | 0.0 |
| 2007 | 9,201,391 | 1,626,377 | 18 | 33,108 | 2.1 |
| 2008 | 9,273,134 | 1,667,330 | 18 | 74,061 | 4.6 |
| 2009 | 9,352,378 | 1,713,716 | 18 | 120,447 | 7.6 |
| 2010 | 9,432,309 | 1,761,597 | 19 | 168,328 | 10.6 |
| 2011 | 9,503,420 | 1,807,969 | 19 | 214,700 | 13.5 |
| 2012 | 9,573,256 | 1,852,029 | 19 | 258,760 | 16.2 |
| 2013 | 9,647,386 | 1,892,096 | 20 | 29,8827 | 18.8 |
| 2014 | 9,723,809 | 1,927,843 | 20 | 334,574 | 21.0 |
| Norway | |||||
| 2006 | 4,662,366 | 687,581 | 15 | 0 | 0.0 |
| 2007 | 4,710,952 | 693,472 | 15 | 5891 | 0.9 |
| 2008 | 4,770,096 | 703,673 | 15 | 16,092 | 2.3 |
| 2009 | 4,830,658 | 718,898 | 15 | 31,317 | 4.6 |
| 2010 | 4,891,300 | 738,151 | 15 | 50,570 | 7.4 |
| 2011 | 4,955,373 | 761,403 | 15 | 73,822 | 10.7 |
| 2012 | 5,021,106 | 786,160 | 16 | 98,579 | 14.3 |
| 2013 | 5,085,582 | 808,559 | 16 | 120,978 | 17.6 |
| 2014 | 5,147,792 | 829,657 | 16 | 142,076 | 20.7 |
-
ptc incr irt 06* – ptc increase in 65+ persons in relation to 2006 population increase irt 06* – increase in absolute numbers of 65+ persons since 2006.
Consumption of opioids can be measured in defined daily doses (DDDs) or in mg oral morphine equivalents (mg omeq). The DDD for a specific drug is a predefined, international standard amount of a generic substance designed for drug use statistics assigned by WHO [16]. For many drugs one DDD will reflect the usual daily dose prescribed in the clinic. However, when it comes to pain treatment opioid doses vary between individuals to achieve the most optimal balance between effect and side effects. Therefore, DDDs for opioids may not necessarily reflect the doses used in different clinical situations. Furthermore, the assigned DDDs do not always mirror the analgesic potencies of the different opioids. For example, 1 DDD of codeine is 100 mg codeine and 1 DDD of morphine is 100 mg morphine. Morphine is around 10 times as potent as codeine, which implies that 10 DDDs codeine is considered equipotent to 1 DDD of morphine. This explains why different opioid prescribing habits in different populations can give rise to skewed pictures, if DDDs are used as units for consumption with regard to the clinical value of the opioid consumption [17]. For this reason, DDDs of opioids were converted to mg omeqs, using the same conversion factors as used in a recent paper on cancer patients’ consumption of opioids [15]. The conversion factors are the factors used for multiplication with the dispensed amounts of DDDs to estimate the dispensed amounts of mg oral morphine equivalents. Most of the conversion factors shown in the right column in Table 1 were calculated based on the DDDs assigned by WHO and the equianalgesic potencies between different orally administered opioid types and oral morphine. Two exceptions were fentanyl and buprenorphine, where the conversion factors were calculated on the basis of equianalgesic potencies for the transdermal route and the sublingual route, respectively. Apart from the two exceptions, the decisions to choose the equianalgesic potencies for orally administered opioids were; 1: the large amount of dispensed opioids in the pharmacies is for oral use, and 2: it is not possible to discriminate between DDDs sold for different administration routes in the public assessable data from the prescription registries.
3 Results
3.1 Opioid users and opioid consumption per 1,000 inhabitants
The numbers of opioid users per 1,000 inhabitants are shown in Fig. 1. Norway had the highest number of opioid users in the population and Denmark the lowest. The number of users per 1,000 inhabitants increased slightly over the period in both Denmark and Norway, but seemed to have stabilized in Denmark since 2012. Sweden appeared stable throughout the period. The absolute increase in number of users in each country throughout the period was 17% in Denmark (from 357,653 to 419,261 users), 7% in Sweden (from 714,354 to 760,957 users) and 18% in Norway (456,189–536,894 users).
Figure 2 shows the consumption of opioid per 1,000 inhabitants using two different units for measuring; the upper part using DDDs, and the lower using mg omeqs. When measured in DDDs, the three countries opioid consumption appeared rather similar, except for a small reduction in Sweden during the period (Fig. 2, upper panel). However, large differences appeared when the consumption was calculated in mg omeqs per 1,000 inhabitants (Fig. 2, lower panel). Denmark had a significantly larger and increasing consumption throughout the period compared to Sweden and Norway. Norway had the lowest consumption, but with an increasing tendency over the period. In Sweden, the decrease in consumption when measured in DDDs almost disappeared when the consumption was converted to mg omeqs.
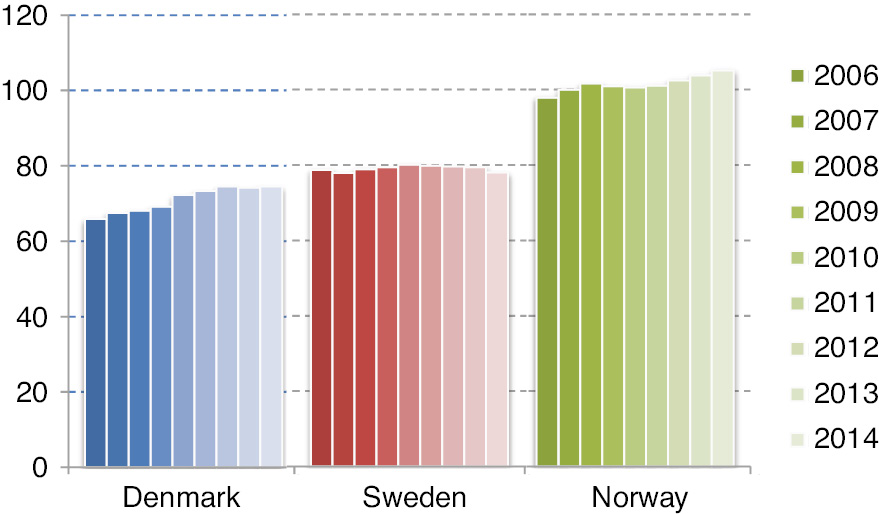
Annual number of N02A opioid users per 1,000 inhabitants – during 2006–2014.
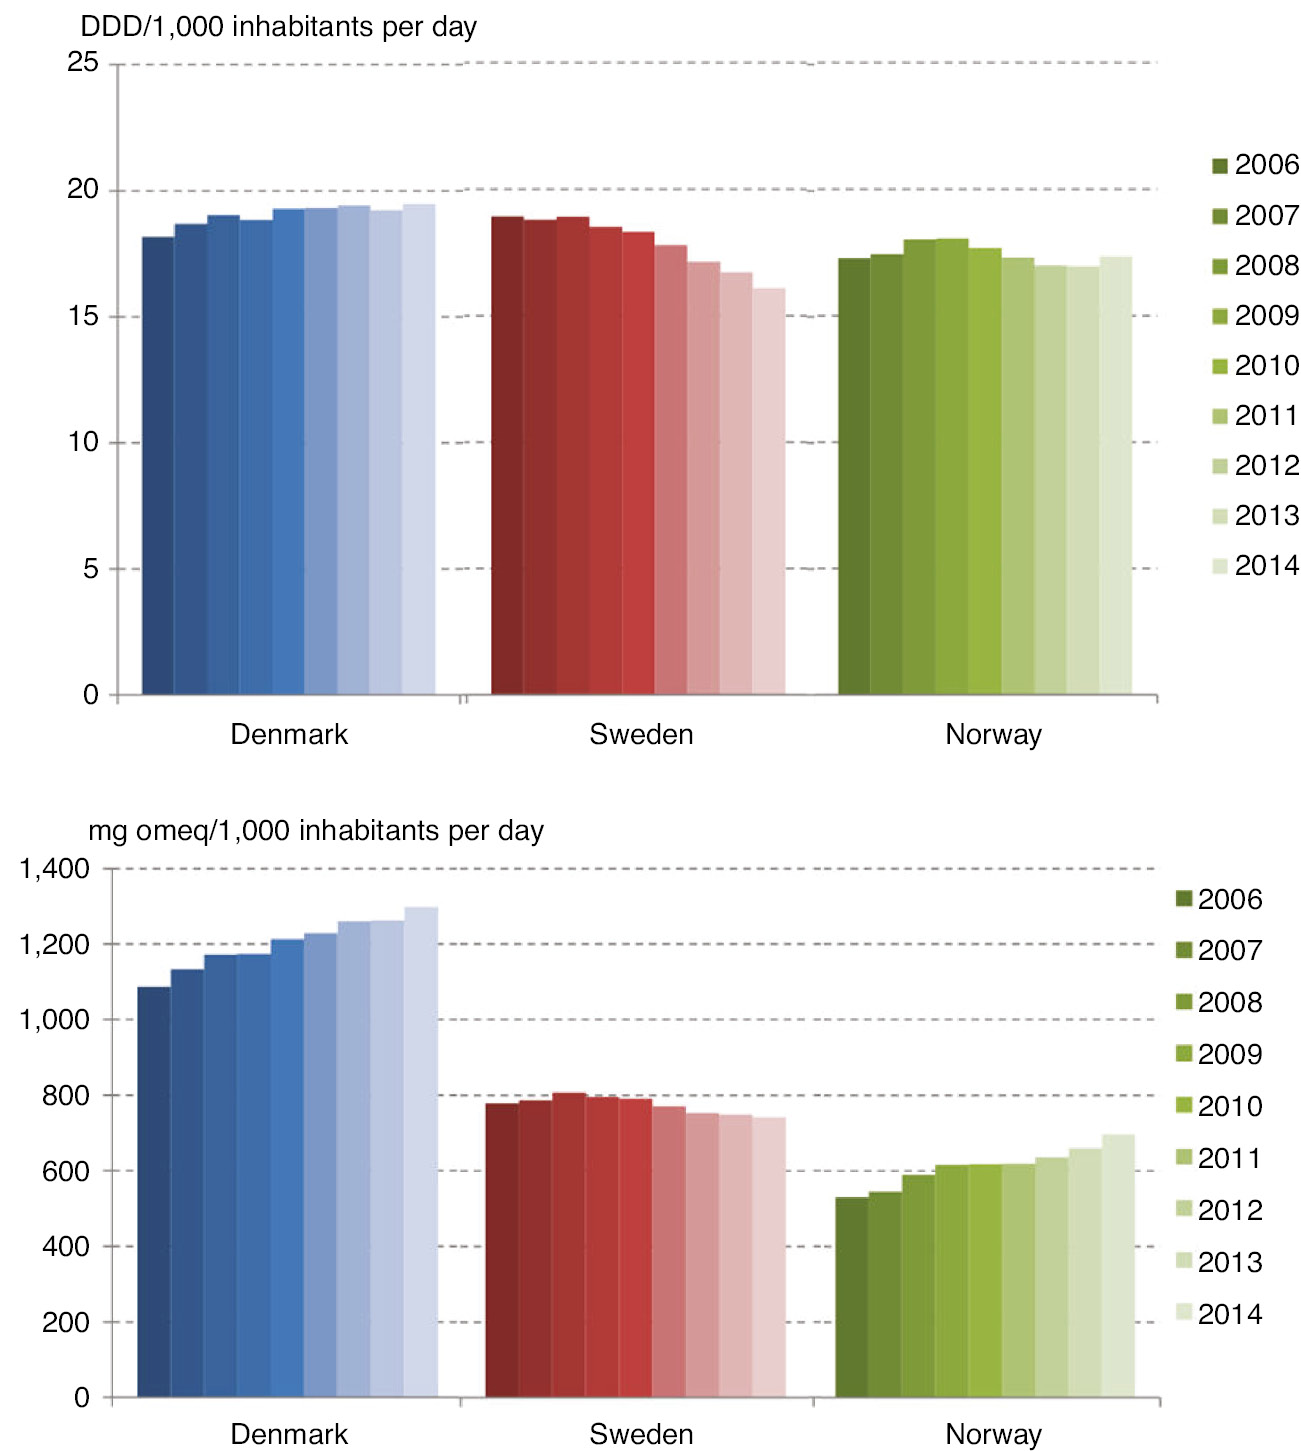
Average daily consumption of opioids per 1,000 inhabitants per day – during 2006–2014. DDD is used as unit in the upper panel, and mg omeq is used in the lower panel.
3.2 Dispensed opioids per user
In 2006, the annual average amount of opioids dispensed per user was 1979, 3615 and 6025 mg omeq in Norway, Sweden and Denmark, respectively, and in 2014 the corresponding figures were; 2426, 3473 and 6361 mg omeq. The average daily consumption is shown in Fig. 3, where Denmark had the highest consumption of opioids per user, and Norway the lowest.
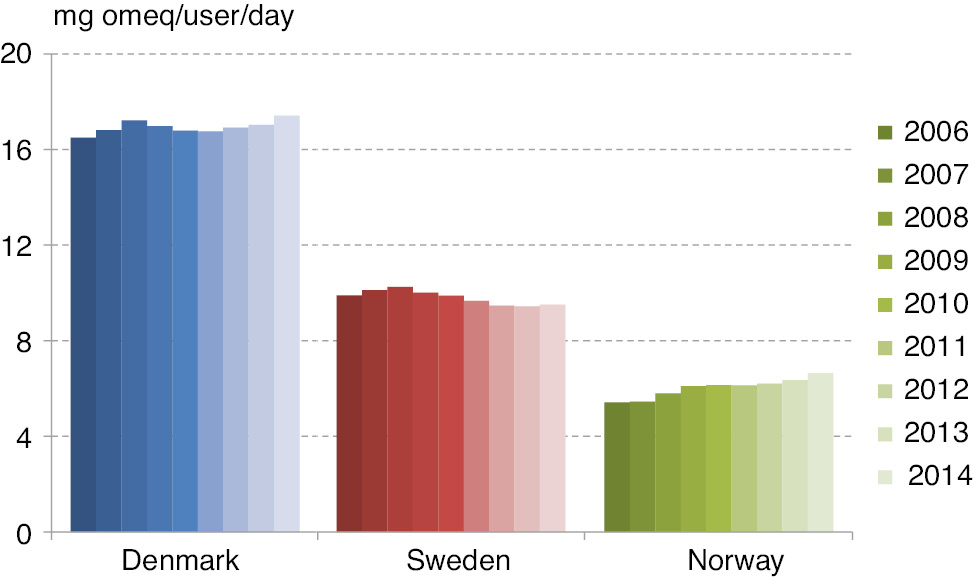
Average daily opioid consumption per user – during 2006–2014.
In 2006 and 2014, the average daily consumption/user in Denmark was 3.0 and 2.6 times higher than in Norway. Norway showed a slight increase in average daily consumption/user over the period from 5.4 mg omeqs/day to 6.6 mg omeqs/day (equals a 22.6% increase). The consumption was rather stable in Sweden and Denmark over the period; in Sweden the consumption was 9.9 mg and 9.5 mg omeq/user/day in 2006 and 2014 (3.9% decrease), while in Denmark the consumption was 16.5 mg and 17.4 mg omeq/user/day in 2006 and 2014 (5.6% increase).
3.3 Choice of opioids
The preferred types of prescribed opioids in Denmark, Sweden and Norway in 2006 and 2014 are shown in Fig. 4. The figure shows each opioid’s proportion in the total annual opioid consumption in the countries in the 2 years when measured in mg omeqs.
The weak opioids are represented by the blue colors in the discs, and R05DA04 (light purple) is only represented in the Danish consumption with 3% and 2% in 2006 and 2014. In 2006 in Sweden, almost three quarters of the opioid consumption came from weak opioids. Gradually (annual data not shown) over the period, the preference to use strong opioids in both Sweden and Norway increased. In 2014 a little more than half of the opioid consumption came from the use of strong opioids in all three countries. In 2014, in Denmark morphine was the most frequently used strong opioid, while in both Sweden and Norway oxycodone was used more frequently than morphine. The relative consumption of oxycodone increased substantially over the period, in Sweden from 10% to 23%, and in Norway from 17% to 26%, while in Denmark there was a decrease from 22% in 2008–2010 to 16% in 2014. The relative consumption of tramadol (light blue) increased from 20% to 32% in Norway, from 42% to 47% in Denmark and decreased from 49% to 37% in Sweden. The use of dextropropoxyphene had disappeared in all three countries in 2014.
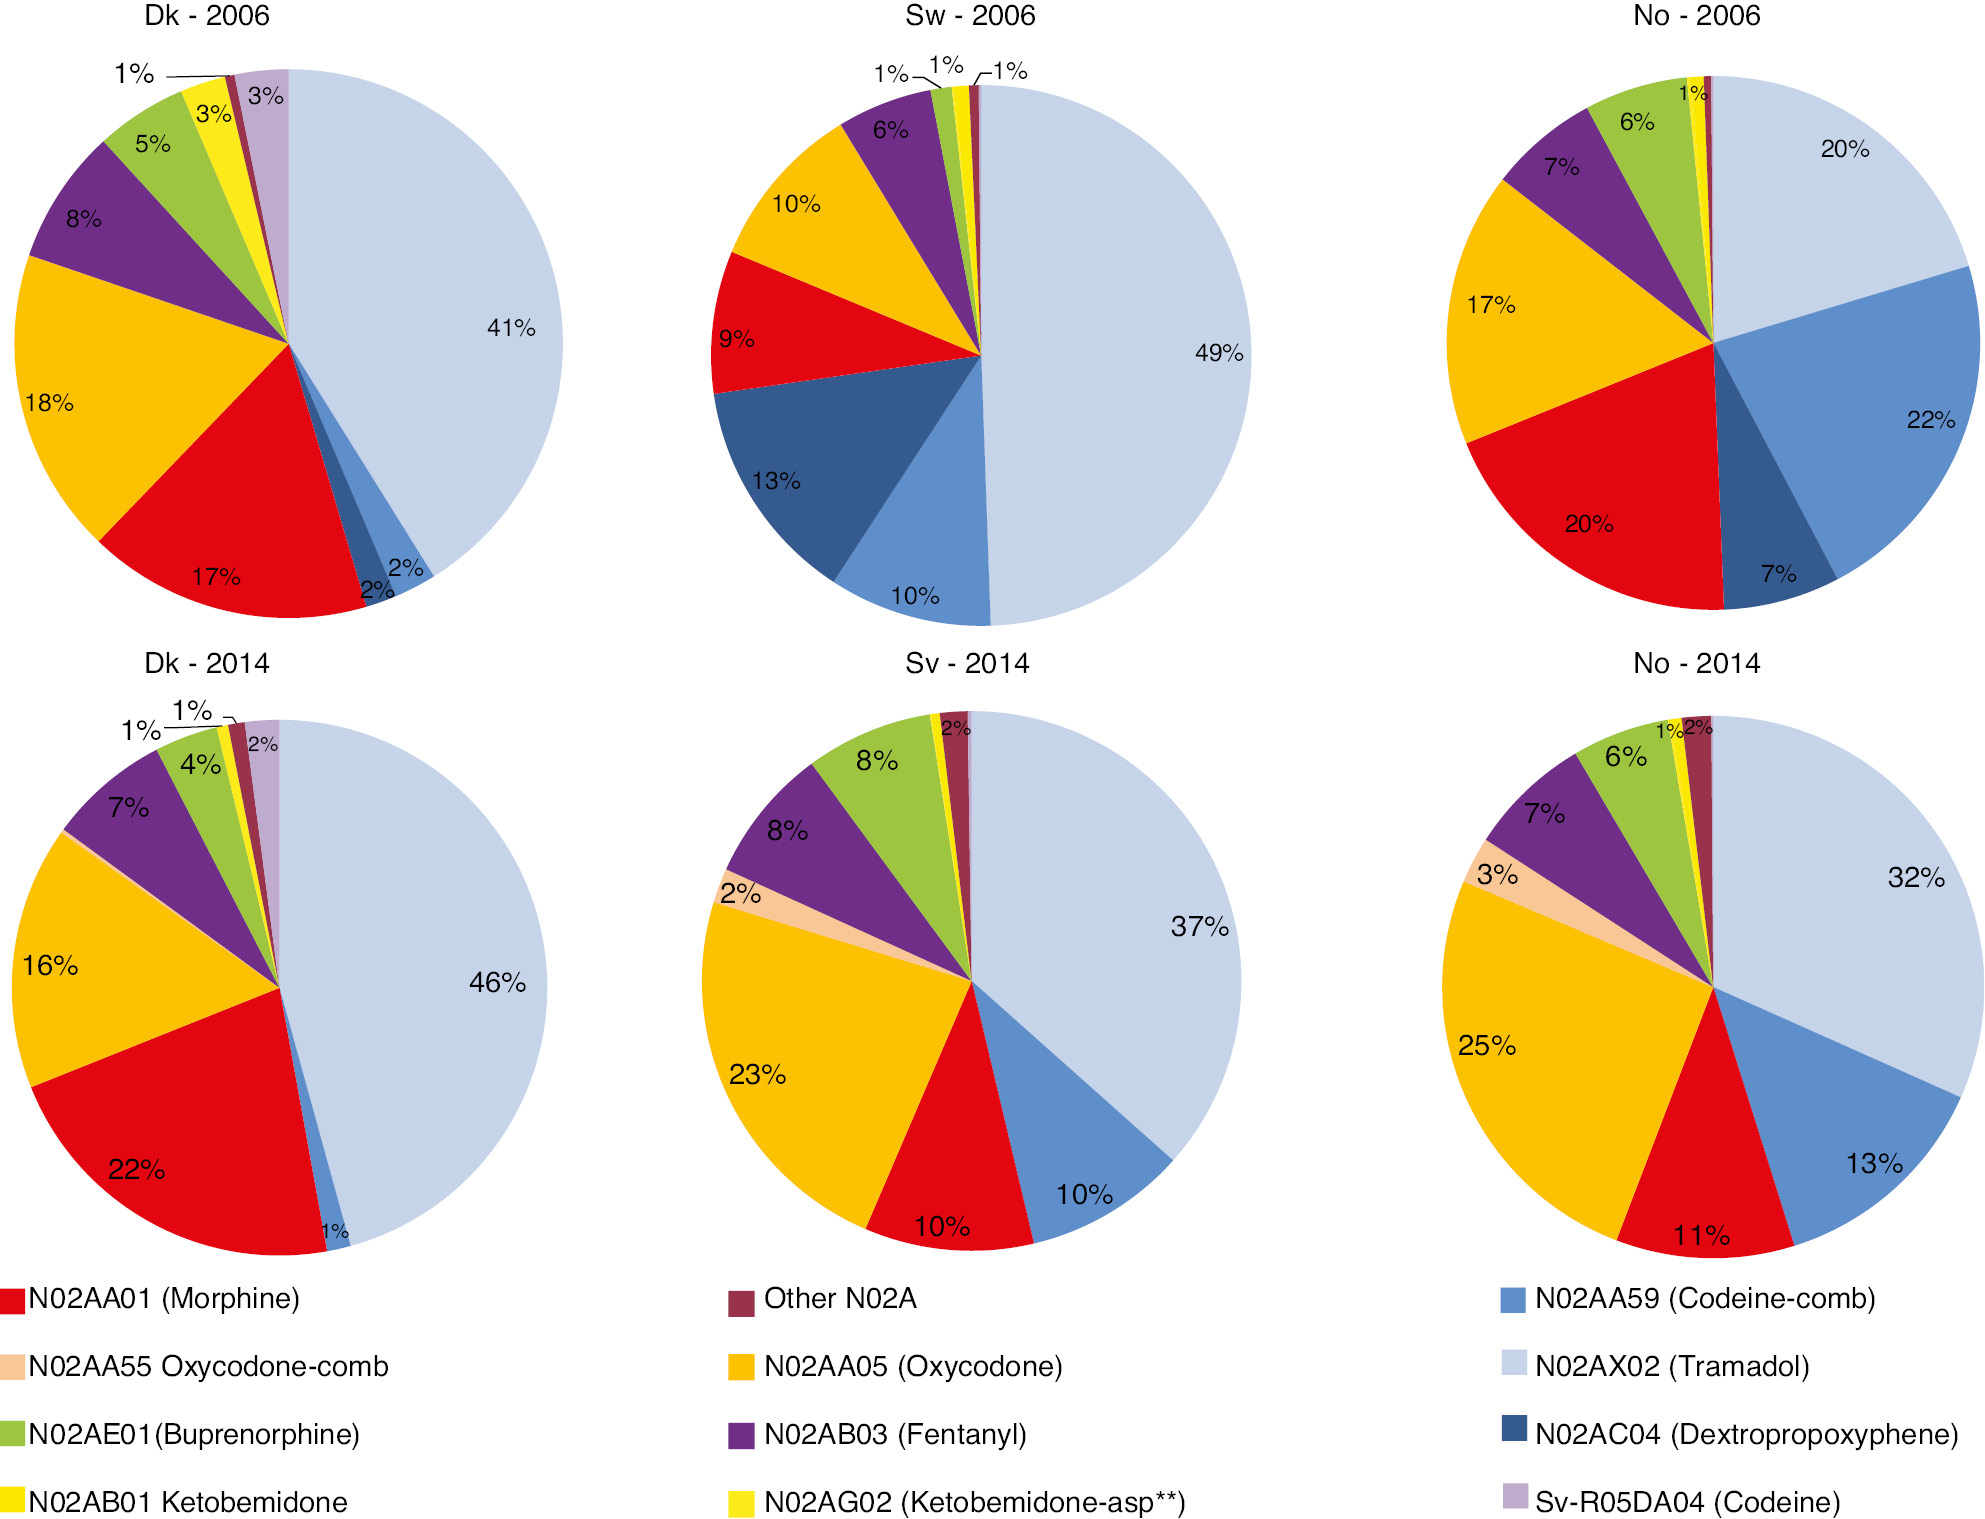
The different opioids’ share in the total consumption of opioids in mg omeq/year in 2006 and 2014 – in Denmark, Sweden and Norway. The blue colors represent weak opioids. **Ketobemidone combined with antispasmodics.
In 2014, the total consumption of codeine, R05DA04 plus N02AA59, in Denmark, Sweden and Norway was around 17,000, 27,000 and 35,000 mg omeq/1,000 inhabitants, respectively (Fig. 5). Codeine combined with paracetamol, was used much more frequently in Sweden and Norway compared to Denmark, where most of the codeine was prescribed as pure codeine (ATC code; R05DA04). In Denmark, 60% of the codeine consumption came from R05DA04 prescriptions, while in Sweden and Norway less than 0.2% and 0.1%, respectively, of the total codeine consumption came from R05DA04-prescriptions.
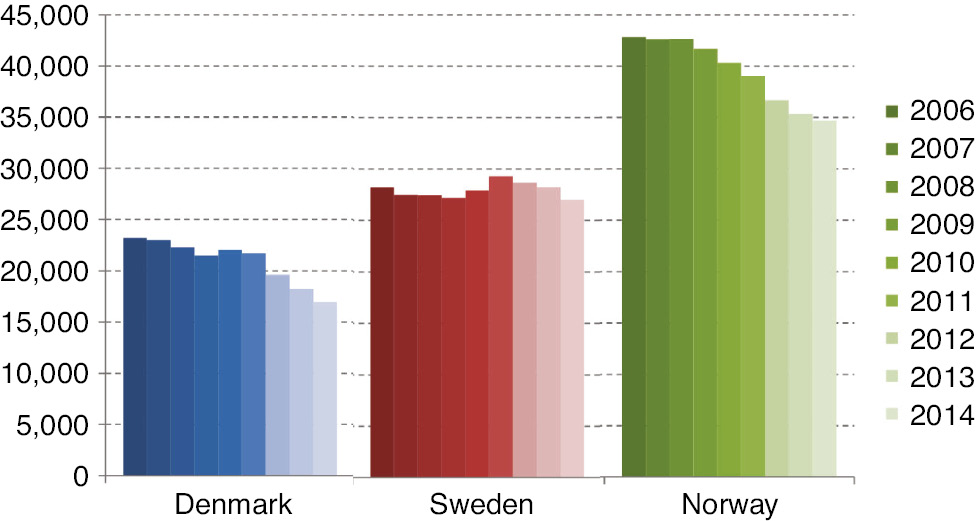
The average annual consumption of codeine (N02AA59+R05DA04) per 1,000 inhabitants in mg omeq – during 2006–2014.
4 Discussion and conclusion
Relatively large differences in opioid prescribing habits between the three Scandinavian countries were demonstrated. While Denmark had the fewest number of opioid users compared to Sweden and Norway, the average consumption of opioids per user or per 1,000 inhabitants was clearly higher when omeqs was used as unit for consumption. Figure 2 shows the implications of using either DDDs or omeqs as units for consumption, which was pointed out in a recent paper from Norway [17]. Several explanations for the differences between the countries average consumption per user can be considered; treatment with higher equianalgesic doses per user, longer treatment periods and/or a larger proportion of long-term users. Differences in the proportions of 65+-aged people in the populations (Table 2) could also play a role in the differences and changing patterns of opioid use. However, Sweden had the largest proportion of older people, while Denmark had the largest increase in this proportion since 2006. So, the proportion of older people does not seem to be a major explanation for the changing patterns of opioid consumption per user or per 1,000 inhabitants. The absolute increase in the number of users in Denmark and Norway was equal, and considerably higher than Sweden, while the changes in number of users per 1,000 inhabitants were higher in Norway compared to Denmark and Sweden. These differences are most likely explained by different changes in prescribing habits and to a lesser degree changes in the demography. In Denmark, a discussion of the risks of using NSAIDs has been very intense during 2009 and 2010, which might suggest that a proportion of NSAID-users had been switched to opioids for pain treatment. The differences between the three Scandinavian countries are unlikely to be explained by large differences in the prevalence of pain in the populations [18], [19]. In 2013 in Denmark, the proportion of long-term users (defined as continuous use over 6 months) constituted 35% of all opioid users (169,750 users) or 3% of the population, and as a consequence of this, most of the annual opioid consumption in Denmark was related to chronic use [20]. The duration of opioid use surpassed 1 year for around 65% of the Danish long-term users [20], which equals 2% of the population, while in Norway a recent study [21] showed that 1.3% of the population met the criteria for being regarded as persistent opioid users. No figures or estimates for the proportion of Swedish long-term users could be identified. The average consumption of opioids per user in Denmark and Sweden appeared rather stable during the 9 year period. There was a 22% increase in Norway throughout the period in this parameter. This relatively high increase reflected the increase from a very low to a less low consumption per user in Norway compared to Denmark and Sweden. Throughout the period Norway continued to have the lowest consumption per user of the three countries. The results showed that prescribing habits changed over time. The preferences for certain opioid types differed between all three countries, especially in the beginning of the period of investigation. In Sweden, the preference for using strong opioids increased over the period. In both Norway and Sweden oxycodone seemed to be preferred over morphine. In Denmark the use of oxycodone also increased until 2009 [22], but recommendations for morphine and restrictions for oxycodone as first choice of a strong opioid appear to have changed this behavior. The preferences for weak opioids also differed between the countries. In Denmark, codeine was used to a much lesser extent than in Sweden and Norway. In Denmark pure codeine seemed to be preferred over codeine in combination with paracetamol, in contrast with both Sweden and Norway where codeine combined with paracetamol was preferred.
The rather stable opioid consumption in all three countries can be interpreted as conservatism among prescribers within each country, with regard to indications for prescribing the opioids and with regard to the dosages used, measured in equianalgesic “currency”. On the other hand, the data have indicated a willingness among the prescribers to change their choice of opioid types in all three countries. Changes that may be explained both by regulatory and legislative demands from the authorities, guidelines and/or public debate.
The weaknesses and strengths in the study are mostly coherent with the way the prescription databases are built and administered [11]. The study was weakened from the facts that the results were restricted to opioids used in the primary care sector, and that the conversion factors used to change DDDs to omeqs were mainly based on orally administered opioids, as explained in the method’s section. The decision for the latter was the assumption that the overwhelming amount of opioids sold in the pharmacies was for oral use. The public assessable data on the amounts of DDDs sold from the pharmacies provided no knowledge on the distribution of opioids for different administration routes. Furthermore, the data provided no knowledge of indications, effects or side effects related to the dispensed prescriptions or whether people, who have redeemed the prescriptions, actually used the opioids (compliance). However, to the extent people do not consume the opioids they have redeemed from the pharmacies, the consumption per user is equivalently overestimated. A major strength of the study is the high accuracy and completeness in the registration of dispensed prescriptions, where the whole population in the country is the study cohort. The conversion of DDDs to mg omeqs suffers from the weaknesses caused by the underlying uncertainty in equianalgesic dose ratios [23], [24], so the amounts in mg omeqs must be considered as estimates and not exact amounts.
Apart from population based drug use statistics, record linkage between prescription registries and other population based databases hold many possibilities to achieve a more detailed understanding of the advantages or disadvantages of using opioids, and the data in the registries may also be useful in pharmaco-epidemiological follow up studies after pain treatment interventions.
5 Conclusion
Statistics based on dispensed opioid prescriptions reflect differences in medical culture and attitudes toward pharmacological pain treatment. High quality pharmacological pain treatment – i.e. using the right drug, initiated at the right time, provided in the right doses and for the right duration, to the right patient, will appear in the prescription databases’ aggregated data – and so will prescriptions from poor pain treatment behavior. The quality of pharmacological pain treatment cannot be appraised only from looking in drug use statistics. Prescription data combined with other sources of research based information can provide a clearer picture of “what is going on” with regard to the quality of the pain treatment on the larger scale. In this study it remains speculative, which of the three Scandinavian countries are closest to the optimal prescribing behavior, when it comes to treatment of opioid responsive pain? However, judged by the drug statistics used in this study, no opioid epidemic appears to be knocking on the doors in Denmark, Sweden or Norway.
-
Authors’ statements
-
Research funding: Author state no funding involved.
-
Conflict of interest: Author state no conflict of interest.
-
Informed consent: This study did not require informed consent.
-
Ethical approval: This study did not require ethical approval.
References
[1] Franklin G, Sabel J, Jones CM, Mai J, Baumgartner C, Banta-Green CJ, Neven D, Tauben DJ. A comprehensive approach to address the prescription opioid epidemic in Washington State: milestones and lessons learned. Am J Public Health 2015;105:463–9.10.2105/AJPH.2014.302367Search in Google Scholar PubMed PubMed Central
[2] Hastie BA, Gilson AM, Maurer MA, Cleary JF. An examination of global and regional opioid consumption trends 1980–2011. J Pain Palliat Care Pharmacother 2014;28:259–75.10.3109/15360288.2014.941132Search in Google Scholar PubMed
[3] Okie S. A flood of opioids, a rising tide of deaths. N Engl J Med 2010;363:1981–5.10.1056/NEJMp1011512Search in Google Scholar PubMed
[4] Alexander LM, Keahey D, Dixon K. Opioid use disorder: a public health emergency. JAAPA 2018;31:47–52.10.1097/01.JAA.0000545072.09344.eeSearch in Google Scholar PubMed
[5] Hauser W, Petzke F, Radbruch L, Tolle TR. The opioid epidemic and the long-term opioid therapy for chronic noncancer pain revisited: a transatlantic perspective. Pain Manag 2016;6:249–63.10.2217/pmt.16.5Search in Google Scholar PubMed
[6] Jay GW, Barkin RL. Perspectives on the opioid crisis from pain medicine clinicians. Dis Mon 2018;64:451–66.10.1016/j.disamonth.2018.07.002Search in Google Scholar PubMed
[7] Lowenstein M, Grande D, Delgado MK. Opioid prescribing limits for acute pain – striking the right balance. N Engl J Med 2018;379:504–6.10.1056/NEJMp1803661Search in Google Scholar PubMed
[8] INCB. Table XIV. Levels of consumption of narcotic drugs, in defined daily doses for statistical purposes per million inhabitants per day, 2014–2016. 2017:230.10.18356/b3b09b12-en-fr-esSearch in Google Scholar
[9] Hamunen K, Laitinen-Parkkonen P, Paakkari P, Breivik H, Gordh T, Jensen NH, Kalso E. What do different databases tell about the use of opioids in seven European countries in 2002? Eur J Pain 2008;12:705–15.10.1016/j.ejpain.2007.10.012Search in Google Scholar PubMed
[10] Schwartz S. The fallacy of the ecological fallacy: the potential misuse of a concept and the c onsequences. Am J Public Health 1994;84:819–24.10.2105/AJPH.84.5.819Search in Google Scholar
[11] Furu K, Wettermark B, Andersen M, Martikainen JE, Almarsdottir AB, Sorensen HT. The Nordic countries as a cohort for pharmacoepidemiological research. Basic Clin Pharmacol Toxicol 2010;106:86–94.10.1111/j.1742-7843.2009.00494.xSearch in Google Scholar PubMed
[12] Medstat.dk [Internet]. 2016 [cited 13 May 2016]. Available from: http://medstat.dk/.Search in Google Scholar
[13] Statistik databas for läkemedel [Internet]. [cited 13 May 2016]. Available from: http://www.socialstyrelsen.se/statistik/statistikdatabas/lakemedel.Search in Google Scholar
[14] Norwegian Prescription Database, The Norwegian Institute of Public Health (NIPH) [Internet]. The Norwegian Institute of Public Health (NIPH). 2016 [cited 13 May 2016].Search in Google Scholar
[15] Jarlbaek L, Andersen M, Hallas J, Engholm G, Kragstrup J. Use of opioids in a Danish population-based cohort of cancer patients. J Pain Symptom Manage 2005;29:336–43.10.1016/j.jpainsymman.2004.07.010Search in Google Scholar PubMed
[16] Methodology WCCfDS. ATC classification index with DDDs. Oslo, Norway 2016. https://www.whocc.no/atc_ddd_index/: WHO Collaborating Centre for Drug Statistics Methodology, 2016.Search in Google Scholar
[17] Svendsen K, Borchgrevink P, Fredheim O, Hamunen K, Mellbye A, Dale O. Choosing the unit of measurement counts: the use of oral morphine equivalents in studies of opioid consumption is a useful addition to defined daily doses. Palliat Med 2011;25:725–32.10.1177/0269216311398300Search in Google Scholar PubMed
[18] Harker J, Reid KJ, Bekkering GE, Kellen E, Bala MM, Riemsma R, Wothy G, Misso K, Kleijnen J. Epidemiology of chronic pain in Denmark and Sweden. Pain Res Treat 2012;2012:371248.10.1155/2012/371248Search in Google Scholar PubMed PubMed Central
[19] Breivik H, Collett B, Ventafridda V, Cohen R, Gallacher D. Survey of chronic pain in Europe: prevalence, impact on daily life, and treatment. Eur J Pain 2006;10:287–333.10.1016/j.ejpain.2005.06.009Search in Google Scholar PubMed
[20] Sundhedsstyrelsen. Mapping of the opioid use in Denmark – focusing on patients with chronic non-malignant pain [Kortlægning af opioidforbruget i Danmark – med fokus på patienter med kroniske non-maligne smerter]. 2016.Search in Google Scholar
[21] Mellbye A, Karlstad O, Skurtveit S, Borchgrevink PC, Fredheim OM. The duration and course of opioid therapy in patients with chronic non-malignant pain. Acta Anaesthesiol Scand 2016;60:128–37.10.1111/aas.12594Search in Google Scholar PubMed
[22] Jarlbaek L. Opioids – use, users and age distribution in Denmark 2003–2013 – an exploration of prescription data [Morfinlignende lægemidler – en undersøgelse af registerdata vedrørende forbrug, brugere og aldersfordelinger i Danmark 2003–2013]. PAVI, Knowledge Centre for Rehabilitation and Palliative Care: PAVI, Knowledge Centre for Rehabilitation and Palliative Care, 2015.Search in Google Scholar
[23] Shaheen PE, Walsh D, Lasheen W, Davis MP, Lagman RL. Opioid equianalgesic tables: are all equally dangerous? J Pain Symptom Manage 2009;38:409–17.10.1016/j.jpainsymman.2009.06.004Search in Google Scholar PubMed
[24] Knotkova H, Fine PG, Portenoy RK. Opioid rotation: the science and the limitations of the equianalgesic dose table. J Pain Symptom Manage 2009;38:426–39.10.1016/j.jpainsymman.2009.06.001Search in Google Scholar PubMed
©2019 Scandinavian Association for the Study of Pain. Published by Walter de Gruyter GmbH, Berlin/Boston. All rights reserved.
Articles in the same Issue
- Frontmatter
- Editorial comments
- Information, back pain, and radiology
- Painful Willis-Ekbom disease: unbearable and distinct form of restless legs?
- Systematic review
- The effect of exercise therapy combined with psychological therapy on physical activity and quality of life in patients with painful diabetic neuropathy: a systematic review
- Clinical pain research
- A 4-year follow-up of non-freezing cold injury with cold allodynia and neuropathy in 26 naval soldiers
- Predicting chronic pain after major traumatic injury
- Dynamic assessment of the pupillary reflex in patients on high-dose opioids
- Decline of substance P levels after stress management with cognitive behaviour therapy in women with the fibromyalgia syndrome
- Characterization of painful Restless Legs Syndrome sensations in an English-speaking South African population
- Opioid prescribing habits differ between Denmark, Sweden and Norway – and they change over time
- Psychological factors can cause false pain classification on painDETECT
- Are attitudes about pain related to coping strategies used by adolescents in the community?
- Field testing of the revised neuropathic pain grading system in a cohort of patients with neck and upper limb pain
- Patient reported outcomes and neuropsychological testing in patients with chronic non-cancer pain in long-term opioid therapy: a pilot study
- Observational studies
- Lessons learned from piloting a pain assessment program for high frequency emergency department users
- The Portuguese 35-item Survey of Pain Attitudes applied to Portuguese women with Endometriosis
- Original experimental
- Development of a new bed-side-test assessing conditioned pain modulation: a test-retest reliability study
- Test-retest repeatability of questionnaire for pain symptoms for school children aged 10–15 years
- Unique brain regions involved in positive versus negative emotional modulation of pain
- What decreases low back pain? A qualitative study of patient perspectives
- Cutaneous nociceptive sensitization affects the directional discrimination – but not the 2-point discrimination
- Educational case report
- A painful foot with diagnostic and therapeutic consequences
- Short communications
- Educational interventions to improve medical students’ knowledge of acute pain management: a randomized study
- Possible inflammatory pain biomarkers in postamputation pain
- An online investigation into the impact of adding epidemiological information to imaging reports for low back pain
- Letter to the Editor
- Reply to Letter to the Editor “Clinical registries are essential tools for ensuring quality and improving outcomes in pain medicine” by Baciarello et al.