In vitro degradation and bioactivity of poly(propylene fumarate)/bioactive glass sintered microsphere scaffolds for bone tissue engineering
-
Sima Shahabi
 ,
Fathollah Moztarzadeh
,
Fathollah Moztarzadeh

Abstract
We developed degradable poly(propylene fumarate)/bioactive glass (PPF/BG) composite scaffolds based on a sintered microsphere technique and investigated the effects of BG content on the characteristics of these composite scaffolds. Immersion in a simulated body fluid (SBF) was used to evaluate the surface reactivity of composite scaffolds. The surface of composite scaffolds was covered with hydroxycarbonate apatite layer after 7 days of immersion. Ion concentration analyses revealed a decrease in P concentration and an increase in Si, Ca, and Sr concentrations in SBF immersed with composite scaffolds during the 3-week period. The Ca and P uptake rates decreased after 4 days of incubation. This coincided with the decrease of the Si release rate. These data lend support to the suggestion that the Si released from the BG content of scaffolds present in the polymer matrix was involved in the formation of the Ca-P layer. The evaluation of the in vitro degradation of composite microspheres revealed that the weight of scaffolds remained relatively constant during the first 3 weeks and then started to decrease slowly, losing 10.5% of their initial mass by week 12. Our results support the concept that these new bioactive, degradable composite scaffolds may be used for bone tissue engineering applications.
1 Introduction
Microsphere-based tissue engineering scaffold designs have attracted significant attention in recent years [1, 2]. Microsphere scaffolds have been increasingly used for the controlled delivery of bioactive molecules, such as cytokines and growth factors, and in advanced tissue engineering applications, such as gene therapy and antibiotic treatment of infected bones [3, 4]. Poly(propylene fumarate) (PPF) is unsaturated linear polyester. The hydrolysis of the ester bonds allows PPF to degrade, and the degradation of PPF leads to the formation of biocompatible degradation products that are readily removed from the body [5]. Furthermore, PPF could obtain high mechanical properties when it is properly cross-linked [6]. Because of this property, PPF is highly recommended in bone replacement scaffold. The porous PPF scaffold has been shown to be osteoconductive, supporting bone cell proliferation and differentiation in vitro and tissue ingrowth in vivo [7–10].
Materials such as bioactive glasses (BG) and hydroxyapatite (HA) are capable of forming an interfacial bond with the bone [11, 12]. It has been shown that BG granules of narrow size range elicited bone formation in mandibular defects after implantation [13]. Several studies showed that BG has the ability to facilitate attachment and the osteoblastic differentiation of osteoprogenitor cells [14, 15]. BG surface modification, which includes the formation of bone-like apatite, was shown to be critical for the favorable effect of BG on bone cell function [16, 17]. Combining polymers and BG into composites is a relatively new concept in bone tissue engineering, and composites have several advantages, such as enhanced bioactivity and mechanical properties [18, 19]. Furthermore, the incorporation of BG into a polymer base has been shown to delay the degradation rate of the polymer [20].
In this study, the synthesis and characterization of bioactive, degradable PPF/BG composite scaffolds based on a sintered microsphere technique are reported. The size distribution, surface morphology, BG content, and in vitro bioactivity of composite scaffolds were evaluated using scanning electron microscopy (SEM), Fourier transform infrared spectroscopy (FTIR), X-ray diffraction (XRD), and thermogravimetric analysis (TGA). In addition, in vitro immersion experiments were carried out to evaluate the in vitro degradation and mechanical properties of composite scaffolds.
2 Materials and methods
2.1 Materials
Tetraethyl orthosilicate, triethyl phosphate (TEP), calcium nitrate tetrahydrate, magnesium nitrate hexahydrate, and strontium nitrate as the starting materials for the preparation of BG and the reagent-grade chemicals NaCl, NaHCO3, KCl, K2HPO4·3H2O, MgCl2·6H2O, CaCl2, trishydroxymethyl aminomethane [Tris buffer, (CH2OH)3CNH2], and 1 N HCl as required materials for the preparation of the simulated body fluid (SBF) were purchased from Merck KGaA (Darmstadt, Germany). Diethyl fumarate, ZnCl2, bis(2,4,6-trimethylbenzoyl) phenylphosphine oxide, and poly(vinyl alcohol) (PVA) were obtained from Sigma-Aldrich Chemie GmbH (Steinheim, Germany). Hydroquinone and propylene glycol were purchased from Merck KGaA (Darmstadt, Germany).
2.2 Preparation of BG
The sol-gel synthesis of the glass of composition SiO2-P2O5-CaO-MgO-SrO (64% SiO2, 21% CaO, 5% P2O5, 5% MgO, and 5% SrO, mol%) was performed following the method described previously [21]. Briefly, 13.33 g (0.064 mol) of tetraethoxysilane were added into 30 ml of 0.1 M nitric acid; the mixture was allowed to react for 60 min for the acid hydrolysis of tetraethoxysilane to proceed almost to completion. The following reagents were added in sequence allowing 45 min for each reagent to react completely: 0.91 g (0.005 mol) TEP, 4.96 g (0.021 mol) calcium nitrate tetrahydrate, 1.28 g (0.005 mol) magnesium nitrate hexahydrate, and 1.05 g (0.005 mol) strontium nitrate. After the final addition, mixing was continued for 60 min to allow the completion of the hydrolysis reaction. The solution was cast in a hermetically sealed cylindrical Teflon container and kept sealed for 10 days at room temperature to allow the hydrolysis and a polycondensation reaction to take place until the gel was formed. The gel was then aged at 70°C for a further 3 days. Water was removed. A small hole was inserted in the lid to allow the leakage of gases while heating the gel to 120°C for 2 days to remove all the water. After grinding and sieving, the dry gel powders were heated for 24 h at 700°C for nitrate elimination and stabilization.
2.3 Synthesis of PPF
PPF was synthesized by a two-step reaction procedure [5, 22]. In the first step of the synthesis, diethyl fumarate and propylene glycol were reacted in an inert atmosphere in a 1:3 molar ratio. ZnCl2 as a catalyst and hydroquinone as a cross-linking inhibitor were added to diethyl fumarate in a 0.01:0.002:1 molar ratio. The reactants were combined in a heated flask and mixed with an overhead mechanical stirrer, and the temperature was increased gradually from 110°C to 130°C. The reaction produced bis(hydroxypropyl) fumarate as the main product and ethanol as a byproduct. In the second step of the synthesis reaction, bis(hydroxypropyl) fumarate was transesterified to produce PPF and 1,2-propanediol as a byproduct. For this stage of the synthesis, the reactants were heated to 100°C and then brought to vacuum (<1 mm Hg). Then, the system was heated to 0.3°C min-1 up to 130°C. The reaction proceeded until the desired molecular weight (Mw) of PPF, as measured by gel permeation chromatography (GPC), was obtained. The purification of the PPF product occurred through the dissolution of the polymer in methylene chloride followed by sequential washing in acid to remove the ZnCl2 catalyst. Further purification of the polymer solution involved two washes each with double-distilled water and brine solution. Water was then removed by drying with sodium sulfate. Finally, the solvents were removed from the PPF solution through rotary evaporation and reduced pressure.
2.4 Synthesis of PPF and PPF/BG composite microspheres
PPF and PPF/BG microspheres were produced by a modified emulsification method as described in previous studies [2, 23]. Briefly, 1 g bis(2,4,6-trimethylbenzoyl) phenylphosphine oxide was dissolved in 10 ml methylene chloride to prepare a photoinitiator solution. The non-cross-linked PPF solution was warmed in an oven at approximately 60°C to soften the viscous polymer and then mixed with the photoinitiator solution (0.05 ml g-1 PPF) to achieve 0.5 wt.% initiator content. Then, 1 g PPF/photoinitiator solution was dissolved in methylene chloride to make a 25% (w/v) solution. To make PPF/BG microspheres with certain PPF-to-BG ratio, a known amount of BG powder was dispersed in this solution by agitating on a vortex machine. This mixture was added dropwise to a stirred solution of 1% PVA (Mw=27,000). Stirring was continued to allow the extraction of methylene chloride. Then, the beaker on the stirrer was exposed to ultraviolet (UV) light using two long-wave UV bulbs (315–400 nm, λmax=365 nm, TLK 40W/10R, Philips) for 12 h at a distance of approximately 15 cm to photo-cross-link composite microspheres. The same technique was used for the preparation of PPF microspheres without the addition of BG. The resultant PPF and composite microspheres were then collected by centrifugation; subsequently, the microspheres were washed with deionized water, air dried, and finally vacuum dried. Eventually, the obtained microspheres were kept in a desiccator until further use.
2.5 Scaffold fabrication
Porous scaffolds were produced by modifying the method used by Borden et al. [24]. Cylindrical PPF/BG scaffolds were fabricated by packing PPF/BG microspheres into stainless steel molds. The molds were heated at 140°C for 12 h to produce a porous scaffold. Once heating was complete, the mold was allowed to cool to room temperature before the samples were removed. PPF scaffolds were fabricated similarly as above.
2.6 Preparation of SBF
The SBF solution was prepared by dissolving reagent-grade NaCl, KCl, NaHCO3, MgCl2·6H2O, CaCl2, and KH2PO4 into distilled water and buffered at pH 7.25 with Tris buffer and 1 N HCl at 37°C. Its composition is given in Table 1 and is compared with the human blood plasma [25].
Composition of SBF and the inorganic part of human blood plasma (mmol/l).
| Ion | Plasma (mmol/l) | SBF (mmol/l) |
|---|---|---|
| Na+ | 142.0 | 142.0 |
| K+ | 5.0 | 5.0 |
| Mg2+ | 1.5 | 1.5 |
| Ca2+ | 2.5 | 2.5 |
| Cl- | 103.0 | 147.8 |
| HCO32- | 27 | 4.2 |
| HPO42- | 1.0 | 1.0 |
| SO42- | 0.5 | 0.5 |
2.7 Characterization of PPF and composite scaffold
2.7.1 Nuclear magnetic resonance (NMR) spectrometry
NMR spectra were obtained on a Bruker Avance DRX 500 MHz NMR (Bruker Biospin GmbH, Rheinstetten, Germany). 1H NMR spectra were obtained using polymer solutions in CDCl3 at ambient temperature. The chemical shifts were indicated in δ ppm and presented in reference to TMS as internal standard. 1H NMR spectra were taken using standard pulse programs with a 3-s relaxation delay.
2.7.2 Thermogravimetric analysis
The amount of BG incorporated in composite microspheres was determined by TGA using a Thermogravimetric Analyzer Linseis STA PT-1000 system (Linseis International, Germany). Scans were performed in an air atmosphere with a temperature range of 30°C–600°C at a rate of 20°C min-1. The measurements were taken using a sample mass of 15 mg for PPF and composite microspheres and 10 mg for the BG powder.
2.7.3 FTIR spectroscopy
FTIR spectra were obtained using a Nicolet FTIR spectrophotometer (Thermoscientific Nicolet iS10, Madison, WI, USA) from samples mixed with KBr and pressed, under vacuum, into pellets. Sixteen scans were taken of each sample at a resolution of 4 cm-1.
2.7.4 X-ray diffraction
For XRD analysis, composite microspheres were immersed in SBF for different times, ground, and powdered, and the resulting powders were analyzed with Philips PW 1800. This instrument works with voltage and current settings of 40 kV and 30 mA, respectively, and uses CuKα radiation (1.540510 Å). For qualitative analysis, XRD diagrams were recorded in the interval 10°≤2θ≤90° at scan speed of 2° min-1.
2.7.5 Scanning electron microscopy
The surface morphology of microspheres was examined under an SEM. The dry composite microspheres were mounted onto metal stubs using double-sided adhesive tape and coated with a thin layer of gold (Au) by sputtering (EMITECH K450X, England), and the surface of the samples were observed under an SEM (Seron, AIS2300) that operated at the acceleration voltage of 15 kV.
2.8 In vitro evaluation
2.8.1 Evaluation of in vitro bioactivity
We carried out in vitro studies by soaking composite scaffolds in SBF at a concentration of 1 mg sample/ml of the fluid at 37°C for intervals from 1 to 21 days. After soaking, composite scaffolds were rinsed with double-distilled water, air dried, and then vacuum dried before analysis by FTIR, XRD, and SEM. All reacted solutions were saved for inductively coupled plasma-atomic emission spectroscopy (ICP-AES; Varian Co., USA) analysis of Si, Ca, P, Mg, and Sr to measure the ionic concentration in the SBF solution.
2.8.2 In vitro degradation
The degradation of PPF/BG and PPF scaffolds were performed in Ringer’s solution (Merck KGaA, Darmstadt, Germany) with pH 6.9. Briefly, PPF/BG and PPF scaffolds (8 mm diameter×16 mm length) were placed individually into capped plastic tubes with 20 ml Ringer’s solution. All test tubes were stored in a 37°C environmental chamber on a shaker table and kept shielded from light for the duration of the study. Ringer’s solution was exchanged every 8 h for the first 48 h, daily for the next 5 days, and weekly for the remaining 11 weeks of the study. The solution pH for each sample was recorded before every solution exchange. The measurements were also taken for Ringer’s solution that did not have specimens to evaluate the change in solution pH due to polymer degradation. At predetermined time points up to 12 weeks, the samples were removed from Ringer’s solution, washed with double-distilled water, and freeze dried. The dry weight (Wt) and the initial weight (W0) were recorded. The weight loss percentage (ΔW%) was evaluated in triplicate for each time point according to the following formula: ΔW%=(W0-Wt)/W0×100%. The data are expressed as mean±SD.
2.8.3 Mechanical testing
The compressive mechanical testing was conducted in accordance to ASTM D695-96 with a universal testing machine (Zwick Z100, Zwick/Roell GmbH & Co. KG, Ulm, Germany) at ambient temperature and humidity. The cylindrical samples were synthesized as described above. The typical sample sizes were 8 mm in diameter and 16 mm in length to produce a sample aspect ratio of 2:1. Force and displacement were zeroed before compression, with the top plate slightly above the surface of the sample. The cylinders were compressed between two plates moving at a crosshead speed of 1 mm min-1 until failure, whereas the stress and strain and displacement were recorded throughout the experiment. Five specimens were run for each sample group. The values and errors reported for each sample are mean±SD.
2.9 Statistical analysis
Quantitative data were reported as mean±SD. Statistical analysis was performed using a one-way ANOVA. Comparison between the two means was determined using Tukey’s post hoc test with statistical significance evaluated at p<0.05 (except for those otherwise specified).
3 Results and discussion
3.1 PPF characterization
The Mw distribution of PPF was determined by GPC. PPF with a number average Mw (Mn) of 1492 Da, a weight average Mw of 7069 Da, and a polydispersity index (PI) of 4.7 was synthesized for this study.
The 1H NMR spectrum of PPF is given in Figure 1. Through 1H NMR spectra, the PPF chemical structure was verified. The peak assignments were based on the tables of Silverstein and Webster [26]. In the PPF spectra, the fumarate olefinic protons exhibited signals at 6.9 ppm. The signals at 1.15–1.5 ppm were the propyl methyl groups. The propyl methylene protons were seen at 4.2–4.4 ppm. Finally, the propyl methine protons were found at 5.2–5.3 ppm. These signals were in good agreement with previously published data [5, 27, 28].

A representative proton NMR spectrum of purified PPF.
3.2 TGA results
The compositions of composite microspheres were determined by TGA. Figure 2 exhibits the weight changes of BG, PPF microspheres, and PPF/BG composite microspheres during the analysis. In the observation temperature range up to 600°C, BG was thermally stable, whereas PPF microspheres had one thermal degradation step. Given the weight fraction of residue for PPF microspheres, which was 11.2%, one can predict the weight fractions of residue for PPF/BG composite microspheres. The calculated value was 33.4%, in satisfactory agreement with the experimental values of 31.9% for PPF/BG composite microspheres with BG composition of 25%, respectively. It was confirmed that the composition of the final PPF/BG composite microspheres was consistent with the feed ratios of both components before the synthesis of microspheres.

TGA of PPF microspheres and PPF/BG microspheres.
3.3 Evaluation of in vitro bioactivity
Figure 3 shows the PPF/BG sintered microsphere scaffolds observed by SEM. The bioactivity of PPF/BG sintered microsphere scaffolds was determined by monitoring the formation of hydroxycarbonate apatite (HCA) layer on the scaffold surface after soaking in the SBF solution. The in vitro bioactivity assessment was carried out by immersing composite scaffolds in the SBF solution, which had similar composition and concentrations to those of human plasma. The samples was immersed in SBF at approximately 1 mg/ml and maintained at 37°C for 1–21 days. The formation of HCA layer was evidenced from the FTIR, XRD, and SEM analyses. The essential condition for a biomaterial to bond with the living bone is the formation of a surface apatite layer in the body environment.

SEM micrographs of PPF/BG scaffolds (A and B).
3.3.1 FTIR analysis
Figure 4 shows the FTIR spectra of composite scaffolds before and after immersion in SBF for 7 and 14 days. Before immersion in SBF, the FTIR spectra of the sample exhibited Si-O-Si stretching and bending bands. The band at around 1225 cm-1 corresponded to the vibrational mode of the asymmetric stretch of Si-O-Si, and the band at 505 cm-1 corresponded to the vibrational mode of the bending of Si-O-Si [29, 30]. After 7 days of immersion, the band of silicate at 505 cm-1 was shifted to 450 cm-1, and the band at 795 cm-1 corresponded to the symmetric stretch of Si-O. Furthermore, the formation of biological HA or HCA on the surfaces of the scaffolds was observed in the spectra, the appearance of two bands at 550 and 562 cm-1 was attributed to PO4 bending vibration, and the band at 1075 cm-1 was caused by PO4 symmetric stretching vibration [31]. After 14 days, an increase in the relative intensities of the symmetric stretch of Si-O band at 795 cm-1 and the bands associated to PO4 bending vibrations at 550 and 562 cm-1 was observed.

FTIR spectra of the composite microsphere sample before and after immersion in SBF: (A) before immersion in SBF, (B) after 7 days in SBF, and (C) after 14 days in SBF.
*, silica gel; ▾, apatite.
3.3.2 XRD analysis
The XRD patterns of composite scaffolds before and after soaking in SBF for 7 and 14 days are shown in Figure 5. On the latter, we superimposed the diagrams corresponding to the various times of immersion in SBF. In the untreated pattern, the sample almost took an amorphous state indicative of the internal disorder and glassy nature of these materials. After 7 days of immersion in SBF, the recorded diagram revealed two new peaks located at 26° and 32°. These two major peaks were assigned to be (211), (002) apatite according to the standard JCPDS cards (09-0432) [32, 33]. After 14 days of immersion, the peaks became more apparent. The broadness of XRD reflected the crystal size and lattice strain: the broader the peak, the smaller or less perfect the crystal. The low intensity and broadness of the bands can be understood because the XRD signal came from a thin deposited layer [34].
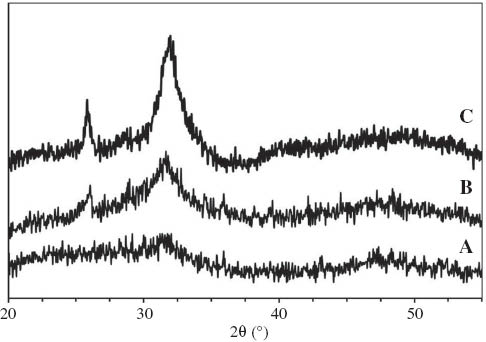
XRD patterns for the composite microsphere sample before and after immersion into SBF: (A) before immersion in SBF, (B) after 7 days in SBF, and (C) after 14 days in SBF.
3.3.3 SEM observations
The in vitro bioactivity of composite scaffolds was confirmed by immersing them in SBF at 37°C. Figure 6 shows the SEM micrographs of the composite scaffold surface after immersion in SBF for 1, 7, and 14 days. The mineral particles with a spherical morphology were nucleated and formed onto the surface of composite microspheres in just 1 day of immersion in SBF. After 7 days, the smooth spheres turned into pseudospherical agglomerates of flake-shaped particles on the surface of the microspheres. The amount of HCA crystals increased progressively in such a way that the composite scaffold was almost completely covered after 14 days.

SEM micrographs of the composite scaffold surface after immersion into SBF: (A and B) after 1 day in SBF, (C and D) after 7 days in SBF, and (E and F) after 14 days in SBF.
3.3.4 Elemental analysis
The SBF solutions of the bioactivity tests were analyzed using ICP-AES to characterize the concentration of Ca, P, Mg, Sr, and Si ion elements as a function of immersion time. The results helped to understand the phenomenon of ion transfer, which will take place between the composite scaffold surface and the SBF. Figure 7 correlates the elemental concentrations of Ca, P, Mg, Sr, and Si ions before the immersion in SBF solution and after different immersion times. Figure 7 shows the profiles of dissolution of BG content of scaffold in SBF. As can be observed, the P concentration in the solution increased during the first hours of soaking and then decreased continuously until day 14; after that, no significant change took place until day 21. It was worth mentioning that phosphorous ions were released very fast; thus, the P concentration reached a maximum and then decreased with the development of a Ca-P-rich layer.

Variation of phosphorus, calcium, strontium, and magnesium concentrations in SBF with immersion time.
The concentration of silicon released into the SBF solution increased rapidly during the time of immersion. The Si concentration in SBF increased from a value of 0 to approximately 20 ppm until day 3; the breaking up of the outer silica layers of the network led to this release of Si ions in the first phase of dissolution [35]. Moreover, the Si release profile revealed that there was a continuous Si release throughout the 3-week immersion period, and the release rate decreased after 4 days of immersion. These data supported the idea that the silicate ions leached out from BG attached to the polymeric surface and served as nucleation sites. Because the modified BG powders were encapsulated inside the microspheres, Si leaching was a time-dependent and dynamic process and might have kept the surface of the scaffold reactive during immersion [36].
It was notable that rate of Ca2+ release from the substrate and the formation of phosphate or apatite controlled the Ca2+ concentration. A rapid increase in the Ca2+? concentration occurred during the first 3 days of the immersion time; following a gradual increase up to 7 days, the Ca2+ concentration slightly decreased up to 21 days. The Mg2+ concentration in the SBF solution indicated a steep increase within the first day of immersion; after a maximum at 3 days, there was no significant change up to 7 days. This procedure was followed by a slight decrease in its level until 21 days of immersion. In addition, the Sr2+ concentration in the SBF solution depicted a steep increase within the first 3 days of immersion followed by a slight increase in its level between 3 and 7 days of immersion. Finally, the Sr2+ concentration did not change significantly between 7 and 21 days of immersion [37].
3.4 In vitro degradation
The degradation of PPF involved chain scissions of ester bond linkages in the polymer backbone by the hydrolytic attack of water molecules [38–40]. The degradation products of PPF networks have been previously characterized to be propylene glycol, poly-(acrylic acid-co-fumaric acid), and fumaric acid, a substance that occurs naturally as part of the Krebs cycle [41]. The in vitro degradation behavior of PPF/BG scaffolds was evaluated by examining the change in weight over time [42]. The effect of incorporating BG filler into the network on the degradation behavior of PPF scaffolds was also evaluated. Figure 8 shows the mass loss profiles of PPF and PPF/BG composite scaffolds during the 12 weeks of degradation in Ringer’s solution. Initially, the weight of PPF scaffolds remained relatively constant during the first 3 weeks. Then, the weight started to decrease slowly, losing 12.5% of their initial mass by week 12. In addition, the weight of composite scaffolds decreased by 10.2% during this period. The mass loss profiles of composite scaffolds were near the pure polymer formulations.

Normalized mass of PPF and PPF/BG scaffolds as a function of time.
Data are mean±SD (n=3).
To evaluate the degradation of the scaffolds, the solution pH for the samples was compared to Ringer’s solution that was held under the same 37°C conditions but did not contain any samples (blanks). A storage Ringer’s solution with a lower pH than the blank solution would indicate the release of acidic products from the microspheres. Figure 9 shows the difference in pH between the storage and blank buffer solutions for PPF and composite scaffolds. The pH of the solutions containing composite scaffolds did not noticeably vary from the blank solutions for the first week, the solutions containing PPF scaffolds showed an initial decrease in storage pH during the first week, and the difference between the storage and the buffer pH was negligible. After the first week, the pH of the composite scaffold degradation samples varied only slightly for the remainder of the study. On the contrary, the PPF scaffold degradation samples showed a consistent reduction in pH after the first week through week 12, and they did demonstrate a gradual degradation after 1 week with an initial sharp decrease in pH followed by a more consistent, although less dramatic, decrease in pH during the 12 weeks of in vitro degradation.

Deviation of Ringer’s solution pH from a blank Ringer’s solution for PPF scaffolds and PPF/BG composite scaffolds groups as a function of degradation time.
Data are mean±SD (n=3).
The incorporation of the BG filler into the polymer matrix showed a prolonged effect on PPF degradation. BG and other fillers had been used in degradable polymer systems as internal buffers to neutralize the local pH and inhibit any autocatalytic degradation [43, 44]. This would then delay the signs of degradation that occurred in the base PPF formulation beyond 12 weeks of this study.
3.5 Mechanical testing
The compressive modulus and yield strength of PPF and PPF/BG scaffolds over the 12-week degradation period are presented in Figure 10. As shown in Figure 5, PPF scaffolds initially possessed a compressive modulus of 573.2±34.8 MPa, which remained constant throughout the degradation period. PPF/BG composite scaffolds possessed an original compressive modulus of 581.9±42.56 MPa, which was not significantly higher than PPF scaffolds. However, for the remainder of the degradation, the modulus of composite scaffolds remained constant as well. Thus, the incorporation of BG particles into PPF microspheres did not significantly affect the compressive modulus of porous scaffolds during the 12 weeks of in vitro degradation. The yield strength values fell between 34.19±4.64 and 40±4.07 MPa for PPF scaffolds and between 36.18±3.92 and 42.56±4.78 MPa for PPF/BG composite scaffolds throughout the 12 weeks of degradation. The values were not influenced significantly by the presence of BG particles in PPF microspheres.

(A) Compressive modulus and (B) yield strength of PPF and PPF/BG scaffolds over the 12-week degradation period.
Therefore, both types of scaffolds maintained their compressive mechanical properties during 12 weeks of in vitro degradation. Similarly, separate studies by Göpferich et al. [41] and Hedberg et al. [45] showed that porous scaffolds made from PPF-based polymers maintained their compressive mechanical properties for 26 and 32 weeks of in vitro degradation, respectively.
4 Conclusion
In this study, we fabricated novel 3D PPF/BG composite scaffolds based on a sintered microsphere technique. These composite scaffolds induced the formation of apatite phase at their surfaces within a few days of immersion in the SBF solution as confirmed by XRD, FTIR, and SEM analyses. In addition, the in vitro degradation of PPF and PPF/BG composite scaffolds were conducted. The results showed that both PPF/BG composite scaffolds and PPF scaffolds were slowly degraded in vitro and both maintained their mechanical properties during the 12-week degradation study.
Acknowledgments
This study was part of the Ph.D. thesis of Dr. Yashar Rezaei, which was supported by the Research Deputy of Tehran University of Medical Sciences (grant no. 91-03-70-19292). The authors thank Dr. Mohammadreza Tahriri (Biomaterials Group, Faculty of Biomedical Engineering, Amirkabir University of Technology) for his continued support and kind assistance.
References
[1] Singh M, Morris CP, Ellis RJ, Detamore MS, Berkland C. Tissue Eng. Part C Methods 2008, 14, 299–309.10.1089/ten.tec.2008.0167Search in Google Scholar
[2] Brown JL, Nair LS, Laurencin CT. J. Biomed. Mater. Res. Part B Appl. Biomater. 2008, 86, 396–406.10.1002/jbm.b.31033Search in Google Scholar
[3] Stephens D, Li L, Robinson D, Chen S, Chang H, Liu RM, Tian Y, Ginsburg EJ, Gao X, Stultz T. J. Controlled Release 2000, 63, 305–317.10.1016/S0168-3659(99)00205-9Search in Google Scholar
[4] Dhandayuthapani B, Yoshida Y, Maekawa T, Sakthi Kumar D. Int. J. Polym. Sci. 2011, 2011.10.1155/2011/290602Search in Google Scholar
[5] Kasper FK, Tanahashi K, Fisher JP, Mikos AG. Nat. Prot. 2009, 4, 518–525.10.1038/nprot.2009.24Search in Google Scholar
[6] Fisher JP, Timmer MD, Holland TA, Dean D, Engel PS, Mikos AG. Biomacromolecules 2003, 4, 1327–1334.10.1021/bm030028dSearch in Google Scholar
[7] Peter SJ, Lu L, Kim DJ, Stamatas GN, Miller MJ, Yaszemski MJ, Mikos AG. J. Biomed. Mater. Res. 2000, 50, 452–462.10.1002/(SICI)1097-4636(20000605)50:3<452::AID-JBM20>3.0.CO;2-0Search in Google Scholar
[8] Kim K, Dean D, Mikos AG, Fisher JP. Biomacromolecules 2009, 10, 1810–1817.10.1021/bm900240kSearch in Google Scholar
[9] Sabir MI, Xu X, Li L. J. Mater. Sci. 2009, 44, 5713–5724.10.1007/s10853-009-3770-7Search in Google Scholar
[10] Yaszemski MJ, Payne RG, Hayes WC, Langer RS, Aufdemorte TB, Mikos AG. Tissue Eng. 1995, 1, 41–52.10.1089/ten.1995.1.41Search in Google Scholar
[11] Yaszemski MJ, Anderson AB, Dallmier AW, Chudzik SJ, Duran LW, Guire PE, Hergenrother RW, Lodhi MA. Biomaterials in Orthopedics. CRC Press, Macrel Dekker, NY, 2003.10.1201/b14227Search in Google Scholar
[12] Yunos DM, Bretcanu O, Boccaccini AR. J. Mater. Sci. 2008, 43, 4433–4442.10.1007/s10853-008-2552-ySearch in Google Scholar
[13] Schepers E, de Clercq M, Ducheyne P, Kempeneers R. J. Oral Rehabil. 1991, 18, 439–452.10.1111/j.1365-2842.1991.tb01689.xSearch in Google Scholar
[14] Ducheyne P, Ei-Ghannam A, Shapiro I. J. Cell. Biochem. 1994, 56, 162–167.10.1002/jcb.240560207Search in Google Scholar
[15] El-Ghannam A, Ducheyne P, Shapiro I. Biomaterials 1997, 18, 295–303.10.1016/S0142-9612(96)00059-2Search in Google Scholar
[16] El-Ghannam A, Ducheyne P, Shapiro IM. J. Biomed. Mater. Res. 1997, 36, 167–180.10.1002/(SICI)1097-4636(199708)36:2<167::AID-JBM5>3.0.CO;2-ISearch in Google Scholar
[17] El-Ghannam A, Ducheyne P, Shapiro I. J. Orthop. Res. 1999, 17, 340–345.10.1002/jor.1100170307Search in Google Scholar
[18] Boccaccini AR, Judith AR, Larry LH, Veronique M, Robert J. A composites approach to tissue engineering. In 26th Annual Conference on Composites, Advanced Ceramics, Materials, and Structures: B: Ceramic Engineering and Science Proceedings. Cocoa Beach, Florida,Wiley Online Library, 2008. Vol 23.Search in Google Scholar
[19] Misra SK, Mohn D, Brunner TJ, Stark WJ, Philip SE, Roy I, Salih V, Knowles JC, Boccaccini AR. Biomaterials 2008, 29, 1750–1761.10.1016/j.biomaterials.2007.12.040Search in Google Scholar
[20] Maquet V, Boccaccini AR, Pravata L, Notingher I, Jérôme R. Biomaterials 2004, 25, 4185–4194.10.1016/j.biomaterials.2003.10.082Search in Google Scholar
[21] Rezaei Y, Moztarzadeh F, Shahabi S, Tahriri M. Synth. React. Inorg. Metal Organic Nano-Metal Chem. 2014, 44, 692–701.10.1080/15533174.2013.783869Search in Google Scholar
[22] Shung AK, Timmer MD, Jo S, Engel PS, Mikos AG. J. Biomater. Sci. Polym. Ed. 2002, 13, 95–108.10.1163/156856202753525963Search in Google Scholar
[23] Kempen DH, Lu L, Kim C, Zhu X, Dhert WJ, Currier BL, Yaszemski MJ. J. Biomed. Mater. Res. Part A 2006, 77, 103–111.10.1002/jbm.a.30336Search in Google Scholar
[24] Borden M, Attawia M, Khan Y, Laurencin CT. Biomaterials 2002, 23, 551–559.10.1016/S0142-9612(01)00137-5Search in Google Scholar
[25] Kokubo T, Takadama H. Biomaterials 2006, 27, 2907–2915.10.1016/j.biomaterials.2006.01.017Search in Google Scholar
[26] Silverstein R, Webster F. Spectrometric Identification of Organic Compounds. Wiley.com, John Wiley, NY, 2006.Search in Google Scholar
[27] Shung AK, Timmer MD, Jo S, Engel PS, Mikos AG. J. Biomater. Sci. Polym. Ed. 2002, 13, 95–108.10.1163/156856202753525963Search in Google Scholar
[28] Kharas GB, Kamenetsky M, Simantirakis J, Beinlich KC, Rizzo AM, Caywood GA, Watson K. J. Appl. Polym. Sci. 1997, 66, 1123–1137.10.1002/(SICI)1097-4628(19971107)66:6<1123::AID-APP13>3.0.CO;2-2Search in Google Scholar
[29] Clark A, Hench L, Kim C. J. Biomed. Mater. Res. 1992, 26, 1147.10.1002/jbm.820260905Search in Google Scholar
[30] Rehman I, Hench LL, Bonfield W, Smith R. Biomaterials 1994, 15, 865–870.10.1016/0142-9612(94)90044-2Search in Google Scholar
[31] Videau J, Dupuis V. Eur. J. Solid State Inorg. Chem. 1991, 28, 303–343.Search in Google Scholar
[32] Yan H, Zhang K, Blanford CF, Francis LF, Stein A. Chem. Mater. 2001, 13, 1374–1382.10.1021/cm000895eSearch in Google Scholar
[33] You C, Miyazaki T, Ishida E, Ashizuka M, Ohtsuki C, Tanihara M. J. Eur. Ceram. Soc. 2007, 27, 1585–1588.10.1016/j.jeurceramsoc.2006.04.055Search in Google Scholar
[34] Jones JR. Acta Biomater. 2012, 9, 4457–4486.10.1016/j.actbio.2012.08.023Search in Google Scholar
[35] Mami M, Oudadesse HA, Dorbez-Sridi R, Capiaux HE, Pellen-Mussi PA, Chauvel-Lebret D, Cathelineau G. Ceram. Silikáty 2008, 52, 121–129.Search in Google Scholar
[36] Qiu QQ, Ducheyne P, Ayyaswamy PS. J. Biomed. Mater. Res. 2000, 52, 66–76.10.1002/1097-4636(200010)52:1<66::AID-JBM9>3.0.CO;2-2Search in Google Scholar
[37] Hench LL, Polak JM. Science 2002, 295, 1014–1017.10.1126/science.1067404Search in Google Scholar
[38] Timmer MD, Ambrose CG, Mikos AG. Biomaterials 2003, 24, 571–577.10.1016/S0142-9612(02)00368-XSearch in Google Scholar
[39] He S, Timmer MD, Yaszemski MJ, Yasko AW, Engel PS, Mikos AG. Polymer 2001, 42, 1251–1260.10.1016/S0032-3861(00)00479-1Search in Google Scholar
[40] Göpferich A. Biomaterials 1996, 17, 103–114.10.1016/0142-9612(96)85755-3Search in Google Scholar
[41] Fisher JP, Holland TA, Dean D, Mikos AG. Biomacromolecules 2003, 4, 1335–1342.10.1021/bm0300296Search in Google Scholar
[42] Kempen DH, Lu L, Zhu X, Kim C, Jabbari E, Dhert WJ, Currier BL, Yaszemski MJ. J. Biomed. Mater. Res. Part A 2004, 70, 293–302.10.1002/jbm.a.30080Search in Google Scholar
[43] Agrawal C, Athanasiou KA. J. Biomed. Mater. Res. 1997, 38, 105–114.10.1002/(SICI)1097-4636(199722)38:2<105::AID-JBM4>3.0.CO;2-USearch in Google Scholar
[44] Kikuchi M, Koyama Y, Takakuda K, Miyairi H, Tanaka J. Key Eng. Mater. 2001, 192, 677–680.10.4028/www.scientific.net/KEM.192-195.677Search in Google Scholar
[45] Hedberg EL, Shih CK, Lemoine JJ, Timmer MD, Liebschner MA, Jansen JA, Mikos AG. Biomaterials 2005, 26, 3215–3225.10.1016/j.biomaterials.2004.09.012Search in Google Scholar
©2016 by De Gruyter
This article is distributed under the terms of the Creative Commons Attribution Non-Commercial License, which permits unrestricted non-commercial use, distribution, and reproduction in any medium, provided the original work is properly cited.
Articles in the same Issue
- Frontmatter
- Original articles
- In vitro degradation and bioactivity of poly(propylene fumarate)/bioactive glass sintered microsphere scaffolds for bone tissue engineering
- Properties enhancement in multiwalled carbon nanotube-magnetite hybrid-filled polypropylene natural rubber nanocomposites through functionalization and processing methods
- Synthesis of magnetic photocatalyst and sensitization properties of polypyrrole
- Effect of silane coupling agent on the mechanical properties of nitrile butadiene rubber (NBR)/organophilic montmorillonite (OMMT) nanocomposites
- Monitoring of jute/hemp fiber hybrid laminates by nondestructive testing techniques
- Size effects on the in-plane mechanical behavior of hexagonal honeycombs
- Investigation on corrosion performance of multilayer Ni-P/TiO2 composite coating on steel
- Investigation of pozzolanic activity of volcanic rocks from the northeast of the Black Sea
- The effect of delayed ettringite formation on fine grained aerated concrete mechanical properties
- Effect of early-age freeze-thaw exposure on the mechanical performance of self-compacting repair mortars
- Modeling cement hydration by connecting a nucleation and growth mechanism with a diffusion mechanism. Part I: C3S hydration in dilute suspensions