Modeling cement hydration by connecting a nucleation and growth mechanism with a diffusion mechanism. Part I: C3S hydration in dilute suspensions
-
Xueyu Pang

 and
Christian Meyer
and
Christian Meyer

Abstract
A particle-based C3S hydration model, which mathematically connects a nucleation and growth controlled mechanism with a diffusion controlled mechanism, is developed in this study. The model is first formulated and fitted with C3S hydration in stirred dilute suspensions in Part I where interactions between different particles can be ignored, and further developed and fitted with Portland cement paste hydration in Part II to account for inter-particle interactions. Excellent agreement was observed between experimental and modeled results. Three critical rate-controlling parameters, including a parallel growth rate constant, a perpendicular growth rate constant and a diffusion constant, were identified from the proposed model. The dependencies of these parameters on particle size and initial quantity of nuclei are investigated in Part I while their dependencies on cement composition, water-cement ratio, and curing condition are studied in Part II.
1 Introduction
An appropriate simulation of cement hydration is essential for predicting the various physical and mechanical properties of cement-based materials. The hydration of Portland cement is a complex process and many detailed features are still not clearly understood today. Recent reviews of the numerous mathematical models and simulations developed in the past 40 years show that a complete simulation that can accurately simulate both the hydration kinetics and the microstructure development still does not exist [1, 2]. This study further explores the possible mechanisms of cement hydration and introduces a new and relatively simplified numerical model (with only three independent parameters) to simulate the hydration kinetics.
The complexity of cement hydration process is partly due to the multiphase nature of Portland cement and the impurities present in its various phases and their interactions. As the major component whose hydration kinetics strongly resembles that of Portland cement itself, pure C3S (cement chemistry notation: C=CaO, S=SiO2, H=H2O, A=Al2O3, F=Fe2O3) or alite (an impure form of C3S) is often used to study the kinetics of cement hydration. Portland cement and C3S hydration process is traditionally subdivided into five periods according to the derivative curve of hydration kinetics [3, 4]: (i) initial reaction, (ii) induction (dormant) period, (iii) acceleration period, (iv) deceleration period, and (v) steady state of slow reaction. The initial reaction, which probably depends on a number of factors such as water-to-cement (w/c) ratio and mixing method, occurs within a very short period of time and is difficult to measure accurately.
The early hydration mechanisms (transition from period 1 to period 2) are still not well understood today. At room temperature, the cumulative heat evolution measured during the initial reaction peak of alite is <1% of its total enthalpy of hydration [5]. As the total amount of hydration achieved during the first two periods is very small, cement hydration models are typically developed to simulate the last three periods of hydration only that are often referred to as the main hydration. The main hydration is traditionally believed to be controlled by a mechanism that gradually transforms from nucleation and growth (NG) controlled to diffusion controlled (DC). It is now well established that period 3 is controlled by the NG mechanism [1]. However, many details with regard to the shift of the rate-controlling mechanism are still uncertain and there is no clear separation point between period 4 and period 5. Some recent studies have shown that the NG mechanism can be used to model period 4 but did not rule out an eventual transition to the DC mechanism [1, 3, 6, 7]. The feasibility of using the traditional assumption to model period 4 will be further discussed in Part II.
Cement hydration models developed based on the NG mechanism cannot usually be used to explain hydration at later ages. A diffusion model, which cannot explain hydration at early ages (typically t<10–20 h), has been successfully used to model cement hydration up to 1000 h [8, 9]. Therefore, in order to successfully model the entire hydration process, it is most appropriate to combine a NG mechanism with a DC mechanism. The effectiveness of such a combined model to simulate the hydration behavior of C3S paste has been demonstrated by many investigators [8–18]. However, test data were traditionally fitted with two completely different models, which often resulted in discontinuities at the transition points [8–18]. In this study, a new type of NG model developed from the particle level is proposed while an existing DC model developed on the same scale is modified such that the two models are compatible with each other and can be continuously connected.
As cement hydration is an extremely complex process, development of the model in Part I starts with a much-simplified system: C3S hydration in stirred dilute suspensions with constant lime concentrations, where neither inter-particle interaction nor calcium hydroxide (CH) nucleation could occur. The model is fitted with previously published experimental data by Garrault et al. [19–22]. It should be pointed out that Garrault et al. [20, 22] had originally proposed a cluster model to simulate C3S hydration, where a gigantic square matrix was used to describe the entire initial C3S grain surface. The original model was only applicable to the NG stage of hydration, but has recently been further developed to simulate the entire hydration process [23]. The advantage of the model presented here over the cluster model is that it is analytical, has smaller number of independent parameters, it is less calculation intensive, and it is easier to use. In addition, the model can easily provide a much better time resolution than the cluster model due to its small calculation requirements. In Part II, the model is expanded to account for the hydration of Portland cement paste.
2 Model formulation
2.1 Theoretical background
The essence of the classical equations for modeling the NG mechanism (Avrami equation) [24, 25] is the introduction of the concept of extended volume to account for impingement between different growing nuclei. This concept, together with a similar one (extended area), has been used repeatedly to modify the original Avrami equations such that they can be applied more appropriately to cement hydration [3, 6, 26]. In this study, the extended area is defined as the total area of hydration product if no impingement between different nuclei occurred. The classical NG equations were originally developed for solid phase transformations from one phase (α) to another (β). The extended volume (
where V is the total volume, while Vα and Vβ are the volumes of phase α and β, respectively.
One of the most effective and straightforward models for the DC mechanism was proposed by Fujii and Kondo in 1974 [27]. The model has been applied successfully to fit experimental data of C3S hydration by many investigators [8–18]. In this model, it was assumed that the hydration products formed during the propagative NG stage do not hinder the diffusion of water due to their relatively high porosity (low packing density). It was further assumed that after the C3S particle is completely covered by hydration product, a less permeable layer is formed between the earlier hydration products and the anhydrous C3S core. These assumptions are consistent with microstructure observations, as it has been found that calcium-silicate-hydrate (C-S-H) formed at early stages (outer product) had foil-shape or fibrillar morphology and low density while the inner C-S-H formed at later stages was much denser and was composed of small globular particles more homogeneously distributed [5]. Therefore, the rate of reaction after the NG stage was assumed to be controlled by diffusion of water through the inner hydrated layer. Consequently, if hydration enters the DC stage at time td, then [27],
where R and Rd are the radii of the anhydrous core after hydration time t and td, respectively, and D is the diffusion constant of water through the inner C-S-H layer (in m2/h or μm2/h). However, it is apparent that Fujii’s model does not apply to the vicinity of td (i.e., the assumed transition time from the NG to DC stage) as it predicts the hydration rate to approach infinity [Eq. (2)]. This is due to the mathematical simplification of the model, which assumes the transition from the NG to DC stage occurs instantaneously for a single particle, while in reality this should occur over a period of time. As will be discussed in Section 2.3, the slope discontinuity problem may be resolved by a mathematical fix, that is, introducing a pseudo time when hydration become diffusion controlled, which precedes td.
The dependence of hydration rate on particle sizes during both the NG and DC stages has been widely recognized [5, 15, 22, 28]. Studies have also found that the effect of particle size distribution on overall hydration kinetics can be accounted for by a simple law of mixtures (linear addition) [5, 28]. Therefore, the best way to model hydration kinetics using Eq. (3) would be to apply the equation to individual particles of given size and then apply the law of mixtures. This allows us to identify individual NG to DC transition times for each particle size instead of a bulk transition time for the entire representative volume. Such implementation calls for a NG model at the particle scale, which will be discussed in Section 2.2.
For particle-based models, it is critical to establish a correlation between the degree of hydration of a cement particle and the size of its anhydrous core. Assume the original radius of a spherical anhydrous particle is R0, and the radius of the anhydrous core at time t is R, then the relationship between degree of hydration (α) and R can be obtained as follows:
where Vhc and V0 are the hydrated volume and the total original volume of the particle, respectively. The above equation may also be written as
2.2 Modeling the nucleation and growth controlled stage
Hydration of C3S produces C-S-H gel and CH. Experimental results have shown that C-S-H gel primarily nucleates and grows on particle surfaces while CH typically nucleates and grows in the pore spaces, with most researchers believing the former to be rate controlling [5, 29]. The fact that C3S hydration in solutions of constant lime concentrations (with no nucleation of CH) exhibits a similar behavior as C3S paste hydration further confirms this assertion [19–22].
How the nuclei are formed during C3S or in cement hydration is one of the most controversial issues in developing NG models. Scherer et al. [26] have demonstrated that cement hydration kinetics can be modeled with the boundary nucleation and growth model by assuming either constant nucleation rate or a constant number of initial nuclei (site-saturated nucleation), with the latter providing a better fit to the derivative curve. It has been suggested that the decrease of silicon ion concentration during early hydration (from the peak reached within a few minutes after mixing to the end of the induction period) correlates with the precipitation of C-S-H nuclei from the solution [19–21]. Due to the relatively short duration, this period of hydration may be simplified as an instantaneous nucleation process. The “growth” of these initially formed nuclei then results in the acceleration period of C3S hydration. Thomas et al. [30] pointed out that the macroscopic growth kinetics is technically a nucleation process in that the formation of new C-S-H particles is caused by stimulation of existing C-S-H particles. The autocatalytic theory is supported by the fact that the hydration of C3S is greatly accelerated by small additions of C-S-H seeds. Such behavior may imply that nucleation at new sites is less likely to happen during the “growth period” as it seems easier for the ions to attach to C-S-H surfaces than C3S surfaces. Even if new nucleation does occur, it has been demonstrated that early hydration kinetics is much more sensitive to the amount of instantaneously formed nuclei than the subsequent nucleation rate [31]. The model presented here only investigates the case of site-saturated nucleation.
As many details of the dissolution, nucleation, and growth process are still not known, simplifications and assumptions have to be made to represent this process mathematically. In this study, it is assumed that all nuclei are formed instantaneously on cement particle surfaces at the beginning of hydration. These nuclei are then assumed to grow at two uniform rates: parallel to the particle surface at a rate of g1 and perpendicular to the particle surface at a rate of g2. As nuclei growth is confined within the pore-space and accompanied by dissolution of the anhydrous core, the nuclei may not grow into regular shapes. The model presented here will test different growth scenarios to study the effect of the shape of the nuclei on the modeled results. The three simplified growth models include the cone model, the half-ellipsoid model, and the modified cone model. As will be shown later, these different growth scenarios only affect the fitted nuclei growth parameters and have very little effect on the fitting results of the model.
2.2.1 The cone model
In this model, nuclei are assumed to grow into cones due to the anisotropic growth rates. The total volume of the cones (i.e., hydration products) grown on a cement particle can be obtained by integration. As shown in Figure 1, consider a plane parallel to the particle surface at height y above the surface (ignore the curvature effect); the area of the intersection between the plane and the cone can be expressed as

Schematic illustration of nuclei growth on a cement particle (cone model).
Let A0 be the original surface area of the cement particle, and n the number of nuclei per unit surface area at the beginning of hydration (nucleation density). The total extended area of hydration product at height y can be obtained as
If we ignore the surface area change of the anhydrous core and the curvature effect (i.e., assume the available area for growth on a cement particle always equals to its original surface area), the total extended area fraction of hydration product at height y becomes
The above assumption is only valid if the size of the cone is much smaller than that of a cement particle. The effect of such simplification on the modeled results will be further discussed in Section 3. The actual area fraction at height y is (taking into account overlap between different nuclei that are randomly distributed)
The total volume of hydration product can be obtained by integrating the actual area of hydration product from 0 to the total height of the cones (g2t). That is,
where erf is the error function. Assume the hydration of 1 unit volume of cement produces volume c of hydration product on the cement particle surface, the degree of hydration of a cement particle can be obtained as
At room temperature, the density of C3S is approximately 3.15 g/cm3 while the density of C-S-H is approximately 1.8 g/cm3 during early age (1 day) [32]. Hence, c may be assumed to be 1.75 for C3S hydration. A parallel growth rate constant
2.2.2 The half-ellipsoid model
This model is similar to the cone model except that nuclei are assumed to grow into half-ellipsoids instead of cones. Again, consider a plane parallel to the particle surface at height y above the surface (Figure 2), the area of the intersection between the plane and the half-spheroid can be expressed as

Schematic illustration of nuclei growth on a cement particle (half-ellipsoid model).
Using a similar derivation process as the cone model, one can obtain the degree of hydration of a cement particle as follows:
where erfi is the imaginary error function, while D+ is the Dawson function.
2.2.3 The modified cone model
In both the cone model and the half-spheroid model, the actual total area of hydration product at the surface of the anhydrous core (i.e., at y=0) is assumed to be
which means that complete coverage (Y=1) is approached asymptotically when the curvature effect is ignored. A finite transition time between the NG and DC stages can only be obtained if the surface area decrease of the anhydrous core due to dissolution is taken into account. The modified cone model is developed to resolve such inconsistency by introducing a growth scenario that takes into account the surface area decrease of the anhydrous core during hydration (i.e., calculating the available area for growth incrementally). It should be pointed out that the modified cone model presented here is not necessarily more accurate than the first two models as the surface area increase with increasing distance from the anhydrous core is still ignored in all three models. The modified cone model may be considered as a lower bound solution for the cone growth scenario as it assumes the most severe impingement condition possible.
In this model, nuclei are still assumed to grow into cones. However, calculation of the total volume of the cones grown on a cement particle is performed in two steps here. The first step calculates the lateral growth of the total base area of the cones (i.e., total area of hydration product at the surface of the anhydrous core); the second step calculates the total volume growth by assuming that the cones grow a layer of their base area during a small time interval. The total extended base area of the cones at time t is
The increase of the extended area during each time increment is
As the distribution of nuclei is random, the fraction of the extended area that forms during each time increment that is real will be proportional to the area fraction of the uncovered particle surface, that is,
where Ah is the actual base area of the cones while A is the total surface area of the anhydrous core. Apparently, the primary distinction of the modified cone model is that A is assumed to decrease with time due to dissolution, which renders Eq. (17) not integrable analytically. After substituting A0 and A, Eq. (17) becomes
During each time increment, the covered surface would grow a thickness of g2dt, hence the incremental change of the total volume of hydration product can be expressed as
therefore,
The degree of hydration as a function of t can be obtained by numerically integrating Eqs. (18) and (20). When the curvature effect is ignored (i.e., assume Ah=A0*Y), the integration gives the same results as the cone model,
2.3 Modeling the diffusion controlled stage
The equations derived in Section 2.2 are only valid for the NG stage, that is, before the particle is completely covered by hydration products. Therefore, the radius of the anhydrous core (R) shall be calculated continuously to make sure that the model is not applied beyond its applicable condition (Ah<4πR2). As in previous models [22, 27], the hydration of a cement particle is assumed to enter the DC stage when the anhydrous core is completely covered by hydration products. Hence, td and Rd are determined numerically when the condition (Ah≥4πR2) is satisfied. Fujii’s DC model [Eq. (3)] has to be modified as follows to eliminate the inaccurate portion of the model in the vicinity of td,
where tpd is the pseudo time when hydration becomes diffusion controlled and Rpd=R(tpd) is the pseudo radius of the anhydrous core at time tpd. One crucial boundary condition for the transition from nucleation and growth controlled hydration to diffusion controlled hydration is that the rate of hydration should be continuous. In other words, the rate of hydration must be the same at the transition point. As shown in Eq. (4), the degree of hydration is directly related to the radius of the anhydrous core. For diffusion controlled hydration,
For nucleation and growth controlled hydration,
where dα/dt is the rate of hydration, which varies with different nucleation and growth models (See Section 2.2). The difference between the pseudo time (tpd) and the assumed real time (td) when hydration enters the DC stage can be derived by combining Eqs. (23) and (24) and substituting dα/dt obtained from Eqs. (11), (13), and (20) at time td,
where td and Rd are the values of t and R obtained at the end of the NG stage. The value of lag determined from this study ranges from 8 to 30 min for different samples and different growth scenarios. From Eq. (22),
Combining Eqs. (4) and (22) and replacing the pseudo terms with the real ones, the degree of hydration for the DC stage is derived as follows:
2.4 Modeling the total hydration kinetics
The hydration of a single cement particle with a radius of R0 can now be modeled continuously with only three rate-controlling parameters: S, K, and D, where S is a coupled parameter related to nucleation density and the nuclei parallel growth rate and K is a coupled parameter related to the nuclei perpendicular growth rate and the average density of hydration products growing on the cement particle surface. The total degree of hydration of a cement sample is then simply the weighted average degree of hydration of all particles in the sample,
where αT(t) is the total degree of hydration of the sample; α(R0, t) is the degree of hydration of particles with a mean radius of R0; f(R0) is the weight fraction of particles with a mean radius of R0 and N is the total number of gradations according to the particle size distribution (PSD). The transition from NG stage to DC stage is simulated separately for each particle as they occur earlier for smaller particles. The final computer program developed for this study takes particle size distribution data as input and gives the total degree of hydration as a function of time as output. Fitting the model with experimental data can be performed by first varying S and K simultaneously to obtain a good fit to test data during early hydration. D is then allowed to vary independently to obtain a good fit to test data during later stages. Best fit was considered to be obtained when the model provided good visual agreements with both the integral curve and the derivative curve (if available) of hydration kinetics. For each growth scenario, and a sample with a known PSD, there is only one set of parameters that could provide the best fit to the experimental data. The effect of each parameter on the hydration kinetics profiles are illustrated in detail in Section 4.
Compared to many recently published models [6, 26, 31], the model proposed in this study is rather simplified with a minimum number of independent parameters. Biernacki and Xie have extracted a much larger number of parameters (12 fixed and eight adjustable) by adopting a mass continuity-based continuum approach to model C3S hydration [31]. While the model presented here may lack certain degree of flexibility in considering all the possible influencing factors of C3S/cement hydration, the results of this study suggest that it is not possible to independently determine all the parameters by fitting hydration kinetics data only.
3 Model verification: the effects of particle size distribution
Garrault et al. studied the effect of particle size on hydration kinetics of C3S in stirred saturated lime solutions with a liquid-to-solid ratio of 50:1 [22]. The lime content in the solution was kept constant to avoid dependence of hydration rate on lime concentration. Five samples with median diameters of 7, 10, 11, 12.5, and 14 μm, designated as sample 1, 2, 3, 4, and 5 respectively, were obtained by sedimentation of a C3S suspension in ethanol. The particle size distributions of the samples were measured in about 10–15 gradations in the original experiment and re-digitized to more than 50 gradations. The total amount of hydration product (C-S-H) produced was measured for a period of 20 h for each sample. The data were re-digitized and converted to degree of hydration assuming the hydration of 1 mol of C3S produces 1 mol of C1.7SH4 [33]. All three models developed in this study were fitted with the experimental data. Figure 3 shows the fitted results of the modified cone model as an example. The best-fit curves obtained with the various models are almost identical. Hence, the assumed growth scenario and impingement severity on a single particle (the modified cone model assumes more severe impingement than the cone model) has relatively small effect on the overall quality of the model and an excellent fit can always be obtained even though the assumed growth mechanism is not strictly accurate. The obtained model parameters are listed in Table 1. The higher specific surface area calculated in this study compared to the originally reported values is likely due to the larger number of gradation used during re-digitization of the PSD graph. The fitted diffusion constants remain invariant among different models, which are identical during the DC stage, while the fitted growth parameters (S and K) vary systematically with the assumed growth scenarios. The ratios of the growth parameters obtained from different models remain relatively constant for different samples. Further examination of the results shows that the transition time between the NG and DC stages predicted by these different models are nearly the same for particles of the same size. In other words, the growth parameters of different models are mainly adjusted to give the “correct” transition time that matches the experimental data. The more accurate the assumed growth scenario, the more accurate the fitted growth parameter becomes.
![Figure 3 Experimental [22] and modeled hydration kinetics of samples with different particle size distributions.](/document/doi/10.1515/secm-2013-0258/asset/graphic/j_secm-2013-0258_fig_003.jpg)
Experimental [22] and modeled hydration kinetics of samples with different particle size distributions.
Model parameters for different particle size brackets.
| Sample number | 1 | 2 | 3 | 4 | 5 | Ratioc |
|---|---|---|---|---|---|---|
| Median particle diameter (μm) | 7 | 10 | 11 | 12.5 | 14 | |
| Specific surface areaa (cm2/g) | 2730 | 1911 | 1737 | 1529 | 1365 | |
| Specific surface areab (cm2/g) | 3212 | 2340 | 2245 | 1955 | 1531 | |
| Modified cone model | ||||||
| | 0.011 | 0.011 | 0.016 | 0.017 | 0.018 | 1 |
| K=g2/c (μm/h) | 0.062 | 0.075 | 0.056 | 0.05 | 0.055 | 1 |
| D (μm2/h) | 0.003 | 0.002 | 0.0018 | 0.002 | 0.0018 | 1 |
| Cone model | ||||||
| | 0.0079 | 0.0079 | 0.0115 | 0.012 | 0.013 | 0.71∼0.72 |
| K=g2/c (μm/h) | 0.073 | 0.088 | 0.066 | 0.058 | 0.064 | 1.16∼1.17 |
| D (μm2/h) | 0.003 | 0.002 | 0.0018 | 0.002 | 0.0018 | 1 |
| Half-ellipsoid model | ||||||
| | 0.0073 | 0.0075 | 0.0105 | 0.0115 | 0.012 | 0.66∼0.68 |
| K=g2/c (μm/h) | 0.043 | 0.052 | 0.039 | 0.035 | 0.039 | 0.69∼0.70 |
| D (μm2/h) | 0.003 | 0.002 | 0.0018 | 0.002 | 0.0018 | 1 |
The parallel growth rate constant (
The nuclei growth rates on a polished C3S (sintered pellet) surface has been estimated experimentally using atomic force microscope without lime concentration control [21]. The estimated results were 4.1×10⁻¹¹ m/s (0.148 μm/h) for parallel growth rate (g1) and 1.8×10⁻¹¹ m/s (0.065 μm/h) for perpendicular growth rate (g2). Substituting the estimated value of g1 into the fitted values of S in Table 1, the nucleation density was estimated to range from 0.3 to 0.8 μm-2 for all different samples and growth scenarios, which is in good agreement with a range of 0.1–0.6 μm-2 obtained by applying the BNG model (assuming a fixed number of nuclei) to the calorimetric data of C3S paste hydration [26]. Bullard (personal communication) also estimated a value of 1.42 μm-2 using the kinetic cellular automaton model [34, 35]. Substituting a value of 1.75 for c into the fitted values of K in Table 1, the perpendicular growth rate was estimated to range from 0.088 to 0.13 μm/h, also in reasonable agreement with the experimental observation (0.065 μm/h). In particular, the half-ellipsoid model seems to give the best fit of perpendicular growth rate (from 0.061 to 0.091 μm/h for different samples).
The traditional nucleation and growth mechanism cannot explain the deceleration of C3S hydration rate in dilute suspensions, unless one assumes that nucleation and growth only occurs within a limited “reaction zone” close to the C3S particle surface [36]. If diffusion is the controlling mechanism here, the obtained diffusion constant should be directly related to the property of the diffusion barrier (i.e., the inner C-S-H hydration product in this case), as all C3S particles are completely surrounded by water all the time. As shown in Table 1, the fitted diffusion constant does not vary with the growth scenario and is largely independent of C3S particle size. The slightly higher value obtained for sample 1 could be due to experimental difficulties of accurately measuring the sizes of fine particles or due to the limited applicability of the model when applied to very fine particles as it assumes the size of a nucleus is much smaller than that of a cement particle.
The fitted diffusion constant D (1.8–3×10-15 m2/h) is in good agreement with previously obtained values for C3S paste hydration using similar models, which are typically of the order of 10-16–10-15 m2/h [8–18]. Somewhat higher diffusion constants were obtained by Bishnoi and Scrivener (10-15–10-14 m2/h) [5] as well as by Xie and Bienacki (1.1×10⁻¹³ m2/h) [2] when other diffusion models were applied. All these values are significantly lower than that suggested by Bullard who reports the diffusivity of H2SiO42- ion to be in the range of 10-8–10-7 m2/h [34]. For comparison, the effective diffusion constant for water into silica glass is estimated to be around 1.1×10⁻¹⁶ m2/h at 25°C if we extrapolate the test data obtained in the temperature range of 200–550°C to room temperature [37]. As the porosity of the C-S-H (i.e., the diffusion barrier for cement hydration) is believed to be much higher than that of a dense solid, such as silica glass [2], the extremely low values of diffusion constants are sometimes used as evidence that the DC mechanism cannot be used to explain cement hydration kinetics [2, 6]. However, it should be noted that many details about the diffusion mechanism, as well as the property of the inner C-S-H, are still not well understood today. For example, as the space inside the diffusion barrier is not enough to accommodate all hydration products, diffusion could occur simultaneously in opposite directions. Namely, while water needs to diffuse inward to the anhydrous core certain dissolved ions also have to diffuse outward to the pore spaces. Additionally, the ion concentrations at both sides of the diffusion barrier are also not known [2].
The diffusion equation used in this study was developed assuming a hydrating cement particle is fully surrounded by water, which is only true in dilute suspensions or during the early stage of cement paste hydration. With the progress of hydration, the depletion of water and the bridging among different cement particles in a paste may reduce the area fraction of the particle surface exposed to water and hence result in lower apparent diffusion constant over time. Such phenomenon would apparently be more pronounced at lower w/c ratios. Previous studies have reported that the apparent diffusion constant decreases with decreasing w/c ratio [8, 38]. Interestingly, as will be shown in Part II of this study, such dependency of diffusion constant on w/c ratio seems to disappear when inter-cement-particle impingements are taken into account in the model [39]. The diffusion constants obtained for Portland cement paste hydration are about two orders of magnitude higher than those obtained here [39]. This is probably due to the presence of other hydration products in the diffusion barrier, which increases its permeability.
4 Influence factors of the proposed model
By changing the value of each parameter of the model individually, their effects on the total hydration kinetics can be observed. The effects of different model parameters on the obtained hydration kinetics curves of sample 3 are shown in Figure 4. It appears that the parallel growth rate constant S mainly controls the time at which hydration rate peaks (i.e., the duration of the NG stage) and, to a lesser extent, the degree of hydration achieved during the NG stage. The perpendicular growth rate constant K mainly controls the magnitude of the peak hydration rate and the degree of hydration achieved during NG stage. The diffusion constant D only controls the rate of reaction during the DC stage. An important implicit influence factor of the model is the particle size distribution. Figure 5 shows the effect of initial particle size on hydration kinetics (integral curves) of different particles. The transition point from the NG to the DC stage was found to occur earlier for smaller particles than for larger ones with the degree of hydration achieved at the transition point decreasing significantly with increasing particle size. Therefore, for a sample with multiple particle sizes, the transition of the rate-controlling mechanism occurs through a period of time instead of a single point. The transition period of a multiple-particle model is assumed to start when the first particles enter the DC stage and end when all particles have entered the DC stage.

Effect of different model parameters on total hydration kinetics curves (the units of S, K, and D are h-2, μm/h, and μm2/h, respectively).
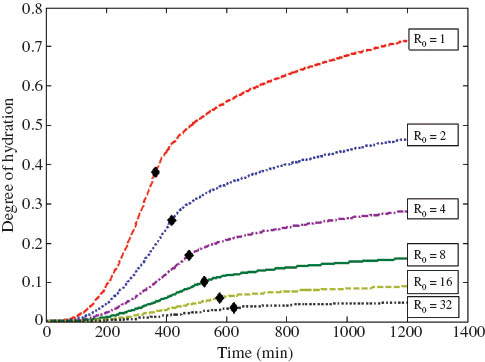
Effect of initial particle size on hydration kinetics of the particles (R0 is the initial particle radius in μm; ♦ indicates the transition point between nucleation and growth and diffusion controlled stages).
The fact that C3S hydration during the DC stage has been successfully modeled with a single particle size in previous studies [8–18] suggests that every sample has a characteristic particle size that can be used to approximately model its total hydration kinetics. The characteristic sizes for the five samples were found by manual fitting to be 3.18, 4.3, 4.5, 5.1, and 6.5 μm, respectively, which are very close to the reciprocals of the weighted mean inverse radius from the PSD data (3.0, 4.1, 4.2, 4.9, and 6.2 μm, respectively). The results modeled with the characteristic particle sizes were compared with those modeled with multiple sizes (the entire particle population of the samples) in Figure 6. The curves obtained with these two different approaches only deviated slightly from each other during the NG stage and were almost identical during the DC stage.
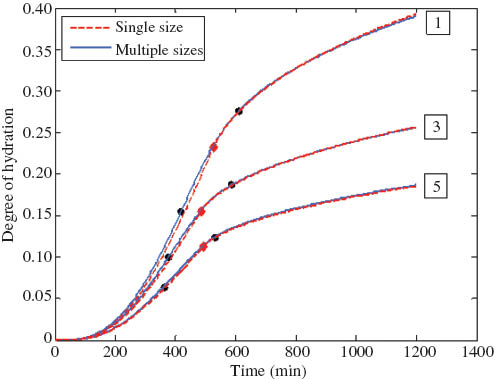
Comparison between model curves obtained with single particle size versus multiple particle sizes (♦ indicate transition points for single-particle model while · indicate the transition period for multiple-particle model).
5 Model verification: the effect of the number of initial nuclei
Garrault [20] has found that the quantity of C-S-H nuclei precipitated on a C3S sample varied with the lime concentration of the solution in which the sample was suspended. Specifically, the total quantity (N) of precipitated C-S-H for 20 g of C3S was found to be 50 μmol in a solution with a constant lime concentration of 11 mmol/l and 23 μmol in a saturated lime solution (22 mmol/l), resulting in a ratio of 2.17 for the initial nucleation density. Samples pretreated for 30 min at these two different lime concentrations (presumably wearing different amounts of initial nuclei) were further hydrated in saturated lime solutions to study the effect of initial nuclei on hydration kinetics. The modified cone model was fitted to experimental data by assuming only the number of initial C-S-H nuclei per unit surface area (which is proportional to S) was different for the two samples. As the particle size distribution data of the C3S sample was not published, a characteristic particle size had to be assumed. It turned out that there existed one set of best-fit model parameters for each assumed representative particle size. This is again due to the fact that the modeled results are primarily controlled by the transition time between the NG and DC stages and the diffusion constant, the latter of which cannot be independently determined from the representative particle size. The growth parameters also need to be adjusted to give the “correct” transition time for different particle sizes. Experimental and fitted results (performed with two different representative particle sizes) are presented in Figure 7, where experimental curves were offset 30 min to the right to take into account the pretreatment time. As shown in the figure, nearly identical modeled curves can be obtained by changing particle size and model parameters simultaneously. The values of the model parameters obtained for different characteristic particle sizes are presented in Table 2. The modeled ratio of n, which is equivalent to the ratio of S, for the two samples (assuming g1 is invariant) remains constant at 2, in reasonable agreement with the experimental result of 2.17. These results further confirm the validity of the model.
![Figure 7 Experimental [20] and fitted hydration kinetics of C3S in saturated lime solution with different quantities of calcium-silicate-hydrate nuclei.](/document/doi/10.1515/secm-2013-0258/asset/graphic/j_secm-2013-0258_fig_007.jpg)
Experimental [20] and fitted hydration kinetics of C3S in saturated lime solution with different quantities of calcium-silicate-hydrate nuclei.
Model parameters corresponding with different characteristic particle sizes.
| Assumed characteristic particle size R0 (μm) | 3.5 | 3.5 | 4 | 4 | 4.5 | 4.5 | 5 | 5 |
|---|---|---|---|---|---|---|---|---|
| 0.024 | 0.012 | 0.022 | 0.011 | 0.020 | 0.010 | 0.0180 | 0.0090 | |
| K=g2/c (μm/h) | 0.050 | 0.050 | 0.057 | 0.057 | 0.065 | 0.065 | 0.071 | 0.071 |
| D (μm2/h) | 0.0015 | 0.0015 | 0.0021 | 0.0021 | 0.0027 | 0.0027 | 0.0036 | 0.0036 |
6 Conclusions
A new type of particle-based model for C3S hydration is proposed in this study. The model successfully combines the NG mechanism and the DC mechanism of cement hydration, both of which have been widely acknowledged. It takes cement particle size distribution as input and produces hydration kinetics as output. The model assumes that a constant number of nuclei are precipitated on the surface of C3S particles at the beginning of hydration and that these nuclei grow parallel and perpendicular to the particle surface at two constant but different rates. Hydration of a C3S particle is assumed to enter the diffusion controlled stage as soon as the anhydrous core is completely covered by hydration products. For the NG stage, three different models were developed based on different growth scenarios using the same growth parameters (a parallel growth rate constant and a perpendicular growth rate constant). These different models are then individually connected with the same DC model, which only involves one additional parameter (the diffusion constant). Fitting these models to experimental data suggest that the modeled results primarily depend on the transition time between the NG and DC stages and the diffusion constant. The growth parameter of different models may be adjusted by a constant factor to generate nearly identical fits to experimental data. Therefore, even though the actual dissolution and growth process is very complicated, all of the models presented in this study are adequate in simulating the overall hydration kinetics and explaining the different influencing factors of C3S hydration. A more accurate NG model is only necessary if more accurate growth parameters need to be obtained.
In Part I of the study, the model is fitted with experimental data of C3S hydration in dilute suspensions with excellent agreement. The nucleation density and the nuclei growth rate estimated by the model presented in this study are in good agreement with C3S paste hydration studies [21, 26]. The diffusion constant is found to be largely independent of C3S particle size and in reasonable agreement with C3S paste hydration studies [8–18]. These results suggest that C3S hydration in dilute suspensions has a very similar mechanism as C3S paste hydration.
Acknowledgments
We are deeply indebted to Prof. George Scherer of Princeton University for useful discussions of the model. The continuous support from Lewis Norman, Ron Morgan, Gary Funkhouser, and Robert Darbe of Halliburton is cordially appreciated.
References
[1] Thomas JJ, Biernackib JJ, Bullardc JW, Bishnoid S, Doladoe JS, Schererf GW, Luttge A. Cement Concrete Res. 2011, 41, 1257–1278.10.1016/j.cemconres.2010.10.004Search in Google Scholar
[2] Xie T, Biernacki JJ. Comput. Concrete 2011, 8, 647–675.10.12989/cac.2011.8.6.647Search in Google Scholar
[3] Thomas JJ. J. Am. Ceram. Soc. 2007, 90, 3282–3288.10.1111/j.1551-2916.2007.01858.xSearch in Google Scholar
[4] Pang X, Meyer C, Darbe R, Funkhouser GP. ACI Mater. J. 2013, 110, 137–148.Search in Google Scholar
[5] Costoya M. Kinetics and Microstructural Investigation on the Hydration of Tricalcium Silicate, Doctoral Thesis. École Polytechnique Fédérale de Lausanne: Lausanne, 2008.Search in Google Scholar
[6] Bishnoi S, Scrivener K. Cement Concrete Res. 2009, 39, 849–860.10.1016/j.cemconres.2009.07.004Search in Google Scholar
[7] Kumar A, Bishnoi S, Scrivener KL. Cement Concrete Res. 2011, 42, 903–918.10.1016/j.cemconres.2012.03.003Search in Google Scholar
[8] Berliner R, Popovici M, Herwig KW, Berliner M, Jennings HM, Thomas JJ. Cement Concrete Res. 1998, 28, 231–243.10.1016/S0008-8846(97)00260-3Search in Google Scholar
[9] Ridi F, Dei L, Fratini E, Chen SH, Baglioni P. J. Phys. Chem. B 2003, 107, 1056–1061.10.1021/jp027346bSearch in Google Scholar
[10] Peterson VK, Brown CM, Livingston RA. Chem. Phys. 2006, 326, 381–389.10.1016/j.chemphys.2006.02.016Search in Google Scholar
[11] FitzGerald SA, Neumann DA, Rush JJ, Bentz DP, Livingston RA. Chem. Mater. 1998, 10, 397–402.10.1021/cm970564aSearch in Google Scholar
[12] FitzGerald SA, Neumann DA, Rush JJ, Kirkpatrick RJ, Cong X, Livingston RA. J. Mater. Res. 1999, 14, 1160–1165.10.1557/JMR.1999.0154Search in Google Scholar
[13] FitzGerald SA, Thomas JJ, Neumann DA, Livingston RA. Cement Concrete Res. 2002, 32, 409–413.10.1016/S0008-8846(01)00685-8Search in Google Scholar
[14] Damasceni A, Dei L, Fratini E, Ridi F, Chen SH, Baglioni P. J. Phys. Chem. B 2002, 106, 11572–11578.10.1021/jp020211lSearch in Google Scholar
[15] Allen AJ, McLaughlin JC, Neumann DA, Livingston RA. J. Mater. Res. 2004, 19, 3242–3254.10.1557/JMR.2004.0415Search in Google Scholar
[16] Peterson VK, Neumann DA, Livingston RA. J. Phys. Chem. B 2005, 109, 14449–14453.10.1021/jp052147oSearch in Google Scholar
[17] Peterson VK, Neumann DA, Livingston RA. J. Phys. Chem. B 2004, 108, 4869–4874.10.1021/jp037876nSearch in Google Scholar
[18] Peterson VK, Whitten AE. J. Phys. Chem. C 2009, 113, 2347–2351.10.1021/jp807209wSearch in Google Scholar
[19] Garrault-Gauffinet S, Nonat A. J. Cryst. Growth 1999, 200, 565–574.10.1016/S0022-0248(99)00051-2Search in Google Scholar
[20] Garrault S, Nonat A. Langmuir 2001, 17, 8131–8138.10.1021/la011201zSearch in Google Scholar
[21] Garrault S, Finot E, Lesniewska E, Nonat A. Mater. Struct. 2005, 38, 435–442.10.1007/BF02482139Search in Google Scholar
[22] Garrault S, Behr T, Nonat A. J. Phys. Chem. B 2006, 110, 270–275.10.1021/jp0547212Search in Google Scholar PubMed
[23] Nicoleau L. Cement Concrete Res. 2011, 41, 1339–1348.10.1016/j.cemconres.2011.04.012Search in Google Scholar
[24] Avrami M. J. Phys. Chem. 1939, 7, 1103–1112.10.1063/1.1750380Search in Google Scholar
[25] Avrami, M. J. Phys. Chem. 1940, 8, 212–224.10.1063/1.1750631Search in Google Scholar
[26] Scherer GW, Zhang J, Thomas JJ. Cement Concrete Res. 2012, 42, 982–993.10.1016/j.cemconres.2012.03.019Search in Google Scholar
[27] Fujii K, Kondo W. J. Am. Ceram. Soc. 1974, 57, 492–497.10.1111/j.1151-2916.1974.tb11400.xSearch in Google Scholar
[28] Bentz DP. Mag. Concrete Res. 2010, 62, 327–338.10.1680/macr.2008.62.5.327Search in Google Scholar
[29] Gartner EM, Young JF, Damidot DA, Jawed I. In Structure and Performance of Cements, 2nd ed., J. Bensted and P. Barnes, Eds., Spon Press: London, 2002, pp 57–113.Search in Google Scholar
[30] Thomas JJ, Jennings HM, Chen JJ. J. Phys. Chem. C 2009, 113, 4327–4334.10.1021/jp809811wSearch in Google Scholar
[31] Biernacki JJ, Xie T. J. Am. Ceram. Soc. 2011, 94, 2037–2047.10.1111/j.1551-2916.2010.04352.xSearch in Google Scholar
[32] Muller A, Scrivener KL, Gajewicz AM, McDonald PJ. J. Phys. Chem. C 2013, 110, 403–412.10.1021/jp3102964Search in Google Scholar
[33] Pang X, Meyer C. ACI Mater. J. 2011, 109, 341–352.10.1142/9789814289641_bmatterSearch in Google Scholar
[34] Bullard JW. J. Am. Ceram. Soc. 2008, 91, 2088–2097.10.1111/j.1551-2916.2008.02419.xSearch in Google Scholar
[35] Bullard JW, Flatt RJ. J. Am. Ceram. Soc. 2010, 93, 1894–1903.Search in Google Scholar
[36] Masoero E, Thomas JJ, Jennings HM. J. Am. Ceram. Soc. 2014, 97, 967–975.10.1111/jace.12713Search in Google Scholar
[37] Wakabayashi H, Tomozawa M. J. Am. Ceram. Soc. 1989, 72, 1850–1855.10.1111/j.1151-2916.1989.tb05990.xSearch in Google Scholar
[38] Pang X. Effects of Curing Temperature and Pressure on the Chemical, Physical, and Mechanical Properties of Portland Cement, Ph.D. Dissertation. Columbia University: New York, 2011.Search in Google Scholar
[39] Pang X, Meyer C. Sci. Eng. Compos. Mater. 2014, in press.Search in Google Scholar
©2016 by De Gruyter
This article is distributed under the terms of the Creative Commons Attribution Non-Commercial License, which permits unrestricted non-commercial use, distribution, and reproduction in any medium, provided the original work is properly cited.
Articles in the same Issue
- Frontmatter
- Original articles
- In vitro degradation and bioactivity of poly(propylene fumarate)/bioactive glass sintered microsphere scaffolds for bone tissue engineering
- Properties enhancement in multiwalled carbon nanotube-magnetite hybrid-filled polypropylene natural rubber nanocomposites through functionalization and processing methods
- Synthesis of magnetic photocatalyst and sensitization properties of polypyrrole
- Effect of silane coupling agent on the mechanical properties of nitrile butadiene rubber (NBR)/organophilic montmorillonite (OMMT) nanocomposites
- Monitoring of jute/hemp fiber hybrid laminates by nondestructive testing techniques
- Size effects on the in-plane mechanical behavior of hexagonal honeycombs
- Investigation on corrosion performance of multilayer Ni-P/TiO2 composite coating on steel
- Investigation of pozzolanic activity of volcanic rocks from the northeast of the Black Sea
- The effect of delayed ettringite formation on fine grained aerated concrete mechanical properties
- Effect of early-age freeze-thaw exposure on the mechanical performance of self-compacting repair mortars
- Modeling cement hydration by connecting a nucleation and growth mechanism with a diffusion mechanism. Part I: C3S hydration in dilute suspensions