Thermal conductivity of flat-pressed wood plastic composites at different temperatures and filler content
-
Umberto Prisco


Abstract
The thermal conductivity of wood flour (WF) filled high-density polyethylene composites (wood plastic composite, WPC) is investigated experimentally as a function of filler content and temperature. Samples are prepared by compression molding process of previously blended and extruded WPC pellets, up to 50% weight content of WF. The thermal conductivity is measured by the heat flow meter technique in a temperature range from -15°C to 80°C. Experimental results show that the WPC thermal conductivity decreases with temperature and WF content, with the last effect due to the increase in porosity with the filler content, as confirmed by density measurements. Using the thermal conductivity of bare WF, the thermal conductivity of the wood material in WPC is estimated. This value successfully predicts the upper and lower bounds of the WPC thermal conductivity by means of the parallel and series conduction model of a multiphase composite material.
List of abbreviations
Materials involved in the study: A, air; WM, wood material in the WPC; HDPE, high-density polyethylene; ρA, ρWM, ρHDPE, densities (g/cm3) of A, WM, and HDPE, respectively.
Investigated composite materials (the constituent materials are indicated in parentheses):
WF, oven-dry wood flour (WM, A); WPCxx, flat-pressed wood plastic composite containing xx mass percentage of wood flour and porosity (HDPE, WM, A); PE panel, flat-pressed HDPE panel containing porosity (HDPE, A); WPCxx(T), theoretical wood plastic composite without porosity (HDPE, WM); PE panel(T), theoretical HDPE panel without porosity (HDPE); ρWF, ρWPCxx, ρPE–panel, apparent densities (g/cm3) of WF, WPCxx, and PE panel, respectively; ρWPCxx(T), the expected theoretical density of the WPCxx without porosity;
1 Introduction
Even though inorganic fillers presently dominate the thermoplastic industry, wood-derived fillers have been obtaining much interest lately [1, 2]. Their attractiveness originates from the fact that natural fillers represent renewable and low-cost reinforcements that can improve mechanical properties such as stiffness, strength, and heat deflection temperature under load [3–5]. Nowadays, wood-polymer composites are widely used for decking and automotive applications and as building material.
In particular, among the wood plastic composites (WPCs), the wood flour (WF) filled polymers have been widely studied [6–9]. Nevertheless, the thermal properties of this type of WPC have never been truly investigated and there is a lack of scientific literature on this subject. Studies on the thermal conductivity of WF filled polymer composites are part of the research about the conductivity of particle-reinforced polymers. In this field, many experimental as well as numerical and analytical model studies have been published [10]. So far, the fillers most frequently used have been aluminum particles, copper particles, brass particles, short carbon fibers, carbon particles, graphite, aluminum nitrides, and magnetite particles.
With the aim of covering the above-mentioned deficit, this paper studies the influence of filler content and temperature on the thermal conductivity of WF filled polymer composites. Analyzing the experimental data through the parallel and series conduction model of a multiphase composite material, the thermal conductivity of the wood material in the WPC (WM) is estimated. The soundness of this estimated value is evaluated on the basis of its capacity to forecast the thermal conductivity of the produced WPC; from this point of view, satisfactory results seem to be achieved.
2 Materials and methods
The raw materials used in this research are listed in Table 1. High-density polyethylene (HDPE), Eraclene® BC 82 (Polimeri Europa, San Donato Milanese (MI), Italy), was employed as matrix. Eraclene® BC 82 is a typical HDPE resin in granule form suitable for extrusion. Hereinafter, it will be referred to simply as HDPE. WF from European beech (Fagus sylvatica), Fiber-Plast® 75, supplied by La.So.Le. Est S.r.l. (Udine, Italy; www.lasole.it), was used as filler. An anhydride-modified HDPE, Fusabond1 E100 (DuPont, Wilmington, DE, US) in pellet form for use in conventional extrusion was used as coupling agent. This resin is a modified polymer that has been functionalized by maleic anhydride grafting [maleated polyethylene (MAPE)] to help bond together polymers, mainly polyethylene and polypropylene, and fillers with molecular structures and nature different from that of polyolefins, as in the case of WF. The amount of coupling agent added was 5% in weight based on the entire compound for all the produced WPCs, according to the producer’s recommendation. However, the amount of MAPE included in the formulation always ensures that its weight content based on WF is never below the ratio 1:10.
Raw materials.
| Material | Supplier | Trade name | Description |
|---|---|---|---|
| HDPE | Polimeri Europa | Eraclene® BC 82 | MFI=0.25 g/10 min (190°C/2.16 kg, ISO 1133) |
| Density=0.953 g/cm3 | |||
| Melting point=135°C (ISO 3146) | |||
| Beech wood flour | La.So.Le. Est S.r.l. | Fiber-Plast® 75 | Fagus sylvatica |
| Fraction between 45 and 180 μm=98% by weight | |||
| Maleated PE | DuPont | Fusabond® E100 | MFI=2 g/10 min (190°C/2.16 kg, ISO 1133) |
| Melting point=134°C (ISO 3146) |
Both the HDPE and the MAPE were used as received, whereas the WF was conditioned to constant weight at 100°C for 24 h in a vacuum drying oven (to obtain 1–2% moisture content) and then kept in a sealed container prior to any use and measurement. The particle sizes of the WF were analyzed with sieves conforming to ISO 3310-1:2000. The results are shown in Table 2.
Sieve analyses results for the beech wood flour (R, retained, P, pass; mesh size is in accord with ISO 3310-1:2000).
| Mesh size (μm) | Fraction, mass percentage |
|---|---|
| R180 | 0.81 |
| P180–R125 | 36.28 |
| P125–R63 | 51.40 |
| P63–R45 | 10.18 |
| P45–R38 | 0.58 |
| P38 | 0.75 |
HDPE/WF composites containing 20%, 30%, 40%, and 50% WF by mass were dry blended and extruded with a counter-rotating, cylindrical extruder (ZK 35 by Dr. Collin GmbH) with a screw diameter of 35 mm and a screw length-to-diameter ratio of 40:1 through a die with 4×4 mm2 circular cross-section channels. In the different zones of the extruder barrel (10 zones plus the nozzle, all equipped with a PID temperature-control system), the following temperature profile was set: 140°C, 145°C, 150°C, 155°C, 160°C, 165°C, 170°C, 175°C, 180°C, 185°C, and 185°C in the die. The screw rotating speed was set at 120 rpm. HDPE, WF, and MAPE were fed at the throat of the extruder by the use of twin-screw gravimetric feeders (K-CL-SFS-KT20 by K-Tron). The melt pressure at the die varied between 6 and 25 bar depending on material blend and extrusion condition, and the material output was 4 kg/h. The produced WPC strands were quenched into a water bath and, after removal of the water droplets, deposited onto the extrudates and knife milled with a strand pelletizer (CSG 171/1 by Dr. Collin GmbH) into particles of approximately 3 mm in the longest dimension. All composite pellets were dried at 90°C for at least 24 h to <1% moisture content prior to subsequent use. The WPC formulations and codes are given in Table 3.
WPC formulation and codes.
| WPC code | WF (wt%) | HDPE (wt%) | MAPE (wt%) |
|---|---|---|---|
| WPC20 | 20 | 75 | 5 |
| WPC30 | 30 | 65 | 5 |
| WPC40 | 40 | 55 | 5 |
| WPC50 | 50 | 45 | 5 |
Flat-pressed HDPE and WPC samples for thermal conductivity and density measurements were manufactured using standardized procedures that simulated industrial production at the laboratory [11]. A computer-controlled press (P 200 E, Dr. Collin GmbH) equipped with cooling cassettes was used. The WPC pellets were compression molded into a frame measuring 200 mm×200 mm×15 mm at a temperature of 170°C±5°C. The molding conditions were as follows: preheating time, 30 min, under a pressure of 0.5 MPa; heating time, 10 min, under a final pressure of 3 MPa; cooling under a slight pressure to ambient temperature. The resulting panels were used for thermal conductivity measurements. Furthermore, several little parallelepipeds were cut from some of the produced HDPE and WPC panels for density measurements. Examples of the produced panels are in Figure 1.

Examples of the obtained panels.
The apparent density of the HDPE and WPC panels was determined using a pycnometer; ethanol (density=0.789 g/cm3) was chosen as fluid. The measurement conditions as proposed in standard ISO 1183-1:2004, in particular method B (liquid pycnometer method for small pieces of finished parts), were applied. WF apparent density was determined according to the standard ISO 60:1977, i.e., pouring the flour into a measuring cylinder of 100-cm3 capacity and weighing the mass of the contents. Ten measurements were carried out for each material to ensure reproducibility and to assess experimental variance. The accuracy of the density measurements is 0.5%.
The thermal conductivity of WF, HDPE, and WPC panels was measured with an HFM 436/3/1E Lambda (NETZSCH Group, Selb, Germany) heat flow meter according to ISO 8301:1991. Measurements were carried out in the temperature range of -15–80°C. Because the WF is a loose-fill material, an open test wooden frame was used for it, according to ASTM C518-10 and related standards. Five measurements were carried out for each material to ensure reproducibility and to assess experimental variance. Calibration of the apparatus was carried out using a certified low-density polyethylene (LDPE) panel [density=0.91 g/cm3, thermal conductivity=0.335 W/(m K) at 20°C] for the HDPE and WPC measurements and an expanded polystyrene panel [density=0.035 g/cm3, thermal conductivity=0.0275 W/(m K) at 20°C] for WF measurements. The accuracy of the thermal conductivity measurements is 2.5%.
3 Results and discussion
The apparent density of the WF is determined to be 0.215±0.025 g/cm3. Due to the oven treatment, this material is composed of beech wood, without water, and some of the volatile extractives normally contained inside cavities and intercellular spaces, and interconnected porosity, forming channels open at the surface and filled with air. Kellogg and Wangaard [12], by means of three different techniques, found the wood material density of beech to range between 1.347 and 1.468 g/cm3, with a mean value of about 1.407 g/cm3. Using this value and the formula connecting WF density, ρWF, WM density, ρWM, and the volume fraction of air inside the WF,
it is possible to find a mean value for the WF porosity, i.e.,
Figure 2 reports the densities of the different panels; for comparison, the values of the theoretical density are also added to the plot. The HDPE theoretical density was provided by the producer, whereas that of the WPCs was calculated by means of the formula expressing the density of a two-phase composite as a function of the proportions and density of its constituents, i.e.,
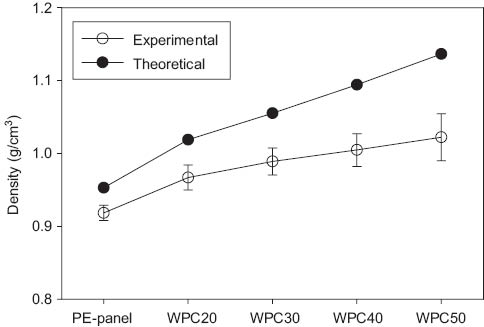
Density of the flat-pressed panels (mean values with 95% confidence intervals are reported).
Measured densities are below the theoretical expected values due to the unavoidable air-filled porosity, which the adopted manufacturing process produces inside the panels. However, the porosity was isolated, i.e., not intercommunicating and not open at the surface; see Figure 3 reporting the typical void distribution of the four WPC panels. Indeed, the samples used for density measurements did not show any weight variation after immersion into the pycnometer, as it was carefully checked; this is a necessary condition for the validity of apparent density measurement with a pycnometer.

Typical void distribution in the four WPC panels: (A) WPC20, (B) WPC30, (C) WPC40, (D) WPC50.
The volume fraction of the air inside the panels can be found from the following formula, which is valid for a solid with isolated porosity and not open at the surface, expressing the density of a composite as a function of its porosity:
which gives
The value of air density, ρA, at room temperature is 1.205×10⁻³ g/cm3 as found in [13]. A similar formula holds for the PE panels.
Knowing the volume fraction of the air inside the flat-pressed WPC containing xx mass percentage of WF and porosity (WPCxx),
Density, volume and mass fraction (theoretical and experimental) of the different components of the flat-pressed panels.
| Theoretical | Experimental (mean value) | |||||||
|---|---|---|---|---|---|---|---|---|
| Density (g/cm3) | φA | φWM | φPE | Density (g/cm3) | φA | φWM | φPE | |
| PE panel | 0.953 | 0.000 | 0.000 | 1.000 | 0.912 | 0.034 | 0.000 | 0.966 |
| WPC20 | 1.019 | 0.000 | 0.145 | 0.855 | 0.922 | 0.048 | 0.138 | 0.814 |
| WPC30 | 1.055 | 0.000 | 0.225 | 0.775 | 0.906 | 0.061 | 0.211 | 0.728 |
| WPC40 | 1.094 | 0.000 | 0.311 | 0.689 | 0.891 | 0.078 | 0.287 | 0.635 |
| WPC50 | 1.137 | 0.000 | 0.404 | 0.596 | 0.865 | 0.095 | 0.365 | 0.539 |
It is clear that WPC porosity increases with WF content (see Figure 3). Indeed, during processing at high temperatures, both plastic and wood undergo rather noticeable degradation and depolymerization, which leads to formation of volatile organic compounds (VOCs). VOCs make the material foamed, with noncontrolled porosity; this noticeably decreases the density of the final WPC product [3]. VOC formation is obviously expected to significantly increase the WF content. In particular, when the WF content is increased from 20% to 50% by weight, the porosity content goes from about 4% to beyond 9%, whereas for the PE panels alone a value of around 3% is found. The total porosity of the WPC is developed during both the extrusion and the flat pressing, so that part of the porosity is already contained in the WPC pellets.
Figures 4 and 6 report the measured thermal conductivity of PE panels and WF at different temperatures. It is observed that kWF increases, whereas kPE–panel decreases, with temperature.

Dependence of the thermal conductivity of the PE panel on temperature (mean values with 95% confidence intervals are reported).
![Figure 5 Estimated thermal conductivity of the adopted HDPE [the best-fit line, Eq. (8), is reported].](/document/doi/10.1515/secm-2013-0013/asset/graphic/secm-2013-0013_fig5.jpg)
Estimated thermal conductivity of the adopted HDPE [the best-fit line, Eq. (8), is reported].

Thermal conductivity of the WF (mean values with 95% confidence intervals are reported).
From data in Figure 4, knowing the air volume fraction inside the PE panels,
and
From data in [13], the following regression equation describing the thermal conductivity of air within the explored temperature range is assessed:
From Eqs. (5) and (6), we expect to find the lower and upper bound of kHDPE, respectively. However, results obtained from the series conduction model are rejected because, being of order of magnitude of 1 W/(m s), they are not consistent with previous literature, which reports a value of about 0.4 W/(m s) for the thermal conductivity of polyethylene. On the contrary, the kHDPE calculated from the parallel model is in strong agreement with previous literature data, in particular with [14–17], that have already observed a decrease in various HDPEs’ thermal conductivity with increasing temperature until the melting point. Results of the present calculation are in Figure 5, which also reports the best-fit line describing the dependence of the HDPE thermal conductivity on temperature, whose equation is:
In the same way, for the explored temperature range, it is possible to assess a value of thermal conductivity of WM from the measured kWF reported in Figure 6. To the author’s knowledge, the thermal conductivity of the WM material of a wood has never been experimentally evaluated or theoretically assessed; thus, this is the first attempt to estimate such a value. Again, the formulae for the parallel and series conduction are used to model the thermal conductivity of WF, which is a two-component composite material. Calculation is performed using kA, from Eq. (7), and
Figure 7 and Table 5 report the kWM obtained from the series conduction model; a regression best-fit line is added to the plot, and its equation is
Estimated thermal conductivity of WM.
| T(°C) | kWM |
|---|---|
| -15 | 0.355 |
| 0 | 0.364 |
| 20 | 0.366 |
| 40 | 0.371 |
| 60 | 0.372 |
| 80 | 0.375 |
![Figure 7 Estimated thermal conductivity of WM, the wood material in the WPC [the best-fit line, Eq. (9), is reported].](/document/doi/10.1515/secm-2013-0013/asset/graphic/secm-2013-0013_fig7.jpg)
Estimated thermal conductivity of WM, the wood material in the WPC [the best-fit line, Eq. (9), is reported].

Naturally, the soundness of the values in Figure 7 will be evaluated on the basis of their prediction capacity of the thermal conductivity of the WPC; see below.
Finally, Figure 8 shows the thermal conductivity of the WPC panels within the investigated temperature range. All kWPCxx values decrease with temperature due to the predominant effect of the HDPE. Furthermore, it is evident that the WPC thermal conductivity decreases as the WF content increases because of the porosity increment brought about by the WF degradation and subsequent VOC formation.

Thermal conductivity of the WPCs (mean values with 95% confidence intervals are reported). The continuous and dashed lines are the parallel and series conduction models, respectively.
The theoretical curves added to Figure 8 are obtained using the previously estimated kWM, reported in Figure 7, and the parallel and series conduction models; as expected, the series conduction model underestimates the thermal conductivity of the WPC panels, whereas the parallel model curves, although lying above the experimental data, supply a fairly good forecast of the experimental data, with a deviation from the experimental average smaller than +10%; this means that the WPC panels are well described by a parallel arrangement of the fiber, polyethylene, and air. However, values of the WPC thermal conductivity predicted by the parallel conduction model close to the upper bound of the experimental range at each temperature are awaited considering that kWM was calculated using the model that provides its maximum value, i.e., the parallel conduction model of the two-component composite WF.
From Figure 8, it is clear that the assessed kWM values in Eq. (9) provide a fairly good estimate of the thermal conductivity of WM in view of their predictive capacity of the bounds of the thermal conductivity, kWPCxx, of the different composites.
4 Conclusion
The thermal conductivity of WF filled HDPE composites is investigated experimentally as a function of filler content and temperature by means of the heat flow meter technique in the temperature range -15°C–80°C. The following results, valid in the studied temperature range, are obtained:
Using thermal and density measurement on WF, HDPE, and WPC and literature data, the thermal conductivity of WM, the beech wood material in the WPC, is estimated. WM conductivity linearly increases as temperature increases, with a regression coefficient for temperature of the order of magnitude equal to 10-4 W/(m K2). HDPE thermal conductivity decreases with temperature, showing a constant temperature gradient of the order of magnitude of -10-3 W/(m K2);
The WPC thermal conductivity decreases with temperature and WF content; the former effect is due to the predominant decrease of the HDPE thermal conductivity with temperature, whereas the latter is a result of the porosity growth with the filler content, as confirmed by density measurements.
References
[1] Carrino L, Ciliberto S, Giorleo G, Prisco U. Polym. Compos. 2011, 32, 837–845.Search in Google Scholar
[2] Lin WS, Pramanick A, Sain M. Sci. Eng. Compos. Mater. 2011, 11, 201–208.Search in Google Scholar
[3] Klyosov AA. Wood-Plastic Composites, John Wiley & Sons: Hoboken, New Jersey, 2007.10.1002/9780470165935Search in Google Scholar
[4] Beshay A, Hoa SV. Sci. Eng. Compos. Mater. 2011, 2, 85–98.Search in Google Scholar
[5] Wang B, Tabil L, Panigrahi S. Wood Mater. Sci. Eng. 2011, 15, 43–58.Search in Google Scholar
[6] Kumar RP, Thomas S. Wood Mater. Sci. Eng. 2011, 8, 311–326.Search in Google Scholar
[7] Squillace A, Prisco U, Ciliberto S, Astarita A. J. Mater. Process. Technol. 2012, 212, 427–436.Search in Google Scholar
[8] Bitondo C, Prisco U, Squilace A, Buonadonna P, Dionoro G. Int. J. Adv. Manuf. Technol. 2011, 53, 505–516.Search in Google Scholar
[9] Prisco U, Polini W. Adv. Mech. Eng. 2010, 2010, article number 154287, doi: 10.1155/2010/154287.10.1155/2010/154287Search in Google Scholar
[10] Kumlutas D, Tavman IH. J. Thermoplast. Compos. Mater. 2006, 19, 441–455.Search in Google Scholar
[11] Raj RG, Kokta BV. Sci. Eng. Compos. Mater. 2011, 2, 1–10.Search in Google Scholar
[12] Kellogg RM, Wangaard FF. Wood Fiber 1969, 1, 180–204.Search in Google Scholar
[13] Perry RH, Green DW. Perry’s Chemical Engineers’ Handbook, McGraw-Hill: New York, 1997.Search in Google Scholar
[14] Kamal MR, Tan V, Kashan F. Adv. Polym. Technol. 1983, 3, 89–98.Search in Google Scholar
[15] Woo MW, Wong P, Tang Y, Triacca V, Gloor PE, Hrymak AN, Hamielec AE. Polym. Eng. Sci. 1995, 35, 151–156.Search in Google Scholar
[16] Kline DE, Hansen D. In Thermal Characterization Techniques, Slade PE, Jenkins LT, Eds., Marcel Dekker: New York, 1970, pp. 248–292.Search in Google Scholar
[17] Anderson DR. Chem. Rev. 1966, 66, 677–690.Search in Google Scholar
[18] Eitelberger J, Hofstetter K. Compos. Sci. Technol. 2011, 71, 134–144.Search in Google Scholar
[19] Siau JF. Wood: Influence of Moisture on Physical Properties, Department of Wood Science and Forest Products, Virginia Polytechnic Institute and State University, Virginia, 1995.Search in Google Scholar
©2014 by Walter de Gruyter Berlin/Boston
This article is distributed under the terms of the Creative Commons Attribution Non-Commercial License, which permits unrestricted non-commercial use, distribution, and reproduction in any medium, provided the original work is properly cited.
Articles in the same Issue
- Masthead
- Masthead
- Original articles
- Synthesis and properties of new clay-reinforced aromatic polyimide/nanocomposite-based 3,3′,4,4′-benzophenonetetracarboxylic dianhydride and 1,3-bis(4-aminophenoxy)propane
- Microstructures and surface performance of laser melting deposited composites on a Ti alloy
- Synthesis of porous carbon nanotubes/activated carbon composite spheres and their application for vitamin B12 adsorption
- Energy absorption capacity of pseudoelastic fiber-reinforced composites
- Influence of fly ash particles on tensile and impact behaviour of aluminium (Al/3Cu/8.5Si) metal matrix composites
- Effect of paraffin application technique on the physical and mechanical properties of particleboard
- Thermal conductivity of flat-pressed wood plastic composites at different temperatures and filler content
- Morphology and properties of a photopolymer/clay nanocomposite prepared by a rapid prototyping system
- Tensile behavior of hybrid epoxy composite laminate containing carbon and basalt fibers
- Prediction of longitudinal modulus of aligned discontinuous fiber-reinforced composites using boundary element method
- Determination of the critical load and energy release rate in mode II delamination using a meshfree method
- Shear strength predicting of FRP-strengthened RC beams by using artificial neural networks
- Free vibration analysis of angle-ply laminate composite beams by mixed finite element formulation using the Gâteaux differential
- Nonlinear dynamic behavior of a long temperature-dependent FGM hollow cylinder subjected to thermal shocking
- Effect of stacking sequence and geometric scaling on the brittleness number of glass fiber composite laminate with stress raiser
- Fabrication of hemp fiber-reinforced green composites with organoclay-filled poly(butylene succinate) matrix by pultrusion process
- Correlation of the heater’s duty cycle and specific energy consumption, and reduction in energy consumption in the pultrusion process