Thermal degradation of epoxy resin grafted with polyurethane
-
Zhenjiang Song
 ,
Jianliang Xie
,
Jianliang Xie

Abstract
Epoxy resin grafted with polyurethane was synthesized and characterized through a series of tests. The grafting reactive process between the pendant secondary hydroxyl groups on the side chains of epoxy resin and the isocyanate groups of pre-polyurethane were investigated by Fourier transform infrared spectroscopy. Thermal behavior of the grafted epoxy resin was investigated by thermogravimetric analysis within 40–500°C. The degradation of grafted epoxy resin involved two stages. Microstructures of the polyurethane section and grafted epoxy resin were observed by field emission scanning electron microscopy. Model fitting method was employed to calculate the thermal degradation model of grafted epoxy resin. In this paper, 15 typical kinetic mechanisms were introduced into the model fitting method, such as Coats-Redfern method and Achar-Brindley-Sharp-Wendworth method, to obtain the kinetic function of thermal degradation for grafted epoxy resin.
1 Introduction
Epoxy resin has excellent performance properties like size stability, creep and corrosion resistance, electrical insulation and high strength, which are considered to be useful in various fields of protective coatings, adhesives, electrical laminates and other engineering applications [1]. Among various epoxy resins, the diglycidyl ether of bisphenol A (DGEBA, shown in Scheme 1) is one of the most important. Generally, curing agents (also known as hardeners) are necessary for epoxy resin application. However, cured epoxy resin will form three-dimensional insoluble networks. On the one hand, these high-cross-linking structures endow their excellent properties; on the other hand, the cured epoxy resin will suffer from problems of rigidity and brittleness [2]. These epoxy materials have fracture energies some two orders of magnitude lower than those of common engineering thermoplastics [3]. Therefore, in order to alleviate these problems, tremendous work has been undertaken to enhance their toughness [4–8].

Chemical structure of DGEBA.
Among the methods of toughening, toughening of epoxy resin using polyurethane, like interpenetrating polymer network (IPN) structures, attracted intensive interest in both academia and industry because they facilitate processing and impart toughness [9, 10]. Baidak et al. used epoxy resin and acrylic resin to prepare IPN structures, and metastable phase diagrams were drawn for explaining phase separation [11]. Harani et al. have synthesized grafted epoxy resin with high impact strength at 22 J m-1 [12]. Hsieh et al. have prepared a series of graft IPNs with excellent mechanical properties [13–17]. In this work, we synthesized polyurethane prepolymer first. Then isocyanate-terminated polyurethane was introduced into epoxy resin to form the grafted polymer structure. Generally, thermogravimetric analysis (TGA) was performed to estimate the initial degradation temperature and the apparent activation energies of degradation [18–21], especially the degradation kinetics. Abate et al. studied the degradation kinetic parameters of polymers containing ether, ketone and sulfone groups systematically by isothermal degradation experiments [22, 23]. There have been some research studies on thermal degradation of polyurethane, polyurethane nanohybrid elastomer [24, 25]. In this study, we investigated the thermal stability of the grafted epoxy resin and used a model fitting method to determine the kinetic function for thermal degradation.
2 Experimental
2.1 Grafted epoxy resin synthesis
First, the prepolymer was prepared with toluene diisocyanate (TDI) (purchased from Reagent No. 1 Factory, Shanghai, China) and polyester (molecular weight: 1000, Pudong Gaonan Chemical Factory, Shanghai, China) according to a detailed previously described method [26]. Second, high-molecular-weight solid DGEBA (E03, with an epoxy equivalent weight of 2000–5000 g, obtained from Bluestar New Chemical Materials Co., Ltd, China) was dissolved into a mixture of butanone and cyclohexanone (purchased from the Kelong Reagent Factory, Chengdu, China). Then the prepared prepolymer was mixed with E03 based on stoichiometric ratio. This solution was stirred vigorously for about 10 min and then poured into a mold, which was put into a vacuum drying oven for the evaporation of solvent under room temperature. After 24 h of evaporation, the grafted epoxy resin was obtained.
2.2 Test methods
Fourier transform infrared (FTIR) spectra were observed with a Bruker Tensor 27 instrument (Bruker Optics, Inc., Germany) at transmission mode in the spectral range from 4000 to 400 cm-1. The KBr powder was compressed into a disk pellet with a diameter of 13 mm. After the liquid mixture was stirred completely, a drop was placed directly on the pellet.
The thermal degradation behavior was analyzed with Mettler Star SW software (Mettler Toledo, Inc., Greifensee, Switzerland). Samples of 10–15 mg were introduced into an aluminum crucible with a lid at 40°C–500°C with nitrogen as protection gas (22 ml min-1). Under non-isothermal condition at the heating rate of 10, 15, and 20 K min-1, the nitrogen (32 ml min-1) was employed as purge gas.
The microstructures of grafted epoxy resin and polyurethane section were observed by field emission scanning electron microscopy (FE-SEM, JSM-7600F, JEOL Ltd., Japan) using an Inspect F50 model (FEI Company, Hillsboro, OR, USA) operated at 20 kV. The samples were fractured in liquid nitrogen and then coated with gold using a sputter coater.
The stress-strain plot was obtained according to GB/T 1040.4-2006 with a speed of 50 mm min-1 on an RGL-5 electronic universal testing machine (Shenzhen Reger Instrument Co., Ltd).
2.3 Kinetic methods
All kinetic studies can be described using the following basic equation:

or

where α is the degree of conversion; t is the time (min); f(α) is the differential function of conversion and G(α) is the integral function of conversion; k, a rate constant, is a T (the absolute temperature)-dependent function expressed by the well-known Arrhenius equation. Then Eq. (1) can be written as:

where A is the pre-exponential factor (min-1), Ea is the activation energy (J mol-1) and R is the gas constant (8.314 J mol-1 K-1).
Under non-isothermal conditions, the relationship T=T0+βt holds. The heating rate β (K min-1) is defined by the equation β=dT/dt. The reaction rate can be rewritten as:

Combining Eq. (3) with Eq. (4) gives the following relation:

Integration of Eq. (5) gives:

Generally, the rate of the reaction is low at the start [27], and the integral may be performed from 0 to T. Combining Eqs. (1), (2) and (6), the following relationship can be obtained:

2.4 Model fitting method
Treatment of thermal analysis data with the integral and differential methods together is considered as an effective method to yield the asymptotic mechanism of thermal degradation [28]. Among multitudinous thermal reaction equations, the Coats-Redfern (CR) method and Achar-Brindley-Sharp-Wendworth (ABSW) method are commonly used to approximate the resolution of Eq. (7).
CR method:

ABSW method:
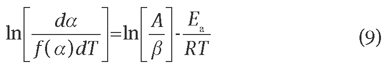
Eqs. (8) and (9) are based on 15 typical kinetic mechanisms of solid degradation listed in Table 1, which are utilized to consider these experimental data [29]. The plot of ln[G(a)/T2] versus 1/T gives the slope -Ea/R by which the average activation energy Ea has been evaluated, whereas the pre-exponential factor A can be calculated directly from the intercept of the same fitting line. When the values of Ea and A obtained both from the differential and the integral method, respectively, are nearly the same or closest with a high correlation coefficient, this model can be applicable to the thermal degradation [30].
Typical kinetic mechanisms of solid degradation.
| Number | Function | Reaction model | f(α) | G(α) |
|---|---|---|---|---|
| 1 | Mampel power law | 4a3/4 | a1/4 | |
| 2 | Mampel power law | 3a2/3 | a1/3 | |
| 3 | Mampel power law | 2a1/2 | a1/2 | |
| 4 | Mampel power law | 1 | A | |
| 5 | Parabola law | One-dimensional diffusion | 1/2a | a2 |
| 6 | Valensi | Two-dimensional diffusion | [-ln(1-a)]-1 | a+(1-a)ln(1-a)2 |
| 7 | Ginstling-Broushtein | Three-dimensional diffusion | 1.5[(1-a)-1/3-1] | (1-2a/3)-(1-a)2/3 |
| 8 | Avrami-Erofeev | n=2 | 2(1-a)[-ln(1-a)]1/2 | [-ln(1-a)]1/2 |
| 9 | Avrami-Erofeev | n=3 | 3(1-a)[-ln(1-a)]2/3 | [-ln(1-a)]1/3 |
| 10 | Avrami-Erofeev | n=4 | 4(1-a)[-ln(1-a)]3/4 | [-ln(1-a)]1/4 |
| 11 | Phase boundary reaction | Contraction cylinder | 2(1-a)1/2 | 1-(1-a)1/2 |
| 12 | Phase boundary reaction | Contraction sphere | 3-(1-a)2/3 | 1-(1-a)1/3 |
| 13 | Chemical reaction | n=1 | 1-a | -ln(1-a) |
| 14 | Chemical reaction | n=1.5 | (1-a)3/2 | 2[(1-a)-1/2-1] |
| 15 | Chemical reaction | n=2 | (1-a)2 | (1-a)-1-1 |
3 Results and discussion
The FTIR analysis of the chemical reaction between DGEBA and polyurethane is displayed in Figure 1. In the prime stages of the reaction, epoxy characteristic absorption peaks at 3318, 1225, 885 and 827 cm-1 [31] and the isocyanate -NCO absorption peak at 2270 cm-1 are evident. In the end stages of the reaction, the FTIR spectrum exhibits an intensive absorption peak of the urethane group at 1730 cm-1, with the intensity of the -NCO absorption peak at 2270 cm-1 reducing to a constant intensity [32]. However, the absorption peaks characteristic of epoxy are nearly unchanged in the prime stages except that the pendant secondary hydroxyl groups (-OH) on the side chains of epoxy resin absorption peak at 3389–3500 cm-1, which are shifted to a lower wave number. Thus, it is confirmed that chemical reaction occurred between NCO and OH and grafted epoxy resin is obtained. This reaction is displayed in Scheme 2. R stands for polyester Scheme 2.

FTIR spectrum for the mixture of DGEBA and polyurethane: 1, prime phase; 2, end phase.

Chemical reaction between DGEBA and pre-polymer.
The mass loss (%) and derivative thermal gravimetric (DTG) plots are shown in Figure 2. Except for small volatilization amounts of residual solvent at the beginning, the degradation of grafted epoxy resin involves two stages: the first stage is dominated by the degradation of the urethane bonds and TDI [33], and the second stage correlates well with the dissociation of the polyester and epoxy resin [5]. Each peak of the DTG curves indicates the point of maximum rate of degradation change on the weight loss curve. The DTG traces are found to regularly shift toward a higher-temperature region with increasing thermal scanning rate, which can be explained by the lag of the relaxation time of molecular chain movement compared with the time of experimental recording [34]. The maximum rates of mass loss at the second step were labeled in DTG curves with 408.7°C, 417.8°C and 423.0°C for 10, 15 and 20 K min-1, respectively. One may easily infer that the grafted epoxy resin remains stable before 230°C. However, the rate of mass loss increases sharply beyond 350°C, as shown clearly in Figure 2A. The initial degradation temperature (Ti, the starting point of deviation from the baseline), the temperature for maximum rate of mass loss (Tm) and the mass loss (%) of the first and the second stage mass loss step are summarized in Table 2.
Decomposition temperatures of the grafted epoxy resin.
| B (K min-1) | Ti (°C) | First stage | Second stage | Char yield (%, at 500°C) | ||
|---|---|---|---|---|---|---|
| Mass loss (%) | T1m (°C) | Mass loss (%) | T2m (°C) | |||
| 10 | 235.2 | 15.0 | 325.3 | 67.8 | 408.7 | 8.2 |
| 15 | 232.0 | 16.1 | 348.0 | 72.70 | 417.8 | 10.0 |
| 20 | 251.5 | 14.4 | 356.0 | 72.9 | 423.0 | 11.0 |

Thermal curves for the grafted epoxy resin: (A) TG, (B) DTG.
Thermal degradation of the grafted epoxy resin at the first stage is attributed to the dissociation of urethane bonds. At this stage mass loss corresponds to about 15%, which is equal to the parts of TDI introduced into the prepolymer. This result accords well with a previous investigation of grafted polymer based on castor oil carried out by Raymond and Bui [35]. The subsequent thermal degradation belongs to the degradation of polyester incorporated into polyurethane, DGEBA, and some broken chemical chains of degradation products generated from the first stage [36].
The synthesized grafted epoxy resin exhibits better toughness than crude epoxy resin. The selected epoxy resin is a high-molecular-weight solid with good mechanical properties [37], which is grafted with softer polyurethane. The microstructures of grafted epoxy resin and polyurethane section observed by FE-SEM show the phase separation, indicating the thermodynamic immiscibility shown in Figure 3 [38]. This phase separation is generated from polyurethane constructions TDI (hard segment) and polyester (soft segment). Thus, the toughening for epoxy resin can be explained by this soft segment and phase separation [39]. The mechanism for alleviating rigidity and brittleness problems of epoxy resin is considered to be cavitations, which can relieve the triaxial tension from cracking [40–42]. We can obtain the toughening effect using the stress-strain curve shown in Figure 4. The grafted epoxy resin exhibits ductile deformation (70%), indicating an improved toughness compared with epoxy resin [15].

FESEM for the section microstructure of (A) polyurethane and (B) grafted epoxy resin.

Stress-strain plot of the polymer matrix with a speed of 50 mm min-1.
3.1 Model fitting method
The thermal degradation model is essential to analyze the process of the whole thermal reaction. Model fitting method is widely used to determine the model. Each single heating rate is introduced into integral and differential methods with model-free method in this paper. When average activation energy Ea and pre-exponential factor A from both differential and integral methods are nearly the same and closest with a high correlation coefficient R, this model can be applicable to the thermal degradation [30]. After calculation, the No. 5 reaction model is the appropriate model. These close values of Ea and A are summarized in Table 3. The curves for the No. 5 reaction model with integral and differential method are also displayed in Figure 5.
Kinetic parameters based on No. 5 reaction model for grafted epoxy resin.
| Integral method | Differential method | |||||
|---|---|---|---|---|---|---|
| Ea (kJ mol-1) | ln A (min-1) | R | Ea (kJ mol-1) | ln A (min-1) | R | |
| 10 K | 139.5 | 22.1 | 0.99 | 158.9 | 26.0 | 0.93 |
| 15 K | 140.0 | 22.4 | 0.99 | 157.3 | 25.8 | 0.94 |
| 20 K | 150.6 | 24.3 | 0.99 | 159.2 | 26.1 | 0.94 |

Fitting plots based on No. 5 model at 20 K min-1: (A) integral method, (B) differential method.
The No. 5 reaction model belongs to a one-dimensional diffusion reaction, depending on the mobility of constituents in the reaction system [43]. In our experiment, the resultants are produced along with thermal degradation, whereas the samples are put in a small crucible (Φ 8.0×12.5 mm) with a lid so the room of the aluminum crucible is filled easily. However, the gas resultants are volatilized only through the aperture between the crucible and the lid, so that the resultants cannot be emitted timely. As mentioned before, the layers of resultant around the sample are diluted slowly, which will control the rate of the degradation reaction. The kinetic function for thermal degradation of grafted epoxy resin can be written as follows:

The plots of experimental data and thermal degradation model based on Eq. (10) are illustrated in Figure 6. We can see that calculation results agreed well with experimental results to some extent, which indicates that this kinetic function is the appropriate thermal degradation model.

Curves of α versus T for experiment data: (A) 10, (B) 15, (C) 20 K min-1 and calculation results: (D) 10, (E) 15, (F) 20 K min-1.
4 Conclusions
First, grafted epoxy resins were prepared based on DGEBA and polyurethane. The chemical reaction between DGEBA and polyurethane was investigated by FTIR. FE-SEM clearly showed phase separation of polyurethane and grafted epoxy resin, which can be used to alleviate the brittleness problem. The stress-strain curve showed an improved toughness of grafted epoxy resin. Second, TGA was introduced to reckon the thermal stability of the grafted epoxy resin at the heating rates of 10, 15 and 20 K min-1. Third, model fitting method was used to calculate the kinetic parameters of degradation based on the CR method and the ABSW method. We compared different degrees of conversion from experimental and calculation results. It was notable that the calculation results of conversion α fit well with the experiment to some degree. Kinetic function for thermal degradation of grafted epoxy resin can be obtained.
This work was supported by the NSFC (grant nos. 61001026 and 51025208). The authors thank Jie Li (Micromachining Laboratory of University of Electronic Science and Technology of China) for TG tests.
References
[1] Bouer RS. Epoxy Resin Chemistry, Advances in Chemistry Series, 114, American Chemical Society: Washington, DC, 1979.Search in Google Scholar
[2] Argon AS, Cohen RE. Polymer 2003, 44, 6013–6032.10.1016/S0032-3861(03)00546-9Search in Google Scholar
[3] Ratna D, Banthia AK. Macromol. Res. 2004, 12, 11–21.Search in Google Scholar
[4] Blanco I, Cicala G, Lo Faro C, Motta O, Recca A. Polym. Eng. Sci. 2006, 46, 1502–1511.Search in Google Scholar
[5] Blanco I, Oliveri L, Cicala G, Recca A, J. Therm. Anal. Calorim. 2012, 108, 685–693.Search in Google Scholar
[6] Chen HB, Karger-Kocsis J, Wu JS, Varga J. Polymer 2002, 43, 6505–6514.10.1016/S0032-3861(02)00590-6Search in Google Scholar
[7] Mezzenga R, Boogh L, Manson JE. Compos. Sci. Technol. 2001, 61, 787–795.Search in Google Scholar
[8] Fu SY, Feng XQ, Lauke B, Mai YW. Composites: Part B 2008, 39, 933–961.10.1016/j.compositesb.2008.01.002Search in Google Scholar
[9] Blanco I, Cicala G, Motta O, Recca A. J. Appl. Polym. Sci. 2004, 94, 361–371.Search in Google Scholar
[10] Cicala G, Blanco I, Latteri A, Oliveri L, Recca A. Polym. Eng. Sci. 2013, 53, 219–225.Search in Google Scholar
[11] Baidak AA, Liegeois JM, Sperling LH. J. Polym. Sci. Part B: Polym. Phys. 1997, 35, 1973–1984.Search in Google Scholar
[12] Harani H, Fellahi S, Bakar M. J. Appl. Polym. Sci. 1998, 70, 2603–2618.Search in Google Scholar
[13] Hsieh KH, Han JL. J. Polym. Sci. Part B: Polym. Phys. 1990, 28, 623–630.Search in Google Scholar
[14] Han JL, Li KY. J. Appl. Polym. Sci. 1998, 70, 2635–2645.Search in Google Scholar
[15] Hsieh KH, Han JL, Yu CT, Fu SC. Polymer 2001, 42, 2491–2500.10.1016/S0032-3861(00)00641-8Search in Google Scholar
[16] Lin SP, Han JL, Yeh JT, Chang FC, Hsieh KH. Eur. Polym. J. 2007, 43, 996–1008.Search in Google Scholar
[17] Han JL, Lin SP, Ji SB, Hsieh KH. J. Appl. Polym. Sci. 2007, 106, 3298–3307.Search in Google Scholar
[18] Chattopadhyay DK, Webster DC. Prog. Polym. Sci. 2009, 34, 1068–1133.Search in Google Scholar
[19] Zhang YH, Xia ZB, Huang H, Chen HQ. Polym. Test. 2009, 28, 264–269.Search in Google Scholar
[20] Abate L, Blanco I, Cicala G, Recca A, Restuccia CL. Polym. Degrad. Stab. 2006, 91, 3230–3236.Search in Google Scholar
[21] Blanco I, Abate L, Antonelli ML. Polym. Degrad. Stab. 2011, 96, 1947–1954.Search in Google Scholar
[22] Abate L, Blanco I, Orestano A, Pollicino A, Recca A. Polym. Degrad. Stab. 2005, 87, 271–278.Search in Google Scholar
[23] Abate L, Blanco I, Motta O, Pollicino A, Recca A. Polym. Degrad. Stab. 2002, 75, 465–471.Search in Google Scholar
[24] Lewicki JP, Pielichowski K, De la Croix PT, Janowski B, Todd D, Liggat J. Polym. Degrad. Stab. 2010, 95, 1099–1105.Search in Google Scholar
[25] Duquesnea S, Brasa ML, Bourbigota S, Delobelb R, Camino G, Eling B, Lindsay C, Roels T. Polym. Degrad. Stab. 2001, 74, 493–499.Search in Google Scholar
[26] Xu YJ, Petrovic Z, Das S, Wilkes GL. Polymer 2008, 49, 4248.10.1016/j.polymer.2008.07.027Search in Google Scholar
[27] Ozawa T. Bull. Chem. Soc. Jpn. 1965, 38, 1881–1886.Search in Google Scholar
[28] Bagchi TP, Sen PK. Thermochim. Acta 1981, 51, 175–189.10.1016/0040-6031(81)85157-XSearch in Google Scholar
[29] Zeng WR, Li SF, Chow WK. Chin. J. Chem. Phys. 2003, 16, 317–320.Search in Google Scholar
[30] Zhang TL, Hu RZ, Li FP. Thermochim. Acta 1994, 244, 177–184.10.1016/0040-6031(94)80217-3Search in Google Scholar
[31] Erickson KL. J. Therm. Anal. Calorim. 2007, 89, 427–440.Search in Google Scholar
[32] Wang HH, Ni YH, Jahan MS, Liu ZH, Schafer TJ. J. Therm. Anal. Calorim. 2011, 103, 293–302.Search in Google Scholar
[33] Simon J, Barla F, Haller AK, Farkas F, Kraxner M. Chromatographia 1988, 25, 99–106.10.1007/BF02259024Search in Google Scholar
[34] Li AL, Xiong JP, Zuo Y, Wang CZ. Acta Phys. Chim. Sin. 2007, 23, 1622–1626.Search in Google Scholar
[35] Raymond MR, Bui VT. J. Appl. Polym. Sci. 1998, 70, 1649–1659.Search in Google Scholar
[36] Javni I, Petrovic ZS, Guo A, Fuller R. J. Appl. Polym. Sci. 2000, 77, 1723–1734.Search in Google Scholar
[37] Zhang HL, Sun SL, Ren MQ, Chen QY, Song JB, Zhang HF, Mo ZS. J. Appl. Polym. Sci. 2008, 109, 4082–4088.Search in Google Scholar
[38] Cooper SL, Tobolsky AV. J. Appl. Polym. Sci. 1966, 10, 1837–1844.Search in Google Scholar
[39] Pearson RA, Yee AF. J. Mater. Sci. 1986, 21, 2475–2488.Search in Google Scholar
[40] Pearson RA, Yee AF. J. Mater. Sci. 1989, 24, 2571–2580.Search in Google Scholar
[41] Liu J, Sue H-E, Thompson ZJ, Bates FS, Dettloff M, Jacob G, Verghese N, Pham H. Macromolecules 2008, 41, 7616–7624.10.1021/ma801037qSearch in Google Scholar
[42] Liu J, Thompson ZJ, Sue H-J, Bates FS, Hillmyer MA, Dettloff M, Jacob G, Verghese N, Pham H. Macromolecules 2010, 43, 7238–7243.10.1021/ma902471gSearch in Google Scholar
[43] Ammar K, Flanagan DR. J. Phys. Chem. B 2006, 110, 17315–17328.10.1021/jp062746aSearch in Google Scholar PubMed
©2014 by Walter de Gruyter Berlin Boston
This article is distributed under the terms of the Creative Commons Attribution Non-Commercial License, which permits unrestricted non-commercial use, distribution, and reproduction in any medium, provided the original work is properly cited.
Articles in the same Issue
- Masthead
- Masthead
- Original articles
- New thermally stable poly(amide-imide)/montmorillonite reinforced nanocomposite based on N,N′-pyrromellitoyl-bis-l-valine: synthesis and characterization
- Thermal degradation of epoxy resin grafted with polyurethane
- Effect of single-walled carbon nanotube on the physical, rheological and mechanical properties of thermoplastic elastomer based on PP/EPDM
- Influence of ceramic particle features on the thermal behavior of PPO-matrix composites
- High-temperature mechanical behavior of Al-Cu matrix composites containing diboride particles
- Modification and adsorption performance of ultrafine iron matrix composite powder
- Densification treatment and properties of carbon fiber reinforced contact strip
- The effects of marble dust and fly ash on clay soil
- The effects of different dusty aggregate on bituminous hot mixtures
- Assessment of specific absorption rate reduction in human head using metamaterial
- Circumferential waves in pre-stressed functionally graded cylindrical curved plates
- A solution for transverse thermal conductivity of composites with quadratic or hexagonal unidirectional fibres
- Impact response of composite plates manufactured with stitch-bonded non-crimp glass fiber fabrics
- Moment methods for C/SiC woven composite components reliability and sensitivity analysis
- The effects of fabric lamination angle and ply number on electromagnetic shielding effectiveness of weft knitted fabric-reinforced polypropylene composites
- A mesh-free simulation of mode I delamination of composite structures