
Integrated regulatory and metabolic networks of the tumor microenvironment for therapeutic target prioritization
-
Tiange Shi


Abstract
Translation of genomic discovery, such as single-cell sequencing data, to clinical decisions remains a longstanding bottleneck in the field. Meanwhile, computational systems biological models, such as cellular metabolism models and cell signaling pathways, have emerged as powerful approaches to provide efficient predictions in metabolites and gene expression levels, respectively. However, there has been limited research on the integration between these two models. This work develops a methodology for integrating computational models of probabilistic gene regulatory networks with a constraint-based metabolism model. By using probabilistic reasoning with Bayesian Networks, we aim to predict cell-specific changes under different interventions, which are embedded into the constraint-based models of metabolism. Applications to single-cell sequencing data of glioblastoma brain tumors generate predictions about the effects of pharmaceutical interventions on the regulatory network and downstream metabolisms in different cell types from the tumor microenvironment. The model presents possible insights into treatments that could potentially suppress anaerobic metabolism in malignant cells with minimal impact on other cell types’ metabolism. The proposed integrated model can guide therapeutic target prioritization, the formulation of combination therapies, and future drug discovery. This model integration framework is also generalizable to other applications, such as different cell types, organisms, and diseases.
1 Introduction
Over the past decade, high-throughput single-cell transcriptomics has proven to be instrumental in characterizing within and between cell variation (Tang et al. 2009) and its relation to disease (Ackers-Johnson et al. 2018; Binnewies et al. 2018; Chen et al. 2019; Östman 2012; Paik et al. 2020; Potter 2018), including cancer (Chung et al. 2017; Suvà and Tirosh 2019; van Galen et al. 2019; Zhu et al. 2017). The tumor microenvironment is a diverse, complex collection of many interacting cell types (Whiteside 2008). Such diversity necessitates highly individualized therapies. The push toward personalized medicine has been recognized as a critical step toward effective cancer treatments (Chin et al. 2011; Tannock and Hickman 2016). Despite the progress and availability of high-throughput technologies, translating genomic discovery to clinical endpoints has not kept pace and remains a longstanding bottleneck in the field (Chin et al. 2011). This is partly due to the associated time and expense of experiments needed for drug development. Drug discovery is time-consuming and costly; recent estimates to bring a single cancer drug to market are $648 million and revenues are more than three times that (Prasad and Mailankody 2017).
Computational systems biology can be used to accelerate the discovery process through the integration of computational and experimental research (Kitano 2002a,b). Computational experiments, known as in silico experiments, are used to make predictions, generate hypotheses, and prioritize the most promising experiments and treatments for future investigations. Network analysis is a cornerstone of systems biology that leverages mathematical models of biological networks to enhance our understanding of function, mechanisms, and disease. Structures of these network models are often obtained either from experimental studies, learned from the data, or some combination thereof (Liu et al. 2020). Networks typically target specific domains of biological variables such as protein-protein interaction (Kovács et al. 2019), metabolism (Angione 2019), or gene regulation (Ferreira et al. 2018). This work focuses on two classes of networks that model different biological domains: regulatory signaling and metabolic networks, and addresses their integration. The mathematical frameworks used for modeling these domains are fundamentally different, which has made their integration a longstanding challenge.
Ordinary differential equations are used to model cellular metabolism. These models depend on mathematical representations of biochemical reactions governed by mass balance equations with a well-understood stoichiometry (Nelson et al. 2008). Dynamic systems require kinetic rate parameters that are often unknown and difficult or impossible to measure. Furthermore, cost and challenges of omics data collection at multiple time points have limited its use in the post-genome era. A popular alternative is to model the system at steady-state, where there are no changes in metabolite concentrations, and the model reduces to a linear system. Steady-state models can be parameterized using observational data from a single time-point. Constraint-based modeling approaches are used for flux analysis in steady-state systems (Gudmundsson and Thiele 2010; Kauffman et al. 2003; Orth et al. 2010; Palsson 2015). The models rely on an objective function, such as biomass production, together with thermodynamic constraints to define region of feasible fluxes for optimization. Constraint-based models have become widespread and accessible due to the large-scale published computational models of cellular metabolism used for metabolic modeling. The models consist of metabolic reactions in a particular organism catalyzed by one or several enzymes encoded by genes.
Constraint-based models have been used to characterize differences in flux distributions between malignant and normal cells, thereby providing insights into cancer-specific metabolic hallmarks and enzyme targets for anti-cancer treatment (Agren et al. 2014; Folger et al. 2011; Frezza et al. 2011; Gatto et al. 2015; Yizhak et al. 2014; Zhao et al. 2013). Notably, the adaptation of these models to different cancers is justified because the differences between the mRNA level observed under different steady-state conditions have been shown to explain most of the variation in concentrations of the associated proteins (Li and Biggin 2015; Liu et al. 2016b). Although the encoding is often not directly modeled, there is a direct gene-protein-reaction association assumption that enables the use of high-throughput genomic data within the frame of metabolic networks (Bordel 2018; Gu et al. 2019).
Regulatory pathways and processes have been curated in databases (Ashburner et al. 2000; Kanehisa and Goto 2000). However, unlike metabolic stoichiometry, structures of regulatory pathways are often less understood. Inference of gene regulatory networks using graphical modeling paradigms has been a very active area of research (Bansal et al. 2007; Benfey and Mitchell-Olds 2008; Friedman 2004; Husmeier 2003b; Karlebach and Shamir 2008; Lee and Tzou 2009; Markowetz and Spang 2007; Menéndez et al. 2010; Rockman 2008; Vijesh et al. 2013). The bulk of research in this area is dedicated to inferring the network structure from transcriptomics data to understand direct or indirect associations between genes. New methods like Functional Inference of Gene Regulation (FigR) use single-cell ATAC-seq and RNA-seq data to infer gene-regulatory networks, examining chromatin dynamics and gene expression for a unique view of regulatory networks (Kartha et al. 2022). This work utilizes a directed class of Probabilistic Graphical Models (PGMs) known as Bayesian Networks (BNs) (Koller and Friedman 2009; Lauritzen 1996) for models of gene regulation. A valuable asset within the BN paradigm is the use of probabilistic reasoning, which enables inferences about probabilistic changes within the network under different conditions and perturbations (Moharil et al. 2016; Yu et al. 2020).
There have been limited attempts to link transcriptomics data into metabolic models. Context-specific metabolic models incorporate information from transcriptomics data into flux estimation. The underlying premise is that not all reactions are uniformly essential or active across different cell types or conditions, and that transcriptomics carries this information as a measure of abundance. Boolean models have been used to embed transcriptional regulation in the constraints (Covert and Palsson 2002; Covert et al. 2008; Shlomi et al. 2007). More complex models directly use transcriptomics data to constrain the bounds of estimated fluxes (Chandrasekaran and Price 2010; Marmiesse et al. 2015), generating multi-valued logical rules for genetic regulation with steady-state FBA models.
These constraint-based models of metabolism that utilize transcriptomics fail to account for the complex structure of the regulatory networks that influence the enzymes facilitators of biochemical reactions. Ignoring the hierarchical structure of the regulatory network could indirectly invoke an independence assumption between enzymes in the model. To this end, there has been significant progress in the mathematical modeling of regulatory networks (Brazhnik et al. 2002; Dondelinger et al. 2013; Hill et al. 2012; Huynh-Thu et al. 2010; Schäfer and Strimmer 2005; Smolen et al. 2000; Zhang and Horvath 2005), which has been largely untapped in metabolic models. BNs have been widely used to model regulatory networks, primarily focusing on inferring structures (Blair et al. 2012; Hageman et al. 2011; Husmeier 2003a,b; Wang et al. 2013; Werhli and Husmeier 2007; Werhli et al. 2006). Recently, Yu and Blair (2019) developed a novel framework that utilizes BN models to perform exact probabilistic reasoning using bulk transcriptomics (Koller and Friedman 2009). This framework recasts the network as a computational model for perturbation and prediction. This framework was used to predict brain metabolism changes after perturbations to the HIF-1A pathway in Alzheimer’s patients.
The integration of single-cell transcriptomics within computational models of metabolism has been limited. Damiani et al. (2019) proposed a method for single-cell flux balance analysis (scFBA) to infer single-cell fluxomes. The approach utilizes single-cell transcriptomics, environmental constraints relating to medium-cell flux exchanges, and assumptions on cell interactions. Earlier work by Damiani et al. (2017) developed population FBA (popFBA), which utilized scRNA to characterize the heterogeneity in the tumor environment for classic FBA models. To the authors’ knowledge, there has not been progress in integrating scRNA regulatory networks with models of metabolism.
This study is motivated by the observation that drug interventions targeting transcription factors (TFs) impact the metabolism differently across cells in the tumor microenvironment (DeBerardinis 2020; Reina-Campos et al. 2017). This can be partially explained by differential cell signaling among cell types (Arneth 2020; Balkwill et al. 2012; Kenny et al. 2007). Accounting for these differences will provide mathematical models that are more physiological. These models can be used to advance our understanding of the differential effects of therapeutic perturbations on metabolisms in different cell types in the tumor microenvironment.
This work develops a modeling paradigm for prediction in integrated regulatory and metabolic networks. The bridge between the two paradigms is probabilistic reasoning in BNs, which generates predictions to constrain the metabolic model. These cell-specific integrated models provide a unique opportunity to characterize the metabolism of different cell types in response to upstream genetic perturbations, providing insights on therapeutic target prioritization, formulation of combination therapies, and future drug discovery. This model integration framework is generalizable to other applications, such as different cell types, organisms, and diseases.
Applications focus on networks parameterized using single-cell RNA sequencing data from different cell types in the glioblastoma tumor microenvironment (Neftel et al. 2019) and a metabolic model of the brain. The model centers on the HIF-1A pathway, which is central to cancer metabolism (Chiavarina et al. 2010; Koukourakis et al. 2002; Rawłuszko-Wieczorek et al. 2014) and includes a complex network of transcription factors, many of which are drug targets. In silico experiments are performed to examine the effects of 177 curated TF-targeting drugs published in the drug repurposing hub library (Corsello et al. 2017) on metabolism of cells in the tumor microenvironment. Results show that drug combinations inhibiting STAT3 (e.g., Niclosamide) with other transcription factors (e.g., AR inhibitor Enzalutamide) are predicted to strongly suppress anaerobic metabolism in malignant cells, without major interference to other cell types’ metabolism, suggesting a potential combination therapy for anti-cancer treatment.
2 Materials and methods
The integration of regulatory and metabolic networks is challenging due to the fundamental differences between the two modeling frameworks. Section 2.1 describes the modeling of the regulatory network using probabilistic PGMs. Probabilistic reasoning in BNs is described, which will enable predictions of downstream enzymatic changes after perturbation. Section 2.2 describes constraint-based models of metabolism used to predict the fluxomes. Sections 2.3 and 2.4 describe model integration and an application to cancer, respectively. Lastly, a sensitivity analysis is presented in Section 2.5, to assess the sensitivity of predictions to network construction and the integration of model systems.
2.1 Bayesian network learning and inference
BNs are a class of probabilistic graphical models with directed edges that are used to represent the joint distribution of a set of random variables, X = {X 1, X 2, …X p }. A structural requirement of BNs is that they are directed acyclic graphs (DAGs) (Koller and Friedman 2009; Lauritzen 1996). The lack of feedback and cycles in BNs is required to represent the joint distribution in compact factored form. In our setting, the nodes in a BN represent transcription factors and enzymes in a regulatory network. Despite these structural constraints, there are two major advantages that BNs possess that make them well-suited for regulatory network modeling. (1) There is a direct and unique mapping between the graph, G, and the joint probability distribution, P(X). (2) BNs can be used for exact probabilistic reasoning to infer probabilistic changes (queries) when information is entered and propagated through the graph (Lauritzen 1996).
The structure of a BN encodes a set of conditional independencies and provides insights into the direct and indirect associations between nodes. BNs follow a Markov assumption, which states that a node, X i , is assumed to be independent of its non-descendants (nodes that are not parent nodes), given the state of its parent nodes in the graph, G. Under this assumption, the graph can be broken down into a series of conditional dependencies of a child node, X i , and its parent node(s), pa(X i ). These local models can be used to express the joint probability distribution in compact factored form:
where Θ i denotes the parameters of the local probability distribution (Koller and Friedman 2009; Nagarajan et al. 2013). In our BN, we utilize Gaussian distributions to describe the local distributions for child and parent nodes.
Two learning tasks are required for BNs: structural learning and parameter learning. In this work, we leverage a score-based algorithm known as max-min hill-climbing (Tsamardinos et al. 2006) within the bnlearn package in the R programming language (Scutari et al. 2019). Briefly, the max-min algorithm is a greedy method that identifies networks with high-scoring local models. The scores themselves are determined by goodness of fit measures on local regressions of child nodes onto parents. BNs can also leverage prior network structures and parameterizations. Graphical priors can be incorporated to embed information known a priori about the network structure into the learning process (Scutari et al. 2019; Werhli and Husmeier 2007). Parameter learning is the second task and integral to structural learning based on greedy search, which uses scores as a function of the parameters derived from regressions of child nodes on parents to create local distributions; see (Koller and Friedman 2009; Nagarajan et al. 2013) for details.
BNs can also be used to perform exact probabilistic reasoning or inference. Probabilistic reasoning in a BN is the process by which evidence about nodes is input and propagated through the network (Koller and Friedman 2009; Lauritzen 1996). In practice, evidence is simply setting the value or state of a node, propagating this information through the network, and then reasoning about marginal, joint, and conditional probabilities, within the network, in light of this new evidence. This process is carried out using belief propagation (BP) algorithms, which use a clique graph derived from the network structure. In BNs, this clique graph is in the form of a tree and can be used for exact inference, which is not the case for other classes of PGMs (Koller and Friedman 2009). Probabilistic reasoning is a key component of this approach, as we explore changing evidence relating to changes in an upstream transcription factor (TF). More specifically, this process of probabilistic reasoning can be viewed as a tool for predicting system-wide responses of the network to new evidence (perturbations), which can be viewed as in silico experiments. To perform inference on an intervention in a causal BN requires to represent context-specific independence: in the context of an intervention on a variable, any influences that have a causal effect on that variable are removed (Minka and Winn 2008; Winn 2012). This problem can be reduced to probabilistic reasoning in a mutilated BN, where all the incoming edges to the variables under intervention are removed. In our applications, BP is performed using the BayesNetBP package (Yu et al. 2020).
2.2 Constraint-based flux models
Models of cellular metabolism can be derived from the stoichiometry of biochemical reactions using the principles of mass balance (Nelson et al. 2008). A widely used approach models the dynamics of metabolite concentrations with ordinary differential equations (ODEs) of the form:
where C denotes the concentration of metabolites, E ∈ R m×n is a sparse stoichiometric matrix and Φ ∈ R n×1 contains the flux rates for the reactions in the model. When the system is at steady state, the system of ODEs simplifies to a linear one.
The linear system derived from ODEs can serve as constraints to the flux estimation for many purposes, e.g., to impose the irreversibility of certain reactions (inequality constraints), to add prior knowledge about flux rates, or linear combinations of flux rates (equality constraints). Flux balance analysis (FBA) is a constraint-based modeling approach that estimates fluxes by optimizing an objective function while subject to the given constraints. The objective function is usually a profit function for maximizing fluxes or linear combinations of fluxes related to optimal growth conditions, ATP production, or biomass production rate (Kauffman et al. 2003; Orth et al. 2010). Equality and inequality constraints can be used to impose the irreversibility of certain reactions (inequality constraints), to add prior knowledge about flux rates or linear combinations of flux rates (equality constraints). Mathematically, the addition of constraints shapes the solution space for the flux estimation (Orth et al. 2010).
The constrained optimization problem for FBA can be mathematically described as follows:
where E m×n is the stoichiometric matrix with rows representing m metabolites and columns for n fluxes, and Φ is a vector of fluxes. The inequality constraint GΦ ≥ h can be used to impose irreversibility of certain reactions as well as the capacity constraints that provide the upper limit of fluxes. The objective function, c T Φ, is a linear combination of the fluxes that are to be optimized. Note that the model does not fully account for metabolites that participate in cellular uptake or release to the extracellular environment. The fluxes for these external metabolites can be non-zero.
In order to achieve more precise in silico cell-specific flux predictions, Gavai et al. (2015) proposed least squares with equalities and inequalities flux balance analysis (Lsei-FBA) model to estimate metabolic flux distribution in diseased brain cells from healthy brain metabolism coupled with changes in gene expression between health and disease. More specifically, Lsei-FBA initially estimated fluxes in diseased cells by multiplying the healthy fluxes with the fold change in associated gene expression between health and disease. Next, the initial estimates were refined by equality (balance of fluxes) and inequality (irreversible reactions) constraints. Finally, to obtain the fluxes in diseased cells, a cost function of the sum of squares of the differences between the refined estimated fluxes and the initial rough estimate of the fluxes was minimized, subject to (1) equality and inequality constraints, and (2) maximization of correspondence between relative changes in gene expression and changes in fluxes (Gavai et al. 2015). In this study, we treated oligodendrocytes as healthy cells. We applied Lsei-FBA to predict fluxes in other cell types coupling with the expression changes between oligodendrocytes and other cell types.
2.3 Integrated networks
2.3.1 Model of brain metabolism
A model for brain metabolism was constructed using 89 metabolites and 71 biochemical reactions from core pathways, including the glycolytic pathway, Pentose Phosphate Pathway (PPP), the Tricarboxylic Acid (TCA) cycle, malate-aspartate shuttle, the glutamate and GABA shunt and oxidative phosphorylation. The model was originally developed to investigate the brain’s low oxygen to carbohydrate ratio during extreme endurance sports (van Beek et al. 2011) and was later used to characterize metabolic changes in Alzheimer’s patients (Gavai et al. 2015). Recently, the model was used to integrate cell-signaling and metabolic pathways to assess the effect of perturbations on the metabolism is Alzheimer’s disease (Yu and Blair 2019). Each of these investigations and the current one, assume that the metabolic system is at steady state. This simplification allows us to represent the model as a linear system of equations rather than a more complex system of differential equations. A detailed description of the biochemical reactions is given in Yu and Blair (2019).
2.3.2 Data and pre-processing
Single-cell RNA sequencing (scRNA-seq) data was obtained from the Broad Institute single-cell portal (Neftel et al. 2019). Brain tumor samples were collected from 28 glioblastoma patients, then preprocessed and dissociated into single cells for single-cell RNA sequencing profiling (SMART-Seq2) (Filbin et al. 2018). The expression levels were log2 transformed. A total of 7930 single brain cells passed quality control were then classified into four cell types (Neftel et al. 2019): malignant cells (N = 6836), macrophages (N = 754), oligodendrocytes (N = 219) and T-cells (N = 94) (Filbin et al. 2018; Li and Dewey 2011). The scRNA-seq data contained 23,686 genes, with an average of 5730 genes detected per cell.
The data contains a large number of zeros resulting in zero-inflated gene distributions, which is common in scRNA-seq data (Kadota and Shimizu 2020). Zero inflation is problematic for BN construction and inference because the local distributions are modeled as Gaussian. VIPER (virtual inference of protein activity by enriched regulon analysis) was used to infer TF activity by systematically analyzing the expression of the genes regulated by the same TF (known as TF regulon) through analytic rank-based enrichment analysis (Alvarez et al. 2016; Holland et al. 2020). Studies have shown that VIPER can accurately measure TF activities on a single-cell basis. Its performance is highly robust and resilient to the zero-inflated issue of scRNA-seq data (Ding et al. 2018; Obradovic et al. 2021). Notably, alternative popular smoothing methods such as MAGIC (Markov affinity-based graph imputation of cells) (Van Dijk et al. 2018) have been used to impute likely gene expression in each cell, revealing the underlying biological structure (Van Dijk et al. 2018). However, MAGIC was not used in this work because it has been shown to induce false correlations (Andrews and Hemberg 2018), which can lead to false positive edges and high edge density in network structure inference. We implemented the following three-stage approach to overcome modeling issues related to inference with zero-inflated data. The resulting network and imputed expression levels will be used for the BN inference described in the next section.
Prior regulon network for TF activities inference: VIPER algorithm requires a prior for the network architecture of the TFs and downstream target genes for TF activities inference. This prior regulon network was constructed leveraging the DoRothEA database. DoRothEA, as a comprehensive resource of human TF regulon, contains 1.5 million scored interactions between 1399 TFs and 27,976 target genes (Garcia-Alonso et al. 2019). For each TF target interaction, a statistical confidence score was assigned based on the quality and reliability of the evidence for that interaction, ranging from A (highest confidence) to E (lowest confidence). In this study, we curated TF-target interactions from Bioconductor dorothea package in R (Garcia-Alonso et al. 2019) with high confidence (score A and B) to construct the prior regulon network for TF activities inference.
TF activities inference and gene expression imputation: Next, we processed the scRNA-seq data by screening out the low expressed genes with a mean expression level of less than 0.1, which leads to a total of 14,403 TFs and downstream genes. The processed scRNA-seq data were then leveraged to infer the upstream TF activities employing the Bioconductor VIPER package in R (Alvarez et al. 2016), coupled with the constructed prior regulon network. We obtained inferred activities of a total of 1321 TFs. The expressions of the remaining 13,082 genes were then imputed using the MAGIC package in R (Van Dijk et al. 2018). The inferred TF activities and imputed gene expressions (referred to as imputed expression data in the following) will be later utilized for BN inference.
Prior structural constraint for BN learning: Another regulon network focusing on brain metabolism was also developed for later BN structural learning. To do so, we first identified 18 critical enzymes from imputed expression data that appeared both in the brain metabolic model (Gavai et al. 2015) described in Section 2.3.1 and the HIF-1 signaling pathway (Gavai et al. 2015). Among those 18 critical enzymes, 13 were further mapped to the DoRothEA database. Next, we constructed a regulon network with high confident (score A and B) TF-target interactions from DoRothEA and obtained a subgraph of that network using those 13 mapped critical enzymes and their neighborhood with a maximum distance of three. In addition, five enzymes were not recorded in the DoRothEA. Studies showed that HIF1A as a TF plays a crucial role in the cancer metabolism (Semenza 2010) and fundamentally affects the transcription of enzymes involved in glycolytic metabolism in brain cells (Ebright et al. 2020). Therefore, we assumed those five unmapped enzyme genes would be eventually affected by HIF1A and added them back to the network through an edge from the HIF1A node. This newly obtained regulon network consists of 108 nodes (18 enzymes and 90 TFs) with 285 possible edges and will serve as a prior graphical constraint in cell-specific BN structure learning.
2.3.3 Bayesian network models of cell-specific signaling pathways
In this study, we learned the structures of cell-specific signaling Bayesian networks employing a score-based hill-climbing algorithm and imputed expression data under the prior structural constraint developed in Section 2.3.2. More specifically, prior structure constraint was firstly used to limit the search space of possible network structures by forbidding edges that did not appear in the constraint regulon network. Then we performed a greedy hill-climbing search (implemented in the bnlearn package [Nagarajan et al. 2013]) in the limited searching space of BNs based on the imputed expression data of each cell type. The search began with an empty graph. The edge addition, deletion, or direction reversal that led to the largest increase in the Bayesian Gaussian equivalent (BGe) score (Koller and Friedman 2009; Kuipers et al. 2014) was taken. The search continues in a similar fashion, recursively, until a BN with the maximum score was obtained. A total of 10 random restarts was set during the search to avoid local maxima. In addition, we set the maximum number of parent nodes in the network as three. This fan in restriction is commonly used to avoid overfitting (Nagarajan et al. 2013). This BN structure learning algorithm was applied four times, once for each cell type.
The cell-specific BNs for the four different cell types were compared using the following measurements (Newman 2018). (1) The number of shared edges between networks. (2) The Jaccard index, which equals the number of shared edges between two graphs divided by the total number of edges of the union of two graphs. (3) The graph edit distance, which is the minimum number of operations (insert an edge or node; drop an edge or node) required to transform one graph into another. (4) The closeness centrality distance (Roy et al. 2014), which is a graphical similarity measurement based on a node closeness centrality. The centrality of a node is the inverse of the average shortest distance between this node and all other nodes in the network. The closeness centrality distance between graphs G 1 and G 2 is calculated as:
where V is the union node set of G
1 and G
2;
2.4 Model integration and pharmaceutical interventions evaluation
Cell-specific BN models were integrated with a metabolic model to evaluate the system-wide effects of pharmaceutical interventions targeting TFs. The model is used to infer the impact of TF perturbations on the regulatory network and downstream metabolism. The integration of these two models is achieved by embedding predicted fold changes of enzyme levels from the signaling pathways into the constraints of the metabolic model for flux variability analysis. The integration follows closely to Yu and Blair (2019) but differs in terms of the models themselves and the intervention strategy.
Figure 1 shows a schematic of this integrated model and process. As described in Section 2.3.2, cell-specific BNs are inferred based on prior knowledge about the network structure (Garcia-Alonso et al. 2019; Holland et al. 2020) and participation in the metabolic model (Figure 1A) (Gavai et al. 2015). These BNs are perturbed using belief propagation to alter the TF levels. The TF perturbations and combinations of perturbations were guided by drug mechanisms of action (MOA) data of 6798 drugs from the drug repurposing hub (DRH) library (Corsello et al. 2017). The MOA data recorded the specific biological mechanism (e.g., reaction or interaction) that produces the pharmacological effect. A total of 177 inhibitors were mapped such that the BN models cover all their known targets. Supplementary (S-Table 1) details each drug’s target TFs and MOA. Pharmaceutical interventions of all 177 curated drugs were evaluated using the cell-specific BNs.
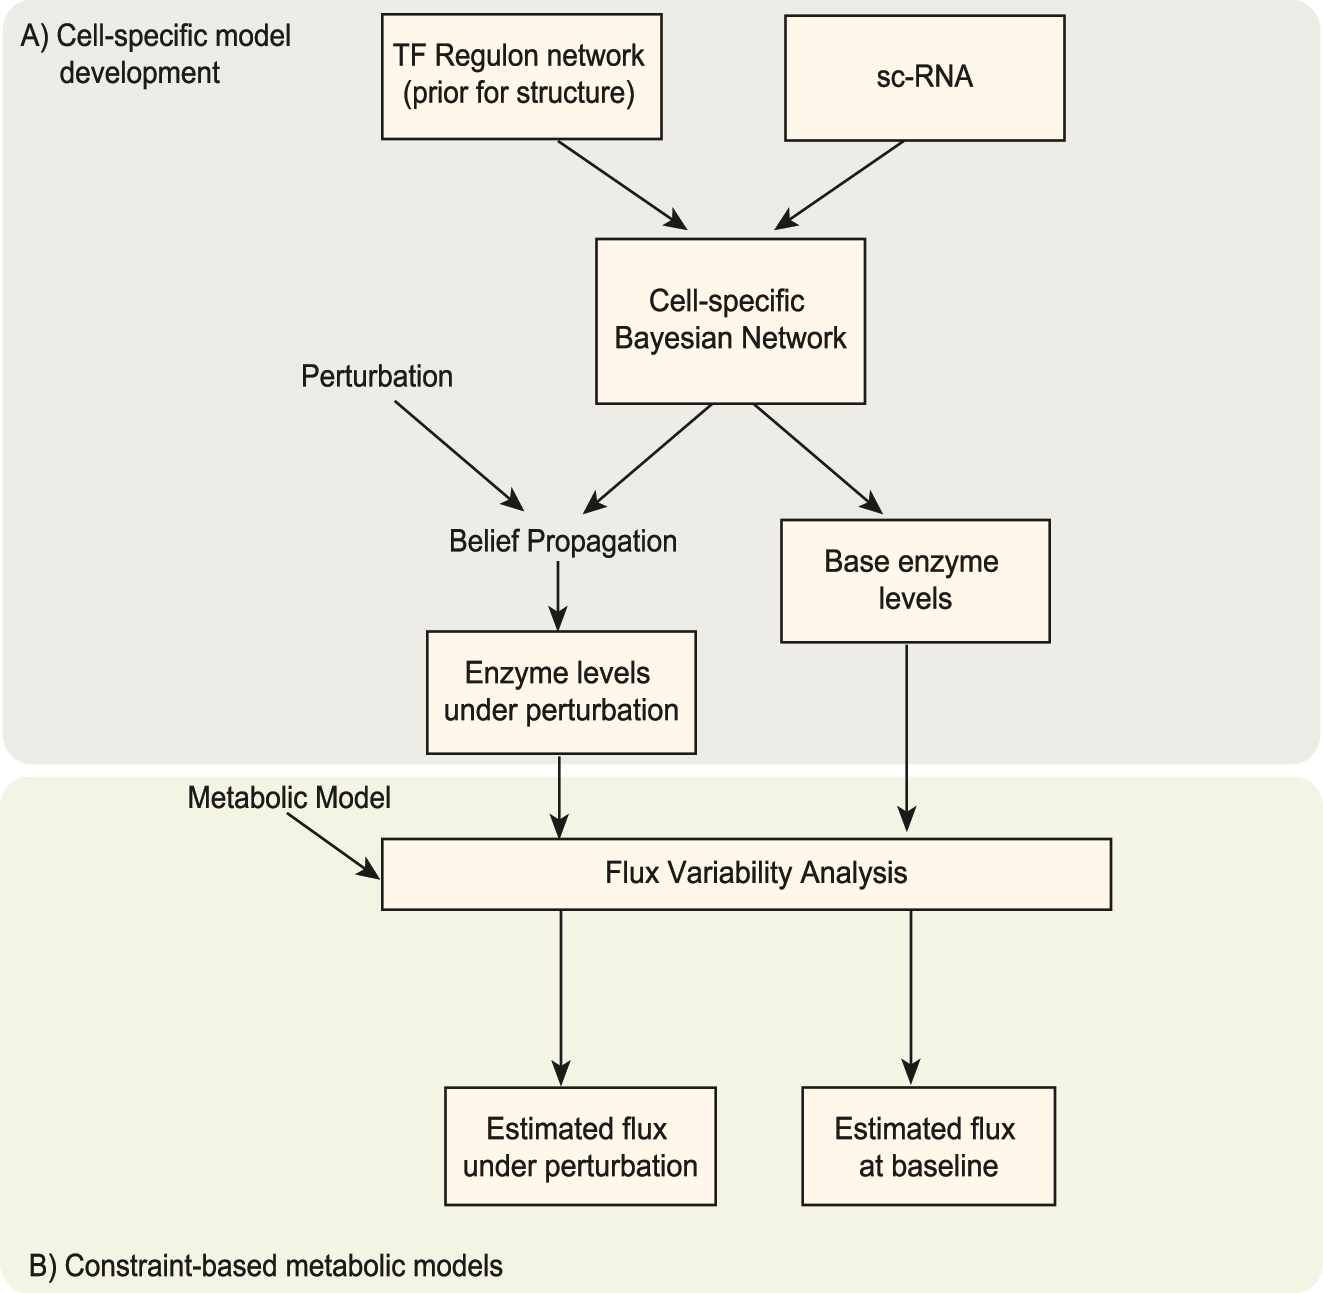
A schematic describing the integrated modeling approach. (A) Cell-specific models are developed using Bayesian Network inference using prior constraints of regulatory structure from a database and single-cell RNA data. The system-wide effects of perturbations to these models are explored using probabilistic reasoning for BNs. The enzyme levels estimated from these models are embedded into the constraints for flux variability analysis. (B) Lsei-FBA is performed using a metabolic model of brain metabolism. The outputs are predicted cell-specific reaction flux rates that can be compared to estimated baseline fluxes, which provides insights into the relative changes that occur in the cell-specific systems under TF perturbations.
2.4.1 Cell-specific enzyme fold change
For each cell-specific network, belief propagation was performed to predict the expression level of the enzymes and TFs in the regulatory network before and after the TF perturbation (Figure 1B) (Lauritzen 1996). We employed the BP procedure in the BayesNetBP package (Yu et al. 2020), which implements the belief propagation algorithms described in (Cowell 2005). The output of interest is cell-specific enzyme fold changes for the constraint of the flux variability analysis, which were calculated based on the following three-step procedure.
Initial enzyme expression level: The imputed expression data were utilized to infer both the structure and the parameters of cell-specific BNs. Cluster trees for belief propagation were then inferred for each network. The initial expression levels of enzymes and TFs were estimated as the marginal means (Yu et al. 2020).
Mutilated network after TF perturbation: Pharmaceutical interventions of each drug were treated as the perturbations (knockdown) of the target TFs. To simulate the effect of drug interventions, we assume the activity of all drug target TFs will be reduced by 2 standard deviations from their basal (average) level. Moreover, in order to model the causal relationship after drug interventions, a mutilated graph was obtained by removing all inward connections to the TF nodes that are targeted by the intervention (White and Vignes 2019). Cell-specific drug-intervened cluster trees were then generated using the mutilated graphs for propagation.
Enzyme expression level after TF perturbation: The perturbed TF activities after drug intervention were treated as evidence and absorbed into the cluster trees from the mutilated BNs. Belief propagation was performed for the estimation of perturbed enzyme levels. Cell-specific enzyme fold changes were then calculated using the mean expression level after perturbation (numerator) relative to the initial enzyme level (denominator).
2.4.2 Cell-specific relative flux change
Cell-specific relative changes for the metabolic fluxes were calculated in order to assess the effects of pharmaceutical interventions targeting TFs on metabolism. Calculations follow the three-step procedure described below.
Basal flux estimation in oligodendrocytes: Baseline flux rates in oligodendrocytes were estimated through the maximization of net ATP production, which reflects the high requirements for energy production in the brain, which is critical for bioenergetics, function, and neurodegeneration (Du et al. 2008). This objective function was also applied in other studies of brain metabolic modeling (Gavai et al. 2015; Yu and Blair 2019). Following (Gavai et al. 2015; Yu and Blair 2019), the flux in oligodendrocytes before the intervention using FBA with total ATP production maximized and with the pentose phosphate pathway (PPP) and GABA shunt fluxes constrained to measured values relative to glucose uptake. Basal flux in oligodendrocytes will then be used as the input for the Lsei-FBA model to estimate the flux distributions in oligodendrocytes and other cell types before and after interventions.
Enzyme fold change and initial cell-specific flux estimation: Cell-specific enzyme levels for all four cell types before and after TF perturbations were obtained following the same BP procedure described in Section 2.4.1, resulting in eight total estimates. Each of these enzyme estimates was contrasted with baseline oligodendrocytes to obtain fold change estimates. For each cell type, initial estimates for the fluxes were calculated as the product of basal flux in the oligodendrocytes for that reaction and the enzyme fold change in the associated cell-specific enzyme expression. In cases where multiple enzymes mapped to a single reaction, the average fold change across these genes was used to constrain the corresponding flux.
Estimation of cell-specific relative flux change: Employing the Lsei-FBA model in the R LIM package (Haskell and Hanson 1981; Van Oevelen et al. 2010), the final prediction of cell-specific metabolic fluxes was obtained by minimizing the sum of squared errors between estimated and predicted flux (basal flux × fold-change of enzymes). The constraints were (1) the steady-state assumption for intercellular metabolites that are not exchanged between brain and blood, (2) the restriction to forward flux through irreversible reactions (inequality constraints). The cell-specific relative flux change (C) is calculated as:
where v 0 and v 1 are the fluxes at baseline and after perturbation, respectively. Relative flux change of 0 means no change, while a negative value indicates that the drug down-regulates the reaction.
2.5 Sensitivity analysis
Sensitivity analysis was performed to quantify the effects of small changes in the structure and estimates on the prediction results from the integrated model. In order to assess the effects of bias, at each stage of model development, small changes were introduced to the prior regulon network and the inference for BN learning. Specifically, perturbations were introduced into the prior regulon network acquired in Section 2.3.2 by randomly removing one percent of the edges from the network. The perturbed prior regulon network was then used as a structural constraint to estimate the cell-specific BNs using the hill-climbing algorithm described in Section 2.3.3. Ten random restarts were set to avoid local maxima as well as introduce additional variation into the BN estimates. Following this, cell-specific relative flux changes after selected TF perturbations were determined as outlined in Section 2.4.2. This entire procedure was repeated 300 times to ensure the robustness of the findings.
3 Results
BNs were learned for each of the four cell types using the scRNA-seq data and prior graph constraints generated from databases. Unconnected upstream TF nodes were dropped within each cell-specific network. The BNs of four cell types showed distinct learned structures that support cell-specific cell-signaling. The macrophage network (Figure 2A) had 94 nodes and 174 edges; the malignant cell network (Figure 2B) had 103 nodes and 207 edges; the oligodendrocyte network (Figure 2C) had 81 nodes and 129 edges; the T-cell network (Figure 2D) had 76 nodes and 104 edges. The learned BNs of malignant cells and macrophages were larger in terms of nodes and edge density, suggesting a more intricate signaling network when compared to oligodendrocytes and T-cells.
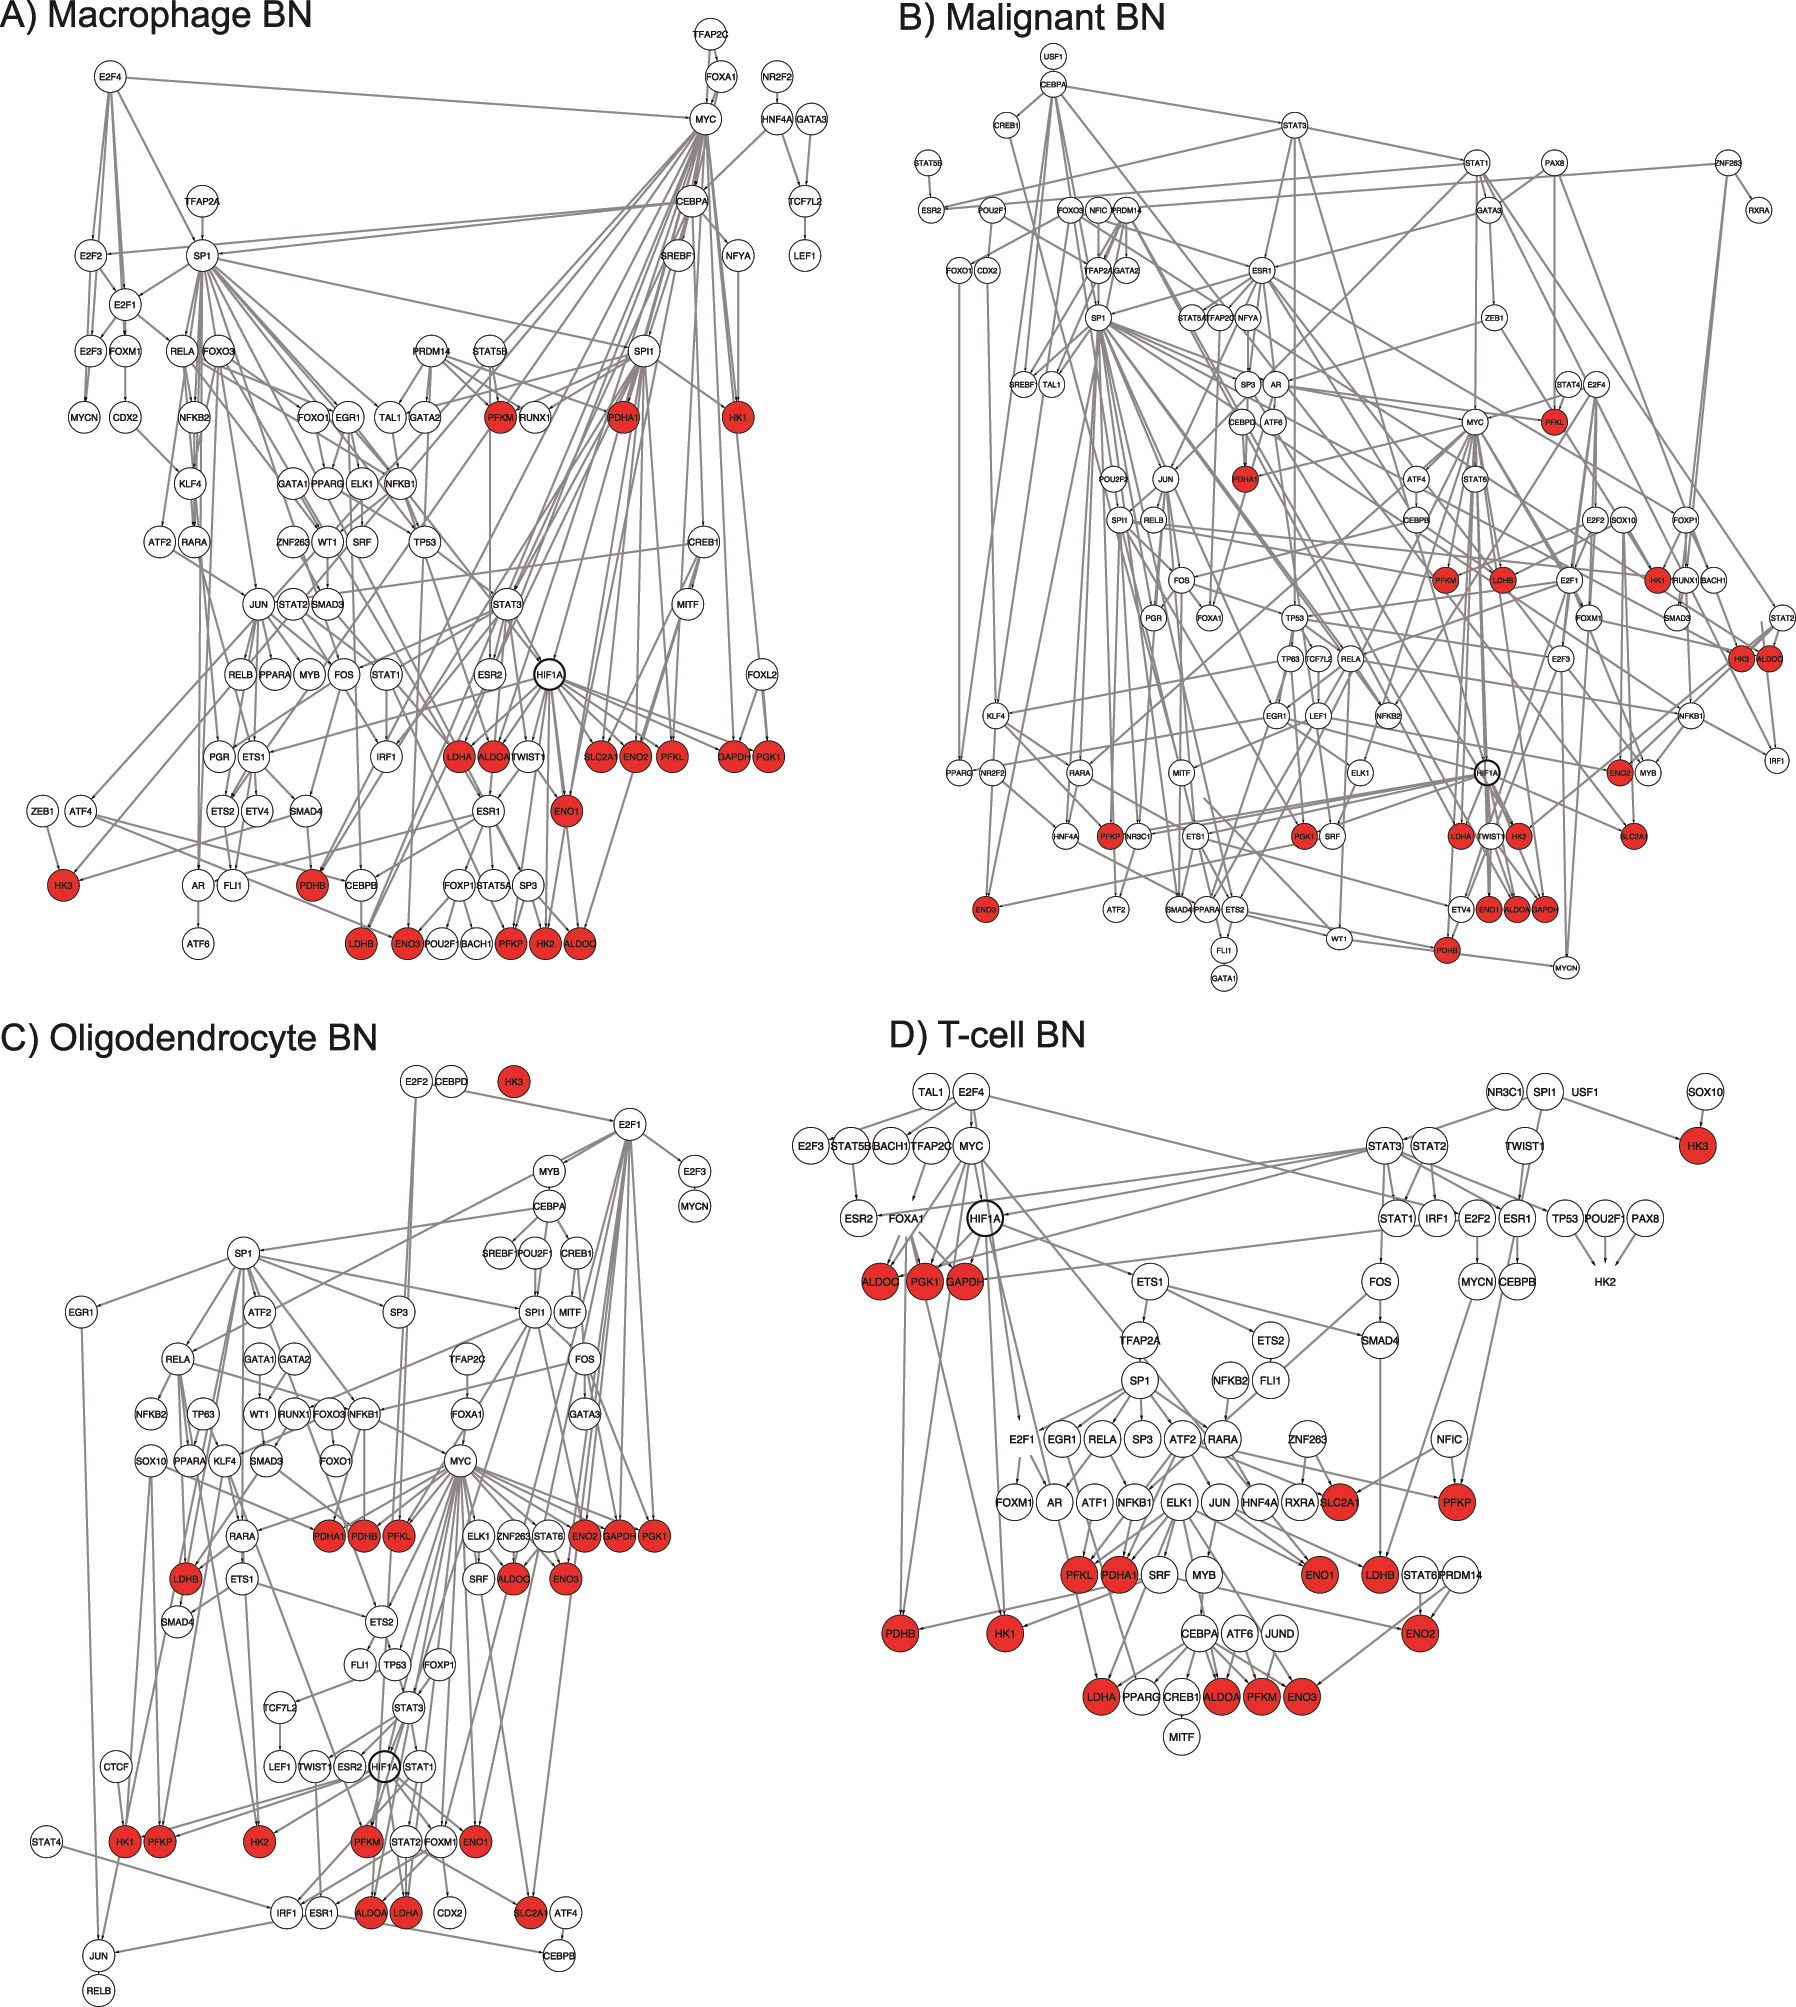
The inferred BNs by cell-type: (A) macrophage, (B) malignant, (C) oligodendrocyte and (D) T-cell. Enzymes in the metabolic model are indicated in red.
Measures between graphs provide additional insights into the similarities between cell-type structures (Figure 3). Notably, since the BNs were learned under the same structural prior, larger networks with more edge density are likely to be more similar in their structure. BNs of malignant cells and macrophages had the most shared edges (N = 98), while sparser networks of oligodendrocytes and T-cells had the least (N = 28) shared edges (Figure 3A). The Jaccard index computes shared edges adjusting for the total edge number of the union of two graphs. Therefore, it provides a normalized measure of similarity between networks (higher is more similar). Jaccard indices showed similar results as shared edges that BNs of malignant cells and macrophages were the most similar (Jaccard index = 0.35), while oligodendrocytes and T-cells were the most dissimilar (Jaccard index = 0.14). In addition, the greatest difference was found between BNs of malignant cells and T-cells with a Jaccard index of 0.15 (Figure 3B). Graph edit distance (GED) which measures the number of changes (i.e., adding, removing, substituting nodes and edges) to transfer one graph to the other one, was also utilized to capture the similarity between networks (lower is more similar). Malignant cells and T-cells were the most different, with the largest GED of 229, while oligodendrocytes and T-cells were more similar, with the least GED of 177 (Figure 3C). Finally, closeness centrality distance (lower is more similar) captures the difference between two networks with respect to a given node centrality, thereby accounting for the local structures around different nodes in the networks. In gene regulatory networks, a gene with high centrality is often viewed as a hub with important biological importance. Overall, we found that malignant cells are the most different from the others, with the highest closeness centrality distances from other cell types (Figure 3D), indicating the mutated transcriptional dysregulation in malignant cells.
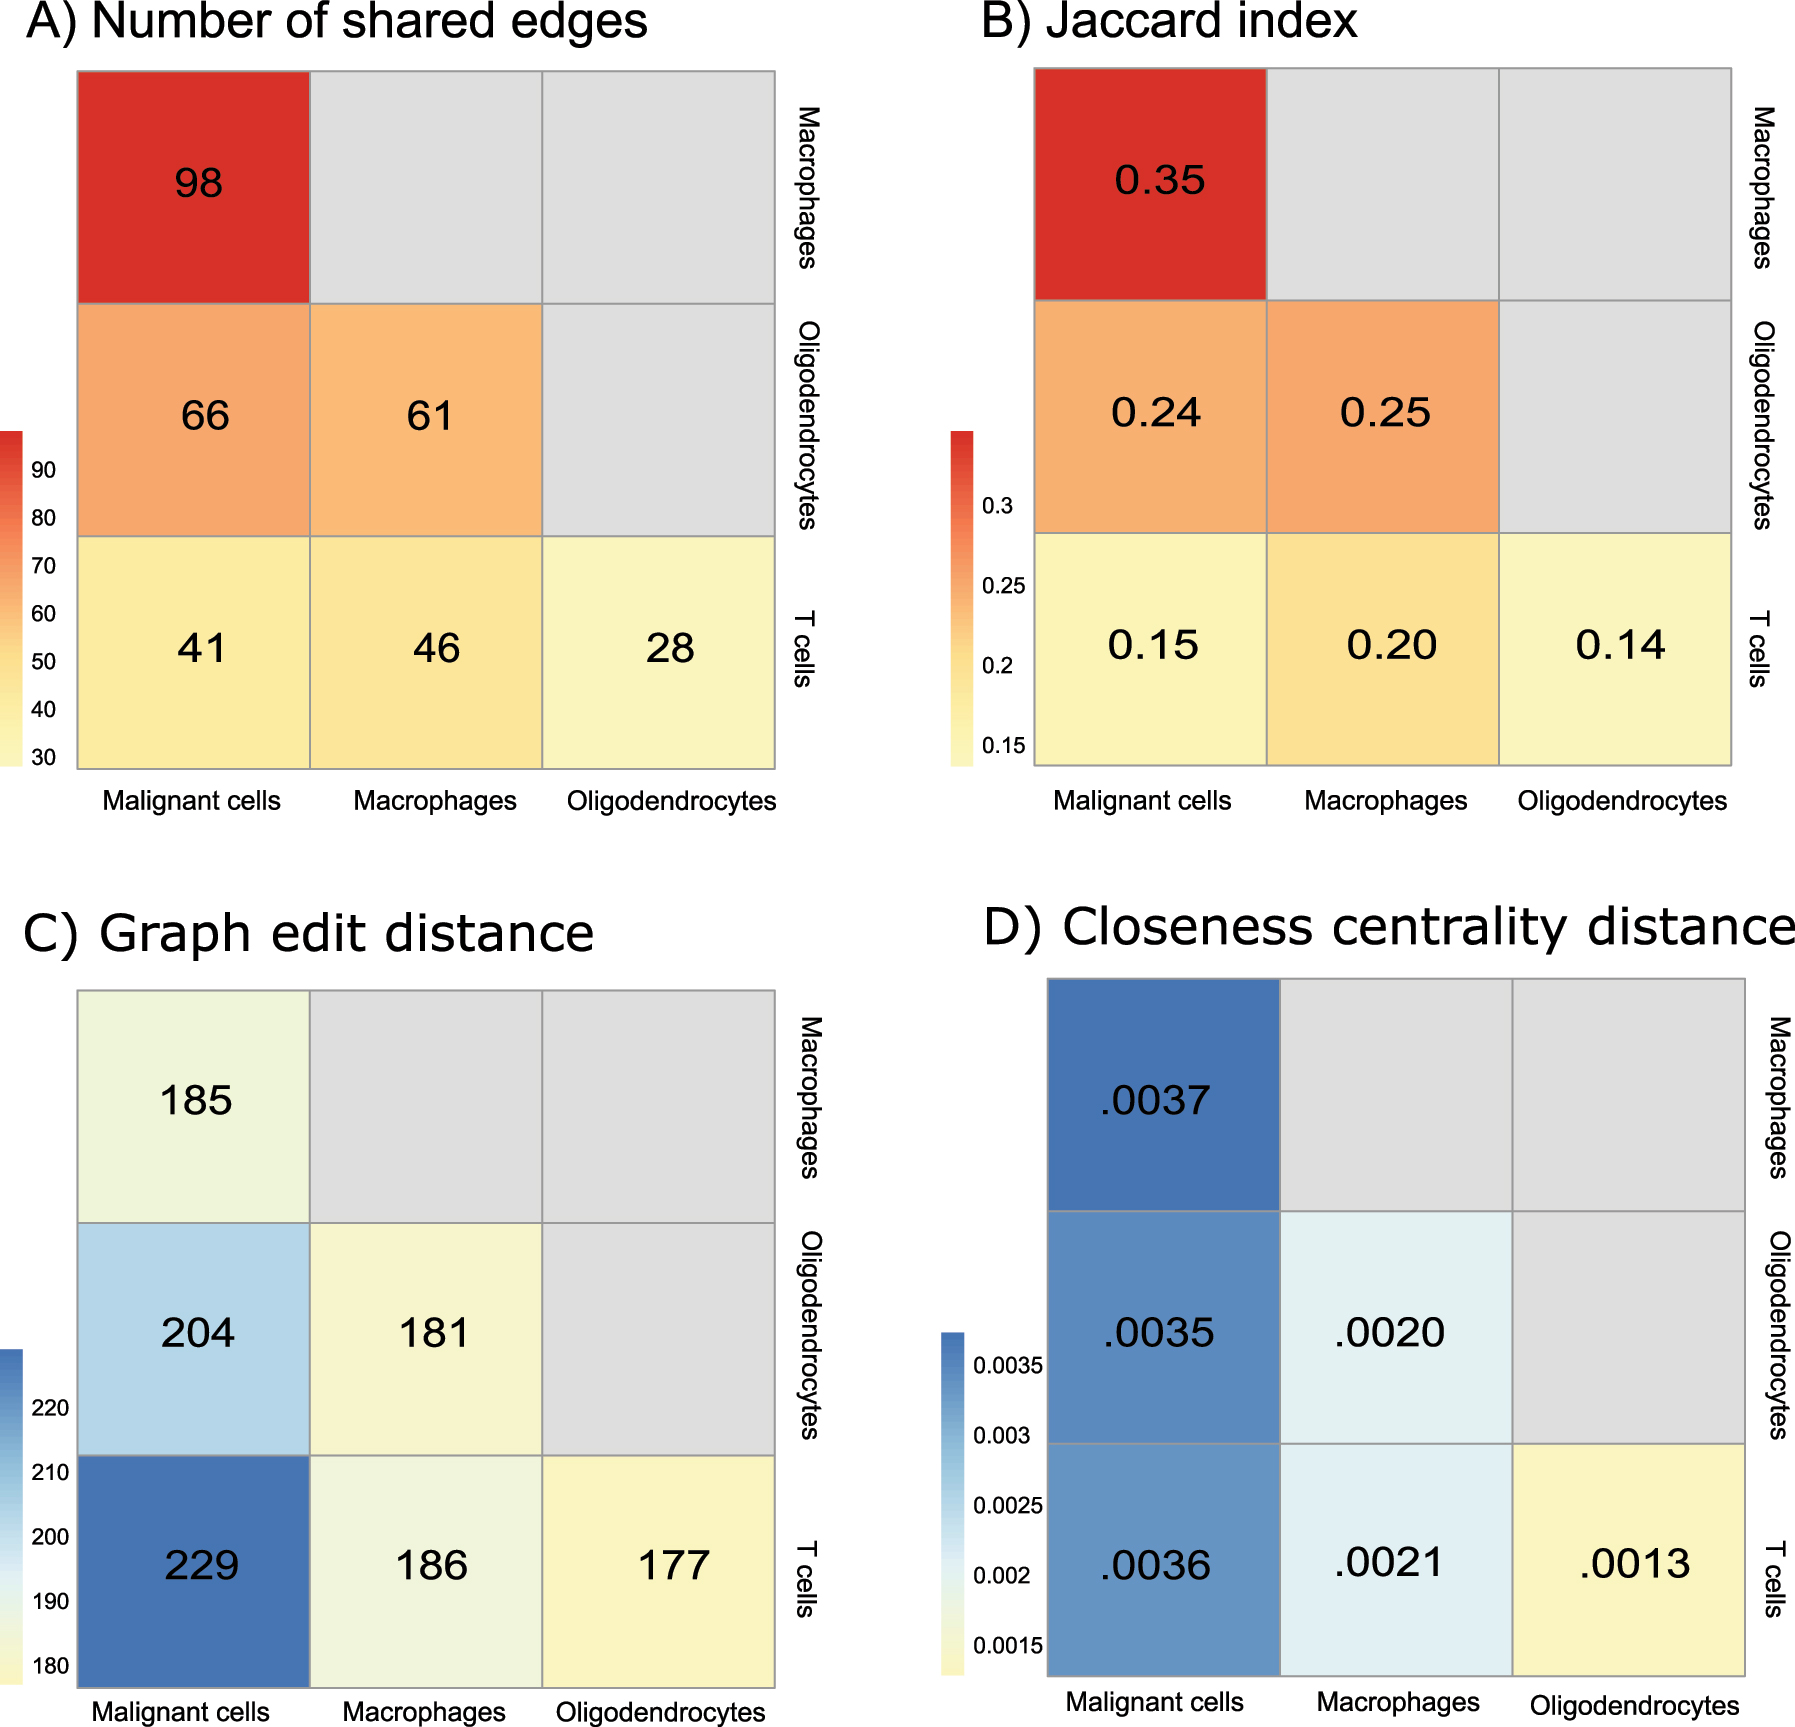
Heatmaps of similarity and dissimilarity measurements between four inferred cell-specific BNs: (A) number of shared edges (higher is more similar), (B) Jaccard index (higher is more similar), (C) graph edit distance (lower is more similar) and (D) closeness centrality distance (lower is more similar). Similarity and dissimilarity measurements are indicated in red and blue, respectively.
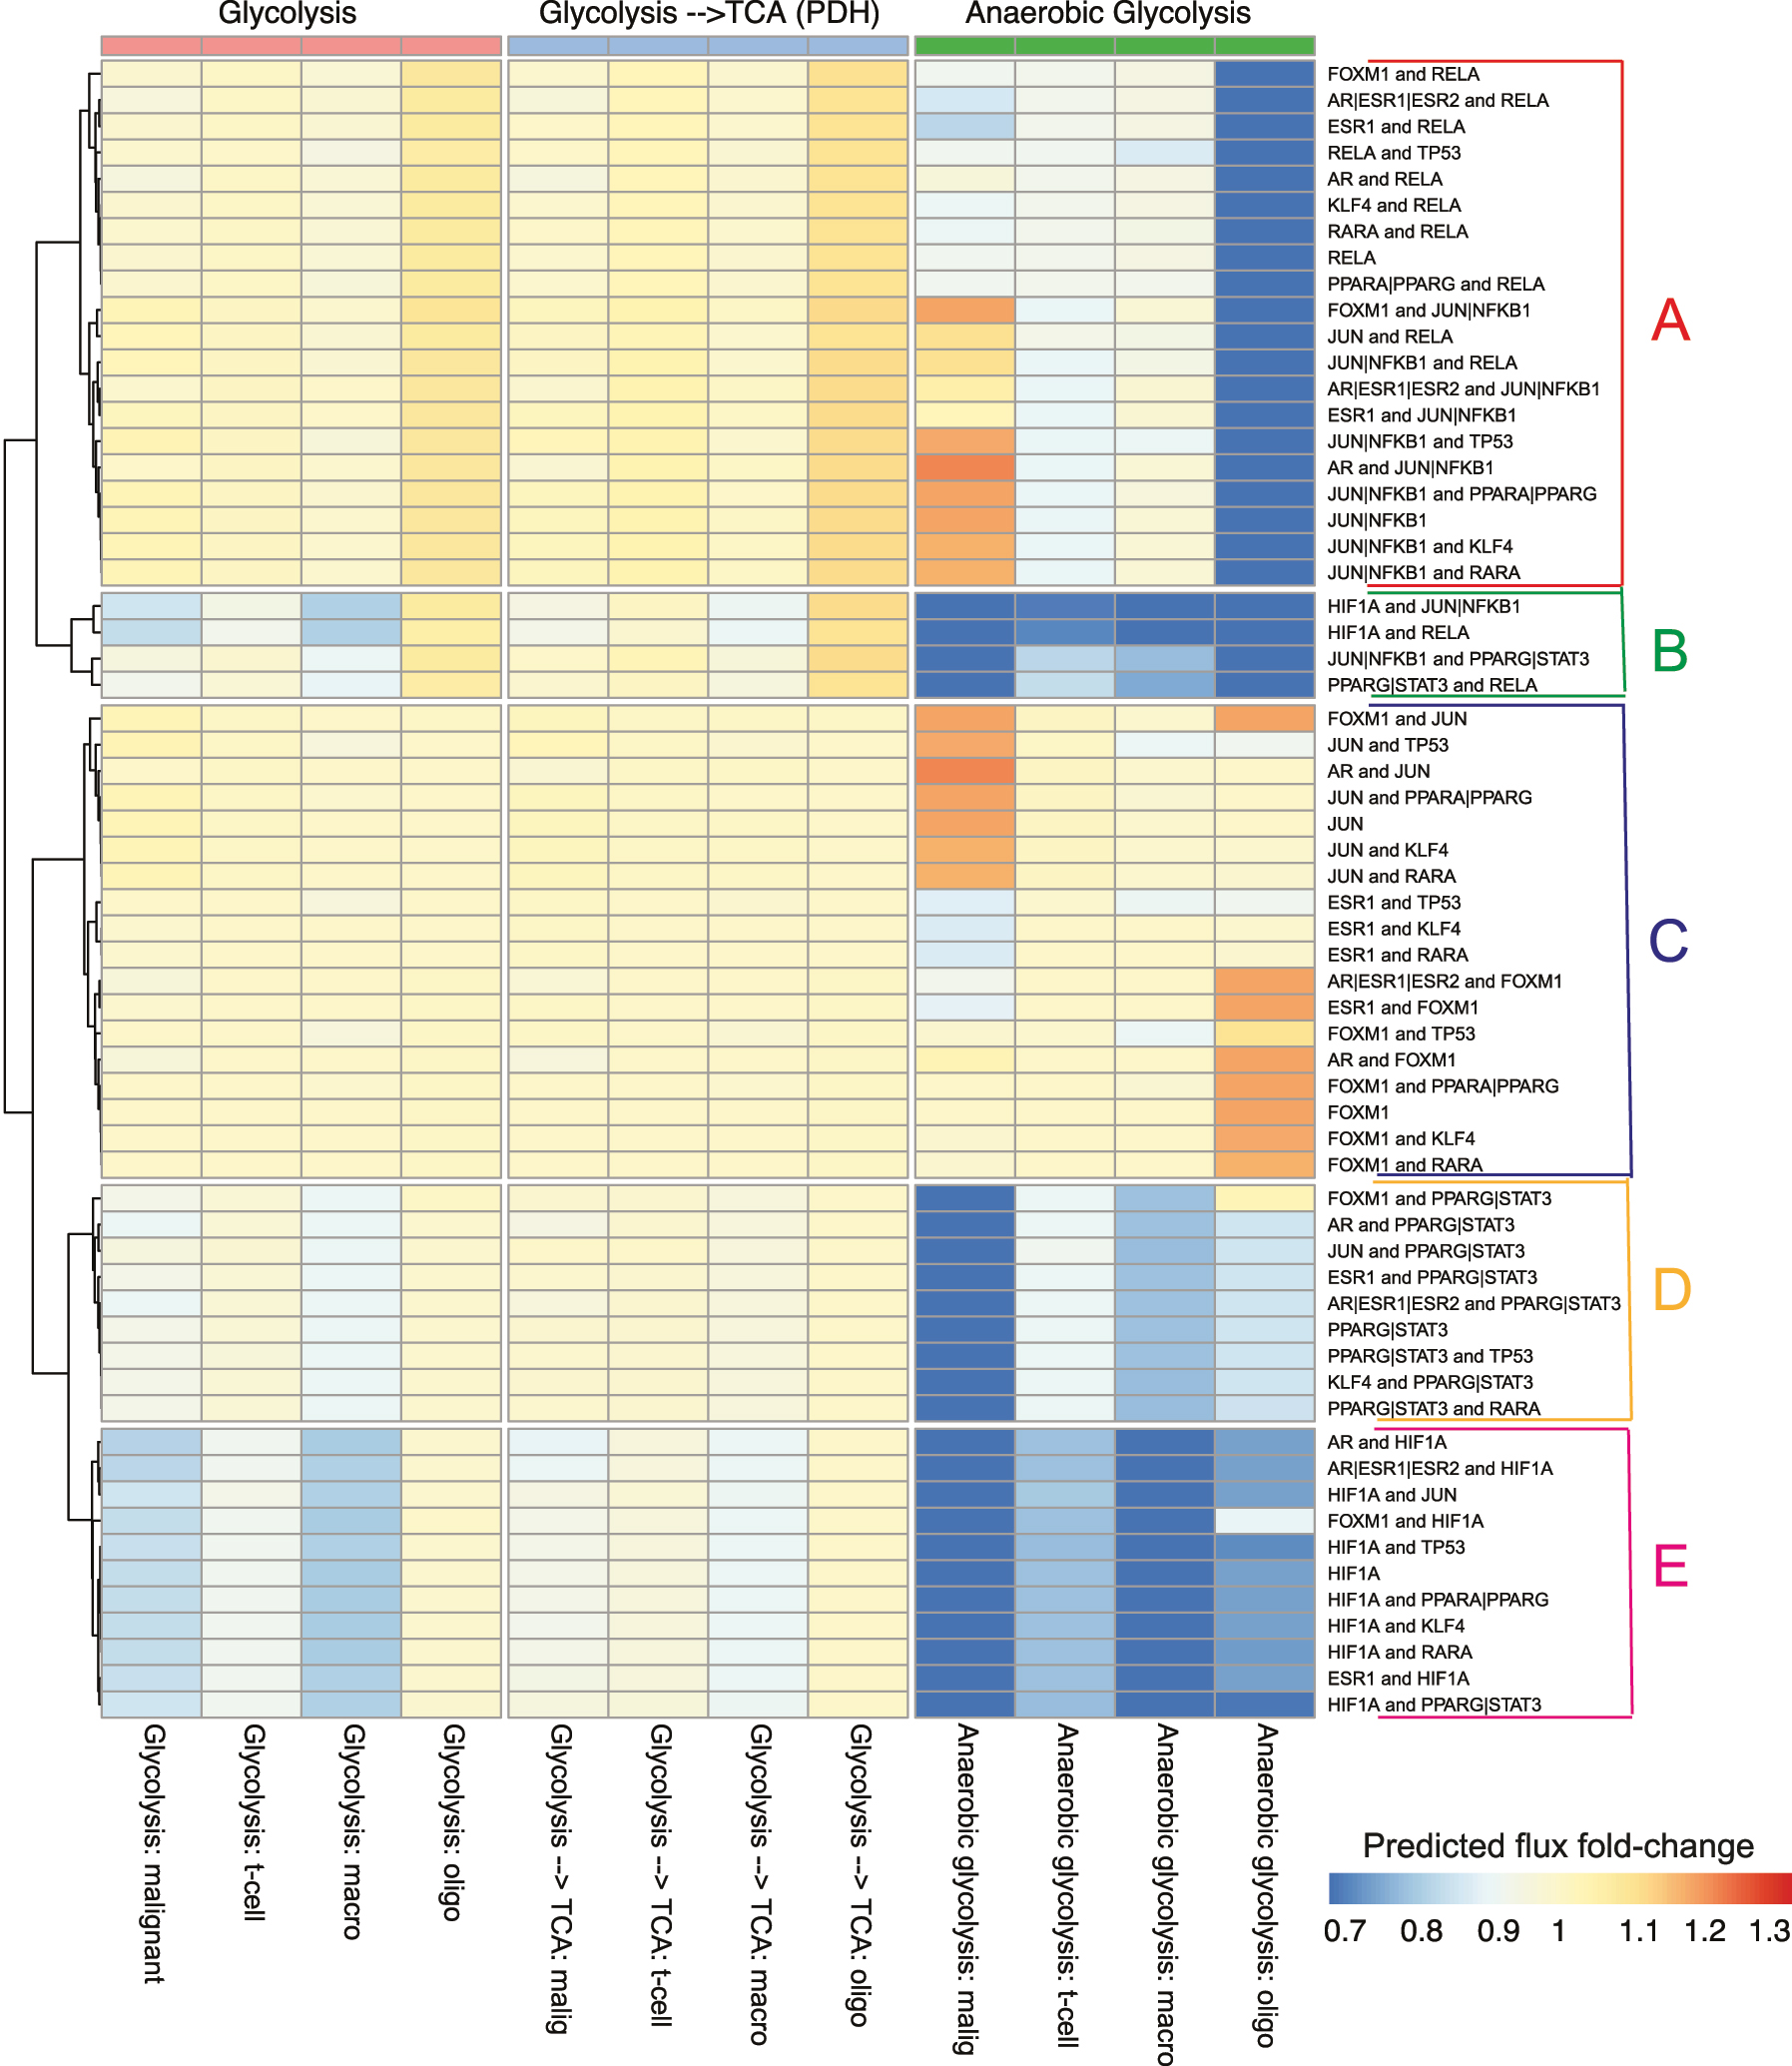
Systematic perturbations were made to the integrated model in order to explore the system-wide effects of interventions that target TFs on the regulatory network and downstream metabolism. In this study, the primary focus is the enzymes and flux rates from three pathways: glycolysis, anaerobic glycolysis, and pyruvate dehydrogenase (PDH). Since each network is uniquely parameterized by scRNA-seq data, we observed unique belief propagation results, despite structural similarities. Patterns of the predicted changes of downstream enzymes (Figure 4) and fluxes (Figure 5) were visualized after TF perturbations. For visualization purposes, the set of perturbations was selected based on the magnitude and diversity of fold changes. The full set of 247 perturbations from target TFs, and combinations of target TFs from 177 drugs can be found in Supplementary (S-Table 1, S-Figure 1 and S-Figure 2).
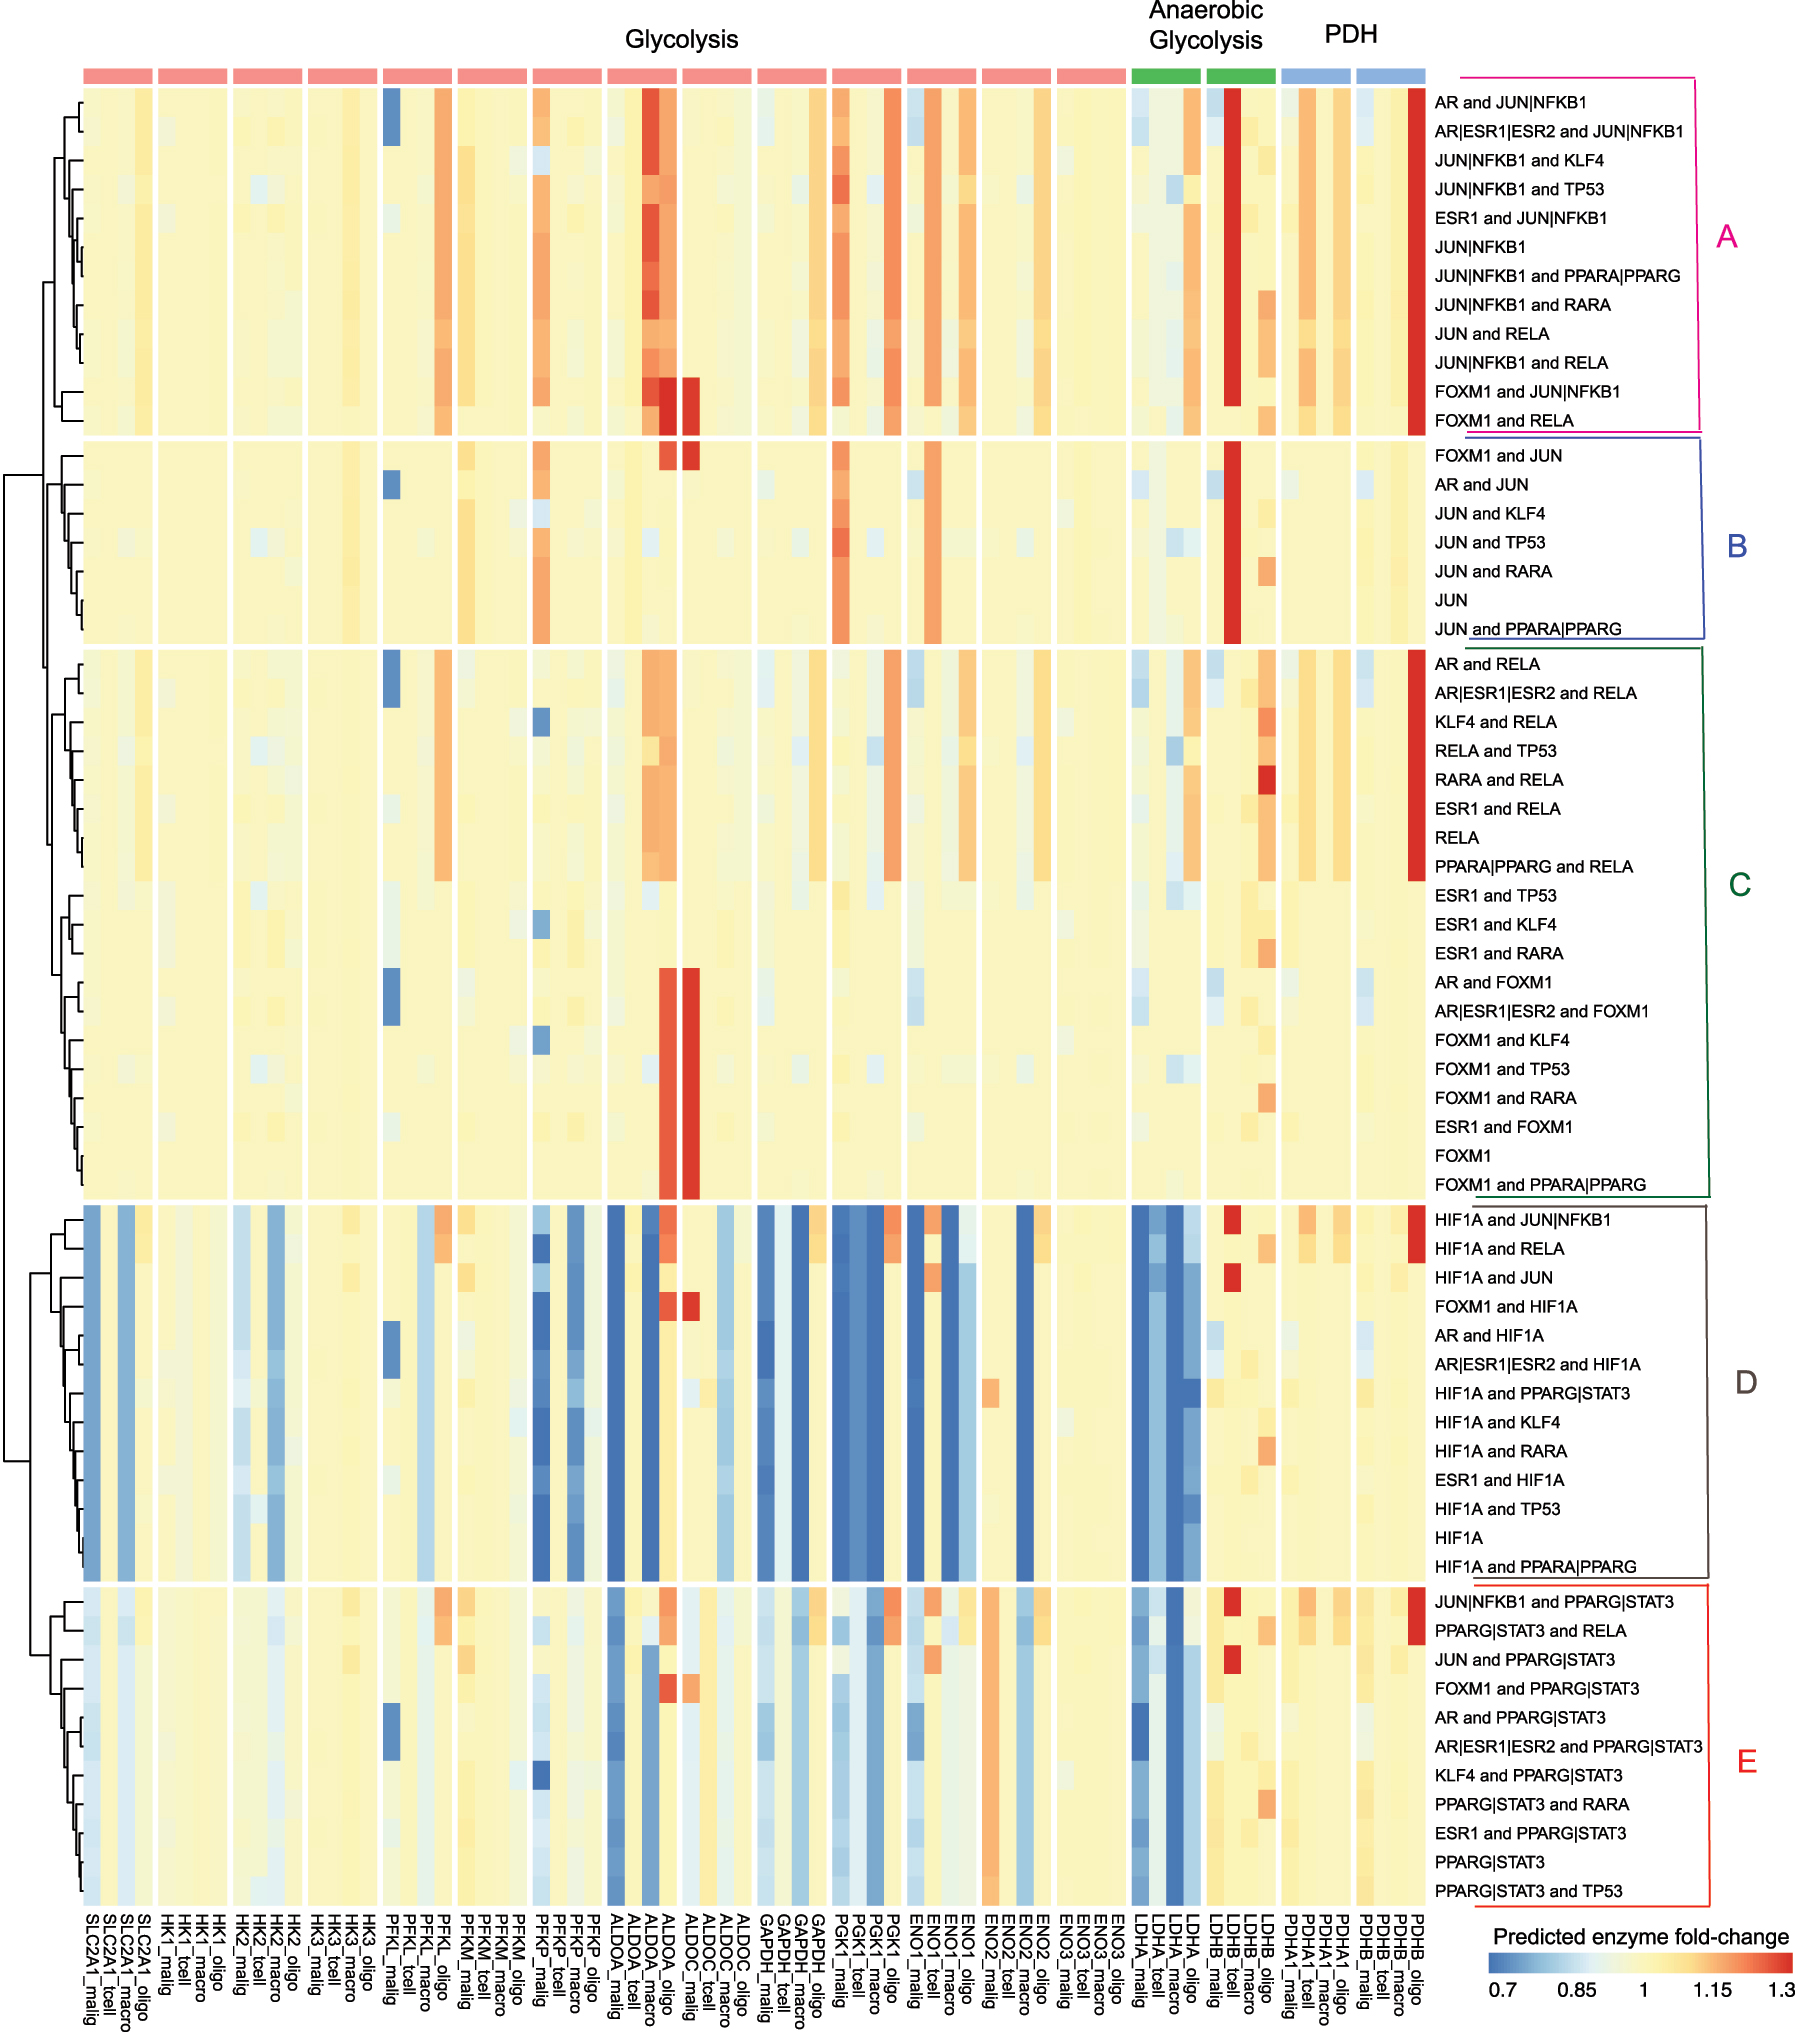
Clustering of the predicted fold changes in enzymes when transcription factors and combinations of transcription factors in the network are targeted (rows). There were five distinct clusters observed (A–E). The fold changes are systematically displayed for the enzymes for the malignant, T-cell, macrophage and oligodendrocyte (columns). This ordering is preserved across the different pathways: glycolysis, anaerobic glycolysis and the flux from the glycolytic pathways to the TCA cycle (pyruvate dehydrogenase).
Clustering of the predicted relative changes in fluxes when transcription factors and combinations of transcription factors in the network are targeted (rows). There were five distinct clusters observed (A–E). The flux changes were aggregated and are systematically displayed for the malignant, T-cell, macrophage and oligodendrocyte (columns). This ordering is preserved across the different pathways: glycolysis, anaerobic glycolysis and the flux from the glycolytic pathways to the TCA cycle (pyruvate dehydrogenase).
Large variations were observed that indicate a strong differential effect across both TFs and cell types (Figure 4). Clustering the differential effects of the predicted enzyme expression after TF target inhibition revealed five distinct groups (Figure 4A–E). Inhibition of TFs promoting the response to hypoxia is expected to divert the flux from lactate production to oxidative phosphorylation, which is consistent with our findings. However, the ways that different cells achieving were observed to be markedly different. Patterns of inhibition were observed for combinations of NFKB1 with other TFs (Figure 4A). Enzymes from all three reaction groups: glycolysis, anaerobic glycolysis and PDH increased in macrophages, T-cells, and were most pronounced in oligodendrocytes. On the other hand, malignant cells exhibited modest reductions in desired anaerobic glycolysis and PDH with combination therapies of SP-100030 (JUN and NFKB1 inhibitor) and drugs that target on AR (e.g. Enzalutamide, DHEA sulfate, Epitiostanol, Bicalutamide, etc.).
Drugs in cluster B (Figure 4B) mainly targeted on JUN together with other TFs. Notably, oligodendrocytes were not sensitive to JUN inhibition, while glycolysis enzymes such as PFKP and PGK1 were upregulated only in malignant cells. Cluster C (Figure 4C) showed that inhibition of RELA with other TFs leads to significant upregulation in LDHA and PDHB in only oligodendrocytes. Moreover, targeting ESR1 with other TFs (TP53, KLF4 or RARA) caused enzymes decrease only in malignant cells, while not much effect on the other cells. Cluster D (Figure 4D) includes the drug combinations that target on HIF1A (e.g. Acriflavine, Bakuchiol, etc.) with other TFs. Under these drug interventions, enzymes in glycolysis and anaerobic glycolysis showed major decreases in malignant and macrophage cells, while T-cells and oligodendrocytes were not as sensitive. Inhibition of STAT3 (e.g. Niclosamide, Meisoindigo, Napabucasin, etc.) with other TFs were clustered as group E (Figure 4E), and showed similar but weaker effect patterns as inhibitions of HIF1A (Figure 4D).
Relative flux rate changes under combined drug interventions also showed distinct patterns (Figure 5). For simplicity, the predicted flux changes within glycolysis, anaerobic glycolysis and PDH were averaged within cell-type and the effects of perturbations. Clustering analysis yielded five distinct groups (Figure 5A–E), which is consistent with predicted enzyme fold changes (Figure 4). Cluster A corresponds to drugs targeting RELA or NFKB1 with other TFs (Figure 5A) that caused an increase in the glycolysis and PDH reactions, and a decrease in anaerobic glycolysis only in oligodendrocytes cells, while other cells were not found to be as sensitive. Cluster B showed that inhibition of targets combinations that led to anaerobic glycolysis decrease in all four cell types (Figure 4B). Patterns of inhibition of ESR1 with select TFs (FOXM1, RARA, KLF4, TP53) are shown in Cluster C (Figure 5C), which only down-regulated anaerobic glycolysis in malignant cells, but not in other cell types. STAT3 inhibition in combination with other TFs (Figure 5D) formed cluster D, which shows decreases in anaerobic glycolysis in malignant cells, and much more slightly in the other three cell types. Under inhibition of HIF1A with other TFs in cluster E (Figure 5E), reactions across all pathways were also down regulated in both malignant and macrophage cells, and anaerobic glycolysis was decreased across all cell types. The sensitivity analysis affirmed the consistency of these findings (S-Figure 3). Particularly, STAT3 inhibition alongside other TFs results in decreased anaerobic glycolysis in malignant cells, and slightly less so in the other three cell types. This robust pattern validates the effectiveness of our proposed integrated model.
Taken together, the most promising targets arise from drug combinations inhibiting STAT3 with other TFs due to the strong effects on the malignant cells, and minimal effects on other cell types. To further investigate the targets, we selected a promising drug combination from STAT3 cluster (Figures 4E and 5D) that corresponds to the combined drug intervention of Enzalutamide (targets AR) and Niclosamide (targets STAT3). Figure 6 visualizes the estimated relative flux rate change of the four cell types under this combined intervention. Relative change of 0 means no change, and negative relative change indicates down-regulation. Results showed that the drug intervention has almost no effects on the PDH reactions, and it only slightly restrained glycolysis in macrophages and malignant cells with relative flux changes of −0.15 and −0.14, respectively. However, this combined treatment strongly suppressed anaerobic reaction in malignant cells with a relative change of −0.92, while the down-regulation effects for other cell types were much milder, with flux fold change ranging from −0.14 to −0.34. Taken together, these results suggest that Enzalutamide and Niclosamide drug combinations may be a potential treatment that is specific in suppressing anaerobic metabolism in malignant cells, without major interference to other cell types.
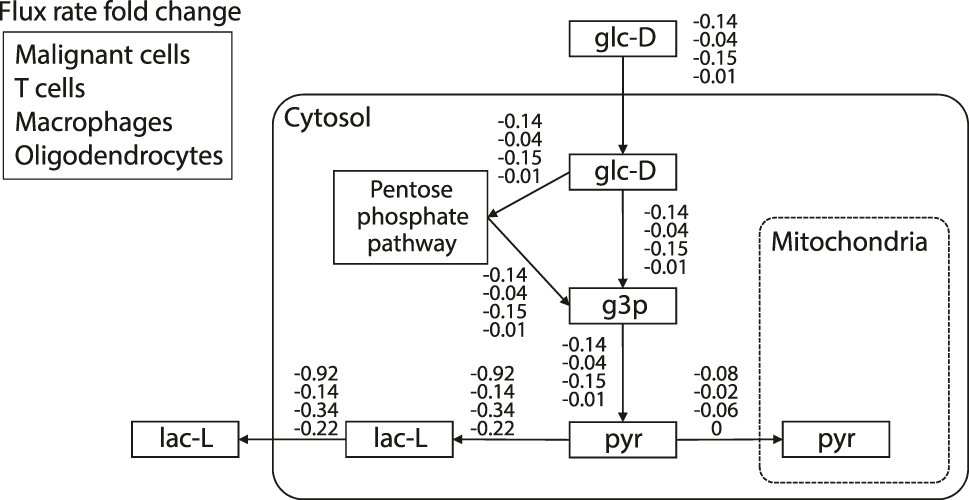
The inferred relative flux changes for each of the four cell-types after inhibition of Enzalutamide (targets AR) and Niclosamide (targets STAT3).
Our finding that the STAT3 inhibitors have specific effects on glioblastoma cells is consistent with the public drug sensitivity data and literature. The primary PRISM repurposing dataset (Corsello et al. 2020) obtained from the cancer dependency map in the DepMap portal (Ghandi et al. 2019) shows that most glioblastoma cell lines are sensitive to the STAT3 inhibitors (S-Figure 4). Recent literature also found that napabucasin, a STAT3 inhibitor, can suppress the proliferation and invasion of glioblastoma cells (Han et al. 2019). On the other hand, hyperactivation of STAT3 in tumor-infiltrating immune cells causes immunosuppression by inhibiting both innate and adaptive immune responses (Zou et al. 2020).
4 Discussion
This work develops a novel approach for integrating cell-specific gene networks into constraint-based models of metabolism. To the authors’ knowledge, this represents the first approach to integrating genetic cell-specific networks based on single-cell transcriptomics data into constraint-based models of metabolism. This integration represents a more physiological system and allows us to characterize the distinct metabolic profiles within the tumor microenvironment under different perturbations. In the context of cancer, these perturbations can be viewed as potential single drug targets or combination therapies. Although this work focused on cancer, the general framework can be adopted in other applications, such as different cell types, model organisms, and diseases.
A strength of this work is the flexible BN representation of signaling networks to estimate the system-wide impacts of perturbations. There are several advantages to using BNs in this context. For structural learning, prior information about regulatory associations can be used to constrain the learning of the graph structure. Probabilistic reasoning utilized exact inferences that are only possible because of the directed acyclic nature of the graphs (Lauritzen 1996). Although the directed nature of the graphs is a strong assumption, BN structures have been shown to mimic biological mechanisms and capture feedback (Blair et al. 2012). Moreover, exact reasoning is not possible for undirected networks.
On the other hand, a unique challenge for BN learning and inference is the zero inflation of the scRNA-seq data (Cao et al. 2021; Luecken and Theis 2019), which violates the Gaussian distribution assumptions for the parameterization of CGBNs. The zero-inflation issue poses a universal challenge to basic analytics performed with scRNA-seq and has been shown to have biological relevance (Choi et al. 2020). In this work, we proposed a hybrid imputation method leveraging enzyme expression level and TF activities that overcome the issues related to inference with zero-inflated data. We applied MAGIC algorithm (Van Dijk et al. 2018) to impute and smooth the enzyme expression levels and VIPER technique (Alvarez et al. 2016) to infer the TF activities based on the TF transcript abundance. There are two benefits in using inferred TF activities. First, the TF protein activity is a more direct predictor for enzyme levels than the TF transcript abundance. Second, the distribution of TF activities can be better modeled by Gaussian distributions. A future direction will be directly utilizing the zero-inflated data, which would require alternative parametric and modifications for the inference.
The integrated computational model was used to explore a perturbation space of TFs. Pyruvate dehydrogenase (PDH) is a gatekeeper enzyme between glycolysis and the TCA cycle. The modulation of PDH expression has been actively investigated as a target for controlling cancer growth (Sradhanjali and Reddy 2018). In order to prioritize our findings, we sought to identify target perturbations that inhibit PDH in malignant cells and minimize the dysregulation of the metabolism of other cells in the tumor microenvironment. Some of these promising findings link to drugs in current use.
The androgen receptor (AR) is a steroid hormone activated TF that is targeted by Enzalutamide. In normal tissues, androgen effects are mediated by AR through hormone-receptor binding in both males and females. Androgen-independent AR activation is a common finding in castration-resistant prostate cancers. Enzalutamide has been used primarily for prostate cancer (Beer et al. 2014; Tran et al. 2009). AR has also been considered as a potential target for glioblastoma (Yu et al. 2015; Zalcman et al. 2018), the most common form of brain cancer. The incidence of glioblastoma is 1.6 times higher in men than women (Carrano et al. 2021), and the upregulation of AR has been implicated in promoting tumorigenesis (Yu et al. 2015). Despite these associations, there has only been a recent study that confirms the therapeutic role of targeting AR in glioblastoma in vitro and in vivo using Enzalutamide in mouse models (Zhao et al. 2021).
STAT3 is central in regulating the anti-tumor immune response and plays essential roles in inhibiting the expression of crucial immune activation regulators and promoting the production of immunosuppressive factors (Zou et al. 2020). Niclosamide was the only launched STAT3 targeting drug in our drug list and is known to have broad clinical applications for the treatment of various cancers (Chen et al. 2018). A study showed that Niclosamide synergistically reversed Enzalutamide resistance in prostate cancer cells. Combined treatment with Niclosamide plus Enzalutamide resulted in inhibition of colony formation and growth arrest by inducing cell apoptosis (Liu et al. 2015). Multiple studies investigated the effect of Niclosamide in combination therapy. For example, Niclosamide with other drugs like terpyridine or cisplatin achieved significant treatment effects in breast cancer (Karakas et al. 2015; Liu et al. 2016a). Niclosamide combined with erlotinib was shown to be effective in treating head and neck cancer (Li et al. 2013a) and lung cancer (Li et al. 2013b).
This approach also has limitations. In the modeling, the scope of the metabolic model is limited to a simple representation of central carbon metabolism. This work represents a tractable proof of concept. Genome-scale metabolic models have been developed and made available (Schellenberger et al. 2010). A future direction of this work will be to expand upon the integrated modeling framework to ensure scalability. Flux balance analysis also requires an objective function, which in our applications was to maximize ATP production for basal flux estimation in oligodendrocytes, reflecting the high energy demands of brain metabolism. Setting an objective function is more straightforward in single-cell systems where the objective is growth. In human cells, a single objective is unrealistic. Importantly, when simulating the effect of drug perturbations, the current approach does not consider potential off-target effects. Drug actions can often influence other targets beyond the intended ones, which can cause unanticipated changes in cellular functions. Model validation is challenging in integrated systems. These potential limitation should be kept in mind when interpreting our findings and could be an additional aspect to consider in future model refinements.
In conclusion, we have developed a flexible framework for integrating cell-specific BNs of signaling pathways into metabolic models using scRNA-seq data. This generalizable approach leverages BN inference to make predictions about the system under perturbations, and flux estimation to explore the effects of perturbations on the metabolic system. Metabolic models and gene regulatory networks have both been widely studied, but in parallel. Biologically, their integration is well understood, but mathematically connecting these models has been a longstanding challenge. Network integration is a promising approach for bridging these domains into a computational model that can be used to make predictions and gain novel insights about disease.
Funding source: Division of Mathematical Sciences
Award Identifier / Grant number: 1312250
Funding source: NIH Cancer Moonshot
Award Identifier / Grant number: U24CA232979-01
Acknowledgments
Not applicable.
-
Research ethics: TS, HY and RB concieved and designed the analysis. TS performed the analysis. TS, HY and RB wrote the paper.
-
Author contributions: TS, HY and RB concieved and designed the analysis. TS performed the analysis. TS, HY and RB wrote the paper.
-
Competing interests: The authors have no known competing financial interests or personal relationships that could have appeared to influence the work reported in this paper.
-
Research funding: HY was supported by NIH Cancer Moonshot grant U24CA232979-01. RB was supported by NSF DMS 1312250.
-
Data availability: Not applicable.
References
Ackers-Johnson, M., Tan, W.L.W., and Foo, R.S.-Y. (2018). Following hearts, one cell at a time: recent applications of single-cell rna sequencing to the understanding of heart disease. Nat. Commun. 9: 1–4, https://doi.org/10.1038/s41467-018-06894-8.Suche in Google Scholar PubMed PubMed Central
Agren, R., Mardinoglu, A., Asplund, A., Kampf, C., Uhlen, M., and Nielsen, J. (2014). Identification of anticancer drugs for hepatocellular carcinoma through personalized genome-scale metabolic modeling. Mol. Syst. Biol. 10: 721, https://doi.org/10.1002/msb.145122.Suche in Google Scholar PubMed PubMed Central
Alvarez, M.J., Shen, Y., Giorgi, F.M., Lachmann, A., Ding, B.B., Ye, B.H., and Califano, A. (2016). Functional characterization of somatic mutations in cancer using network-based inference of protein activity. Nat. Genet. 48: 838–847, https://doi.org/10.1038/ng.3593.Suche in Google Scholar PubMed PubMed Central
Andrews, T.S. and Hemberg, M. (2018). False signals induced by single-cell imputation. F1000 Res. 7: 1740, https://doi.org/10.12688/f1000research.16613.1.Suche in Google Scholar
Angione, C. (2019). Human systems biology and metabolic modelling: a review—from disease metabolism to precision medicine. Biomed. Res. Int. 2019: 8304260, https://doi.org/10.1155/2019/8304260.Suche in Google Scholar PubMed PubMed Central
Arneth, B. (2020). Tumor microenvironment. Medicina 56: 15, https://doi.org/10.3390/medicina56010015.Suche in Google Scholar PubMed PubMed Central
Ashburner, M., Ball, C.A., Blake, J.A., Botstein, D., Butler, H., Cherry, J.M., Davis, A.P., Dolinski, K., Dwight, S.S., Eppig, J.T., et al.. (2000). Gene ontology: tool for the unification of biology. Nat. Genet. 25: 25–29, https://doi.org/10.1038/75556.Suche in Google Scholar PubMed PubMed Central
Balkwill, F.R., Capasso, M., and Hagemann, T. (2012). The tumor microenvironment at a glance. J. Cell Sci. 125: 5591–5596, https://doi.org/10.1242/jcs.116392.Suche in Google Scholar PubMed
Bansal, M., Belcastro, V., Ambesi-Impiombato, A., and Di Bernardo, D. (2007). How to infer gene networks from expression profiles. Mol. Syst. Biol. 3: 78, https://doi.org/10.1038/msb4100158.Suche in Google Scholar
Beer, T.M., Armstrong, A.J., Rathkopf, D.E., Loriot, Y., Sternberg, C.N., Higano, C.S., Iversen, P., Bhattacharya, S., Carles, J., Chowdhury, S., et al.. (2014). Enzalutamide in metastatic prostate cancer before chemotherapy. N. Engl. J. Med. 371: 424–433, https://doi.org/10.1056/nejmoa1405095.Suche in Google Scholar
Benfey, P.N. and Mitchell-Olds, T. (2008). From genotype to phenotype: systems biology meets natural variation. Science 320: 495–497, https://doi.org/10.1126/science.1153716.Suche in Google Scholar PubMed PubMed Central
Binnewies, M., Roberts, E.W., Kersten, K., Chan, V., Fearon, D.F., Merad, M., Coussens, L.M., Gabrilovich, D.I., Ostrand-Rosenberg, S., Hedrick, C.C., et al.. (2018). Understanding the tumor immune microenvironment (time) for effective therapy. Nat. Med. 24: 541–550, https://doi.org/10.1038/s41591-018-0014-x.Suche in Google Scholar PubMed PubMed Central
Blair, R.H., Kliebenstein, D.J., and Churchill, G.A. (2012). What can causal networks tell us about metabolic pathways? PLoS Comput. Biol. 8: e1002458, https://doi.org/10.1371/journal.pcbi.1002458.Suche in Google Scholar PubMed PubMed Central
Bordel, S. (2018). Constraint based modeling of metabolism allows finding metabolic cancer hallmarks and identifying personalized therapeutic windows. Oncotarget 9: 19716–19729, https://doi.org/10.18632/oncotarget.24805.Suche in Google Scholar PubMed PubMed Central
Brazhnik, P., de la Fuente, A., and Mendes, P. (2002). Gene networks: how to put the function in genomics. Trends Biotechnol. 20: 467–472, https://doi.org/10.1016/s0167-7799(02)02053-x.Suche in Google Scholar PubMed
Cao, Y., Kitanovski, S., Küppers, R., and Hoffmann, D. (2021). Umi or not umi, that is the question for scrna-seq zero-inflation. Nat. Biotechnol. 39: 158–159, https://doi.org/10.1038/s41587-020-00810-6.Suche in Google Scholar PubMed
Carrano, A., Juarez, J.J., Incontri, D., Ibarra, A., and Guerrero Cazares, H. (2021). Sex-specific differences in glioblastoma. Cells 10: 1783, https://doi.org/10.3390/cells10071783.Suche in Google Scholar PubMed PubMed Central
Chandrasekaran, S. and Price, N.D. (2010). Probabilistic integrative modeling of genome-scale metabolic and regulatory networks in Escherichia coli and mycobacterium tuberculosis. Proc. Natl. Acad. Sci. U.S.A. 107: 17845–17850, https://doi.org/10.1073/pnas.1005139107.Suche in Google Scholar PubMed PubMed Central
Chen, H., Ye, F., and Guo, G. (2019). Revolutionizing immunology with single-cell rna sequencing. Cell. Mol. Immunol. 16: 242–249, https://doi.org/10.1038/s41423-019-0214-4.Suche in Google Scholar PubMed PubMed Central
Chen, W., Mook, R.A.Jr, Premont, R.T., and Wang, J. (2018). Niclosamide: beyond an antihelminthic drug. Cell. Signal. 41: 89–96, https://doi.org/10.1016/j.cellsig.2017.04.001.Suche in Google Scholar PubMed PubMed Central
Chiavarina, B., Whitaker-Menezes, D., Migneco, G., Martinez-Outschoorn, U.E., Pavlides, S., Howell, A., Tanowitz, H.B., Casimiro, M.C., Wang, C., Pestell, R.G., et al.. (2010). Hif1-alpha functions as a tumor promoter in cancer-associated fibroblasts, and as a tumor suppressor in breast cancer cells: autophagy drives compartment-specific oncogenesis. Cell Cycle 9: 3534–3551, https://doi.org/10.4161/cc.9.17.12908.Suche in Google Scholar PubMed PubMed Central
Chin, L., Andersen, J.N., and Futreal, P.A. (2011). Cancer genomics: from discovery science to personalized medicine. Nat. Med. 17: 297–303, https://doi.org/10.1038/nm.2323.Suche in Google Scholar PubMed
Choi, K., Chen, Y., Skelly, D.A., and Churchill, G.A. (2020). Bayesian model selection reveals biological origins of zero inflation in single-cell transcriptomics. Genome Biol. 21: 1–16, https://doi.org/10.1186/s13059-020-02103-2.Suche in Google Scholar PubMed PubMed Central
Chung, W., Eum, H.H., Lee, H.-O., Lee, K.-M., Lee, H.-B., Kim, K.-T., Ryu, H.S., Kim, S., Lee, J.E., Park, Y.H., et al.. (2017). Single-cell rna-seq enables comprehensive tumour and immune cell profiling in primary breast cancer. Nat. Commun. 8: 1–12, https://doi.org/10.1038/ncomms15081.Suche in Google Scholar PubMed PubMed Central
Corsello, S.M., Bittker, J.A., Liu, Z., Gould, J., McCarren, P., Hirschman, J.E., Johnston, S.E., Vrcic, A., Wong, B., Khan, M., et al.. (2017). The drug repurposing hub: a next-generation drug library and information resource. Nat. Med. 23: 405–408, https://doi.org/10.1038/nm.4306.Suche in Google Scholar PubMed PubMed Central
Corsello, S.M., Nagari, R.T., Spangler, R.D., Rossen, J., Kocak, M., Bryan, J.G., Humeidi, R., Peck, D., Wu, X., Tang, A.A., et al.. (2020). Discovering the anti-cancer potential of non-oncology drugs by systematic viability profiling. Nat. Cancer. 1: 235–248, 730119, https://doi.org/10.1038/s43018-019-0018-6.Suche in Google Scholar PubMed PubMed Central
Covert, M.W. and Palsson, B.Ø. (2002). Transcriptional regulation in constraints-based metabolic models of Escherichia coli* 210. J. Biol. Chem. 277: 28058–28064, https://doi.org/10.1074/jbc.m201691200.Suche in Google Scholar PubMed
Covert, M.W., Xiao, N., Chen, T.J., and Karr, J.R. (2008). Integrating metabolic, transcriptional regulatory and signal transduction models in Escherichia coli. Bioinformatics 24: 2044–2050, https://doi.org/10.1093/bioinformatics/btn352.Suche in Google Scholar PubMed PubMed Central
Cowell, R.G. (2005). Local propagation in conditional Gaussian Bayesian networks. J. Mach. Learn. Res. 6: 1517–1550.Suche in Google Scholar
Damiani, C., Di Filippo, M., Pescini, D., Maspero, D., Colombo, R., and Mauri, G. (2017). popfba: tackling intratumour heterogeneity with flux balance analysis. Bioinformatics 33: i311–i318, https://doi.org/10.1093/bioinformatics/btx251.Suche in Google Scholar PubMed PubMed Central
Damiani, C., Maspero, D., Di Filippo, M., Colombo, R., Pescini, D., Graudenzi, A., Westerhoff, H.V., Alberghina, L., Vanoni, M., and Mauri, G. (2019). Integration of single-cell rna-seq data into population models to characterize cancer metabolism. PLoS Comput. Biol. 15: e1006733, https://doi.org/10.1371/journal.pcbi.1006733.Suche in Google Scholar PubMed PubMed Central
DeBerardinis, R.J. (2020). Tumor microenvironment, metabolism, and immunotherapy. N. Engl. J. Med. 382: 869–871, https://doi.org/10.1056/nejmcibr1914890.Suche in Google Scholar
Ding, H., Douglass, E.F., Sonabend, A.M., Mela, A., Bose, S., Gonzalez, C., Canoll, P.D., Sims, P.A., Alvarez, M.J., and Califano, A. (2018). Quantitative assessment of protein activity in orphan tissues and single cells using the metaviper algorithm. Nat. Commun. 9: 1–10, https://doi.org/10.1038/s41467-018-03843-3.Suche in Google Scholar PubMed PubMed Central
Dondelinger, F., Husmeier, D., Rogers, S., and Filippone, M. (2013). Ode parameter inference using adaptive gradient matching with Gaussian processes. In: Artificial intelligence and statistics. PMLR, Scottsdale, Arizona, USA, pp. 216–228.Suche in Google Scholar
Du, F., Zhu, X.-H., Zhang, Y., Friedman, M., Zhang, N., Uğurbil, K., and Chen, W. (2008). Tightly coupled brain activity and cerebral atp metabolic rate. Proc. Natl. Acad. Sci. U.S.A. 105: 6409–6414, https://doi.org/10.1073/pnas.0710766105.Suche in Google Scholar PubMed PubMed Central
Ebright, R.Y., Zachariah, M.A., Micalizzi, D.S., Wittner, B.S., Niederhoffer, K.L., Nieman, L.T., Chirn, B., Wiley, D.F., Wesley, B., Shaw, B., et al.. (2020). Hif1a signaling selectively supports proliferation of breast cancer in the brain. Nat. Commun. 11: 1–13, https://doi.org/10.1038/s41467-020-20144-w.Suche in Google Scholar PubMed PubMed Central
Ferreira, G.R., Nakaya, H.I., and da Fontoura Costa, L. (2018). Gene regulatory and signaling networks exhibit distinct topological distributions of motifs. Phys. Rev. E 97: 042417, https://doi.org/10.1103/physreve.97.042417.Suche in Google Scholar
Filbin, M.G., Tirosh, I., Hovestadt, V., Shaw, M.L., Escalante, L.E., Mathewson, N.D., Neftel, C., Frank, N., Pelton, K., Hebert, C.M., et al.. (2018). Developmental and oncogenic programs in h3k27m gliomas dissected by single-cell rna-seq. Science 360: 331–335, https://doi.org/10.1126/science.aao4750.Suche in Google Scholar PubMed PubMed Central
Folger, O., Jerby, L., Frezza, C., Gottlieb, E., Ruppin, E., and Shlomi, T. (2011). Predicting selective drug targets in cancer through metabolic networks. Mol. Syst. Biol. 7: 501, https://doi.org/10.1038/msb.2011.63.Suche in Google Scholar
Frezza, C., Zheng, L., Folger, O., Rajagopalan, K.N., MacKenzie, E.D., Jerby, L., Micaroni, M., Chaneton, B., Adam, J., Hedley, A., et al.. (2011). Haem oxygenase is synthetically lethal with the tumour suppressor fumarate hydratase. Nature 477: 225–228, https://doi.org/10.1038/nature10363.Suche in Google Scholar PubMed
Friedman, N. (2004). Inferring cellular networks using probabilistic graphical models. Science 303: 799–805, https://doi.org/10.1126/science.1094068.Suche in Google Scholar PubMed
Garcia-Alonso, L., Holland, C.H., Ibrahim, M.M., Turei, D., and Saez-Rodriguez, J. (2019). Benchmark and integration of resources for the estimation of human transcription factor activities. Genome Res. 29: 1363–1375, https://doi.org/10.1101/gr.240663.118.Suche in Google Scholar PubMed PubMed Central
Gatto, F., Miess, H., Schulze, A., and Nielsen, J. (2015). Flux balance analysis predicts essential genes in clear cell renal cell carcinoma metabolism. Sci. Rep. 5: 1–18, https://doi.org/10.1038/srep10738.Suche in Google Scholar PubMed PubMed Central
Gavai, A.K., Supandi, F., Hettling, H., Murrell, P., Leunissen, J.A., and Van Beek, J.H. (2015). Using bioconductor package BiGGR for metabolic flux estimation based on gene expression changes in brain. PLoS One 10: e0119016, https://doi.org/10.1371/journal.pone.0119016.Suche in Google Scholar PubMed PubMed Central
Ghandi, M., Huang, F.W., Jané-Valbuena, J., Kryukov, G.V., Lo, C.C., McDonald, E.R.III, Barretina, J., Gelfand, E.T., Bielski, C.M., Li, H., et al.. (2019). Next-generation characterization of the cancer cell line encyclopedia. Nature 569: 503–508, https://doi.org/10.1038/s41586-019-1186-3.Suche in Google Scholar PubMed PubMed Central
Gu, C., Kim, G.B., Kim, W.J., Kim, H.U., and Lee, S.Y. (2019). Current status and applications of genome-scale metabolic models. Genome Biol. 20: 121, https://doi.org/10.1186/s13059-019-1730-3.Suche in Google Scholar PubMed PubMed Central
Gudmundsson, S. and Thiele, I. (2010). Computationally efficient flux variability analysis. BMC Bioinform. 11: 489, https://doi.org/10.1186/1471-2105-11-489.Suche in Google Scholar PubMed PubMed Central
Hageman, R.S., Leduc, M.S., Korstanje, R., Paigen, B., and Churchill, G.A. (2011). A Bayesian framework for inference of the genotype-phenotype map for segregating populations. Genetics 187: 1163–1170.10.1534/genetics.110.123273Suche in Google Scholar PubMed PubMed Central
Han, D., Yu, T., Dong, N., Wang, B., Sun, F., and Jiang, D. (2019). Napabucasin, a novel stat3 inhibitor suppresses proliferation, invasion and stemness of glioblastoma cells. J. Exp. Clin. Cancer Res. 38: 1–12, https://doi.org/10.1186/s13046-019-1289-6.Suche in Google Scholar PubMed PubMed Central
Haskell, K.H. and Hanson, R.J. (1981). An algorithm for linear least squares problems with equality and nonnegativity constraints. Math. Program. 21: 98–118, https://doi.org/10.1007/bf01584232.Suche in Google Scholar
Hill, S.M., Lu, Y., Molina, J., Heiser, L.M., Spellman, P.T., Speed, T.P., Gray, J.W., Mills, G.B., and Mukherjee, S. (2012). Bayesian inference of signaling network topology in a cancer cell line. Bioinformatics 28: 2804–2810, https://doi.org/10.1093/bioinformatics/bts514.Suche in Google Scholar PubMed PubMed Central
Holland, C.H., Tanevski, J., Perales-Patón, J., Gleixner, J., Kumar, M.P., Mereu, E., Joughin, B.A., Stegle, O., Lauffenburger, D.A., Heyn, H., et al.. (2020). Robustness and applicability of transcription factor and pathway analysis tools on single-cell rna-seq data. Genome Biol. 21: 1–19, https://doi.org/10.1186/s13059-020-1949-z.Suche in Google Scholar PubMed PubMed Central
Husmeier, D. (2003a). Reverse engineering of genetic networks with Bayesian networks. Biochem. Soc. Trans. 31: 1516–1518.10.1042/bst0311516Suche in Google Scholar PubMed
Husmeier, D. (2003b). Sensitivity and specificity of inferring genetic regulatory interactions from microarray experiments with dynamic Bayesian networks. Bioinformatics 19: 2271–2282, https://doi.org/10.1093/bioinformatics/btg313.Suche in Google Scholar PubMed
Huynh-Thu, V.A., Irrthum, A., Wehenkel, L., and Geurts, P. (2010). Inferring regulatory networks from expression data using tree-based methods. PLoS One 5: e12776, https://doi.org/10.1371/journal.pone.0012776.Suche in Google Scholar PubMed PubMed Central
Kadota, K. and Shimizu, K. (2020). Commentary: a systematic evaluation of single cell rna-seq analysis pipelines. Front. Genet. 11: 941, https://doi.org/10.3389/fgene.2020.00941.Suche in Google Scholar PubMed PubMed Central
Kanehisa, M. and Goto, S. (2000). Kegg: kyoto encyclopedia of genes and genomes. Nucleic Acids Res. 28: 27–30, https://doi.org/10.1093/nar/28.1.27.Suche in Google Scholar PubMed PubMed Central
Karakas, D., Cevatemre, B., Aztopal, N., Ari, F., Yilmaz, V.T., and Ulukaya, E. (2015). Addition of niclosamide to palladium (ii) saccharinate complex of terpyridine results in enhanced cytotoxic activity inducing apoptosis on cancer stem cells of breast cancer. Bioorg. Med. Chem. 23: 5580–5586, https://doi.org/10.1016/j.bmc.2015.07.026.Suche in Google Scholar PubMed
Karlebach, G. and Shamir, R. (2008). Modelling and analysis of gene regulatory networks. Nat. Rev. Mol. Cell Biol. 9: 770, https://doi.org/10.1038/nrm2503.Suche in Google Scholar PubMed
Kartha, V.K., Duarte, F.M., Hu, Y., Ma, S., Chew, J.G., Lareau, C.A., Earl, A., Burkett, Z.D., Kohlway, A.S., Lebofsky, R., et al.. (2022). Functional inference of gene regulation using single-cell multi-omics. Cell Genomics 2: 100166, https://doi.org/10.1016/j.xgen.2022.100166.Suche in Google Scholar PubMed PubMed Central
Kauffman, K.J., Prakash, P., and Edwards, J.S. (2003). Advances in flux balance analysis. Curr. Opin. Biotechnol. 14: 491–496, https://doi.org/10.1016/j.copbio.2003.08.001.Suche in Google Scholar PubMed
Kenny, P.A., Lee, G.Y., and Bissell, M.J. (2007). Targeting the tumor microenvironment. Front. Biosci. 12: 3468, https://doi.org/10.2741/2327.Suche in Google Scholar PubMed PubMed Central
Kitano, H. (2002a). Computational systems biology. Nature 420: 206–210, https://doi.org/10.1038/nature01254.Suche in Google Scholar PubMed
Kitano, H. (2002b). Systems biology: a brief overview. Science 295: 1662–1664, https://doi.org/10.1126/science.1069492.Suche in Google Scholar PubMed
Koller, D. and Friedman, N. (2009). Probabilistic graphical models: principles and techniques. The MIT Press, Cambridge, MA.Suche in Google Scholar
Koukourakis, M.I., Giatromanolaki, A., Sivridis, E., Simopoulos, C., Turley, H., Talks, K., Gatter, K.C., and Harris, A.L., Tumour and Angiogenesis Research Group. (2002). Hypoxia-inducible factor (hif1a and hif2a), angiogenesis, and chemoradiotherapy outcome of squamous cell head-and-neck cancer. Int. J. Radiat. Oncol. Biol. Phys. 53: 1192–1202, https://doi.org/10.1016/s0360-3016(02)02848-1.Suche in Google Scholar PubMed
Kovács, I.A., Luck, K., Spirohn, K., Wang, Y., Pollis, C., Schlabach, S., Bian, W., Kim, D.-K., Kishore, N., Hao, T., et al.. (2019). Network-based prediction of protein interactions. Nat. Commun. 10: 1–8, https://doi.org/10.1038/s41467-019-09177-y.Suche in Google Scholar PubMed PubMed Central
Kuipers, J., Moffa, G., and Heckerman, D. (2014). Addendum on the scoring of Gaussian directed acyclic graphical models. Ann. Stat. 42: 1689–1691, https://doi.org/10.1214/14-aos1217.Suche in Google Scholar
Lauritzen, S.L. (1996). Graphical models, 17. Clarendon Press, Oxford.10.1093/oso/9780198522195.001.0001Suche in Google Scholar
Lee, W.-P. and Tzou, W.-S. (2009). Computational methods for discovering gene networks from expression data. Brief. Bioinform. 10: 408–423, https://doi.org/10.1093/bib/bbp028.Suche in Google Scholar PubMed
Li, B. and Dewey, C.N. (2011). Rsem: accurate transcript quantification from rna-seq data with or without a reference genome. BMC Bioinform. 12: 1–16, https://doi.org/10.1186/1471-2105-12-323.Suche in Google Scholar PubMed PubMed Central
Li, J.J. and Biggin, M.D. (2015). Statistics requantitates the central dogma. Science 347: 1066–1067, https://doi.org/10.1126/science.aaa8332.Suche in Google Scholar PubMed
Li, R., You, S., Hu, Z., Chen, Z.G., Sica, G.L., Khuri, F.R., Curran, W.J., Shin, D.M., and Deng, X. (2013a). Inhibition of stat3 by niclosamide synergizes with erlotinib against head and neck cancer. PLoS One 8: e74670, https://doi.org/10.1371/journal.pone.0074670.Suche in Google Scholar PubMed PubMed Central
Li, R., Hu, Z., Sun, S.-Y., Chen, Z.G., Owonikoko, T.K., Sica, G.L., Ramalingam, S.S., Curran, W.J., Khuri, F.R., and Deng, X. (2013b). Niclosamide overcomes acquired resistance to erlotinib through suppression of stat3 in non–small cell lung cancer. Mol. Cancer Ther. 12: 2200–2212, https://doi.org/10.1158/1535-7163.mct-13-0095.Suche in Google Scholar PubMed PubMed Central
Liu, C., Lou, W., Armstrong, C., Zhu, Y., Evans, C.P., and Gao, A.C. (2015). Niclosamide suppresses cell migration and invasion in enzalutamide resistant prostate cancer cells via stat3-ar axis inhibition. Prostate 75: 1341–1353, https://doi.org/10.1002/pros.23015.Suche in Google Scholar PubMed PubMed Central
Liu, C., Ma, Y., Zhao, J., Nussinov, R., Zhang, Y.-C., Cheng, F., and Zhang, Z.-K. (2020). Computational network biology: data, models, and applications. Phys. Rep. 846: 1–66, https://doi.org/10.1016/j.physrep.2019.12.004.Suche in Google Scholar
Liu, J., Chen, X., Ward, T., Pegram, M., and Shen, K. (2016a). Combined niclosamide with cisplatin inhibits epithelial-mesenchymal transition and tumor growth in cisplatin-resistant triple-negative breast cancer. Tumor Biol. 37: 9825–9835, https://doi.org/10.1007/s13277-015-4650-1.Suche in Google Scholar PubMed
Liu, Y., Beyer, A., and Aebersold, R. (2016b). On the dependency of cellular protein levels on mrna abundance. Cell 165: 535–550, https://doi.org/10.1016/j.cell.2016.03.014.Suche in Google Scholar PubMed
Luecken, M.D. and Theis, F.J. (2019). Current best practices in single-cell rna-seq analysis: a tutorial. Mol. Syst. Biol. 15: e8746, https://doi.org/10.15252/msb.20188746.Suche in Google Scholar PubMed PubMed Central
Markowetz, F. and Spang, R. (2007). Inferring cellular networks–a review. BMC Bioinform. 8: S5, https://doi.org/10.1186/1471-2105-8-s6-s5.Suche in Google Scholar
Marmiesse, L., Peyraud, R., and Cottret, L. (2015). Flexflux: combining metabolic flux and regulatory network analyses. BMC Syst. Biol. 9: 1–13, https://doi.org/10.1186/s12918-015-0238-z.Suche in Google Scholar PubMed PubMed Central
Menéndez, P., Kourmpetis, Y.A., ter Braak, C.J., and van Eeuwijk, F.A. (2010). Gene regulatory networks from multifactorial perturbations using graphical lasso: application to the dream4 challenge. PLoS One 5: e14147, https://doi.org/10.1371/journal.pone.0014147.Suche in Google Scholar PubMed PubMed Central
Minka, T. and Winn, J. (2008). Gates. Adv. Neural Inf. Process Syst. 21: 1073–1080.Suche in Google Scholar
Moharil, J., May, P., Gaile, D., and Hageman Blair, R. (2016). Belief propagation in genotype-phenotype networks. J. Am. Soc. Nephrol. Stat. Appl. Genet Mol. Bio. 15: 39–53, https://doi.org/10.1515/sagmb-2015-0058.Suche in Google Scholar PubMed
Nagarajan, R., Scutari, M., and Lèbre, S. (2013). Bayesian networks in R, 122. Springer, New York, NY, pp. 125–127.10.1007/978-1-4614-6446-4Suche in Google Scholar
Neftel, C., Laffy, J., Filbin, M.G., Hara, T., Shore, M.E., Rahme, G.J., Richman, A.R., Silverbush, D., Shaw, M.L., Hebert, C.M., et al.. (2019). An integrative model of cellular states, plasticity, and genetics for glioblastoma. Cell 178: 835–849, https://doi.org/10.1016/j.cell.2019.06.024.Suche in Google Scholar PubMed PubMed Central
Nelson, D.L., Lehninger, A.L., and Cox, M.M. (2008). Lehninger principles of biochemistry. Macmillan, New York, NY.Suche in Google Scholar
Newman, M. (2018). Networks. Oxford University Press.10.1093/oso/9780198805090.001.0001Suche in Google Scholar
Obradovic, A., Chowdhury, N., Haake, S.M., Ager, C., Wang, V., Vlahos, L., Guo, X.V., Aggen, D.H., Rathmell, W.K., Jonasch, E., et al.. (2021). Single-cell protein activity analysis identifies recurrence-associated renal tumor macrophages. Cell 184: 2988–3005, https://doi.org/10.1016/j.cell.2021.04.038.Suche in Google Scholar PubMed PubMed Central
Orth, J.D., Thiele, I., and Palsson, B.Ø. (2010). What is flux balance analysis? Nat. Biotechnol. 28: 245–248, https://doi.org/10.1038/nbt.1614.Suche in Google Scholar PubMed PubMed Central
Östman, 2012 Östman, A. (2012). The tumor microenvironment controls drug sensitivity. Nat. Med. 18: 1332–1334, https://doi.org/10.1038/nm.2938.Suche in Google Scholar PubMed
Paik, D.T., Cho, S., Tian, L., Chang, H.Y., and Wu, J.C. (2020). Single-cell rna sequencing in cardiovascular development, disease and medicine. Nat. Rev. Cardiol 17: 457–473, https://doi.org/10.1038/s41569-020-0359-y.Suche in Google Scholar PubMed PubMed Central
Palsson, B. (2015). Systems biology. Cambridge University Press, Cambridge.10.1017/CBO9781139854610Suche in Google Scholar
Potter, S.S. (2018). Single-cell rna sequencing for the study of development, physiology and disease. Nat. Rev. Nephrol 14: 479–492, https://doi.org/10.1038/s41581-018-0021-7.Suche in Google Scholar PubMed PubMed Central
Prasad, V. and Mailankody, S. (2017). Research and development spending to bring a single cancer drug to market and revenues after approval. JAMA Intern. Med. 177: 1569–1575, https://doi.org/10.1001/jamainternmed.2017.3601.Suche in Google Scholar PubMed PubMed Central
Rawłuszko-Wieczorek, A.A., Horbacka, K., Krokowicz, P., Misztal, M., and Jagodziński, P.P. (2014). Prognostic potential of dna methylation and transcript levels of hif1a and epas1 in colorectal cancer. Mol. Cancer Res. 12: 1112–1127, https://doi.org/10.1158/1541-7786.mcr-14-0054.Suche in Google Scholar PubMed
Reina-Campos, M., Moscat, J., and Diaz-Meco, M. (2017). Metabolism shapes the tumor microenvironment. Curr. Opin. Cell Biol. 48: 47–53, https://doi.org/10.1016/j.ceb.2017.05.006.Suche in Google Scholar PubMed PubMed Central
Rockman, M.V. (2008). Reverse engineering the genotype–phenotype map with natural genetic variation. Nature 456: 738–744, https://doi.org/10.1038/nature07633.Suche in Google Scholar PubMed
Roy, M., Schmid, S., and Tredan, G. (2014). Modeling and measuring graph similarity: the case for centrality distance. In: Proceedings of the 10th ACM international workshop on foundations of mobile computing, pp. 47–52.10.1145/2634274.2634277Suche in Google Scholar
Schäfer, J. and Strimmer, K. (2005). An empirical bayes approach to inferring large-scale gene association networks. Bioinformatics 21: 754–764, https://doi.org/10.1093/bioinformatics/bti062.Suche in Google Scholar PubMed
Schellenberger, J., Park, J.O., Conrad, T.M., and Palsson, B.Ø. (2010). BiGG: a biochemical genetic and genomic knowledge base of large scale metabolic reconstructions. BMC Bioinform. 11: 213, https://doi.org/10.1186/1471-2105-11-213.Suche in Google Scholar PubMed PubMed Central
Scutari, M., Graafland, C.E., and Gutiérrez, J.M. (2019). Who learns better Bayesian network structures: accuracy and speed of structure learning algorithms. Int. J. Approx. Reason 115: 235–253, https://doi.org/10.1016/j.ijar.2019.10.003.Suche in Google Scholar
Semenza, G.L. (2010). Hif-1: upstream and downstream of cancer metabolism. Curr. Opin. Genet. Dev. 20: 51–56, https://doi.org/10.1016/j.gde.2009.10.009.Suche in Google Scholar PubMed PubMed Central
Shlomi, T., Eisenberg, Y., Sharan, R., and Ruppin, E. (2007). A genome-scale computational study of the interplay between transcriptional regulation and metabolism. Mol. Syst. Biol. 3: 101, https://doi.org/10.1038/msb4100141.Suche in Google Scholar PubMed PubMed Central
Smolen, P., Baxter, D.A., and Byrne, J.H. (2000). Mathematical modeling of gene networks. Neuron 26: 567–580, https://doi.org/10.1016/s0896-6273(00)81194-0.Suche in Google Scholar PubMed
Sradhanjali, S. and Reddy, M.M. (2018). Inhibition of pyruvate dehydrogenase kinase as a therapeutic strategy against cancer. Curr. Top. Med. Chem. 18: 444–453, https://doi.org/10.2174/1568026618666180523105756.Suche in Google Scholar PubMed
Suvà, M.L. and Tirosh, I. (2019). Single-cell rna sequencing in cancer: lessons learned and emerging challenges. Mol. Cell 75: 7–12, https://doi.org/10.1016/j.molcel.2019.05.003.Suche in Google Scholar PubMed
Tang, F., Barbacioru, C., Wang, Y., Nordman, E., Lee, C., Xu, N., Wang, X., Bodeau, J., Tuch, B.B., Siddiqui, A., et al.. (2009). mrna-seq whole-transcriptome analysis of a single cell. Nat. Methods 6: 377–382, https://doi.org/10.1038/nmeth.1315.Suche in Google Scholar PubMed
Tannock, I.F., Hickman, J.A. (2016). Limits to personalized cancer medicine. N. Engl. J. Med. 375: 1289–1294, https://doi.org/10.1056/nejmsb1607705.Suche in Google Scholar
Tran, C., Ouk, S., Clegg, N.J., Chen, Y., Watson, P.A., Arora, V., Wongvipat, J., Smith-Jones, P.M., Yoo, D., Kwon, A., et al.. (2009). Development of a second-generation antiandrogen for treatment of advanced prostate cancer. Science 324: 787–790, https://doi.org/10.1126/science.1168175.Suche in Google Scholar PubMed PubMed Central
Tsamardinos, I., Brown, L.E., and Aliferis, C.F. (2006). The max-min hill-climbing Bayesian network structure learning algorithm. Mach. Learn. 65: 31–78, https://doi.org/10.1007/s10994-006-6889-7.Suche in Google Scholar
van Beek, J.H., Supandi, F., Gavai, A.K., de Graaf, A.A., Binsl, T.W., and Hettling, H. (2011). Simulating the physiology of athletes during endurance sports events: modelling human energy conversion and metabolism. Philos. Trans. Royal Soc. 369: 4295–4315, https://doi.org/10.1098/rsta.2011.0166.Suche in Google Scholar PubMed PubMed Central
Van Dijk, D., Sharma, R., Nainys, J., Yim, K., Kathail, P., Carr, A.J., Burdziak, C., Moon, K.R., Chaffer, C.L., Pattabiraman, D., et al.. (2018). Recovering gene interactions from single-cell data using data diffusion. Cell 174: 716–729, https://doi.org/10.1016/j.cell.2018.05.061.Suche in Google Scholar PubMed PubMed Central
van Galen, P., Hovestadt, V., Wadsworth, M.H.II, Hughes, T.K., Griffin, G.K., Battaglia, S., Verga, J.A., Stephansky, J., Pastika, T.J., Story, J.L., et al.. (2019). Single-cell rna-seq reveals aml hierarchies relevant to disease progression and immunity. Cell 176: 1265–1281, https://doi.org/10.1016/j.cell.2019.01.031.Suche in Google Scholar PubMed PubMed Central
Van Oevelen, D., Van den Meersche, K., Meysman, F.J., Soetaert, K., Middelburg, J.J., and Vézina, A.F. (2010). Quantifying food web flows using linear inverse models. Ecosystems 13: 32–45, https://doi.org/10.1007/s10021-009-9297-6.Suche in Google Scholar
Vijesh, N., Chakrabarti, S.K., and Sreekumar, J. (2013). Modeling of gene regulatory networks: a review. J. Biomed. Eng. 6: 223, https://doi.org/10.4236/jbise.2013.62a027.Suche in Google Scholar
Wang, Z., Xu, W., San Lucas, F.A., and Liu, Y. (2013). Incorporating prior knowledge into gene network study. Bioinformatics 29: 2633–2640, https://doi.org/10.1093/bioinformatics/btt443.Suche in Google Scholar PubMed PubMed Central
Werhli, A.V. and Husmeier, D. (2007). Reconstructing gene regulatory networks with Bayesian networks by combining expression data with multiple sources of prior knowledge. J. Am. Soc. Nephrol. Stat. Appl. Genet Mol. Bio. 6, https://doi.org/10.2202/1544-6115.1282.Suche in Google Scholar PubMed
Werhli, A.V., Grzegorczyk, M., and Husmeier, D. (2006). Comparative evaluation of reverse engineering gene regulatory networks with relevance networks, graphical Gaussian models and Bayesian networks. Bioinformatics 22: 2523–2531, https://doi.org/10.1093/bioinformatics/btl391.Suche in Google Scholar PubMed
White, A. and Vignes, M. (2019). Causal queries from observational data in biological systems via Bayesian networks: an empirical study in small networks. Gene Regulatory Networks: Methods and Protocols. Humana Press, New Jersey, pp. 111–142, https://doi.org/10.1007/978-1-4939-8882-2_5.Suche in Google Scholar PubMed
Whiteside, T. (2008). The tumor microenvironment and its role in promoting tumor growth. Oncogene 27: 5904–5912, https://doi.org/10.1038/onc.2008.271.Suche in Google Scholar PubMed PubMed Central
Winn, J. (2012). Causality with gates. In: Artificial intelligence and statistics. PMLR, La Palma, Canary Islands, pp. 1314–1322.Suche in Google Scholar
Yizhak, K., Le Dévédec, S.E., Rogkoti, V.M., Baenke, F., de Boer, V.C., Frezza, C., Schulze, A., van de Water, B., and Ruppin, E. (2014). A computational study of the warburg effect identifies metabolic targets inhibiting cancer migration. Mol. Syst. Biol. 10: 744, https://doi.org/10.15252/msb.20134993.Suche in Google Scholar PubMed PubMed Central
Yu, H. and Blair, R.H. (2019). Integration of probabilistic regulatory networks into constraint-based models of metabolism with applications to Alzheimer’s disease. BMC Bioinform. 20: 1–12, https://doi.org/10.1186/s12859-019-2872-8.Suche in Google Scholar PubMed PubMed Central
Yu, H., Moharil, J., and Blair, R.H. (2020). Bayesnetbp: an r package for probabilistic reasoning in Bayesian networks. J. Stat. Softw. 94: 1–31, https://doi.org/10.18637/jss.v094.i03.Suche in Google Scholar
Yu, X., Jiang, Y., Wei, W., Cong, P., Ding, Y., Xiang, L., and Wu, K. (2015). Androgen receptor signaling regulates growth of glioblastoma multiforme in men. Tumor Biol. 36: 967–972, https://doi.org/10.1007/s13277-014-2709-z.Suche in Google Scholar PubMed
Zalcman, N., Canello, T., Ovadia, H., Charbit, H., Zelikovitch, B., Mordechai, A., Fellig, Y., Rabani, S., Shahar, T., Lossos, A., et al.. (2018). Androgen receptor: a potential therapeutic target for glioblastoma. Oncotarget 9: 19980, https://doi.org/10.18632/oncotarget.25007.Suche in Google Scholar PubMed PubMed Central
Zhang, B. and Horvath, S. (2005). A general framework for weighted gene co-expression network analysis. Stat. Appl. Genet Mol. Biol. 4, https://doi.org/10.2202/1544-6115.1128.Suche in Google Scholar PubMed
Zhao, N., Wang, F., Ahmed, S., Liu, K., Zhang, C., Cathcart, S.J., DiMaio, D.J., Punsoni, M., Guan, B., Zhou, P., et al.. (2021). Androgen receptor, although not a specific marker for, is a novel target to suppress glioma stem cells as a therapeutic strategy for glioblastoma. Front Oncol 11: 1696, https://doi.org/10.3389/fonc.2021.616625.Suche in Google Scholar PubMed PubMed Central
Zhao, Y., Butler, E.B., and Tan, M. (2013). Targeting cellular metabolism to improve cancer therapeutics. Cell Death Dis. 4: e532, https://doi.org/10.1038/cddis.2013.60.Suche in Google Scholar PubMed PubMed Central
Zhu, S., Qing, T., Zheng, Y., Jin, L., and Shi, L. (2017). Advances in single-cell rna sequencing and its applications in cancer research. Oncotarget 8: 53763, https://doi.org/10.18632/oncotarget.17893.Suche in Google Scholar PubMed PubMed Central
Zou, S., Tong, Q., Liu, B., Huang, W., Tian, Y., and Fu, X. (2020). Targeting stat3 in cancer immunotherapy. Mol. Cancer 19: 1–19, https://doi.org/10.1186/s12943-020-01258-7.Suche in Google Scholar PubMed PubMed Central
Supplementary Material
This article contains supplementary material (https://doi.org/10.1515/sagmb-2022-0054).
© 2023 the author(s), published by De Gruyter, Berlin/Boston
This work is licensed under the Creative Commons Attribution 4.0 International License.
Artikel in diesem Heft
- Review
- Mediation analysis method review of high throughput data
- Research Articles
- When is the allele-sharing dissimilarity between two populations exceeded by the allele-sharing dissimilarity of a population with itself?
- Patterns of differential expression by association in omic data using a new measure based on ensemble learning
- Integrated regulatory and metabolic networks of the tumor microenvironment for therapeutic target prioritization
- Randomized singular value decomposition for integrative subtype analysis of ‘omics data’ using non-negative matrix factorization
- A novel hybrid CNN and BiGRU-Attention based deep learning model for protein function prediction
- Accurate and fast small p-value estimation for permutation tests in high-throughput genomic data analysis with the cross-entropy method
- Improving the accuracy and internal consistency of regression-based clustering of high-dimensional datasets
- A Bayesian model to identify multiple expression patterns with simultaneous FDR control for a multi-factor RNA-seq experiment
- A fast and efficient approach for gene-based association studies of ordinal phenotypes
- Software and Application Note
- CAT PETR: a graphical user interface for differential analysis of phosphorylation and expression data