
The Cyclical Behaviour of Bank Capital Buffers: An Empirical Evidence for MENA Banking Systems
-
Zied Saadaoui


Abstract
Bank exposure to systemic shocks induced the Basel Committee on Banking Supervision to introduce a countercyclical capital buffers’ requirement in its new regulatory framework (Basel III). But is this macro-prudential tool useful for Middle East and North African countries (MENA) countries’ banking systems? Should it be implemented in a homogenous way for all banks in these countries? Trying to give plausible answers to these questions weakly debated in the literature for the case of MENA banking systems, this study uses an enough representative sample of commercial banks based in 15 MENA countries. Estimating a partial adjustment framework using system generalized method of moments (GMM) with Windmeijer’s correction, we show that large banks and banks with high market power are more inclined to behave in a countercyclical way than small banks and banks with low market power. These results are robust to several sensitivity checks. Accordingly, we think that the implementation of countercyclical capital buffers in the MENA region should take into consideration bank-specific characteristics like size and market power.
1 Introduction
The Basel Accord capital micro-prudential standards are expected to make banks more robust against unexpected shocks and to provide regulatory authorities with a set of prudential tools to maintain banking stability. [1] Banks are required to hold a level of equity capital and other capital instruments that make them able to cover credit, market and operational risks. However, after the subprime crisis, the Basel Committee on Banking Supervision (BCBS) stressed the importance of macro-prudential regulation to prevent banks from excessive risk-taking during economic upturns which can lead to the materialization of systemic risks during recessions (BCBS 2010; Caruana 2010). By consequence, in its last regulatory framework, the BCBS introduced countercyclical capital buffers, in excess of the minimum required level, that become binding during sustainable economic expansions in order to make banks more able to absorb losses during downturns.
The adoption of such a regulation was supported by several studies which demonstrated that bank lending behaviour is likely to be influenced by business cycles. In fact, during an economic upturn, banks may underestimate potential risks and operate with low capital buffers. But, build-up of risk during this period can lead to an accumulation of losses. Once these losses materialize during a recession, banks will put more stringent credit constraints in order to increase capital, decrease loan default risk and preserve adequate levels of capital buffers. In turn, excessive prudential behaviour of banks can induce them to reduce loan supply. It is possible to explain this cyclical behaviour of banks theoretically by the existence of capital adjustment costs, cognitive biases and myopic behaviour (Borio et al. 2001; Lowe 2002; Estrella 2004; Ruckes 2004). Empirically, the relationship between capital buffers and the business cycle was studied mainly for developed countries’ banking systems. Findings often indicate a countercyclical behaviour of banks that translates into a negative co-movement between bank capital buffers and business cycles (Ayuso et al. 2004; Bikker and Metzemakers 2005; Bikker and Metzemakers 2007; Boucinha and Ribeiro 2007; Curry et al. 2008; Jokipii and Milne 2008; Marcucci and Quagliariello 2008; Stolz and Wedow 2011; Coffinet et al. 2012; Shim 2013). [2]
Studying how banks adjust capital buffers over the business cycle may be very useful to further investigate the consequences related to the implementation of Basel capital standards in this group of countries. A large attention was given by the literature to the challenges faced by emerging countries in implementing the Basel capital standards and their expected impact on banking system stability. But, until now, the cyclical behaviour of banks in this group of countries was only debated in a limited number of empirical contributions (Tabak et al. 2011; García-Suaza et al. 2012; Atici and Gursoy 2013; Saadaoui 2014; Huang and Xiong 2014). [3] These studies proved the existence of a significant relationship between business cycle and bank capital and risk behaviour in emerging countries, giving interesting results in anticipation of the future implementation of macro-prudential capital standards. But, to the best of our knowledge, empirical contributions on this issue are still inexistent for the case of the Middle East and North African countries (MENA), despite their recent rapid financial development and increasing financial integration. Hence, it is interesting to fill this gap by checking if business cycle significantly influences the behaviour of banks in the MENA region, and more precisely the way they adjust capital buffers throughout business cycles. If capital buffers are found to be countercyclical, reflected through a negative co-movement of capital buffers with business cycle, this indicates that banks in the MENA region operate with lower capital buffers levels during economic expansions, which induce them to increase capital level during recession and to cut credits. On the other hand, if capital buffers are procyclical, meaning a positive co-movement of capital buffers with business cycle, this indicates that banks build adequate capital buffers during upturns in parallel to a rapid credit growth, giving them the opportunity to consume this capital level in excess of the required minimum to cover unexpected losses during recessions and, thus, will not be constrained to reduce credit supply.
Furthermore, we can expect that the relationship between capital buffers and business cycle becomes biased due to the fact that banking systems in the MENA region are dominated by small-sized banks. But, with the increasing degree of financial system development some large banks emerged in some countries and became economically very important. Hence, it will be more interesting to differentiate banks according to their size and their market power to check if business cycle effects can change among different bank characteristics. In fact, as found by (García-Suaza et al. 2012) for the case of Colombia, large banks are found to be more inclined to adjust capital buffers in a countercyclical way. Using a large sample of banks based in emerging countries, (Saadaoui 2014) found that capital buffers and credit risk are both negatively correlated with business cycles and that this result is less evident for banks with strong market power. Our study builds on the evidence provided by (García-Suaza et al. 2012) and (Saadaoui 2014), but with notable differences. First, both contributions do not focus on MENA countries banking systems, while the present study concentrates exclusively on the case of commercial banks in the MENA region. Second, our study tries to join the two contributions by testing the influence of both bank size and market power on the relationship between capital buffers and business cycle. Third, contrary to (Saadaoui 2014) who used a simultaneous equation method, the present study uses the system generalized method of moments (GMM) with Windmeijer’s finite-sample correction in order to take into consideration the dynamic behaviour of capital buffers and to deal more efficiently with the endogeneity problem of explanatory variables.
Even if financial and banking stability is a highly debated issue for MENA countries especially after the occurrence of the Arab spring, to the best of our knowledge, this is the first attempt to provide empirical evidence on the co-movement of bank capital buffers and business cycle. We expect that this study will shed more light on bank behaviour and provide useful results for policymakers projecting to implement the new Basel Capital macro-prudential standards in the MENA region.
The rest of the paper is organized as follows: Section 2 explains why banking stability issues especially those related to the cyclical behaviour of banks is relevant for MENA countries through a brief presentation of some specific characteristics of their banking systems. The purpose of Section 3 is to explain how bank capital buffers can be affected by business cycles and to relate major empirical findings on this issue. Section 4 presents the empirical methodology and the selected sample of MENA countries’ banks. In Section 5 we provide descriptive statistics and interpret empirical results. Section 6 concludes.
2 A Brief Presentation of MENA Countries’ Banking Systems
Prudential regulation and the improvement of banking systems stability are becoming challenging issues for MENA countries due to their changing financial landscapes. Banking systems in these countries are being progressively opened to international transactions and to foreign banks. But there are still some weaknesses that make them less developed and more fragile than other emerging countries’ banking systems, like the relative strong dominance of state-owned banks, the high level of non-performing loans and the delay in adopting and enforcing efficient prudential standards. Besides, financial systems in this region are mostly bank-based. On average, banks’ assets in this region reach about 130% of GDP, against 5% and 0.2% for insurance and micro-credit companies. But this proportion is lower for countries where governments control a major stake of banking systems (Algeria, Libya and Syria), with only 65% of GDP. In this region also, bank credit is the major source of finance relative to alternative financing sources. Bank credits in Gulf Cooperation Council (GCC) countries account for 70% of GDP which is higher than the proportion of credit in non-GCC countries that stands at 40% of GDP (Rocha, Arvai, and Farazi 2011). [4] Although these proportions remain high relative to international standards and despite recent efforts in privatizing public banks and restructuring banking systems, banking systems in this region are still weakly competitive and highly concentrated (Turk-Ariss 2009).
State ownership of banks in this region has also impeded banking systems to reach plausible levels of development. In fact, governments own a large part of banking institutions, but at different degrees. In countries like Algeria or Syria, public banks hold over 90% of total assets. In Morocco, however, the state controlled only about 13% of commercial banks’ total assets in 2004 (Tahari et al. 2007). In the GCC countries, the share of state banks in total banking systems’ assets is relatively high with more than 30% of assets held by public banks in 2008. In turn, the strong presence of public banks may theoretically explain why banking systems, especially in the Maghreb region, are less efficient and suffer from high level of non-performing loans due to political interferences and allocation of loans toward non-productive investments (Boyreau-Debrey and Wei, 2005; Dinç, 2005; Farazi et al., 2013). Despite the decline in the proportion of non-performing loans during the last decade, some non-GCC countries continue to endure high levels of non-performing loans, like Egypt and Tunisia, where in the latter credit losses amounted to 13% of total loans before the Arab spring. Non-performing loans reached also high levels in countries where banks are largely state-owned with a share of non-performing loans higher than 20% in Algeria and Libya (Rocha et al. 2011). Despite that banks in the MENA region improved significantly their capital adequacy ratios and built high capital buffers, the lack of an efficient institutional and legal framework, the weak protection of shareholders rights and the lack of efficient information and accounting standards may also explain why banking systems in this region continue to suffer high levels of credit losses. Moreover, banking authorities in this region are still not able to implement an effective risk-based prudential supervision and suffer from a lack of independency and accountability of authorities. However, the majority of MENA countries regulatory authorities are in the process of implementing the Basel capital adequacy standards and improving their regulatory and supervisory frameworks by strengthening their compliance with the Basel Core Principles. Since 2008, some MENA countries started to implement the standardized approach for calculation of minimum capital requirements under the Basel II regulatory framework, except Kuwait (since 2005), Morocco, Oman and Qatar (since 2006). Among these countries, only Morocco published in 2010 the final rules for the foundation and advanced internal ratings-based approach. However, some other countries like Tunisia are still adopting the first version of the Basel accord (Financial Stability Institute, 2014).
In addition to the above-mentioned weaknesses of MENA banking systems, the impact of business cycle on bank capital buffers and by consequence the implementation of macro-prudential tools in MENA countries are progressively gaining interest for two reasons: First, with their efforts to strengthen their prudential regulatory frameworks by implementing the Basel rules, banking authorities in the MENA region succeeded to improve the capital positions of their banking systems before the subprime crisis. But with the undiversified nature of MENA economies, their dependence on commodities and oil revenues, the high level of non-performing loans and credit concentration, banks are increasingly exposed to economic conditions. In fact, an increase of commodity prices during economic expansion can expose banking systems to rapid capital inflows and high credit growth and provoke a build-up of risk. In addition, high credit concentration added to the high initial level of non-performing loans and the materialization of new losses may induce severe credit crunch during recessions when capital buffers are insufficient to absorb unexpected losses. This, in turn, highlights the importance of implementing countercyclical capital standards in this region.
Second, the subprime crisis effectively led to credit stagnation in the MENA region. In fact, banking systems of several MENA countries benefited from a rapid accumulation of liquidity after the oil boom occurred between 2003 and 2008. During this period credit booms were observed especially in GCC countries like Qatar, Oman, Bahrain, Kuwait and Saudi Arabia where credit growth reached very high levels reaching between 30% and 50%. In non-GCC countries, credit growth was also high but more moderate during this period reaching between 10% and 15%. The highest levels were observed in Jordan and Morocco in 2006 and 2008, respectively (Barajas et al. 2010). Even state-controlled banking systems experienced a significant growth of loan supply. This was the case, for example, in Algeria where credit to the economy in real terms doubled between 2000 and 2005 (Tahari et al. 2007). But this period of rapid credit growth gave way to a sharp slowdown after the crisis of 2007, where credit stagnation was observed mainly in the most internationally integrated banking systems like in the United Arab Emirates and in Saudi Arabia. In addition to the restricted access to external borrowing for banks and to the rapid decline of commodity prices, economic recessions have exerted a strong impact on credit growth. Even in non-GCC countries, the subprime crisis induced a net slowdown in credit growth in all countries, especially in Egypt and Jordan (Barajas et al. 2010).
Hence, despite the fact that MENA countries’ banking systems appear to be safe and stable, looking closely at what happened since the subprime crisis in some highly integrated financial systems, it appears that banks, especially large ones, were vulnerable to business cycle fluctuations (Rocha, Arvai, and Farazi 2011; Barajas et al. 2010). Thus, it becomes highly interesting to explore this issue more deeply by focusing on the relationship between business cycles and capital decisions in MENA countries’ banks. Moreover, bank heterogeneity in this region explains why it is important to take into account bank-specific features, like bank size and market power, as principal determinants of capital buffers cyclicality. As explained in the beginning of the paper, banking systems in this region have reached different levels of international integration and liberalization. In some countries, the state dominates banking activities and in others private banks are major players. Recent liberalization and privatization efforts of banking systems in the region induced a significant improvement in the level of financial development and international financial integration exerting non-trivial impacts on banking market structure and competitiveness.
3 Bank Capital Buffers and Business Cycles: Do Size and Market Power Matter?
3.1 The Relationship between Capital Buffers and Business Cycles
Banks often hold a level of capital in excess of regulatory requirements for strategic reasons. Indeed, capital buffers allow banks to avoid regulatory sanctions in an uncertain environment where unanticipated negative shocks on assets value can threaten bank solvency (Marcus 1983; Milne 2004). Capital buffers by signalling good information to financial markets permit banks to borrow wholesale funds at better interest rates and to seize unexpected opportunities of profitable investment or an unexpected increase in loan demand (Berger, Herring, and Szegö 1995; Lindquist 2004). Among other factors, economic conditions, as explained before, are likely to complicate the management of capital buffers and to induce banks to adopt harmful decisions (for the economy) to maintain their solvency. In fact, when economic conditions are good, and expected profits increase, value maximizing banks are more inclined to underestimate borrowers’ default risks and to operate with less capital buffers. When an economic downturn takes place and default risks begin to materialize into higher losses, banks will try to avoid regulatory and market sanctions, which induce them to cut credit and increase capital levels. This countercyclical behaviour may be harmful for the stability of the banking system and loan supply.
On the theoretical side, the countercyclical change of capital buffers can result from cognitive biases like myopic behaviour. In a context of incertitude, banks may underestimate the likelihood of negative shocks during economic upturn, and their future decisions regarding capital and risk levels are more likely to be influenced by recent performance. Hence, during economic upturns, this cognitive bias may induce banks to adopt more lenient credit standards and to underestimate borrower’s expected default rates, resulting in more lending at better spreads. During economic busts, the opposite process takes place, with a dynamics of over-indebtedness, excessive risk aversion, credit rationing and finally credit crunches (Jackson 1999; Lowe 2002). In response to loan loss accumulation in downturns, banks are constrained to increase equity capital and to cut loans to maintain their solvency. This can explain a negative correlation between business cycles and capital buffers.
In addition to cognitive biases, a negative relationship between capital buffers and business cycles can result also from capital adjustment costs (cost of holding capital and cost of failure). In fact, asymmetric information in capital markets makes it more difficult and costly for banks to instantaneously raise or shed external capital through issuing or repurchasing stocks when the market can misinterpret this signal (Ayuso, Pérez, and Saurina 2004; Estrella 2004; Myers and Majluf 1984). Capital adjustment costs may also take the form of financial losses when a bank is constrained to liquidate a part of its risky assets in order to meet regulatory capital requirements. Future expected and unexpected losses accumulation during rapid economic expansions will trigger an instantaneous increase of capital levels for forward-looking banks. But the existence of capital adjustment costs will make this instantaneous operation very costly. Therefore, during economic upturns, it is optimal for banks to adjust more slowly capital to the required level, which can lead to a negative co-movement between capital buffers and business cycles (Estrella 2004).
However, also a positive correlation between capital buffer and economic cycle may take place when banks rationally anticipate losses during expansion. In fact, when banks significantly increase loan supply during economic upturns they may face an accumulation of loan losses that will materialize during economic downturn (Borio, Furfine, and Lowe 2001). In this case rational forward-looking banks will build up higher capital buffers during cyclical upturn. When a recession takes place, they will use this excess capital to mitigate the impact of unanticipated losses. This behaviour can lead to a positive co-movement of capital buffers with business cycles (Jokipii and Milne 2008; Stolz and Wedow 2011).
Besides, economic upturns improve assets’ returns and stock performances, which reduce the cost of capital and make recapitalization easier for banks. This hypothesis can explain a positive relationship between capital buffers and business cycles during expansion. During bad economic performances, capital buffers can also be positively correlated with business cycles when the level of loan loss provisions is insufficient to absorb expected losses. In this case, banks will be constrained to consume additional capital to deal with the problem of under-provisioning, inducing a decrease in capital levels (Stolz and Wedow 2011).
3.2 The Possible Impact of Bank Size and Market Power
In this section, we follow the arguments of (García-Suaza et al. 2012) and (Saadaoui 2014) in order to explain how the relationship between business cycle and banks capital buffers may depend on some specific features like bank size and market power. In addition, as Bikker et al. (2006) found that large-sized banks are more likely to exert and benefit from strong market power, we think that both large banks and banks with strong market power adjust more easily capital buffers during business cycles since they benefit from easier access to financial markets and, thus, lower external capital adjustment costs. These advantages are likely to place large banks and banks with strong market power in a better position especially during downturns. Moreover, banks with great market power maximize rents through higher intermediation margin which may boost their revenues especially during upturns when loan demand increases. In turn, higher expected revenues may substitute for economic capital and push banks to operate with lower capital buffers during good economic conditions (Elizalde and Repullo 2007). In sum, large banks and banks with high market power are more inclined to behave in a countercyclical way by lowering capital buffers during upturns because they anticipate lower capitalization costs during recessions and higher expected revenues during expansions.
In addition, high market power, by improving large banks’ charter value, is expected to give them more incentives to decrease risk-taking in order to preserve expected profits (Keeley 1990). However, even if large banks benefit from greater asset and geographic diversification, these advantages do not result necessarily in a lower systematic risk (Demsetz and Strahan 1997; Hughes et al. 1996). In other words, higher charter value does not necessarily lower loan default rates for banks with strong market power, especially during business cycle contractions where systematic risk is likely to increase. Trying to verify these arguments, Saunders and Wilson (2001) use an extensive dataset on American banks from 1883 to 1992. Their findings indicate that during business cycle contractions, large banks with high market power suffered deeper losses in charter value which is reflected through a negative relationship between capital level and market power.
In addition, the “too big to fail” moral hazard may be behind the countercyclical behaviour of large banks. In fact, government subsidies, through their function of lender at last resort, may give incentives for large banks to increase moral hazard and risk-taking by decreasing capital buffers during upturns, which may give rise to higher loan losses when downturns take place (Schaeck, Cihak, and Wolfe 2009; Soedarmono, Machrouh, and Tarazi 2013).
In the next section, we briefly review empirical findings on the relationship between business cycle and capital buffers. The major part of the empirical literature studied the case of developed countries’ banking systems, but recently some interesting results were found concerning the behaviour of emerging countries’ banks over the business cycle.
3.3 Empirical Findings
On the empirical side, several studies tried to verify business cycle effects on bank capital buffers. These studies focused mainly on developed countries’ banking systems where the Basel standards are almost fully implemented. Studying the case of German public and cooperative banks between 1993 and 2004, Stolz and Wedow (2011) show that capital buffers are negatively correlated with the output gap, which supports the hypothesis of a countercyclical behaviour of banks. They also show that low capitalized banks face more difficulties to adjust their capital and risk levels than high capitalized banks over the cycle. But the correlation between capital buffers and business cycle may depend also on data frequency. In fact, using aggregated and higher frequency data (monthly observations) for the specific case of German banks, (Grosse and Schumann 2013) demonstrated that capital buffers react only after several months to a negative shock on industrial production. This implies that banks operate slow countercyclical adjustments on capital buffers as a reaction to GDP change. This result highlights the fact that the use of more frequent data and different indicators of business cycle may provide more useful information for authorities on the cyclical behaviour of banks.
A countercyclical behaviour was found also by Boucinha and Ribeiro (2007) for a sample of 17 Portuguese banking groups for the period 1994–2004. Using annual balance-sheet data from 1986 to 2000, this result is also found by Ayuso et al. (2004) for a sample of 142 Spanish commercial and saving banks. Trying to test whether bank-specific features could influence the relationship between economic cycles and capital buffers, they also show that, while Spanish business cycle negatively affects bank capital buffers, there is no evidence that this effect depends on bank size or ownership structure. Focusing on a sample of European countries’ banks (EU15 and accession countries), (Jokipii and Milne 2008) found evidence of a significant negative co-movement of capital buffers with business cycle for EU15 banks. For banks belonging to the accession countries this relationship becomes positive. But, contrary to the findings of Ayuso et al. (2004), Jokipii and Milne (2008) show that business cycles exert different impacts on capital buffers depending on bank ownership structure and size. In fact, large banks are found to behave in a countercyclical way, while capital buffers of small banks are positively correlated with business cycle. Commercial and saving banks are also found to adjust capital buffers in a countercyclical way, contrary to cooperative banks whose capital buffers are procyclical.
For a sample of US bank holdings observed using quarterly data from 1992 to 2011, Shim (2013) found that capital buffers are negatively correlated with the business cycle. The same result was found by Coffinet et al. (2012) for a sample of 231 French banks observed annually between 1993 and 2009. Studying the six largest Canadian banks from 1982 to 2010, Guidara et al. (2013) found, however, a positive co-movement between capital buffers and business cycle which reflects, according to the authors, a more prudent behaviour of banks throughout the different phases of the cycle. This may explain also why Canadian banks were less affected by the subprime crisis. Using a large sample of 1,337 banks based in 70 countries from 1992 to 2002, Fonseca and Gonzales (2010) found no evidence that business cycles exert a significant impact on bank capital buffers. They explain this result by a probable heterogeneity of the selected sample that may generate different responses of banks’ behaviours to business cycle. Country-level estimations show that the relationship between capital buffers and business cycles differs from a country to another. However, even if the study of Fonseca and Gonzales (2010) includes some emerging countries in the sample, they do not provide obvious results concerning the cyclical behaviour of bank capital buffers and portfolio risk in this group of countries.
Other studies tried to provide more accurate results on the cyclicality of bank behaviour in emerging countries. Using an unbalanced quarterly panel data of 134 Brazilian banks from 2000 to 2010, Tabak et al. (2011) found a negative and significant relationship between business cycle and capital buffers. This result contrasts with that obtained by Fonseca and Gonzales (2010), who found that capital buffers of Brazilian banks are positively rather than negatively correlated with business cycle. These contrasting results may be explained by the heterogeneity of bank specific features. Indeed, by interacting the cycle with ownership dummies, Tabak et al. (2011) found that private Brazilian banks are more likely to reduce capital buffers during good times than state-owned and foreign banks. Huang and Xiong (2014) adopted almost the same approach to check for the cyclical behaviour of Chinese banks. Studying a sample of 45 commercial banks from 2000 to 2010, the authors distinguish between banks according to their ownership structure and found that the business cycle is positively correlated to capital buffers and that this relationship becomes less evident for state-owned banks which contradicts the findings of Tabak et al. (2011) for the case of Brazilian banks. Using a sample of 87 Turkish banks observed between 1988 and 2009, Atici and Gursoy 2013 divided the sample into two groups and found that for banks under the control of Savings Deposit and Insurance Fund (SDIF) there is a positive relationship between business cycle and capital buffers, but this relationship turns to be negative for banks outside the control of the SDIF.
(García-Suaza et al. 2012) investigate more deeply this issue by focusing on the impact of bank size on the relationship between business cycle and capital buffers using a sample of Colombian banks observed between 1996 and 2010. They found that while economic growth exerts a negative influence on capital buffers, this influence becomes more important for large banks. The authors explain this result by the fact that large banks, benefiting from easier access to equity markets, adjust more easily capital and risk over the business cycle inducing them to lower capital buffers during upturns. However, this countercyclical behaviour of large banks can be a source of fragility for the banking systems. Exploring a similar issue and using a large sample of emerging countries’ banks observed between 1997 and 2008, (Saadaoui 2014) found that capital buffers and loan default risk are both negatively correlated with business cycle and that market power significantly attenuates this countercyclical behaviour of banks. According to the author, these results show that strong market power is likely to insulate banks from strong competition and excessive risk-taking during upturns and permit them to adjust more easily (with less costs) capital buffers and risk-taking throughout the business cycle.
While these empirical results, focusing on some important emerging countries’ banking systems, give relevant conclusions on the cyclicality of bank capital buffers, it is interesting to complement these results by studying this issue for MENA countries’ banking systems. Curiously, to our knowledge, despite the country case study on Turkey provided by Atici and Gursoy (2012), there is still no empirical evidence on the determinants of bank capital buffers in this region and more precisely on the impact of business cycles. Previous studies on the MENA banking systems focused rather on the possible impact that the implementation of the Basel Accord may exert on bank performance and lending activities (Ben Naceur and Kandil 2009, 2013; Ben Naceur and Omran 2011).
In the next section, we give empirical evidence on the relationship between business cycle and capital buffers in MENA countries’ banking systems and check whether bank size and market power could influence this relationship. For this end, we use a partial adjustment framework that takes into account the existence of capital adjustment costs (Peltzman 1970; Shrieves and Dahl 1992).
4 Estimation Methodology and Sample
4.1 The Partial Adjustment Framework
In order to model the annual change of capital buffers, our model supposes the existence of capital adjustment costs by assuming that banks operate discretionary adjustment to target an optimal level of capital buffer (BUF*) (Estrella 2004; Jokipii and Milne 2008). But the existence of adjustment costs induces banks to partially adjust capital from one period to another, which requires the introduction of a parameter α measuring the speed of adjustment. Consequently, for a period (t), discretionary change of capital buffers for a bank (i) in a country (j) is explained by the difference between optimal capital buffers level and its lagged level:
The ratio BUF is observed annually and measured as the proportion of total capital ratio in excess of the minimum required. We assume that the optimal capital level BUF* depends linearly on a group of exogenous variables (X). So eq. [1] can be rewritten as follows:
As the parameter α1 is equal to (1–α), we expect that higher values of α1 indicate slower speed of adjustment and reciprocally higher capital adjustment costs. The error term εijt is the sum of two independent components, a random country-specific effect μj and a white noise υijt.
4.2 Variables and Hypotheses
To model the relationship between business cycle and bank capital buffers (BUF), we suppose that the level of capital buffers depends on both bank-specific and macroeconomic variables. Among these variables, business cycle (CYCLE) is likely to influence bank capital adjustment decisions. As explained earlier in this paper, different hypotheses may explain how business cycles influence capital buffers. This relationship can also be altered by bank size and market power. Following previous studies, annual growth rate of real GDP (constant US $ for the year 2000) is used to proxy for business cycle. [5] As explained, expected relationship between BUF and CYCLE can be positive or negative.
Moreover, to check whether the impact of business cycle is more or less important during booms and busts, we split the CYCLE variable into two periods of positive and negative changes of the GDP growth rate by creating two dummy variables BOOM and BUST and interacting them with CYCLE. More precisely, for each country, BOOM takes the value of 1 in each year where the annual change of GDP growth rate is positive, while BUST is equal to (1 – BOOM), meaning that it takes the value of 1 when annual change of GDP growth rate is negative. Then, we interact BOOM and BUST with CYCLE to distinguish between boom and bust periods.
Besides, different explanatory bank-specific variables are expected to have an impact on the targeted level of capital buffers BUF*. Indeed, capital buffers can change with bank risk-taking, RISK. This indicator is difficult to measure because market data on assets value are often unavailable. In order to quantify loan quality, we use annual change of non-performing loans to gross loans ratio in order to proxy for the change of loan default risk. While this indicator is an ex post measure of credit risk, it is considered as a pertinent indicator of portfolio quality (Campbell 2007). Besides, bank risk-taking may exert two opposite effects on capital buffers. On the first hand, when unexpected loan losses increase, banks are constrained to improve their capital position. On the other hand, profit-maximizing banks are more prone to decrease capital levels and to increase risk-taking (through higher leverage) in the presence of a deposit insurance system (Merton 1977; Shrieves and Dahl 1992). Hence, we expect either a positive or a negative relationship between RISK and BUF.
In addition, retained earnings are one of the channels used by banks to improve capital levels. When banks realize higher profits, they will be more able to increase capital through retained earnings. This is why we expect a positive correlation between post-tax earnings to total assets (ROA) and BUF. Moreover, capital buffers may depend on bank size for two reasons. First, through larger transaction volumes, big banks realize higher economies of scale and reduce transaction costs in the presence of asymmetric information with costly screening and monitoring of borrowers (Freixas and Rochet 1998; Jopkii and Milne 2008). Second, large banks often benefit from easier access to equity markets allowing them to reduce capital buffers in order to increase leverage. In addition, large banks are also more able to diversify asset risks and to operate with less risk-weighted assets and lower levels of capital buffers. Thus, we expect a negative relationship between SIZE and BUF. As demonstrated by previous research, assets structure can also explain capital buffers change. Accordingly, we introduce the variable NETLOAN measured as the ratio of loans (net of loan loss reserves) to gross loans. Assuming that higher level of net loans is associated with higher risk weights and that banks increase capital to cover unexpected loan losses, we can anticipate a positive link between NETLOAN and BUF.
In addition to credit risk, earnings, size and assets’ structure, market power is also expected to exert significant impact on capital buffers. In fact, banks holding large (credits and deposits) market shares are expected to operate more carefully in order to protect their charter values by decreasing leverage (Keeley 1990). However, inducing banks to increase interest margins, market power is likely to increase borrowers’ moral hazard and risk-taking causing a deterioration of banks’ capital positions (Boyd and Nicolò 2005). To test these hypotheses, we use the Lerner index (LERNER) to approximate bank market power. This indicator of competitiveness is defined as a level indicator measuring the difference between the price and the marginal cost divided by the price. It reflects the capacity of a bank to set product prices above marginal cost. We use the sum of interest and non-interest income to total assets to derive the price of total assets, while a translogarithmic cost function is used to derive marginal cost. [6]
The values taken by the Lerner index ranges between 0 and 1. Higher values mean higher difference between price of bank output and marginal cost, and hence, stronger market power. [7] Several empirical studies found that market power is likely to exert either a positive or a negative impact on bank solvency (Yeyati and Micco 2007; Fonseca and Gonzales 2010; Turk-Ariss 2010; Tabak, Fazio, and Cajueiro 2012; Soedarmono, Machrouh, and Tarazi 2013). Thus, we expect either a positive or a negative relationship between LERNER and BUF.
To differentiate the impact of business cycle on capital buffers according to bank size and market power, we include two interaction variables. Following García-Suarez et al. (2012), a first dummy variable BIG is defined as equal to 1 if, for a bank (i), SIZEit is superior to the median of the variable SIZE for the whole sample. Then, BIG is interacted with CYCLE to test for business cycle effects on the change of capital buffers and risk levels for large-sized banks. In addition, (Bikker et al. 2006) show that bank size and market power are closely related. Hence, following (Saadaoui 2014), we look also for the impact of market power on business cycle effects using the same methodology to construct the second dummy variable HLERNER using the variable LERNER. Then HLERNER is interacted with CYCLE to check if business cycle effects on bank behaviour may also be altered by the level of market power. In fact, as advocated by previous literature, we expect that large banks benefiting from strong market power are more likely to behave in a countercyclical way than small banks for three main reasons: a higher exposition to systemic risks during recessions; higher interest margins and easier access to equity markets which may incite large banks to operate with lower capital buffer levels during expansions; and the problem of too big to fail subsidies which may induce higher moral hazard from large banks.
Moreover, we introduce country-specific effects to capture the heterogeneity of the economic, legal and institutional environment where banks operate, like prudential regulation, financial development, quality of institutions, accounting standards, etc. [8] Consequently, country-specific fixed effects (COUNTRY) are included. The next section presents the initial specifications of the partial adjustment model and provides further information on the selected sample and dataset.
4.3 Model Specification and Estimation Methodology
From the variables defined above, we model the initial specification of the partial adjustment as follows:
We use dynamic panel data in order to consider both individual and time dimensions of observations. In addition to the problem of endogeneity, the lagged dependent variable in the right of eq. [3] is expected to generate a correlation between specific individual effects and explanatory variables. To overcome these problems, following Stolz and Wedow (2011), we use the two-step system GMM, developed by Blundell and Bond (1998). The two-step system GMM overcomes panel data autocorrelation and heteroscedasticity problems. Moreover, as two-step estimates of the standard errors can be downward biased, we apply the Windmeijer’s finite-sample correction of the two-step correlation matrix to get more robust estimations (Windmeijer 2005). In order to overcome correlations of explanatory variables with the error term εijt, we choose as instruments one to four lags of potentially endogenous balance-sheet variables RISK, ROA, SIZE, NETLOAN and CYCLE. [9] In addition, three instrumental variables are introduced in order to overcome endogeneity problems. The instruments are computed using 3-year average of bank loan growth, bank size and economic growth (Shim 2013). Finally, we use the Hansen test of over-identifying restrictions to check the validity of instruments and the Arellano and Bond’s serial correlation test to verify if errors exhibit second-order serial correlation.
The selection procedure of the sample was made carefully to minimize estimation biases generated by the heterogeneity of MENA countries’ financial and banking systems. First, Our study focuses exclusively on commercial banks because they dominate the financial landscape in the MENA region with a share of assets in total financial systems assets standing at 88% in 2006 (Turk-Ariss 2009). Moreover, commercial banks are constrained to common regulatory restrictions which may decrease sample heterogeneity. Then, using the World Bank’s surveys of bank regulation and supervision around the world (Barth et al. 20082012), we select only countries where banking authorities already implement the Basel Committee’s standards. In addition, We retain only banks holding assets of more than 100 million US$ and publishing consolidated data. [10] Finally, we exclude commercial banks for which data are not observable for at least 4 consecutive years and for which the variables of interest (BUF and CYCLE) are unavailable for a sufficient time span.
These selection criteria, in addition to data unavailability on key variables like total capital ratio, non-performing loans and some variables needed to compute the Lerner index, limited the size of the retained sample to 97 banks belonging to 15 countries. [11] We think that this sample is quite representative of MENA countries’ banking systems since the total number of banks in this region reached 128 banks in 2001, including commercial banks, and increased to 172 banks in 2008 (Rocha et al. 2011).
The observation period is selected taking into consideration the importance of business cycle duration. As indicated by Drehman et al. (2010), a whole business cycle can take on average between 4 and 8 years. Accordingly, we opt for an observation period from 2001 to 2008. We intentionally choose to include both the oil boom and the subprime crisis in the observation period in order to verify if boom and bust periods exerted a significant impact on bank capital buffers. Data are obtained from different sources: Bank balance-sheet and income statements data were collected from the BANKSCOPE database, while the World Bank’s WDI database (2010) is used to construct the variable CYCLE.
In the following section we present some statistical properties of the variables included in the model specification. The selected sample is presented in Table 1, where mean values of capital buffers and asset volume are reported.
5 Empirical Findings
5.1 Descriptive Statistics
According to Table 1, in the majority of the countries, selected banks hold, a priori, a sufficient level of capital buffers with a mean for the total sample exceeding 10%. The largest banks are generally based in the GCC countries. In Saudi Arabia, average bank asset volume is about 15 billion US$, while it reaches about 8 billion US$ in Kuwait and 3.5 billion US$ in Bahrain. In North Africa, Morocco’s banks are the largest in the region with an average asset volume of about 6 billion US$. The highest level of bank capital buffers is observed for Yemen with an average regulatory capital exceeding the minimum required level by 18.4 percentage points. But this does not necessarily reflect a sound banking system since that according to our data, the proportion of non-performing to total gross loans exceed 36% in this country. Confirming the empirical findings of Rocha et al. (2011), Table 1 shows that the most vulnerable banking systems are those of Egypt and Tunisia with a level of capital buffers of about 3% which is expected to be insufficient to cover their high levels of non-performing loans (19.8% and 12.7%, respectively). However, GCC countries’ banking systems appear to be more robust than their North African’s counterparts as shown by the relative high level of capital buffers relative to non-performing loans. [12]
Mean values of bank capital buffers and bank size by country.
| Country | Algeria | Bahrain | Egypt | UAE | Jordan | Kuwait | Lebanon | Morocco |
| Capital buffers | 0.136 | 0.134 | 0.036 | 0.102 | 0.067 | 0.053 | 0.129 | 0. 051 |
| Assets (M US$) | 420.1 | 3518.9 | 1954.5 | 3946.9 | 2343.4 | 8034.2 | 1324.1 | 6010.3 |
| Country | Oman | Qatar | Saudi Arabia | Syria | Tunisia | Turkey | Yemen | Total sample |
| Capital buffers | 0.051 | 0.113 | 0.105 | 0.091 | 0.025 | 0.148 | 0.184 | 0.104 |
| Assets (M US$) | 2294.4 | 3316.4 | 14969.4 | 984.8 | 1966.1 | 3242.9 | 236.4 | 2447.0 |
Table 2 presents summary statistics of the variables included in the initial specification. We note that, over the observation period, commercial banks in MENA countries hold a relatively high capital adequacy ratio that exceeds the minimum required level on average by 10.40 p.p. However, banks in this region suffer from high levels of credit risk reaching an average of 10.36% for the overall sample, with a maximum level observed in 2005 for the North African Commercial Bank based in Lebanon. Selected banks realized an average return on asset ratio of 1.44% over the observation period, while the average volume of assets is about 2,447 million US$. Regarding assets structure, the proportion of net loans to total assets stands at 43.40% on average with a maximum observed in 2001 for the Principal Bank based in Egypt. As regards bank competition and market power, the mean of Lerner index equals 37.42% which indicates, as found by Turk-Ariss (2009), that banks in the MENA region operate under monopolistic competition. The maximum value of the average Lerner index per bank is observed for the International Bank of Bahrain. Finally, concerning economic growth used as an indicator of business cycles, MENA countries registered an average GDP growth of 5.3% during the observation period. The worst recession is observed for Turkey in 2001.
Summary statistics for selected variables.
| Variable | Mean | Std. Dev. | Min. | Max. |
| BUF | 0.1040 | 0.1113 | –0.1130 | 0.9140 |
| RISK | 0.1036 | 0.1427 | 0 | 1.2302 |
| ROA | 0.0144 | 0.0298 | –0.3829 | 0.3018 |
| SIZE (Log) | 7.8434 | 1.5443 | 2.9501 | 11.3642 |
| NETLOAN | 0.4340 | 0.1933 | 0.0034 | 0.9166 |
| LERNER | 0.3742 | 0.1585 | 0.0026 | 0.7858 |
| CYCLE | 0.0530 | 0.0330 | –0.0569 | 0.17723 |
5.2 Graphical Analysis
In addition to descriptive statistics, graphical analysis is also helpful in describing the behaviour of bank capital buffers over the business cycle in the MENA region. Graphs 1 and 2 report the evolution of average bank capital buffers and GDP growth for the selected sample since 1997–2009. We can distinguish from Graph 1 a negative co-movement between the two variables. This negative relationship is observable for the whole period but it becomes more obvious between 2002 and 2008, which coincides with the oil boom, where banking systems, especially those established in the GCC countries, have significantly strengthened their credit supply (Barajas et al. 2010; Rocha et al. 2011). In fact, between 2002 and 2008 median GDP growth rate in the MENA region increased from 3.3% to 5.8%, while median capital buffers decreased from about 8% to 4.6%. Graph 2 confirms these results and shows that, in parallel of the rapid economic growth in the MENA region, there was a boom in loan supply between 2002 and 2008 where annual credit growth rate increased from about 5% in 2002 to more than 20% in 2008. These graphics provide some evidence that bank capital buffers and business cycle followed opposed paths before the subprime crisis, probably indicating a countercyclical behaviour of banks during economic upturns.
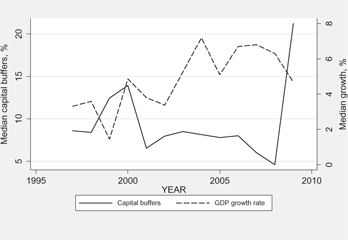
Evolution of bank capital buffers and business cycle.Source: Bankscope, author’s calculations.
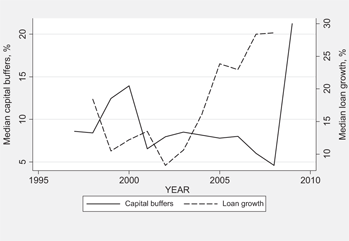
Evolution of bank capital buffers and loan growth.Source: Bankscope, author’s calculations.
However, these graphs must be interpreted cautiously as the co-movement between capital buffers and business cycle may be different between banks depending on their characteristics. In other words, the countercyclical pattern of capital buffers may result essentially from the behaviour of large and internationally active banks like those based in the GCC countries, Turkey, Egypt or Morocco who benefited the most from the economic and oil boom and suffered the most from the subprime crisis. This is what we try to further investigate in the next section using dynamic panel data to test for the existence of a significant impact of business cycle on capital buffers.
5.3 Estimation Results
We present estimation results using two-step GMM system. First, we try to verify if there is a significant relationship between business cycle and capital buffers for the selected MENA countries’ banks. This step is important because starting from these results and their robustness we can assert that capital buffers follow a cyclical pattern. As explained earlier in this paper, both positive and negative co-movements between capital buffers and business cycle are expected. Second, we introduce interaction variables to test whether the relationship between capital buffers and business cycle can change depending on bank size and market power.
5.3.1 Business Cycle and Bank Capital Buffers
Table 3 shows estimation results and robustness tests for eq. [3]. We note that the p-values associated with Hansen’s statistic and Arrelano and Bond’s statistics reject the assumptions of over-identifying restrictions and autocorrelation of second order. Moreover, the dummy COUNTRY for all selected countries is often not significant in almost all model specifications. [13] The results show also the existence of capital adjustment costs for MENA countries’ commercial banks, since that α1 is significantly positive and takes relatively high values.
Concerning our variable of interest, CYCLE, the first column indicates a positive and significant correlation to capital buffers at 95% confidence level. In fact, an increase of CYCLE by 1 p.p induces an increase of BUF by 0.2086 p.p. This result does not support the hypothesis of a countercyclical behaviour of banks in the MENA countries during the observation period, contrary to the findings of (Saadaoui 2014) for the case of other emerging countries (Asian, Latin American and East European countries). This result contrasts also with that found by (García-Suaza et al. 2012) and Tabak et al. (2011) for Colombian and Brazilian banks, respectively. Theoretically, we can explain this contradiction with previous findings in emerging countries by the fact that MENA countries’ banks rationally anticipate the accumulation of loan losses during economic upturns by strengthening their capital buffers. This, in turn, will make them more able to cover loan losses during downturns. In addition, an under-provisioning of expected losses could induce banks to consume more capital during downturns and also give rise to a positive co-movement between BUF and CYCLE. This positive co-movement can be also explained by a decrease of the cost of equity capital during upturns. Practically, business cycles could exert different impacts on capital behaviour of banks depending on their level of international financial integration. This probably explains why MENA banking systems are less exposed to business cycle fluctuations than Latin American, Asian or East European banking systems. However, if all these arguments were pertinent, we could expect that this behaviour will be observed for all MENA banks and will not depend on their specific characteristics. However, a positive co-movement between capital buffers and business cycle was previously found by Jokipii and Milne (2008) for relatively small cooperative banks based in Europe and for accession countries’ banks (Eastern European Banks). Intuitively, we argue that this positive relationship between BUF and CYCLE could be due to the fact that MENA banking systems are dominated by small locally active banks, less exposed to systemic risk than large internationally active ones. Moreover, small banks face more difficulties in accessing equity markets than large banks, which constrain them to operate with higher capital buffers during upturns in order to reduce the cost of recapitalization during downturns (García-Suaza et al. 2012). We explore this issue more deeply in the next subsection.
As regards control variables, column (1) indicates that the ratio of non-performing loans (RISK) exerts a positive and significant impact on BUF at 95% confidence level, showing that banks tend to increase capital buffers in response to an increase of credit risk. This result contradicts that found by (Ayuso et al. 2004) for the case of Spanish banks, but it is similar to those found for the case of American, European, Brazilian, Colombian and other emerging countries’ banks (Saadaoui 2014; Shim 2013; García-Suaza et al. 2012; Tabak, Noronha, and Cajueiro 2011; Jokipii and Milne 2008). Moreover, asset structure is also an important determinant of capital buffers, since NETLOAN is negatively and significantly related to BUF. The proportion of net loans in total gross loans is associated with higher risk weights and consequently negatively affects the level of capital buffers. This result supports those of Jokipii and Milne (2008), Fonseca and Gonzales (2010), (García-Suaza et al. 2012) and (Saadaoui 2014).
Capital buffers and business cycle.
| (1) | (2) | (3) | (4) | (5) | (6) | |
| BUFt–1 | 0.5186*** | 0.5145*** | 0.4712*** | 0.4487*** | 0.5100*** | |
| (0.000) | (0.000) | (0.000) | (0.000) | (0.000) | ||
| EQUITYt–1 | 0.6235*** | |||||
| (0.000) | ||||||
| RISK | 0.1067** | 0.1061** | 0.0481 | 0.0618** | 0.0539 | 0.1070** |
| (0.043) | (0.028) | (0.229) | (0.028) | (0.239) | (0.050) | |
| SIZE | –0.1098 | –0.0400 | –0.4035 | –0.2419 | –1.8568*** | –0.0434 |
| (0.731) | (0.905) | (0.497) | (0.258) | (0.001) | (0.861) | |
| ROA/ROE | 0.3111 | 0.4113 | 0.6661** | 1.0348*** | 0.3392 | –0.0324 |
| (0.457) | (0.217) | (0.018) | (0.002) | (0.401) | (0.555) | |
| NETLOAN/LOAN | –0.1460*** | –0.1593*** | –0.1580** | –0.0217 | –0.1609*** | –0.1467** |
| (0.009) | (0.003) | (0.029) | (0.347) | (0.009) | (0.022) | |
| LERNER | 0.2526** | 0.2733** | 0.3359* | 0.0768 | 1.2994*** | 0.2589** |
| (0.023) | (0.020) | (0.052) | (0.261) | (0.000) | (0.010) | |
| CYCLE | 0.2086** | 0.1720** | 0.1857* | 0.1949* | ||
| (0.036) | (0.047) | (0.084) | (0.060) | |||
| BOOM × CYCLE | 0.0825 | |||||
| (0.317) | ||||||
| BUST × CYCLE | 0.2676** | |||||
| (0.030) | ||||||
| LERNER² | –0.0143*** | |||||
| (0.000) | ||||||
| No. observations/no. banks | 526/97 | 526/97 | 526/97 | 635/105 | 526/97 | 526/97 |
| Hansen p-value | 0.694 | 0.664 | 0.828 | 0.812 | 0.507 | 0.869 |
| AR(1)/AR(2) | 0.011/0.863 | 0.012/0.782 | 0.013/0.832 | 0.037/0.588 | 0.012/0.836 | 0.013/0.860 |
Moreover, the variable LERNER is positively and significantly correlated to BUF with a 95% confidence level. In line with those found, among others, by Turk-Ariss (2010) and (Saadaoui 2014) for developing countries, this result shows that banks with large shares of credit and deposit markets operate with higher level of capital buffers. Hence, market power is likely to strengthen the robustness of MENA countries’ banks.
In columns (2)–(7) we run different sensitivity and robustness tests to check whether a change in the specification could influence the impact of the business cycle on capital buffers. We begin by distinguishing between periods where the GDP growth rate is positive (BOOM) and observations where GDP growth rate is negative (BUST), in order to further investigate the relationship between CYCLE and BUF. As reported in columns (2) and (3), the positive and significant coefficients related to the interaction term BUST × CYCLE indicate that a procyclical behaviour of capital buffers is observed during downturns while in boom periods there is no significant relationship between business cycle and capital buffers. Hence, the impact of the business cycle on capital buffers is asymmetric.
We also run additional sensitivity tests by including new variables in the model. First, we use the equity to total assets ratio (EQUITY) as an alternative dependent variable. Even if this ratio is slightly different from capital buffers ratio, it is expected to give further information on how banks adjust capital levels over the business cycle. [14] In addition, the variable EQUITY is easier to construct as it is more available than the total capital ratio used to compute BUF. This, in turn, is likely to improve the number of observations and to provide more robust estimations. This is confirmed in column (4) where the number of bank-year observations rises to 635. The results show that the variable CYCLE is positively and significantly correlated to EQUITY. A 1 p.p increase of CYCLE induces banks to increase their equity ratio by 0.17 p.p which is almost equal to the coefficient found for the variable BUF in the initial specification (0.20 p.p). This result indicates once again that bank capital level in the MENA countries is positively and significantly correlated to economic performance. Column (4) indicates also that the equity ratio depends positively on the levels of credit risk (RISK) and earnings (ROA), while the variables NETLOAN and LERNER do not exert significant impact.
In order to test if market power exerts different impacts at different levels on bank capital buffers, the quadratic term of the Lerner index (LERNER2) is introduced. Results in column (5) show that CYCLE is still positively correlated to BUF. Moreover, there is an evidence of a significant non-linear relationship between capital buffers and market power. The negative sign of the coefficient related to LERNER2 shows that at high level of market power, an increase of LERNER induces a decrease in BUF. It is shown indeed that market power improves bank soundness until a given threshold after which for banks with high market power, a marginal increase of market shares is likely to induce them to hold less capital buffers. This result challenges the findings of (Saadaoui 2014) and Tabak, Fazio, and Cajueiro (2012), who found a U-shaped relationship between market power and capital buffers for emerging countries (excluding MENA countries) and Brazilian banks, respectively. In the same column, we note also that the variable SIZE becomes for the first time negatively correlated to BUF with a 99% confidence level. This corroborates the fact that large banks are more likely to operate with lower levels of capital buffers.
Finally, in column (6) the asset structure variable NETLOAN is replaced by the ratio of gross loans to total assets (LOAN). The ratio ROA is also replaced by the return on equity ratio ROE (post-tax income on total equity) as an indicator of profitability. However, the ROE ratio is expected to have both positive and negative impacts on BUF as it is expected to capture the cost of capital in addition to bank profitability. [15] Results in column (6) show that the relationship between CYCLE and BUF remains positive even after the introduction of the two new variables. Assets structure is found, again, to be a major determinant of bank capital buffers since an increase in the proportion of loans deteriorates the level of capital buffers probably through an increase of risk-weighted assets. However, the variable ROE does not influence significantly the dependent variable.
To summarize, from Table 3 we note that capital adjustment to desired levels is costly for MENA countries’ banks and that credit risk, profitability, market power and assets structure are the important determinants of capital buffers. Concerning our main focus in this paper, estimation results and sensitivity checks confirm the existence of a positive co-movement of bank capital buffers with the business cycle. This result, a priori, does not support the implementation of the Basel Committee’s countercyclical capital requirements in the MENA countries’ banking systems. However, this finding remains questionable since we can find divergences in capital buffers behaviour over the business cycle between banks depending on their size and market power. We investigate this issue in the following section.
5.3.2 Impacts of Bank Size and Market Power
Table 4 reports estimation results related to the relationship between capital buffers and the business cycle using a set of interaction terms. Following (García-Suaza et al. 2012) and (Saadaoui 2014), the purpose is to check whether large banks and banks with high market power are more or less exposed to business cycle fluctuations than other banks. As explained above, we use the medians of SIZE and LERNER (2,410.115 million US$ and 34.15%, respectively) to differentiate banks according to their asset volume and market power. Moreover, for robustness matters, we re-estimate the model using fourth quartiles of SIZE and LERNER (7,766.485 million US$ and 51.69%) as alternative thresholds, denoted BIGQ4 and LERNERQ4, respectively. Table 4 reports also sensitivity tests to verify whether our results are robust to the introduction of new variables in the model.
In columns (7) and (8), we begin by analysing the impact of bank size on the relationship between CYCLE and BUF by introducing the size dummies (BIG and BIGQ4) and their interactions with CYCLE in the same specifications. Estimation results indicate, once again, the existence of capital buffers’ adjustment costs with a speed of adjustment almost the same as reported in Table 3. We note that profitability, asset structure, credit risk and market power are still significant determinants of bank capital buffers. Our variable of interest, CYCLE, is still positively and significantly correlated to BUF, rejecting the hypothesis of a countercyclical behaviour of capital buffers in the selected MENA countries’ banks. But if we look at the impact of bank size on the relationship between business cycle and capital buffers, we note that the interaction term BIG × CYCLE is negatively and significantly correlated to BUF, implying a strong negative impact exerted by business cycles on capital buffers of large banks. In other words, while a 1 p.p increase of CYCLE induces an average increase of BUF by 0.4317 p.p, its impact on large banks is significantly different. In fact, results in column (7) show a decrease of BUF by |0.4317–0.6349| = 0.2032 p.p for large banks subsequent to an increase of CYCLE by 1 p.p. However, the interaction term BIGQ4 × CYCLE does not produce significant impact on capital buffers (column (8)).
Bank cyclical behaviour: impacts of bank size and market power.
| EQUITY | ||||||||
| (7) | (8) | (9) | (10) | (11) | (12) | (13) | (14) | |
| BUFt–1/EQUITYt–1 | 0.4749*** | 0.5625*** | 0.5249*** | 0.5848*** | 0.4725*** | 0.4162*** | 0.5093*** | 0.5899*** |
| (0.000) | (0.000) | (0.000) | (0.000) | (0.000) | (0.000) | (0.000) | (0.000) | |
| RISK | 0.1127*** | 0.0872* | 0.1488*** | 0.1064* | –0.0057 | –0.0165 | 0.0451** | 0.0410* |
| (0.006) | (0.092) | (0.000) | (0.074) | (0.855) | (0.653) | (0.023) | (0.065) | |
| SIZE | 0.3945 | 0.2694 | –0.2872 | –0.1915 | ||||
| (0.135) | (0.100) | (0.189) | (0.276) | |||||
| BIG | 2.5868 | 1.3976 | ||||||
| (0.283) | (0.326) | |||||||
| BIGQ4 | –1.5208 | 0.1092 | ||||||
| (0.423) | (0.963) | |||||||
| ROA | 0.7103** | 0.6765*** | 0.8707*** | 0.3679 | 1.1184*** | 1.1266*** | 1.0952*** | 1.0389*** |
| (0.011) | (0.006) | (0.002) | (0.282) | (0.000) | (0.000) | (0.002) | (0.001) | |
| NETLOAN | –0.1786*** | –0.1191** | –0.1750* | –0.0722** | –0.0311 | –0.0288 | –0.0033 | 0.0231 |
| (0.000) | (0.015) | (0.068) | (0.021) | (0.338) | (0.421) | (0.922) | (0.387) | |
| LERNER | 0.2427*** | 0.1860*** | 0.0984* | 0.1465** | ||||
| (0.003) | (0.000) | (0.094) | (0.014) | |||||
| HLERNER | 6.2755 | 5.1790** | ||||||
| (0.331) | (0.021) | |||||||
| LERNERQ4 | 6.3441* | 2.5297 | ||||||
| (0.095) | (0.216) | |||||||
| CYCLE | 0.4317* | 0.1020 | 0.4410** | 0.4159** | 0.4520*** | 0.2778** | 0.3327* | 0.2713* |
| (0.056) | (0.408) | (0.042) | (0.023) | (0.001) | (0.048) | (0.081) | (0.065) | |
| BIG × CYCLE | –0.6349** | –0.6485*** | ||||||
| (0.039) | (0.000) | |||||||
| BIGQ4 × CYCLE | –0.2999 | –0.8333** | ||||||
| (0.369) | (0.036) | |||||||
| HLERNER × CYCLE | –0.4362* | –0.2667 | ||||||
| (0.071) | (0.227) | |||||||
| LERNERQ4 × CYCLE | –0.6200* | –0.2297* | ||||||
| (0.067) | (0.086) | |||||||
| No. observations/no. banks | 526/97 | 526/97 | 635/105 | 635/105 | ||||
| Hansen p-value | 0.570 | 0.804 | 0.577 | 0.677 | 0.606 | 0.901 | 0.774 | 0.725 |
| AR(1)/AR(2) | 0.016/0.884 | 0.001/0.728 | 0.013/0.769 | 0.008/0.819 | 0.033/0.165 | 0.028/0.978 | 0.045/0.625 | 0.042/0.632 |
Our findings are similar to those obtained by (García-Suaza et al. 2012) for Colombian banks. They found indeed that large banks respond more intensely to changes of GDP growth (with a coefficient equal to −1.253 p.p) through a countercyclical behaviour similar (although stronger) to our result for MENA countries’ banks.
Now we focus on the impact of bank market power on the relationship between CYCLE and BUF. We expect that market power will exert the same impact as bank size, since, according to the literature, these two variables are closely related (Bikker et al. 2006). In columns (9) and (10), we reintroduce the variable SIZE, including the market power dummies (HLERNER and LERNERQ4) with the interaction terms HLERNER × CYCLE and LERNERQ4 × CYCLE. As regards the impact of control variables, we do not notice any significant change in comparison to previous results. There is still a strong impact exerted by credit risk, asset structure and profitability on capital buffers. Besides, in columns (9) and (10), we observe again a positive and significant relationship between CYCLE and BUF with coefficients equal to 0.4410 p.p and 0.4159 p.p, respectively. But this relationship turns to be negative when interacting CYCLE with HLERNER. Column (9) indicates that, globally, the positive impact of CYCLE on BUF is strongly reduced for banks holding large market shares with a low coefficient equal to |0.4410–0.4362| = 0.0048 p.p. This result indicates, once again, that banks with high market power are more inclined to behave in a countercyclical way. This is confirmed when we introduce the second interaction term LERNERQ4 × CYCLE. Column (10) shows that banks having a very high Lerner index reduce their capital buffers by |0.4159–0.6200| = 0.2041 p.p in response to an increase of real GDP growth by 1 p.p. These findings are in sharp contrast with those found by (Saadaoui 2014) for Asian, East European (and Turkey) and Latin American banks. In these regions, banking systems are on average larger (in term of asset volume), and more open to foreign competition, and thus more internationally integrated, than MENA banking systems. The financial context in which they operate may expose them to business cycle fluctuation, but with weaker effects on banks with strong market power as they are less vulnerable to losses in charter values due to stronger competition. [16]
For robustness check, we substitute in columns (11) and (12) the dependent variable BUF by the ratio EQUITY and use the interaction terms BIG × CYCLE and HLERNER × CYCLE. As the numerator of EQUITY contains the most liquid capital instruments, its change over the business cycle is very important on the regulatory side. According to the results, we note that the impacts of credit risk and bank profitability on EQUITY are almost the same as those exerted on BUF. However, NETLOAN and SIZE are non-significant, while the variable LERNER keeps its positive and significant impact as previously found. Regarding the impact of the interaction term BIG × CYCLE on the equity ratio, it remains very similar to that exerted on capital buffers as indicated in column (11). An increase of CYCLE by 1 p.p induces a decrease of EQUITY by |0.4520 – 0.6485| = 0.1965 p.p for large banks. The alternative interaction term BIGQ4 × CYCLE, as noted in column (12), produces an even more important impact on EQUITY. Very large banks appear indeed to reduce equity ratio by |0.2778–0.8333| = 0.5555 p.p in reaction to an increase of CYCLE by 1 p.p. Consequently, these results imply two important implications for MENA banking systems: first, contrary to small banks, large banks behave in a countercyclical way; and second countercyclical behaviour becomes more evident for very large banks. This finding supports also the results of Jokipii and Milne (2008) who found that the negative impact of GDP growth on capital buffers is evident for commercial (large) banks, while its impact is positive on cooperative (small) banks based in Europe and on (relatively small) banks based in the 10 accession countries that joined the European Union in 2005.
As regards the impact of market power, in columns (13) and (14) we note that, similarly to the results found for the dependent variable BUF, banks with high market power are expected to be more prone to adjust downward equity ratio during upturns and upwards during recessions. While the coefficient related to HLERNER × CYCLE shows the expected but non-significant sign, results in column (14) indicate that an increase of CYCLE by 1 p.p induces a much lower increase of EQUITY for banks with very high market power, which stands at |0.2713 – 0.2297| = 0.0416 p.p while the average impact is equal to 0.2713 p.p.
In sum, we can conclude that economic conditions are likely to affect capital behaviour of MENA countries’ commercial banks in different ways. More precisely, while, on average, the business cycle exerts a significant positive impact on capital buffers of MENA countries’ banks, this impact turns to be slightly positive or even negative for large banks and banks with high market power. As explained in the beginning of this paper, this countercyclical capital behaviour of large banks and banks with strong market power, by hampering credit supply, can be very detrimental for the real economy. Credit stagnation subsequent to the subprime crisis, observed especially in the most open and developed MENA banking systems, after more than 5 years of a persistent high credit growth, is an example of an actual manifestation of these results. As explained previously, the high exposition of large banks to systematic risk, their low capital adjustment cost and the “too big to fail” subsidies are likely to explain why capital buffers of large banks and banks with strong market power are more responsive to business cycles.
6 Conclusion
Since the occurrence of the subprime crisis, the adoption of macro-prudential regulatory tools for internationally active banks became a central issue largely debated in the literature. The Basel Committee decided to introduce different regulatory measures in order to reduce banking systems exposition to systemic risks. Countercyclical capital buffers are among the important macro-prudential tools expected to strengthen the new Basel regulatory framework and to be adopted progressively by banking authorities of member countries in the next few years. According to this countercyclical capital requirement, banks are expected to reinforce their capital positions during economic and credit expansions in order to avoid credit crunches during recessions. This constitutes a regulatory response to a negative co-movement between business cycles and capital buffers observed in several countries. Empirical evidence on such a countercyclical behaviour exists especially for developed countries’ members of the Basel Committee. Recently, research started focusing on emerging countries’ banking systems. Banking institutions in Brazil and Columbia, for example, were found to behave in a countercyclical way by adjusting capital buffers downwards during economic upturns and reducing credit supply in recessions which gives support to the implementation of countercyclical capital requirements in these countries especially for large banks (García-Suaza et al. 2012; Tabak, Noronha, and Cajueiro 2011). These findings were corroborated by (Saadaoui 2014) for a large sample of emerging and developing countries’ banking systems (excluding MENA countries), who found also that market power is an important determinant of bank behaviour during business cycles. This study focused on the impact of the business cycle on bank capital buffers in the MENA banking systems. Special interest is also given to the impact of bank size and market power on the cyclical behaviour of banks, as banking systems in this region are heterogeneous and large banks and banks with high market power are expected to be differently reactive to business cycle than small banks.
The results give significant support to a positive relationship between the business cycle and bank capital buffers in these countries, indicating that MENA banking systems are less exposed than other emerging countries to systemic risks arising from a negative co-movement between economic growth and capital buffers. Hence, contrary to the previous empirical findings focusing mainly on East (and Central) European, Asian and Latin American banking systems, our results are, a priori, unfavourable to the implementation of the Basel Committee’s countercyclical capital standards in the MENA region. However, results indicate also that not all banks show the same sensitivity to the business cycle. In fact, contrary to small banks, large banks and those with high market power appear to adjust their capital buffers rather in a countercyclical way. These findings appear also to be robust to several sensitivity and robustness checks, suggesting that the implementation of countercyclical capital requirements in the MENA countries should not be done in a homogeneous way without considering differences in size and market power between banks. Small banks, less exposed to systemic risk, could suffer from such countercyclical requirements and will probably reduce their loan supply to suboptimal levels during economic expansions in response to an increase of regulatory capital buffers. However, the countercyclical behaviour of capital buffers for large banks gives support to the implementation of such requirements in order to avoid credit crunch during recessions.
References
Atici, G., and G.Gursoy. 2012. “The Determinants of Capital Buffer in the Turkish Banking System.” International Business Research6 (1):224–34.10.5539/ibr.v6n1p224Suche in Google Scholar
Ayuso, J., D.Pérez, and J.Saurina. 2004. “Are Capital Buffers Procyclical? Evidence from Spanish Panel Data.” Journal of Financial Intermediation13 (2):249–64.10.1016/S1042-9573(03)00044-5Suche in Google Scholar
Barajas, A., R.Chami, R.Espinoza, and H.Hesse. 2010. “Recent Credit Stagnation in the MENA Region: What to Expect? What Can Be Done?” IMF working paper 219.10.2139/ssrn.1750707Suche in Google Scholar
Barth, R. J., G.Caprio Jr, and R.Levine. 2008. “Bank Regulations Are Changing: But for Better or Worse?” World Bank, policy research working paper 4646.10.1596/1813-9450-4646Suche in Google Scholar
Barth, R. J., G.Caprio Jr, and R.Levine. 2012. “The Evolution and Impact of Bank Regulations.” World Bank, policy research working paper 6288.10.1596/1813-9450-6288Suche in Google Scholar
Basel Committee on Banking Supervision. 2010. “Countercyclical Capital Buffer Proposal.” Consultative Document (July).Suche in Google Scholar
Ben Naceur, S., and M.Kandil. 2009. “The Impact of Capital Requirements on Banks’ Cost of Intermediation and Performance: The case of Egypt.” Journal of Economics and Business61:70–89.10.1016/j.jeconbus.2007.12.001Suche in Google Scholar
Ben Naceur, S., and M.Kandil. 2013. “Basel Capital Requirements and Credit Crunch in the MENA Region.” International Monetary Fund working paper, WP/13/160 (July).10.5089/9781475586275.001Suche in Google Scholar
Ben Naceur, S., and M.Omran. 2011. “The Effects of Bank Regulations, Competition, and Financial Reforms on Banks’ Performance.” Emerging Markets Review12:1–20.10.1016/j.ememar.2010.08.002Suche in Google Scholar
Berger, A. N., R. J.Herring, and G. P.Szegö. 1995. “The Role of Capital in financial Institutions.” Journal of Banking and Finance19:393–430.10.1016/0378-4266(95)00002-XSuche in Google Scholar
Bikker, J., and P.Metzemakers. 2005. “Bank Provisioning Behaviour and Procyclicality.” Journal of International Financial Markets, Institutions and Money15:141–57.10.1016/j.intfin.2004.03.004Suche in Google Scholar
Bikker, J. A., and P. A.Metzemakers. 2007. “Is Bank Capital Procyclical? A Cross-Country Analysis.” Credit and Capital Markets40 (2):225–64.10.3790/ccm.40.2.225Suche in Google Scholar
Bikker, J., L.Spierdijk, and P.Finnie. 2006. “Impact of Bank Size on Market Power.” DNB Working Papers 120, Netherlands Central Bank.Suche in Google Scholar
Blundell, R., and S. R.Bond. 1998. “Initial Conditions and Moment Restrictions in Dynamic Panel Data Models.” Journal of Econometrics87:115–43.10.1016/S0304-4076(98)00009-8Suche in Google Scholar
Borio, C., C.Furfine, and P.Lowe. 2001. “Procyclicality of the financial System and the financial Stability: Issues and Policy Options.” Bank for International Settlements (BIS) Paper 1.Suche in Google Scholar
Boucinha, M., and N.Ribeiro. 2007. “The Determinants of Portuguese Bank’s Capital Buffers.” Financial Stability Report, Banco de Portugal.Suche in Google Scholar
Boyd, J. H., and G. De.Nicoló. 2005. “The Theory of Bank Risk Taking and Competition Revisited.” Journal of FinanceLX:1329–43.10.1111/j.1540-6261.2005.00763.xSuche in Google Scholar
Boyreau-Debrey, G., and S-J., Wei. 2005. “The pitfalls of state-dominated financial system: The case of China.” National Bureau for Economic Research working paper, 11214 (March).10.3386/w11214Suche in Google Scholar
Campbell, A.2007. “Bank Insolvency and the Problem of Nonperforming Loans.” Journal of Banking Regulation9:25–45.10.1057/palgrave.jbr.2350057Suche in Google Scholar
Caruana, J.2010. “Basel III: Towards a Safer Financial System.” Speech at the 3rd Santander international banking conference, Madrid.Suche in Google Scholar
Coffinet, J., V.Coudert, A.Pop, and C.Pouvelle. 2012. “Two-Way Interplays between Capital Buffers and Credit Growth: Evidence from French Banks.” Journal of International Financial Markets, Institutions and Money22:1110–25.10.1016/j.intfin.2012.05.011Suche in Google Scholar
Curry Timothy, J., G. S.Fissel, and G. A.Hanweck. 2008. “Is There Cyclical Bias in Bank Holdings Company Risk Ratings?” Journal of Banking and Finance32:1297–309.10.1016/j.jbankfin.2007.11.009Suche in Google Scholar
Demsetz, R. S., and P. E.Strahan. 1997. “Diversification, Size, and Risk at Bank Holding Companies.” Journal of Money, Credit and Banking29:300–13.10.2307/2953695Suche in Google Scholar
Dinç, S.I.2005. “Politicians and Banks: Political Influences on Government-owned Banks in Emerging Markets.” Journal of Financial Economics77:453–79.10.1016/j.jfineco.2004.06.011Suche in Google Scholar
Drehmann, M., C.Borio, L.Gambacorta, G.Jiménez, and C.Trucharte. 2010. “Countercyclical Capital Buffers: Exploring Options.” Bank for International Settlements working paper, 317 (July).10.2139/ssrn.1648946Suche in Google Scholar
Elizalde, A., and R.Repullo. 2007. “Economic and Regulatory Capital. What Is the Difference?” International Journal of Central Banking3:87–117.Suche in Google Scholar
Estrella, A.2004. “The Cyclical Behavior of Optimal Bank Capital.” Journal of Banking and Finance28:1469–98.10.1016/S0378-4266(03)00130-4Suche in Google Scholar
Farazi, S., E.Feyen, and R.Rocha. 2011. “Bank Ownership and Performance in the Middle East and North Africa Region.” The World Bank Policy Research Working Paper, 5620 (April).10.1596/1813-9450-5620Suche in Google Scholar
Financial Stability Institute. 2014. “FSI Survey: Basel II, 2.5, III implementation”, Bank for International Settlements, July.Suche in Google Scholar
Fonseca, A. R., and F.González. 2010. “How Bank Capital Buffers Vary Across Countries: The Influence of Cost of Deposits, Market Power and Bank Regulation.” Journal of Banking and Finance34:892–902.10.1016/j.jbankfin.2009.09.020Suche in Google Scholar
Freixas, X., and C. J.Rochet. 1998. Microeconomics of Banking. Cambridge, MA: MIT Press.Suche in Google Scholar
García-Suaza, A. F., J. E.Gómez-Gonzales, A. M.Pabón, and F.Tenjo-Galarza. 2012. “The Cyclical Behavior of Bank Capital Buffers in an Emerging Economy: Size Does Matter.” Economic Modelling29:1612–17.10.1016/j.econmod.2012.05.021Suche in Google Scholar
Grosse, S., and E.Schumann. 2013. “Cyclical Behavior of German Banks’ Capital Resources and the Countercyclical Buffer of Basel III.” European Journal of Political Economy, Supplement June2014 (34):40–4.Suche in Google Scholar
Guidara, A., V. S.Lai, I.Soumaré, and F. T.Tchana. 2013. “Banks’ Capital Buffer, Risk and Performance in the Canadian Banking System: Impact of Business Cycles and Regulatory Changes.” Journal of Banking & Finance37 (9):3373–87.10.1016/j.jbankfin.2013.05.012Suche in Google Scholar
Huang, X., and Q.Xiong. 2014. “Bank Capital Buffer Decisions under Macroeconomic Fluctuations: Evidence for the Banking Industry of China.” International Review of Economics & Finance36:30–9.10.1016/j.iref.2014.11.005Suche in Google Scholar
Hughes, J. P., W.Lang, L. J.Mester, and C.-G.Moon. 1996. “Efficient Banking under Interstate Branching.” Journal of Money, Credit and Banking28:1045–71.10.2307/2077940Suche in Google Scholar
Iveta, Ř.2012. “Market Power in the Czech Banking Sector.” Journal of Competitiveness4:143–55.10.7441/joc.2012.01.11Suche in Google Scholar
Jackson, P.1999. “Capital Requirements and Bank Behavior: The Impact of the Basel Accord.” Working paper, BIS 1.Suche in Google Scholar
Jokipii, T., and A.Milne. 2008. “The Cyclical Behaviour of European Bank Capital Buffers.” Journal of Banking and Finance32:1440–51.10.1016/j.jbankfin.2007.12.001Suche in Google Scholar
Keeley, M. C.1990. “Deposit Insurance, Risk, and Market Power in Banking.” American Economic Review5:1183–200.Suche in Google Scholar
Lindquist, K.-G.2004. “Banks Buffer Capital: How Important Is Risk?” Journal of International Money and Finance23:493–513.10.1016/j.jimonfin.2004.01.006Suche in Google Scholar
Lowe, P.2002. “Credit Risk Measurement and Procyclicality.” BIS working paper 116.10.2139/ssrn.846268Suche in Google Scholar
Marcucci, J., and M.Quagliariello. 2008. “Is Bank Portfolio Riskiness Procyclical? Evidence from Italy Using a Vector Autoregression.” Journal of International Financial Markets, Institutions and Money18:46–63.10.1016/j.intfin.2006.05.002Suche in Google Scholar
Marcus, A. J.1983. “The Bank Capital Decision: A Time Series-Cross Section Analysis.” The Journal of Finance38:1217–32.Suche in Google Scholar
Maudós, J. and J.F.De Guevara. 2004. “Factors Explaining the Interest Margin in the Banking Sectors of the European Union.” Journal of Banking and Finance28:2259–81.10.1016/j.jbankfin.2003.09.004Suche in Google Scholar
Merton, R. C.1977. “An Analytic Derivation of the Cost of Deposit Insurance and Loan Guarantees.” Journal of Banking and Finance1:512–20.Suche in Google Scholar
Milne, A.2004. “The Inventory Perspective on Bank Capital.” Cass Business School working paper, August. http://papers.ssrn.com/sol3/papers.cfm?abstract_id=576062.Suche in Google Scholar
Myers, S. C., and N. S.Majluf. 1984. “Corporate financing and Investment Decisions When Firms Have Information That Investors Do Not Have.” Journal of Financial Economics13:187–222.10.1016/0304-405X(84)90023-0Suche in Google Scholar
Price water house Coopers LLP. 2014. IFRS adoption by country. (October). http://www.pwc.com/en_US/us/issues/ifrs-reporting/publications/assets/pwc-ifrs-by-country-2014.pdf.Suche in Google Scholar
Peltzman, S.1970. “Capital Investment in Commercial Banking and Its Relationship to Portfolio Regulation.” Journal of Political Economy78:l–26.10.1086/259597Suche in Google Scholar
Rocha, R. R., Z.Arvai, and S.Farazi. 2011. “Financial Access and Stability: A Road Map for the Middle East and North Africa.” International Bank for Reconstruction and Development. World Bank.10.1596/9780821388358_CH01Suche in Google Scholar
Ruckes, M.2004. “Bank Competition and Credit Standards.” The Review of Financial Studies17:1074–102.10.1093/rfs/hhh011Suche in Google Scholar
Saadaoui, Z.2014. “Business Cycle, Market Power and Bank Behaviour in Emerging Countries.” International Economics139:109–32.10.1016/j.inteco.2014.04.001Suche in Google Scholar
Saunders, A., and B.Wilson. 2001. “An Analysis of Bank Charter-Value and Risk-Constraining Incentives.” Journal of Financial Services Research19:185–95.10.1023/A:1011163522271Suche in Google Scholar
Schaeck, K., M.Cihak, and S.Wolfe. 2009. “Are More Competitive Banking Systems More Stable?” Journal of Money, Credit and Banking41:711–34.Suche in Google Scholar
Shim, J.2013. “Bank Capital Buffer and Portfolio Risk: The Influence of Business Cycle and Revenue Diversification.” Journal of Banking and Finance37:761–72.10.1016/j.jbankfin.2012.10.002Suche in Google Scholar
Shrieves, R. E., and D.Dahl. 1992. “The Relationship between Risk and Capital in Commercial Banks.” Journal of Banking and Finance16:439–57.10.1016/0378-4266(92)90024-TSuche in Google Scholar
Soedarmono, W., F.Machrouh, and A.Tarazi. 2013. “Bank Competition, Crisis and Risk Taking: Evidence from Emerging Markets in Asia.” Journal of International Financial Markets, Institutions and Money23:196–221.10.1016/j.intfin.2012.09.009Suche in Google Scholar
Stolz, S., and M.Wedow. 2011. “Banks’ Regulatory Capital Buffer and the Business Cycle: Evidence for Germany.” Journal of Financial Stability7:98–110.10.1016/j.jfs.2009.09.001Suche in Google Scholar
Tabak, B. M., D. M.Fazio, and D. O.Cajueiro. 2012. “The Relationship between Banking Market Competition and Risk-Taking: Do Size and Capitalization Matter?” Journal of Banking and Finance36:3366–81.10.1016/j.jbankfin.2012.07.022Suche in Google Scholar
Tabak, B. M., A. C.Noronha, and D.Cajueiro. 2011. “Bank Capital Buffers, Lending Growth and Economic Cycle: Empirical Evidence for Brazil.” BIS CCA conference on monetary policy, financial stability and the business cycle, Basel, Switzerland, May.Suche in Google Scholar
Tahari, A., P.Brenner, E.De Vrijer, M.Moretti, A.Senhadji, G.Sensenbrenner, and J.Solé. 2007. “Financial Sector Reforms and Prospects for Financial Integration in Maghreb Countries.” IMF working paper 125.10.2139/ssrn.995626Suche in Google Scholar
Turk-Ariss, R.2009. “Competitive Behavior in Middle East and North Africa Banking Systems.” The Quarterly Review of Economics and Finance49:693–710.10.1016/j.qref.2008.03.002Suche in Google Scholar
Turk-Ariss, R.2010. “On the Implications of Market Power in Banking: Evidence from Developing Countries.” Journal of Banking and Finance34 (4):765–75.10.1016/j.jbankfin.2009.09.004Suche in Google Scholar
Windmeijer, F.2005. “A Finite Sample Correction for the Variance of Linear Efficient Two-Step GMM Estimators.” Journal of Econometrics126:25–51.10.1016/j.jeconom.2004.02.005Suche in Google Scholar
Yeyati, E. L., and A.Micco. 2007. “Concentration and Foreign Penetration in Latin American Banking Sectors: Impact on Competition and Risk.” Journal of Banking and Finance31:1633–47.10.1016/j.jbankfin.2006.11.003Suche in Google Scholar
©2015 by De Gruyter
Artikel in diesem Heft
- Frontmatter
- Research Articles
- Public Spending and Education Attainment in the Middle East and North Africa
- Determinants of Total Factor Productivity in the Middle East and North Africa
- The Cyclical Behaviour of Bank Capital Buffers: An Empirical Evidence for MENA Banking Systems
- Regional Employment Growth and Spatial Dependencies in Algeria