
Determinants of Judicial Efficiency Change: Evidence from Brazil
-
Thiago A. Fauvrelle
 und
Alessio Tony C Almeida
und
Alessio Tony C Almeida

Abstract
Judicial efficiency matters for economic development. Nevertheless, the determinants of judicial productivity growth are not entirely understood. Using data of Brazil's state courts for the period of 2009 to 2014, this paper analyzes judicial productivity change and its possible determinants over time in a two stage approach. First, data envelopment analysis is used to calculate Malmquist productivity measures which are decomposed in: technical change (frontier-shift effect) and efficiency change (composed of pure efficiency change and scale efficiency change). In the second stage, fixed effect models are estimated to evaluate the associated factors with judicial productivity growth. The first stage results show a slight improvement in judicial productivity trend, which is defined mainly by efficiency change, since technical change deteriorated in the period. The second stage findings suggest the nonexistence of a trade-off between judicial quality and efficiency improvement. Moreover, judges’ remuneration, legal complexity and technological use are correlated with judicial productivity, however not always in the expected direction.
Acknowledgements
This article benefited from comments and suggestions from participants of the 11th Annual Conference on Empirical Legal Studies (Durham), 33rd Annual Conference of the European Association of Law and Economics (Bologna), the 3rd International Conference on Economic Analysis of Litigation (Montpellier), the 12th Italian Society of Law and Economics annual conference (Turin), 44 Encontro Nacional de Economia-ANPEC (Foz do Iguau) and graduate seminars at the University of Hamburg and Erasmus University Rotterdam. The authors also gratefully thank Stefan Voigt, Louis Visscher, Finn Førsund and Alexandre Samy de Castro, as well as the anonymous referees for their valuable comments. Any remaining errors are our own.
Appendix
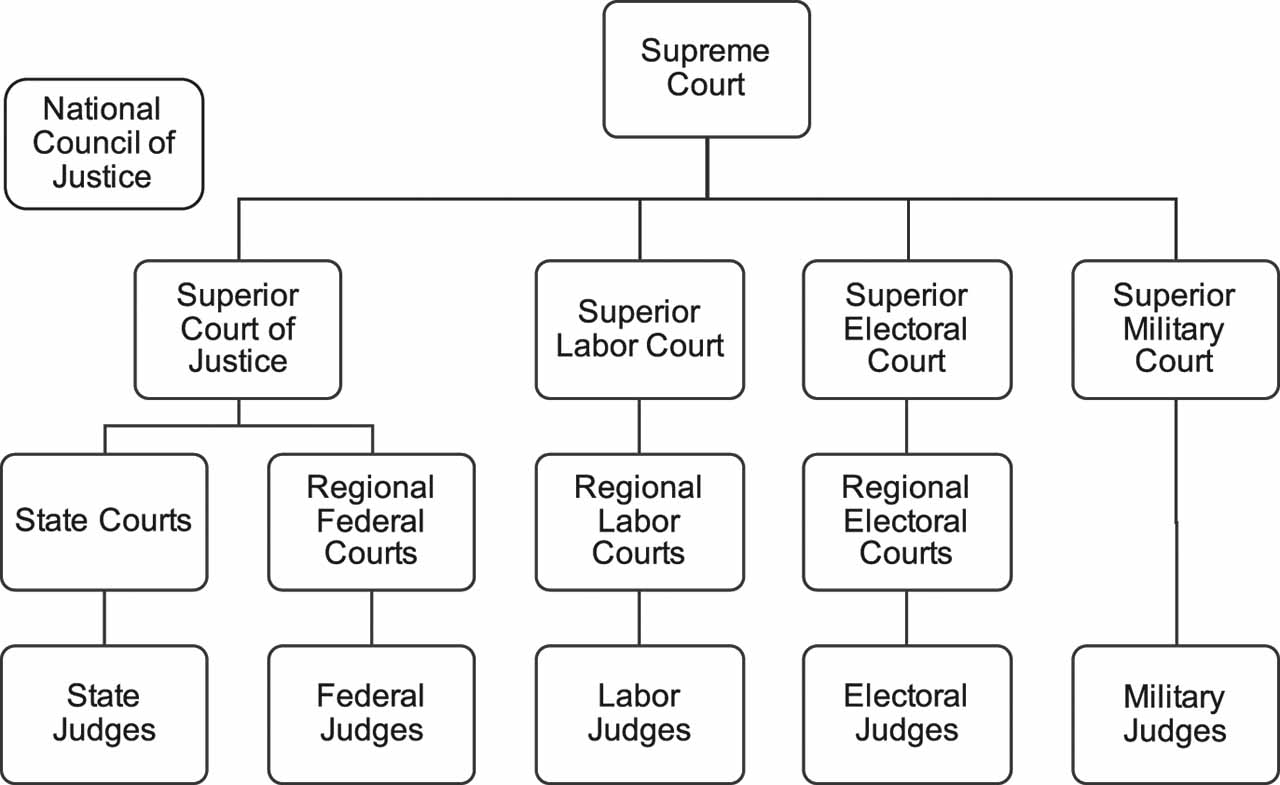
Brazilian Judiciary structure.
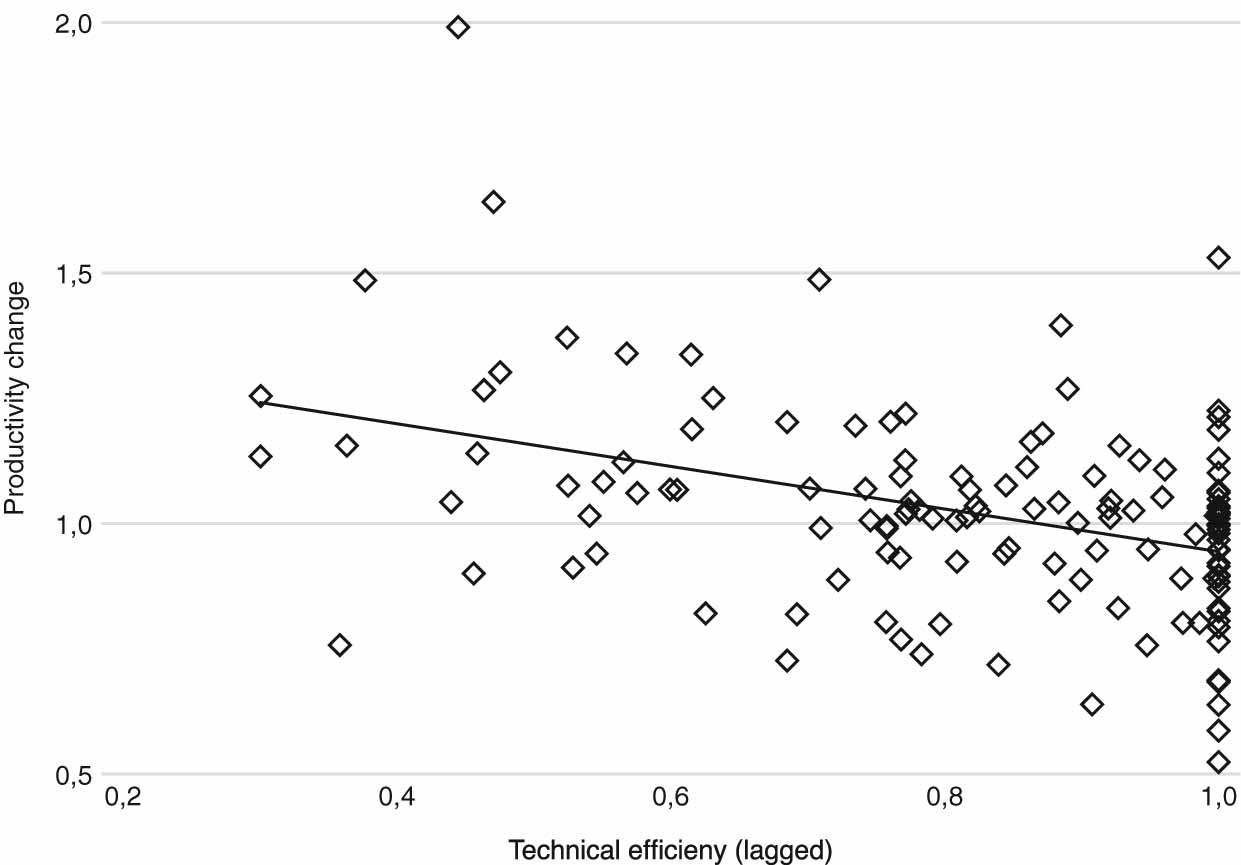
Technical efficiency (lagged) versus Productivity change.
Source: Authors' elaboration from Courts in Figures, CNJ (2015).
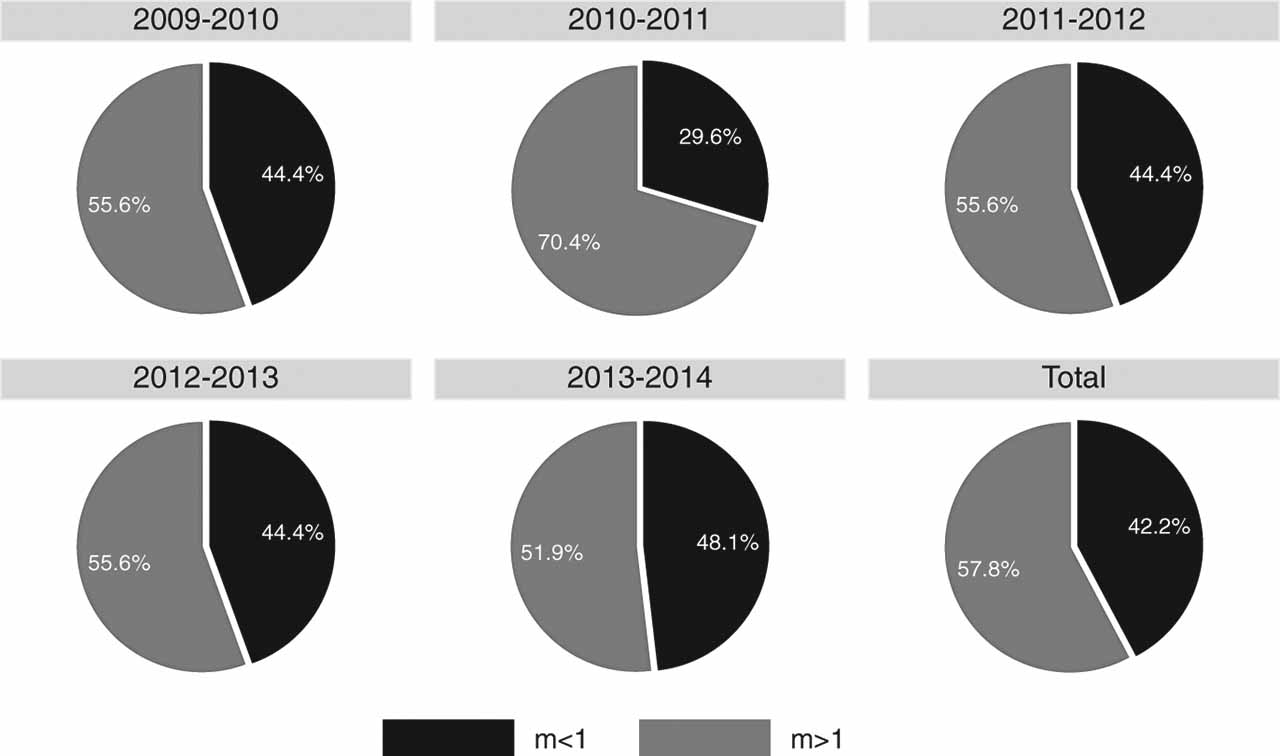
Percentage of Courts with advances (m
Source: Authors’ elaboration from Courts in Figures, CNJ (2015).
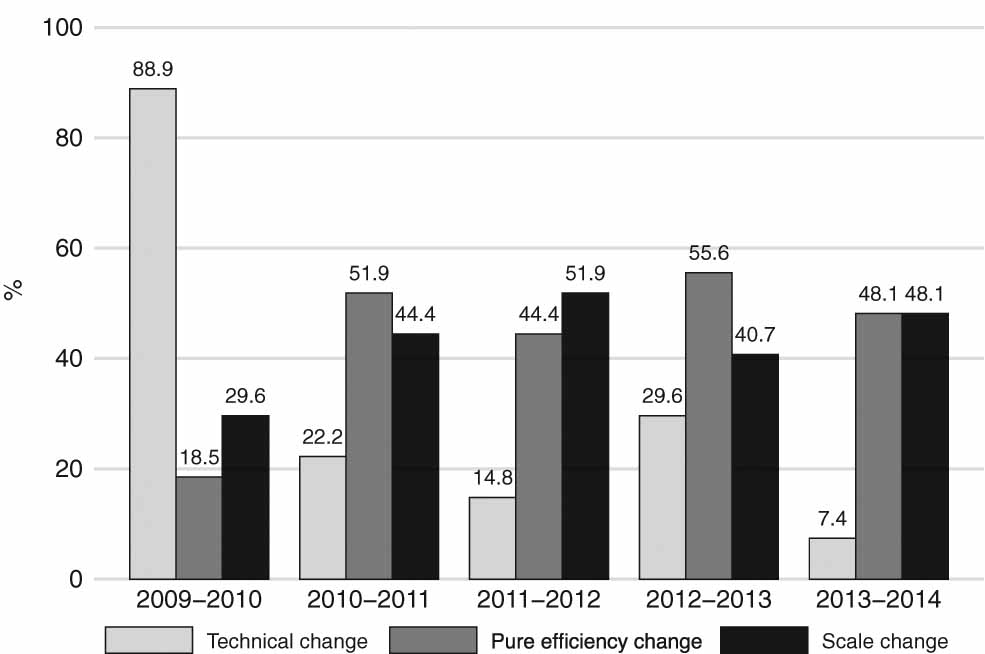
Percentage of Courts with improvements in technical change, pure efficiency change and scale efficiency change between 2009 and 2014.
Source: Authors’ elaboration from Courts in Figures, CNJ (2015).
Technical efficiency (VRS) in Brazilian Courts – 2009 to 2014.
| year | Total (2009-2014) | ||||||||||
|---|---|---|---|---|---|---|---|---|---|---|---|
| Court | 2009 | 2010 | 2011 | 2012 | 2013 | 2014 | Mean | SD | Min | Max | Count Eff* |
| Rio de Janeiro (RJ) | 1.00 | 1.00 | 1.00 | 1.00 | 1.00 | 1.00 | 1.00 | 0.00 | 1.00 | 1.00 | 6 |
| Roraima (RR) | 1.00 | 1.00 | 1.00 | 1.00 | 1.00 | 1.00 | 1.00 | 0.00 | 1.00 | 1.00 | 6 |
| Rio Grande do Sul (RS) | 1.00 | 1.00 | 1.00 | 1.00 | 1.00 | 1.00 | 1.00 | 0.00 | 1.00 | 1.00 | 6 |
| Sao Paulo (SP) | 1.00 | 1.00 | 1.00 | 1.00 | 1.00 | 1.00 | 1.00 | 0.00 | 1.00 | 1.00 | 6 |
| Acre (AC) | 1.00 | 1.00 | 1.00 | 1.00 | 1.00 | 0.95 | 0.99 | 0.02 | 0.95 | 1.00 | 5 |
| Mato Grosso do Sul (MS) | 1.00 | 1.00 | 1.00 | 1.00 | 0.81 | 0.85 | 0.94 | 0.08 | 0.81 | 1.00 | 3 |
| Rondonia (RO) | 0.76 | 0.94 | 1.00 | 1.00 | 0.92 | 0.93 | 0.92 | 0.08 | 0.76 | 1.00 | 1 |
| Distrito Federal (DF) | 0.82 | 0.77 | 0.95 | 0.91 | 1.00 | 1.00 | 0.91 | 0.09 | 0.77 | 1.00 | 2 |
| Minas Gerais (MG) | 0.93 | 1.00 | 0.83 | 0.85 | 0.88 | 0.93 | 0.90 | 0.06 | 0.83 | 1.00 | 1 |
| Para (PA) | 1.00 | 0.93 | 0.78 | 0.84 | 0.90 | 0.96 | 0.90 | 0.07 | 0.78 | 1.00 | 1 |
| Parana (PR) | 0.87 | 0.86 | 0.97 | 0.78 | 0.84 | 0.99 | 0.89 | 0.07 | 0.78 | 0.99 | 0 |
| Amazonas (AM) | 0.77 | 0.77 | 0.88 | 1.00 | 1.00 | 0.86 | 0.88 | 0.09 | 0.77 | 1.00 | 2 |
| Goias (GO) | 0.90 | 0.75 | 0.73 | 0.92 | 0.98 | 1.00 | 0.88 | 0.11 | 0.73 | 1.00 | 1 |
| Amapa (AP) | 1.00 | 0.57 | 0.81 | 0.89 | 1.00 | 1.00 | 0.88 | 0.16 | 0.57 | 1.00 | 3 |
| Sergipe (SE) | 0.87 | 0.95 | 0.82 | 0.77 | 1.00 | 0.81 | 0.87 | 0.08 | 0.77 | 1.00 | 1 |
| Maranhao (MA) | 0.76 | 0.71 | 0.99 | 0.86 | 0.97 | 0.87 | 0.86 | 0.10 | 0.71 | 0.99 | 0 |
| Alagoas (AL) | 0.44 | 0.92 | 0.94 | 0.96 | 0.88 | 0.90 | 0.84 | 0.18 | 0.44 | 0.96 | 0 |
| Rio Grande do Norte (RN) | 1.00 | 0.74 | 0.82 | 0.88 | 0.76 | 0.72 | 0.82 | 0.10 | 0.72 | 1.00 | 1 |
| Ceara (CE) | 0.91 | 0.58 | 0.63 | 0.81 | 0.77 | 0.93 | 0.77 | 0.13 | 0.58 | 0.93 | 0 |
| Tocantins (TO) | 1.00 | 0.48 | 0.71 | 0.68 | 0.79 | 0.87 | 0.76 | 0.16 | 0.48 | 1.00 | 1 |
| Santa Catarina (SC) | 0.77 | 0.70 | 0.76 | 0.76 | 0.78 | 0.60 | 0.73 | 0.06 | 0.60 | 0.78 | 0 |
| Bahia (BA) | 0.96 | 0.84 | 0.60 | 0.69 | 0.57 | 0.62 | 0.71 | 0.14 | 0.57 | 0.96 | 0 |
| Paraiba (PB) | 0.54 | 0.52 | 0.77 | 0.61 | 0.91 | 0.87 | 0.70 | 0.15 | 0.52 | 0.91 | 0 |
| Pernambuco (PE) | 0.72 | 0.63 | 0.53 | 0.47 | 0.80 | 0.66 | 0.63 | 0.11 | 0.47 | 0.80 | 0 |
| Espirito Santo (ES) | 0.68 | 0.46 | 0.55 | 0.53 | 0.60 | 0.69 | 0.58 | 0.08 | 0.46 | 0.69 | 0 |
| Mato Grosso (MT) | 0.46 | 0.36 | 0.44 | 0.46 | 0.62 | 0.77 | 0.52 | 0.13 | 0.36 | 0.77 | 0 |
| Piuai (PI) | 0.30 | 0.36 | 0.30 | 0.38 | 0.55 | 0.77 | 0.44 | 0.17 | 0.30 | 0.77 | 0 |
| Total | 0.83 | 0.77 | 0.81 | 0.82 | 0.86 | 0.87 | 0.83 | 0.03 | 0.77 | 0.87 | - |
Source: Authors’ elaboration from Courts in Figures, CNJ (2015). Note: SD = standard deviation; *Count Eff = amount of times that the DMU was efficient in the period.
Scale efficiency in Brazilian Courts – 2009 to 2014.
| year | Total | |||||||
|---|---|---|---|---|---|---|---|---|
| Court | Scale* | 2009 | 2010 | 2011 | 2012 | 2013 | 2014 | 2009-2014 |
| AC | 0.85 | 1.00 | 1.00 | 1.00 | 1.00 | 0.92 | 0.96 | |
| constant | increasing | constant | constant | constant | constant | increasing | ||
| AL | 0.74 | 0.71 | 0.68 | 0.68 | 0.87 | 0.83 | 0.75 | |
| increasing | increasing | increasing | increasing | increasing | increasing | increasing | ||
| AM | 0.80 | 0.79 | 0.72 | 0.88 | 1.00 | 0.76 | 0.83 | |
| increasing | increasing | increasing | increasing | increasing | constant | increasing | ||
| AP | 1.00 | 0.98 | 0.92 | 0.98 | 1.00 | 1.00 | 0.98 | |
| undefined | constant | increasing | increasing | increasing | constant | constant | ||
| BA | 0.73 | 0.85 | 0.92 | 0.88 | 0.90 | 0.99 | 0.88 | |
| undefined | increasing | increasing | decreasing | decreasing | increasing | decreasing | ||
| CE | 0.99 | 0.97 | 0.97 | 0.97 | 0.99 | 0.95 | 0.98 | |
| increasing | increasing | increasing | increasing | increasing | increasing | increasing | ||
| DF | 0.83 | 0.89 | 0.83 | 0.83 | 0.78 | 0.85 | 0.84 | |
| decreasing | decreasing | increasing | increasing | decreasing | decreasing | decreasing | ||
| ES | 0.93 | 0.94 | 0.98 | 0.98 | 0.96 | 0.95 | 0.96 | |
| increasing | decreasing | decreasing | increasing | increasing | increasing | increasing | ||
| GO | 0.94 | 1.00 | 0.99 | 0.96 | 1.00 | 1.00 | 0.98 | |
| increasing | increasing | increasing | increasing | decreasing | increasing | constant | ||
| MA | 0.86 | 0.80 | 0.85 | 0.83 | 0.80 | 0.84 | 0.83 | |
| increasing | increasing | decreasing | increasing | increasing | decreasing | increasing | ||
| MG | 0.81 | 0.77 | 0.86 | 0.86 | 0.83 | 0.86 | 0.83 | |
| decreasing | decreasing | decreasing | increasing | increasing | decreasing | decreasing | ||
| MS | 1.00 | 1.00 | 0.99 | 1.00 | 0.99 | 1.00 | 0.99 | |
| constant | constant | constant | increasing | constant | decreasing | increasing | ||
| MT | 0.93 | 0.95 | 0.99 | 0.99 | 1.00 | 0.99 | 0.98 | |
| undefined | decreasing | increasing | decreasing | decreasing | increasing | increasing | ||
| PA | 1.00 | 0.95 | 1.00 | 0.99 | 0.88 | 0.87 | 0.95 | |
| increasing | constant | increasing | increasing | increasing | increasing | increasing | ||
| PB | 1.00 | 0.98 | 0.99 | 0.99 | 0.88 | 0.93 | 0.96 | |
| decreasing | decreasing | decreasing | increasing | increasing | decreasing | decreasing | ||
| PE | 0.99 | 0.97 | 0.96 | 0.97 | 1.00 | 1.00 | 0.98 | |
| increasing | increasing | increasing | increasing | increasing | increasing | increasing | ||
| PI | 1.00 | 0.93 | 0.90 | 0.93 | 0.96 | 0.80 | 0.92 | |
| increasing | increasing | increasing | increasing | increasing | increasing | increasing | ||
| PR | 0.99 | 0.98 | 0.98 | 1.00 | 0.99 | 0.98 | 0.99 | |
| increasing | increasing | increasing | increasing | increasing | increasing | increasing | ||
| RJ | 1.00 | 1.00 | 1.00 | 1.00 | 1.00 | 1.00 | 1.00 | |
| constant | constant | constant | constant | constant | constant | constant | ||
| RN | 0.98 | 0.95 | 0.96 | 0.97 | 0.95 | 0.99 | 0.96 | |
| decreasing | decreasing | decreasing | increasing | decreasing | decreasing | decreasing | ||
| RO | 0.98 | 0.91 | 1.00 | 0.97 | 0.91 | 0.99 | 0.96 | |
| increasing | increasing | increasing | constant | increasing | increasing | increasing | ||
| RR | 0.63 | 0.62 | 0.53 | 0.67 | 0.55 | 0.90 | 0.65 | |
| increasing | increasing | increasing | increasing | increasing | increasing | increasing | ||
| RS | 1.00 | 1.00 | 1.00 | 1.00 | 1.00 | 1.00 | 1.00 | |
| constant | constant | constant | constant | constant | constant | constant | ||
| SC | 0.99 | 0.96 | 0.99 | 0.99 | 1.00 | 1.00 | 0.99 | |
| increasing | increasing | increasing | increasing | increasing | increasing | increasing | ||
| SE | 0.97 | 0.99 | 0.89 | 0.99 | 0.96 | 0.97 | 0.96 | |
| increasing | increasing | decreasing | decreasing | increasing | increasing | increasing | ||
| SP | 1.00 | 0.66 | 0.83 | 0.85 | 0.79 | 0.84 | 0.83 | |
| decreasing | constant | decreasing | decreasing | decreasing | decreasing | decreasing | ||
| TO | 0.70 | 0.90 | 0.85 | 0.90 | 0.95 | 0.93 | 0.87 | |
| increasing | increasing | increasing | increasing | increasing | increasing | increasing | ||
| Total | 0.91 | 0.91 | 0.91 | 0.93 | 0.92 | 0.93 | 0.92 | |
Authors’ elaboration from Courts in Figures, CNJ (2015). Note: *Return to scale dominant over time.
Description of inputs, output and scores of judicial efficiency in Brazil by type of returns to scale (2009-2014).
| Returns to scale | ||||
|---|---|---|---|---|
| Variable | Increasing | Constant | Decreasing | Total |
| Efficiency | ||||
| Technical (VRS) | 0.79 | 1.00 | 0.81 | 0.83 |
| Scale | 0.91 | 1.00 | 0.89 | 0.92 |
| Inputs | ||||
| Expenditure (constant 2014 R$ millions) | 714.79 | 1,575.71 | 2,057.25 | 1,156.60 |
| Judges | 301 | 511 | 691 | 423 |
| Staff | 5,746 | 12,839 | 16,302 | 9,274 |
| Workload | 1,406,513 | 4,602,358 | 4,874,524 | 2,709,823 |
| Output | ||||
| Judgements | 381,670 | 1,253,334 | 1,120,370 | 691,103 |
Source: Authors’ elaboration from Courts in Figures, CNJ (2015).
Malmquist index, Technical change (TC), Efficiency change(EC), Pure efficiency change (PEC) and Scale efficiency change (SC) – Average annual changes, 2009-2014.
| EC = PEC | |||||
|---|---|---|---|---|---|
| Court | Malmquist index | TC | EC | PEC | SC |
| AC | 1,007 | 0,993 | 1,010 | 0,989 | 1,021 |
| AL | 1,211 | 0,984 | 1,228 | 1,211 | 1,015 |
| AM | 1,032 | 0,986 | 1,039 | 1,026 | 1,013 |
| AP | 1,041 | 0,993 | 1,042 | 1,044 | 0,999 |
| BA | 0,956 | 0,971 | 0,984 | 0,929 | 1,059 |
| CE | 0,994 | 0,971 | 1,028 | 1,036 | 0,993 |
| DF | 1,046 | 0,999 | 1,049 | 1,046 | 1,002 |
| ES | 0,990 | 0,974 | 1,026 | 1,022 | 1,004 |
| GO | 1,023 | 0,986 | 1,040 | 1,031 | 1,009 |
| MA | 1,029 | 0,975 | 1,047 | 1,045 | 1,002 |
| MG | 1,001 | 0,986 | 1,013 | 1,004 | 1,009 |
| MS | 0,952 | 0,979 | 0,971 | 0,972 | 1,000 |
| MT | 1,111 | 0,985 | 1,139 | 1,127 | 1,011 |
| PA | 0,940 | 0,971 | 0,969 | 0,997 | 0,972 |
| PB | 1,087 | 0,981 | 1,112 | 1,134 | 0,980 |
| PE | 1,012 | 0,991 | 1,029 | 1,024 | 1,005 |
| PI | 1,143 | 0,967 | 1,179 | 1,230 | 0,958 |
| PR | 1,009 | 0,980 | 1,032 | 1,035 | 0,997 |
| RJ | 1,023 | 1,023 | 1,000 | 1,000 | 1,000 |
| RN | 0,915 | 0,961 | 0,954 | 0,948 | 1,006 |
| RO | 1,033 | 0,983 | 1,051 | 1,046 | 1,004 |
| RR | 1,091 | 0,992 | 1,114 | 1,000 | 1,114 |
| RS | 0,983 | 0,983 | 1,000 | 1,000 | 1,000 |
| SC | 0,945 | 0,984 | 0,962 | 0,958 | 1,003 |
| SE | 0,992 | 0,988 | 1,003 | 1,000 | 1,004 |
| SP | 0,978 | 0,996 | 0,986 | 1,000 | 0,986 |
| TO | 1,029 | 0,971 | 1,068 | 1,038 | 1,029 |
| Mean | 1,015 | 0,983 | 1,040 | 1,033 | 1,007 |
Authors’ elaboration from Courts in Figures, CNJ (2015). Note: Pure efficiency change is calculated using DEA-VRS and efficiency change by DEA-CRS. Scale efficiency change (SC), based on Färe et al. (1994b), is defined by:
Matrix of correlations between covariates
| Variables | A | B | C | D | E | F | G | |
|---|---|---|---|---|---|---|---|---|
| A | Reversal rate | 1.0000 | ||||||
| B | Remuneration | -0.1273 | 1.0000 | |||||
| C | Investment | 0.0430 | -0.2280* | 1.0000 | ||||
| D | Technology investment | -0.2225* | -0.0122 | 0.0456 | 1.0000 | |||
| E | Electronic filing | 0.0952 | 0.1642 | -0.0180 | 0.2115* | 1.0000 | ||
| F | GDP per capita | -0.0632 | -0.0001 | -0.0026 | 0.1045 | -0.1756* | 1.0000 | |
| G | Criminal cases | -0.0209 | 0.0883 | 0.1216 | 0.1170 | 0.0017 | -0.4549* | 1.0000 |
Authors’ elaboration. Note: *p–value<0.05.
References
Akerlof, G.A., and Yellen J.L.. 1990. “The Fair Wage-Effort Hypothesis and Unemployment,” 105 (2)Quarterly Journal of Economics 255–283.10.2307/2937787Suche in Google Scholar
Beenstock, M., and Haitovsky Y.. 2004. “Does the Appointment of Judges Increase the Output of the Judiciary?” 24 (3)International Review of Law and Economics 351–369.10.1016/j.irle.2004.10.006Suche in Google Scholar
Beer, C.C. 2006. “Judicial Performance and the Rule of Law in the States,” Mexican 48(3)Latin American Politics and Society 33–61.10.1111/j.1548-2456.2006.tb00355.xSuche in Google Scholar
Bhattacharya, U., and Daouk H.. 2009. “When no Law is Better than a Good Law,” 13 (4)Review of Finance 577–627.10.1093/rof/rfp011Suche in Google Scholar
Blank, J., B.v.H. Martin van der Ende, and R. Jagtenberg. 2004. “Bench Marking in an International Perspective: An International Comparison of the Mechanisms and Performance of the Technical Report May, ECORYS Nederland BV (comissioned by the Netherlands Council for the Judiciary), Rotterdam.Suche in Google Scholar
Bogetoft, P., and Otto L.. 2011. “Statistical Analysis in dea,” in Benchmarking with DEA, SFA, and R, pages 155–196. Springer.10.1007/978-1-4419-7961-2_6Suche in Google Scholar
Buscaglia, E., and Ulen T.. 1997. “A Quantitative Assessment of the Efficiency of the Judicial Sector in America,” Latin 17(2)International Review of Law and Economics 275–291.10.1016/S0144-8188(97)00007-0Suche in Google Scholar
Carmignani, A., and Giacomelli S.. 2010. “Too Many Lawyers? Litigation in Courts,” Italian Civil Banca D’Italia, Working Paper No 745, pages 1–28.Suche in Google Scholar
Castro, M.F., and Guccio C.. 2014. “Searching for the Source of Technical Inefficiency in Italian Judicial Districts: Investigation,” An Empirical 38(3)European Journal of Law and Economics 369–391.10.1007/s10657-012-9329-0Suche in Google Scholar
Caves, D.W., Christensen L.R., and Diewert W.E.. 1982. “The Economic Theory of Index Numbers and the Measurement of Input, Output, and Productivity,” 50 (6)Econometrica 1393–1414.10.2307/1913388Suche in Google Scholar
Charnes, A., Cooper W., and Rhodes E.. 1978. “Measuring the Efficiency of Decision Making Units,” 2 (6)European Journal of Operational Research 429–444.10.1016/0377-2217(78)90138-8Suche in Google Scholar
Choi, S.J., Gulati G.M., and Posner E.A.. 2009. “Are Judges Overpaid?: A Skeptical Response to the Judicial Salary Debate,” 1 (1)Journal of Legal Analysis 47–117.10.4159/jla.v1i1.3Suche in Google Scholar
National CNJ - Council of Justice}. 2015. Courts in Figures,” CNJ, BrasíCNJ, Braslia-DF.Suche in Google Scholar
Coase, R.H. 1960. “The Problem of Social Cost,” 3 The Journal of Law and Economics 1–44.10.1086/466560Suche in Google Scholar
Dakolias, M. 1999. “Court Performance Around the World: A Comparative Perspective},” 2 (1)Yale Human Rights and Development Journal 87–142.10.1596/0-8213-4436-6Suche in Google Scholar
Dalton, T.A., and Singer J.M.. 2014. “Bigger Isn’t Always Better: An Analysis of Court Efficiency Using Hierarchical Linear Modeling,” 34 (3)Pace Law Review 1169–1189.Suche in Google Scholar
Deyneli, F. 2012. “Analysis of Relationship Between Efficiency of Justice Services and Salaries of Judges with Two-Stage DEA Method,” 34 (3)European Journal of Law and Economics 477–493.10.1007/s10657-011-9258-3Suche in Google Scholar
Dimitrova-Grajzl, V., Grajzl P., Slavov A., and Zajc K.. 2016. “Courts in a Transition Economy: Disposition Case and the Quantity–Quality Tradeoff in Bulgaria,” 40 (1)Economic Systems 18–38.10.1016/j.ecosys.2015.09.002Suche in Google Scholar
Djankov, S., La Porta R., Lopez-de Silanes F., and Shleifer A.. 2003. “Courts,” 118 (2)The Quarterly Journal of Economics 453–517.10.1162/003355303321675437Suche in Google Scholar
Elbialy, N., and García-Rubio M.A., 2011. “Assessing Judicial Efficiency of Egyptian First Instance Courts: A DEA Analysis,” MAGKS Papers on Economics, Working Paper No 19.Suche in Google Scholar
Färe, R., and Grosskopf S.. 1996. Intertemporal Production Frontiers: with Dynamic DEA. Norwell: Kluwer Aca.10.1007/978-94-009-1816-0Suche in Google Scholar
Färe, R., Grosskopf S., and Lovell C.A.. 1994. Production Frontiers, Cambridge University Press.10.1007/978-1-4612-2626-0_1Suche in Google Scholar
Färe, R., Grosskopf S., Norris M., and Zhang Z.. 1994b. “Productivity Growth, Technical Progress, and Efficiency Change in Countries,” Industrialized 84(1) The American Economic Review 66–83.Suche in Google Scholar
Farrell, M.J. 1957. The Measurement of Productive Efficiency. 120 (3)Journal of the Royal Statistical Society. Series A (General) 253–290.10.2307/2343100Suche in Google Scholar
Fleming Jr., J. 1961. “Burdens of Proof,” 47 (51)Virginia Law Review 51–70.10.2307/1071154Suche in Google Scholar
Friedman, D.D. 2000. Law’s Order: What Economics Has to Do with Law and Why It Matters. New Jersey: Princeton University Press.10.1515/9781400823475Suche in Google Scholar
Ginsburg, T. 2000. “Does Law Matter for Economic Development? Evidence from East Asia,” 34 (3)Law and Society Review 829–856.10.2307/3115145Suche in Google Scholar
Glaeser, E., and Shleifer A.. 2002. “Legal Origins,” 117 (November)The Quarterly Journal of Economics 1193–1229.10.1162/003355302320935016Suche in Google Scholar
Gorman, M.F., and Ruggiero J.. 2009. “Evaluating U.S. Judicial District Prosecutor Performance Using DEA: Are Disadvantaged Counties More Inefficient?,” 27 (3)European Journal of Law and Economics 275–283.10.1007/s10657-008-9093-3Suche in Google Scholar
Kittelsen, S.A.C., and Forsund F.R.. 1992. “Efficiency Analysis of Norwegian District Courts,” 3 (3)Journal of Productivity Analysis 277–306.10.1007/BF00158357Suche in Google Scholar
Kourlis, R.L., and Gagel P.A.. 2008. “Reinstalling the Courthouse Windows : Using Statistical Data to Promote Judicial Transparency and Accountability in Federal and Courts,” State 53(5)Villanova Law Review 951–972.Suche in Google Scholar
Landes, W. 1971. “An economic Analysis of the Courts,” 14 (1)The Journal of Law and Economics61–107.10.1086/466704Suche in Google Scholar
Landes, W., and Posner R.. 1979. “Adjudication as a Private Good,” 8 (2)The Journal of Legal Studies 235–284.10.1086/467609Suche in Google Scholar
Luskin, M.L., and Luskin R.C.. 1986. “Why so Fast, Why so Slow: Explaining Case Processing Time,” 77 (1)Journal of Criminal Law and Criminology 190–214.10.2307/1143594Suche in Google Scholar
Maher, B.S. 2010. “The Civil Judicial Subsidy,” 85 (4)Indiana Law Journal 1527–1556.Suche in Google Scholar
Malmquist, S. 1953. “Index Numbers and Indifference Surfaces,” 4 (2)Trabajos de Estadistica 209–242.10.1007/BF03006863Suche in Google Scholar
Mitsopoulos, M., and Pelagidis T.. 2010. “Greek Appeals Courts' Quality Analysis and Performance,” 30(1) European Journal of Law and Economics 17–39.10.1007/s10657-009-9128-4Suche in Google Scholar
Mora-Sanguinetti, J.S., and Garoupa N.. 2015. “Do Lawyers Induce Litigation? Evidence from Spain, 2001 – 2010,” 44(October) International Review of Law and Economics 29–41.10.1016/j.irle.2015.06.003Suche in Google Scholar
Murrel, P. 2001. “Demand and supply in romanian commercial courts: Generating information for institutional reform,” SSRN Working Paper no. 280428.10.2139/ssrn.280428Suche in Google Scholar
North, D.C. 1994. “Economic Performance Through Time,” 84 (3)The American Economic Review 359–368.Suche in Google Scholar
Palumbo, G., Giupponi G., Nunziata L., and Mora-Sanguinetti J.. 2013. “The Economics of Civil Justice: New Cross-country Data and Empirics,” OECD Economics Department Working Papers, No. 1060.Suche in Google Scholar
Pedraja-Chaparro, F., and Salinas-Jimenez J.. 1996. “An Assessment of the Efficiency of Spanish Courts Using DEA,” 28 (11)Applied Economics 1391–1403.10.1080/000368496327651Suche in Google Scholar
Posner, R.A. 1993. “What do Judges Maximize? (The Same Thing Everyone Else Does),” 3 Supreme Court Economic Review 1–41.10.1086/scer.3.1147064Suche in Google Scholar
Posner, R.A. 2000. “Is the Ninth Circuit Too Large? A Statistical Study of Judicial Quality,” 29 (2)The Journal of Legal Studies 711–719.10.1086/468090Suche in Google Scholar
Ramanathan, R. 2003. An Introduction to Data Envelopment Analysis: A Tool for Performance Measurement, volume 1. New Delhi: Sage Publications.Suche in Google Scholar
Ramello, G., and Melcarne A.A.. 2015. “Judicial Independence, Judges’ Incentives and Efficiency,” 11(2) Review of Law & Economics 149–169.10.1515/rle-2015-0024Suche in Google Scholar
Rosales-López, V. 2008. “Economics of Court Performance: An Empirical Analysis,” 25 (3)European Journal of Law and Economics 231–251.10.1007/s10657-008-9047-9Suche in Google Scholar
Schneider, M.R. 2005. “Judicial Career Incentives and Court Performance: An Empirical Study of the German Labour Courts of Appeal,” 20 (2)European Journal of Law and Economics 127–144.10.1007/s10657-005-1733-2Suche in Google Scholar
Shepherd, J. 2011. “Measuring Maximizing Judges: Empirical Legal Studies, Public Choice Theory, and Judicial Behavior,” 68 (2007)University Of Illinois Law Review 101–114.Suche in Google Scholar
Vereeck, L., and Muhl M.. 2000. “An Economic Theory of Court Delay,” 10 (3)European Journal of Law and Economics 243–268.10.1023/A:1026547515846Suche in Google Scholar
Voigt, S. 2016. “Determinants of Judicial Efficiency: A Survey,” 42 (2)European Journal of Law and Economics 1–31.10.1007/s10657-016-9531-6Suche in Google Scholar
Bank World. 2002. “Initiatives in Legal and Reform,” Judicial Technical report, World Bank, Washington, D.C.Suche in Google Scholar
Yeung, L.L., and Azevedo P.F.. 2011. “Measuring Efficiency of Brazilian Courts with Data Envelopment Analysis (DEA),” 22 (4)Ima Journal of Management Mathematics 343–356.10.1093/imaman/dpr002Suche in Google Scholar
© 2018 Walter de Gruyter GmbH, Berlin/Boston
Artikel in diesem Heft
- Empirical Legal Studies: CELS and CELSE
- Missing Rich Offenders: Traffic Accidents and the Impartiality of Justice
- Are Advocates General Political? An Empirical Analysis of the Voting Behavior of the Advocates General at the European Court of Justice
- The More Med-Mals, the Shorter the Litigation: Evidence from Florida
- Police Incentives, Policy Spillovers, and the Enforcement of Drug Crimes
- Determinants of Judicial Efficiency Change: Evidence from Brazil
- Cartels as Defensive Devices: Evidence from Decisions of the European Commission 2001–2010