Temporal variation of radon in soil and water in Kosovo
-
 ,
,
,
,
 ,
,
und
,
,
und

Abstract
This study aims to investigate radon (Rn-222) gas concentrations in soil and water within seismic-prone regions of Peja and Vitia, Kosovo. The study utilizes the Alpha GUARD PQ2000 PRO equipment for precise measurement, based on the primary and some secondary data gathered. The observed soil gas radon concentrations ranged from 34.6 kBq/m3 to 130.4 kBq/m3 in Peja and 19.8 kBq/m3 to 73.2 kBq/m3 in Vitia, amidst minor seismic events with magnitudes between 1.5 and 2.6. The epicenters are located at distances ranging from 3.1 to 38 km from the radon monitoring sites. The seasonal correction factor was 0.98 for the dry season and 1.01 for the wet season for both areas (Peja and Vitia). Concurrently, radon activity concentrations in spring water varied from 5.7 Bq/L to 9.6 Bq/L in Peja and from 212.8 Bq/L to 275.3 Bq/L in Vitia. These findings emphasize the potential of radon monitoring as an earthquake precursor and highlight the influence of meteorological factors on radon levels, paving the way for future research in earthquake forecasting and environmental safety. Notably, the soil radon levels decrease during heavy rainfall.This contributes to understanding radon’s behavior under varying environmental conditions.
1 Introduction
Over the past two decades, scientists have made an important contribution to the study of the behaviour of geo-gases in seismically active areas. The investigated geo-gases such as helium, hydrogen, and carbon dioxide, radon have been studied more than other earthquake precursors. 1 CO2-rich areas correspond to the observed seismic precursors recorded in radon. 2 The most frequent radon isotopes in nature are: Rn-222 (its half-life is 3.82 days), Rn-220 (its half-life is 54.5 s), and Rn-219 (with a half-life of 3.92 s) that are progeny of U-238 series, Th-232 series and U-235 series respectively. The most important isotope is radon, because its longer half-life, is Rn-222 which is an odorless and colorless natural radioactive gas. It is produced during the radioactive decay of Ra-226. The short-lived radon decay products are radioactive isotopes of Po-218, Bi-214, Pb-214 and Po-214 and are easily attached to aerosol particles in the air. Radon originates from solid grains and is concentrated to the soil pores filled with air and water. Then radon is transported by diffusion and advection through fractures in the soil to emanate into the atmosphere. 3 , 4 The release of radon from natural minerals has been known since the 1920s. 5 In some radon research, the presence of radon in different environmental substrata has also been used as a parameter to predict earthquakes. Linking earthquake predictions to radon concentration measurements is based on the assumption that the distribution of radon concentrations in the soil is strongly related to geological structure, rock nature, fractures, and source distribution.
Most studies dealing with the forecasting of earthquakes include dilatancy theory, where the stressed rock begins to expand and dilate. 6 The micro-cracks created in these stressed rocks become larger, allowing radon to easily diffuse into the soil gas creating many local radon anomalies. The increase of the radon concentration, occurs when the cracks start to form in the compact rock massif of the area affected by the earthquake. However, during the last stage in the dilatancy model, the radon emission can stagnate or decrease before the earthquake starts. Moreover, radon moves more rapidly through permeable soils, such as coarse sand and gravel than through impermeable soils, such as clays. 7 , 8 , 9 , 10 , 11
Furthermore, changes in radon concentration in the soil are influenced by meteorological parameters, such as temperature, relative humidity, atmospheric pressure. 12 , 13 For small magnitude earthquakes, it is challenging and often impossible to identify anomalies in radon concentrations resulting solely from the seismic activity from those induced by meteorological or hydrological parameters. 14 Some anomalies in soil/water radon concentrations have been observed before earthquakes occur. 15 Previous studies have shown that the temporal variability of radon flux can serve as an indicator of seismic activity. 14 , 16
In 1966, an earthquake of magnitude M 5.3 occurred in Tashkent, radon anomalies were used as a precursor to forecast earthquakes based on well water measurements. 17 Increased concentrations of radon activity in spring waters were also observed before the earthquake in Gasli with M 7.3 on May 17, 1976, and earthquakes in China. 18 About 600,000 people lost their lives in the M = 7.8 earthquake that occurred in Tangshan on July 28, 1976. This earthquake was not forecasted even though they had noticed anomalies in the concentration of radon activity before this earthquake. 18 Therefore, for measuring radon concentration in soil, the main focus should be on considering the effects of soil structure and tectonic activities. 19 Studying these factors can improve earthquake forecasting.
Natural radon gas is sensitive to climate and environmental changes. Different seasons can bring changes to soil radon concentration data, therefore, using a seasonal correction factor can provide a more accurate and reliable view of the data, allowing comparisons between different periods and a clearer analysis of true changes in variables. Different conditions, such as temperature and humidity, can affect the distribution of radon in the soil, this is why, in this article, we have also included the seasonal correction factor (SCF) for radon. Several researchers, argued on the use of SCFs on short-term radon measurements as by not applying SCFs, radon levels are assumed to have a cyclical recurrence. 20 , 21 , 22
The concentration of radon in soil gas can vary widely depending on local geology and other factors. 23 Typical concentrations in soil gas can range from 100 Bq/m3 to tens of thousands of Bq/m3. The average outdoor radon level typically ranges from 5 Bq/m3 to 15 Bq/m3. However, in certain conditions, such as valleys during early mornings, concentrations can occasionally reach up to 100 Bq/m3. 24 Radon concentrations in groundwater can also vary significantly. According to a study in 2020, depending on the geological composition, the concentration of radon in groundwater can exceed 100,000 Bq/m3. 25
This research aims to measure the radon concentration in the soil at different time intervals, and assess their potential as indicators of impending earthquakes. The main objective of this research is focused on the study of the concentration of radon activity in soil and water in seismically sensitive areas as well as the influence of meteorological parameters. Careful analysis is imperative to eliminate false positive signals, accounting for seasonal variations in radon concentrations. Moreover, a comprehensive understanding and assessment of the sources of radon in the soil are essential. To achieve this, are used high-resolution γ-ray spectrometry technique to measure the abundances of the primordial radionuclides.
2 Site description and methods
Kosovo is characterized by variety of rock types and origin, with different geologic age, from Proterozoic era until the recent formation. The oldest core lies in eastern part of the country and belongs to Dardania massif/Rhodope massif. Geologic evolution of the territory has gone through different phases with distinguished features. While in Kosovo are found magmatic, metamorphic and sedimentary rocks, tectonics has shaped the geology in different type of movement with dominance of faults and rather of folded structures. Later, during the Triassic age intercontinental rifting led to the break-up of Palaeozoic continent. 26
The geological-tectonic units of Kosovo belong to Mediterranean Alpine orogenic belts. Kosovo’s geological settings represent a node in the Balkan Peninsula where large units of Dinarides, Hellenides, Vardar Zone and Dardania Massif/Rhodope Massif collides with each other. 27 Kosovo is divided in 6 geotectonics zones, stretching mostly in northwest-southeast directions, which have different geological evolution. The youngest tectonic activity, vertical movements like uplifting and subsiding of separated block with deca-to hectokilometric size have created the tectonics plains in Kosovo, including Anamorava basin (where Vitia samples are measured) and Dukagjini basin (where Peja samples are found). The fractures have been created in older fractures, where after the Upper Miocene were restored together with opening of new ones. Based on the geological location of Kosovo, neotectonics movements are present, and the appearance of different scale earthquake shows its tectonics activity. Neotectonic movements are estimated to be from 4 to 8 mm per year indicating uplifting of the mountains and downlifting of plains. 28
Monitoring of the radon concentration in the soil/water and its connection with earthquakes was carried out in two locations (Figure 1) which were close to the seismic centres: Vitia/Stublla (42.31179 N, 21.44698E) and Peja (42.59999 N, 20.299995E).
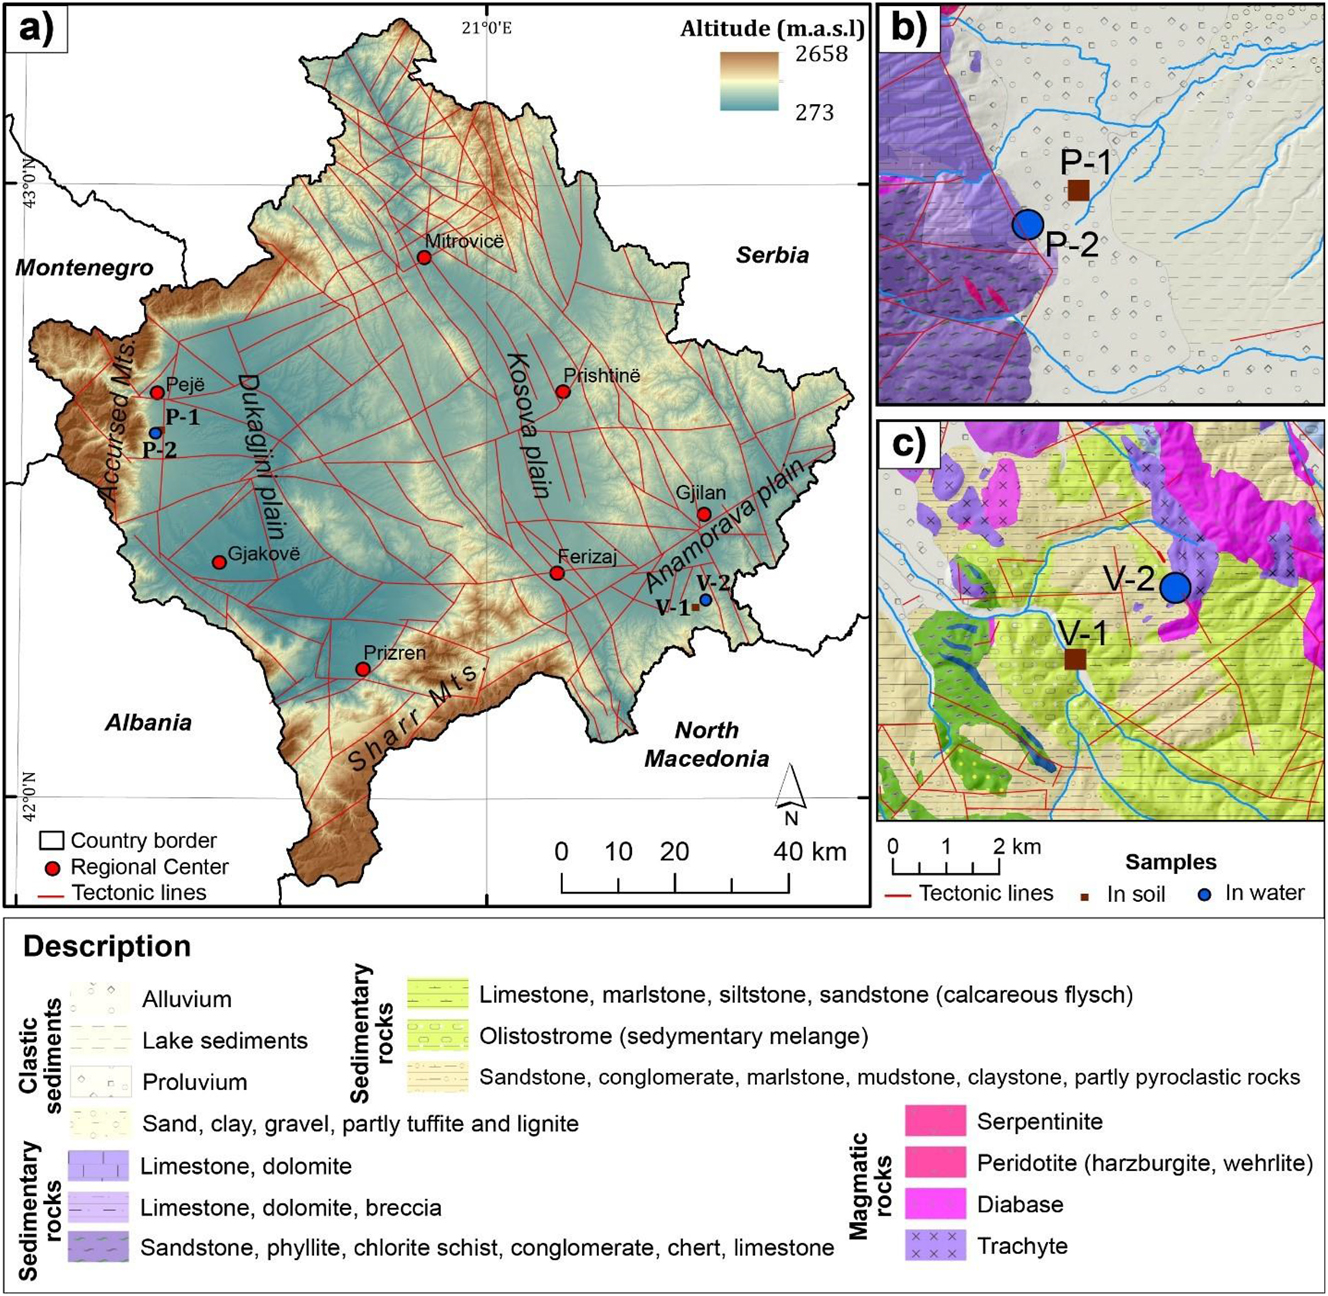
Map of the study area as well as geological characteristics and tectonic.
(Map compilation: V. Bytyqi; data source: Geological Map of Kosovo, scale 1:100,000, ICMM).
Vitia samples: V-1 (in soil) and V-2 (in water) were measured in terrain located in Vardari Geological Zone, which during its geological evolution was an oceanic basin. The area of samples consists of sedimentary melange (sandstone, conglomerate, marlstone, mudstone, claystone, partly pyroclastic rocks), which are separated by alluviums deposited by Letnica River (a right tributary of Morava e Binçës). Other magmatic rocks (trachyte and diabase) are found in the study area. Water sample is measured in the source located in lithological contact between trachyte rocks and sedimentary melange, in which a tectonic line is depicted. Throughout the area of Vitia other tectonic lines are distinguished, representing blocky structures and less folded ones. Towards north, the geological features belong to Anamorava tectonic plain. Sample V-1 was measured in soil belonging to alluvium deposits of Letnica River, created by deposition of alluvium originating from the erosion of before mentioned rocks of the region (Figure 1c).
Peja samples: P-1 (in soil) and P-2 (in water) were measured in western part of Dukagjini basin (plain), which in terms of geological setting belongs to ophiolitic Zone in Kosovo. Located in western part of the plain, the samples are in the foothill of Bjeshkët e Nemuna Mts (Accursed Mountains) where during the geological evolution of Dukagjini basin is displaced with a dip-slip fault type and a fault plane with 2,000 m amplitude is created. The two geological units (ophiolitic and Durmitory zone) are separated with Peja-Deçani dip-slip fault. Soil samples are collected in proluvium sediments which represents loose sediments, mostly sandy-silty deposits, belonging to intergranular porosity, deposited by erosion of intermittent rivers flowing from Bjeshkët e Nemuna, while, the water sample (P-2) is measured in the contact of limestone-dolomite formations with loose sediments at the foothill of Bjeshkët e Nemuna. Peja region in known for its active tectonics during the latest geological age, whereas some of the tectonic lines are found (Figure 1a and b), thus making the region very active in terms of tectonics. 29 , 30
2.1 Radon activity concentration measurements
The measurement of the radon concentration in soil was conducted using AlphaGuard PQ 2000PRO equipped with STITZ-Soil Gas Probe. The AlphaGUARD (AG) device, functions as an ionization chamber, which employs alpha spectrometry to measure radon concentration in soil gas. The Alpha Guard detector was chosen due to its calibration stability and fast reading capabilities, and it is also known for accurate measurements verified in previous studies. 31 , 32 The main advantages of the AlphaGUARD are its fast response, higher sensitivity and a wide dynamic range which is linear over the interval 2-2 × 10⁶ Bqm−3. The system allows spot measurements as well as continuous soil gas monitoring. For exact soil gas measurements were also high concentration gradients shall be portrayed correctly, the AlphaGUARD has to be set to the flow-through mode.
Monitoring of radon concentrations in the soil took place a period, from January 2022 to March 2023. The measurements were performed at a depth of 1 m, with the Alpha Pump set to a performance of 1 L per minute. The depth from 0.5 to 1 m is the most sensitive depth to detect changes. 18 The AG device conducted these measurements in flow mode, where each cycle lasted 1 min, and the duration of each measurement varied between 10 and 15 min. 33
With the AlphaGuard device (AlphaKit) the concentration of radon activity in water was also measured in the areas selected as seismically active areas (Peja and Vitia). Furthermore, the study aimed to analyze some physical and chemical parameters such as pH, T, EC, TH and TDS in all water samples in which the concentration of radon activity was measured. Furthermore, the study aimed to analyze some physical and chemical parameters, including pH value, temperature (T), electrical conductivity (EC), total hardness (TH), and total dissolved solids (TDS), in all water samples. The water samples were collected according to standard methods, 34 in which the concentration of radon activity was also measured. Some parameters were measured directly in the field (mainly physical parameters), while chemical analyses were conducted in the analytical laboratory.
Temperature (T), pH, electrical conductivity (EC), and total dissolved solids (TDS) were measured using WTW 340i multiparameter instruments and Aqualytic PC Compact Instruments, with pH specifically measured using Hanna pH meters. Total hardness (TH) was determined via titration with EDTA using a manual burette setup in the laboratory. Detailed information on measuring the concentration of radon activity in water is given in the article. 35
2.2 High resolution γ-ray spectrometry
The measurement of the concentration of radionuclides in the soil samples were performed by γ-ray spectrometry using HPGe detector at the Laboratory for Radioactivity Measurements (LMR) of the Jožef Stefan Institute (JSI), Slovenia. The HPGe detectors used in the laboratory have an efficiency higher than 24 % and cover the energy range from 4 keV to 2,800 keV. All detectors are equipped with in-house custom-fit-for-purpose shields, consisting of an outer shell shield, and an inner shell shield made up of graded layers. The shields are vented by aged (radon-free) nitrogen air. 36 The geometry of the sample, its matrix, its density, the coincidence summing corrections and the counting frequency, known as systematic effects in gamma-ray spectrometry, are taken into account in the estimation of the activity concentration of the radionuclides. 37 , 38 The measurement uncertainties are calculated following the Guide to the Expression of Uncertainty in Measurement rules. 39 The activity concentrations of the long-lived radionuclides were determined by first evaluating the activity concentrations of daughter products with short half-lives. 40 , 41 All samples were packed in the same geometry, while the counting time for the measurement process was 24 h.
3 Results
3.1 Radon in soil
3.1.1 Concentration of radon activity in soil in relation to earthquakes-Vitia area
The monitoring of radon concentration in the Vitia area was carried out from January 2022 to March 2023 (64 weeks). The highest value of radon concentration in Vitia was 73.2 kBq/m3, while the lowest was 19.8 kBq/m3. During the monitoring period, earthquake data were directly obtained from the Seismological Institute of Kosovo. During the period of monitoring the radon activity concentration in the Vita area, there were 6 earthquakes (01.04.2022, 17.05.2022, 03.06.2022, 31.07.2022, 17.08.2022, 09.03.2023), with low magnitude. The magnitude of these earthquakes was from M = 1.8 to M = 2.6. The distance of the epicenters of the earthquakes to the place where radon measurements were conducted ranged from 6.4 km to 19 km.
In Figure 2, sees the radon concentration with error bars during the research period in the Vitia area, the measurements are not one-after-one in every case, in the graph the one-after-one measurements are connected with lines to show them. The red circle show the radon concentration during the period earthquakes occured. Figure 2 shows the weekly rainfall during the monitoring period of this study. The precipitation data were obtained from the official website of the Kosovo Hydrometeorological Institute. The closest meteorological station to the radon concentration sampling site in the Vitia area is the Gjilan meteorological station, located approximately 15 km away.
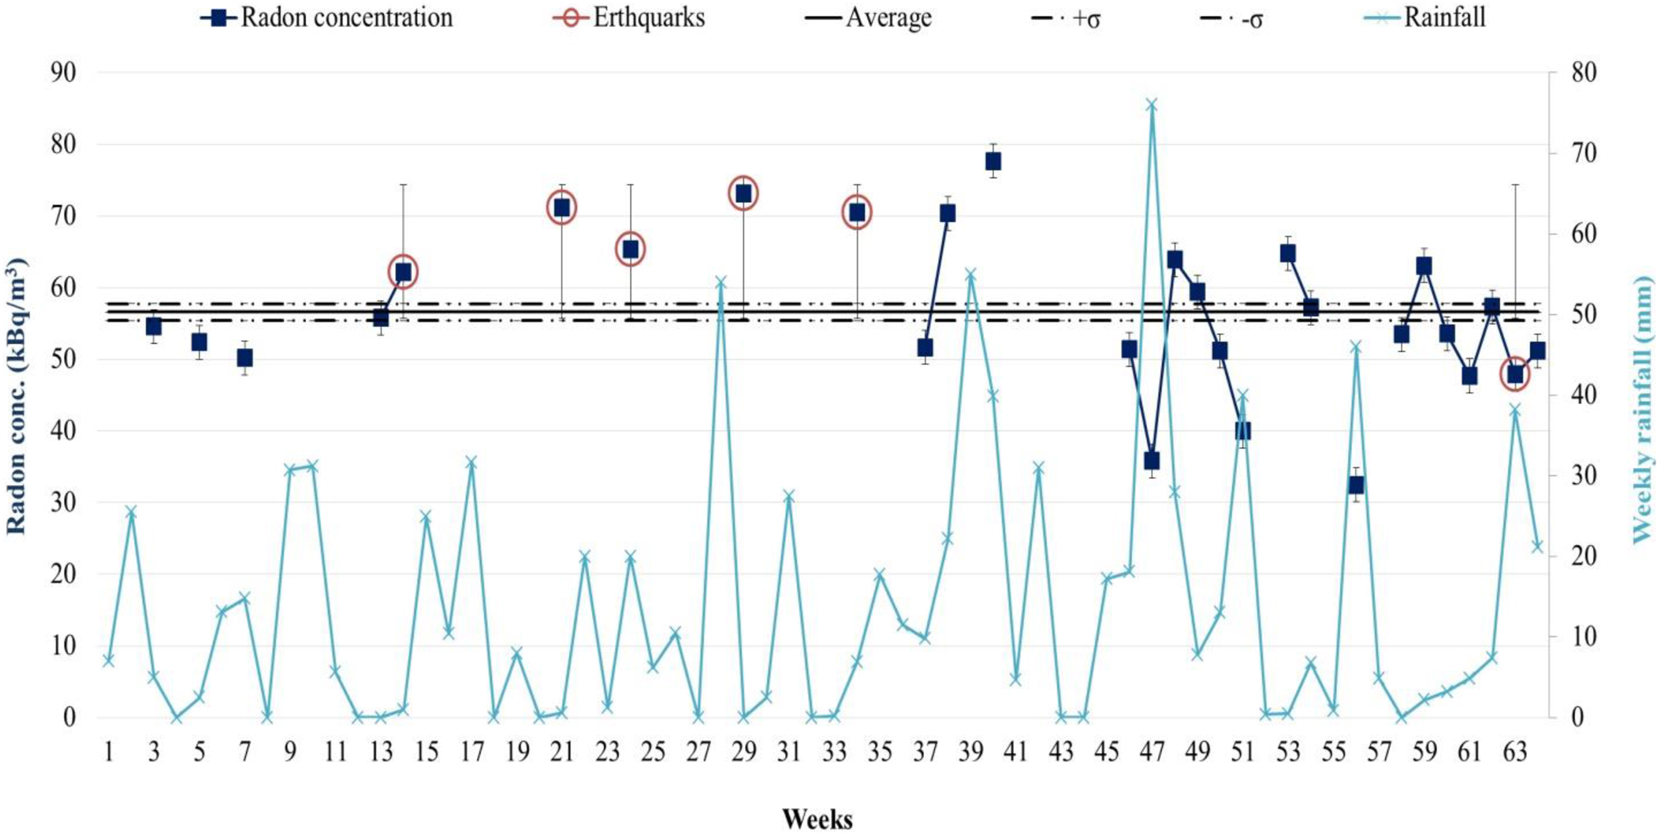
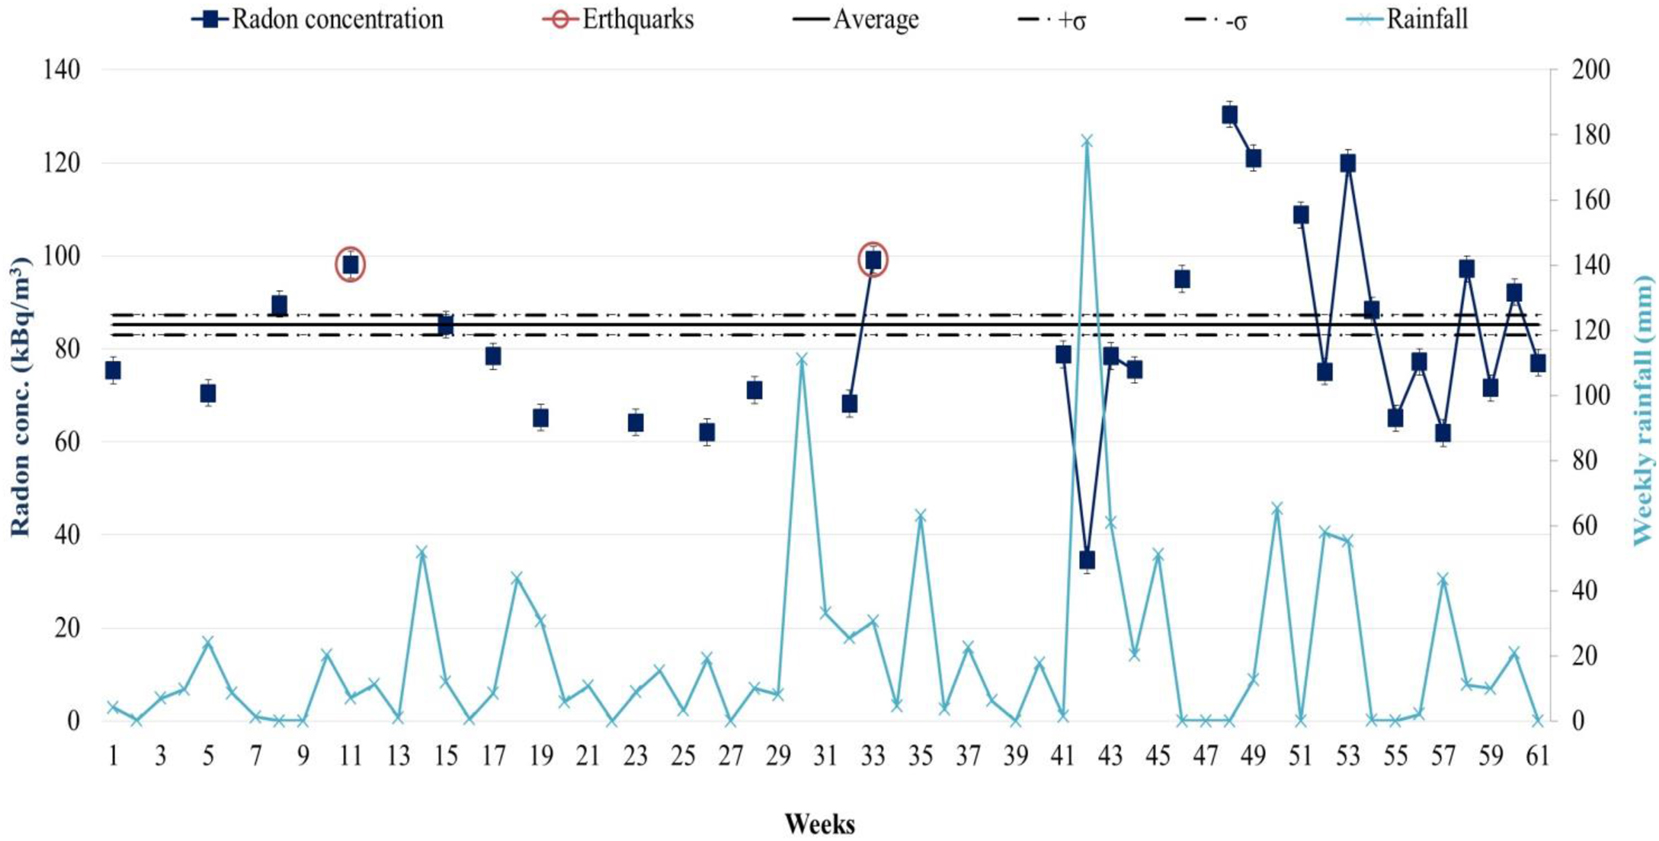
Radon activity concentrations and weekly rainfall in Vitia from January 2022 to March 2023.
The average value of radon concentration and standard deviation (σ) in Vitia was 56.6 ± 1.19 kBq/m3. The average radon concentration and standard deviations were calculated from the results obtained during the research period in the Vitia area. The results of radon concentration measured during earthquakes and heavy rain events were not taken into account for the calculation of the average value of the radon concentration and the standard deviation. As can be seen in Figure 2, the measurement interval from week 14 to 34 of the monitoring was an active period with earthquakes of small magnitude. The measurements continued, from week 37 to 64, this interval which was not characterized by earthquakes (only one, M = 1.8) but was influenced by different meteorological conditions(rain fall). The lowest values of radon concentration in the Vitia area were presented in the third week of November 2022 (week 47 of the monitoring period) and in the third week of January 2023 (week 56 of the monitoring period), in coincidence with heavy rain events. As discussed by the other authors presented in this reference 42], water can cause the reduction of air permeability in the soil, in these cases low values of radon concentration in the soil can be expected to be measured. After the end of the rains, the permeability of the air in the soil will increase and therefore higher values of the concentration of radon in the soil can be expected to be measured.
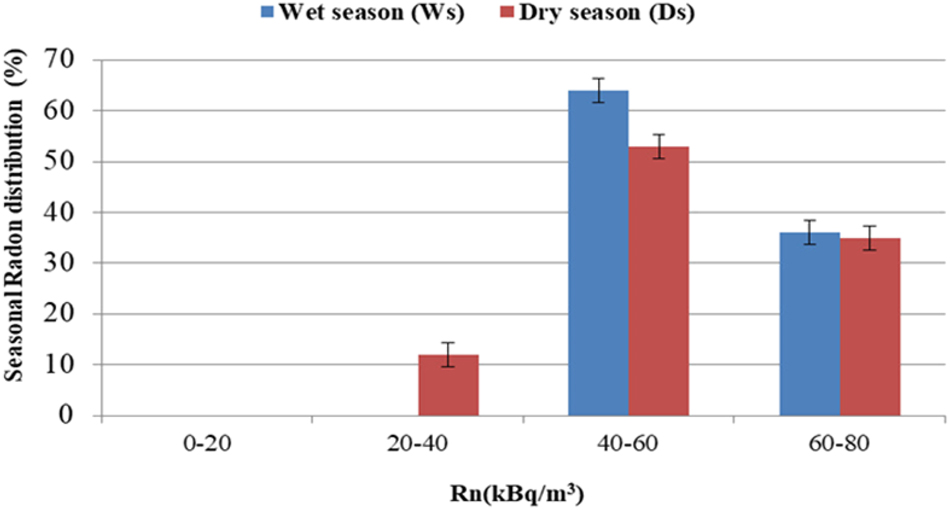
Figure 3 shows the seasonal variations of radon concentration in soil in the two differenc season. We have presented two different weather periods, dry and wet seasons, marked as DS for dry season and WS for wet season. The months that were characterized by the highest precipitation during the monitoring period were called the wet season while the months that were the driest were presented as the dry season. In the Viti area, the months with the most precipitation were: February, March, May, June, August and October while the months with the least precipitation were: January, April, July, September, November and December.
Seasonal variation of radon concentration with error bars in soil in the Vitia area.
In the Vitis area, DS and WS showed the highest frequency distribution within the 40–60 kBq/m3 interval, with 53 % and 64 %, while about 36 % and 35 % of the radon distribution data are within the 60–80 kBq/m3 interval. The lowest frequency distribution value for Ds was 12 % within the 20–40 kBq/m3 interval.
Table 1 presents the seasonal correction factor (SCF) for the wet (WS) and dry (DS) season for the Vitia area. All data obtained in the Viti area were divided into two cycles (DS and WS), and then the seasonal correction factor was found. The SCF was obtained simply by taking the ratio of the seasonal arithmetic mean of radon to the annual arithmetic mean. 20
Seasonal radon correction factor (SCF).
| Seasons | SCF |
|---|---|
| Dry (DS) | 0.98 |
| Wet (WS) | 1.01 |
As shown in the table, the highest SCF value (1.01) was recorded during WS, while the lowest SCF value (0.98) was observed during DS. According to a previous study, 43 the soil becomes water-saturated during the rainy season, causing the radon gas in the soil to move from the wet areas to the dry ones.
The SCF value for Ds means that the radon concentration during the dry period is slightly lower compared to the annual arithmetic mean, while the SCF value for WS means that the radon concentration during the dry period is slightly higher compared to the annual arithmetic mean. The SCF for DS and WS were close to each other since the average annual value of radon concentration in soil does not differ much from the arithmetic mean of the two seasons.
During the survey other parameters were also recorded such as: pressure (P), relative humidity (rH) and temperature (T) of the gas extracted from the soil. Figure 4 presents the values of P, T, relative humidity (rH), and soil radon concentration during the dry season (DS) and the wet season (WS).
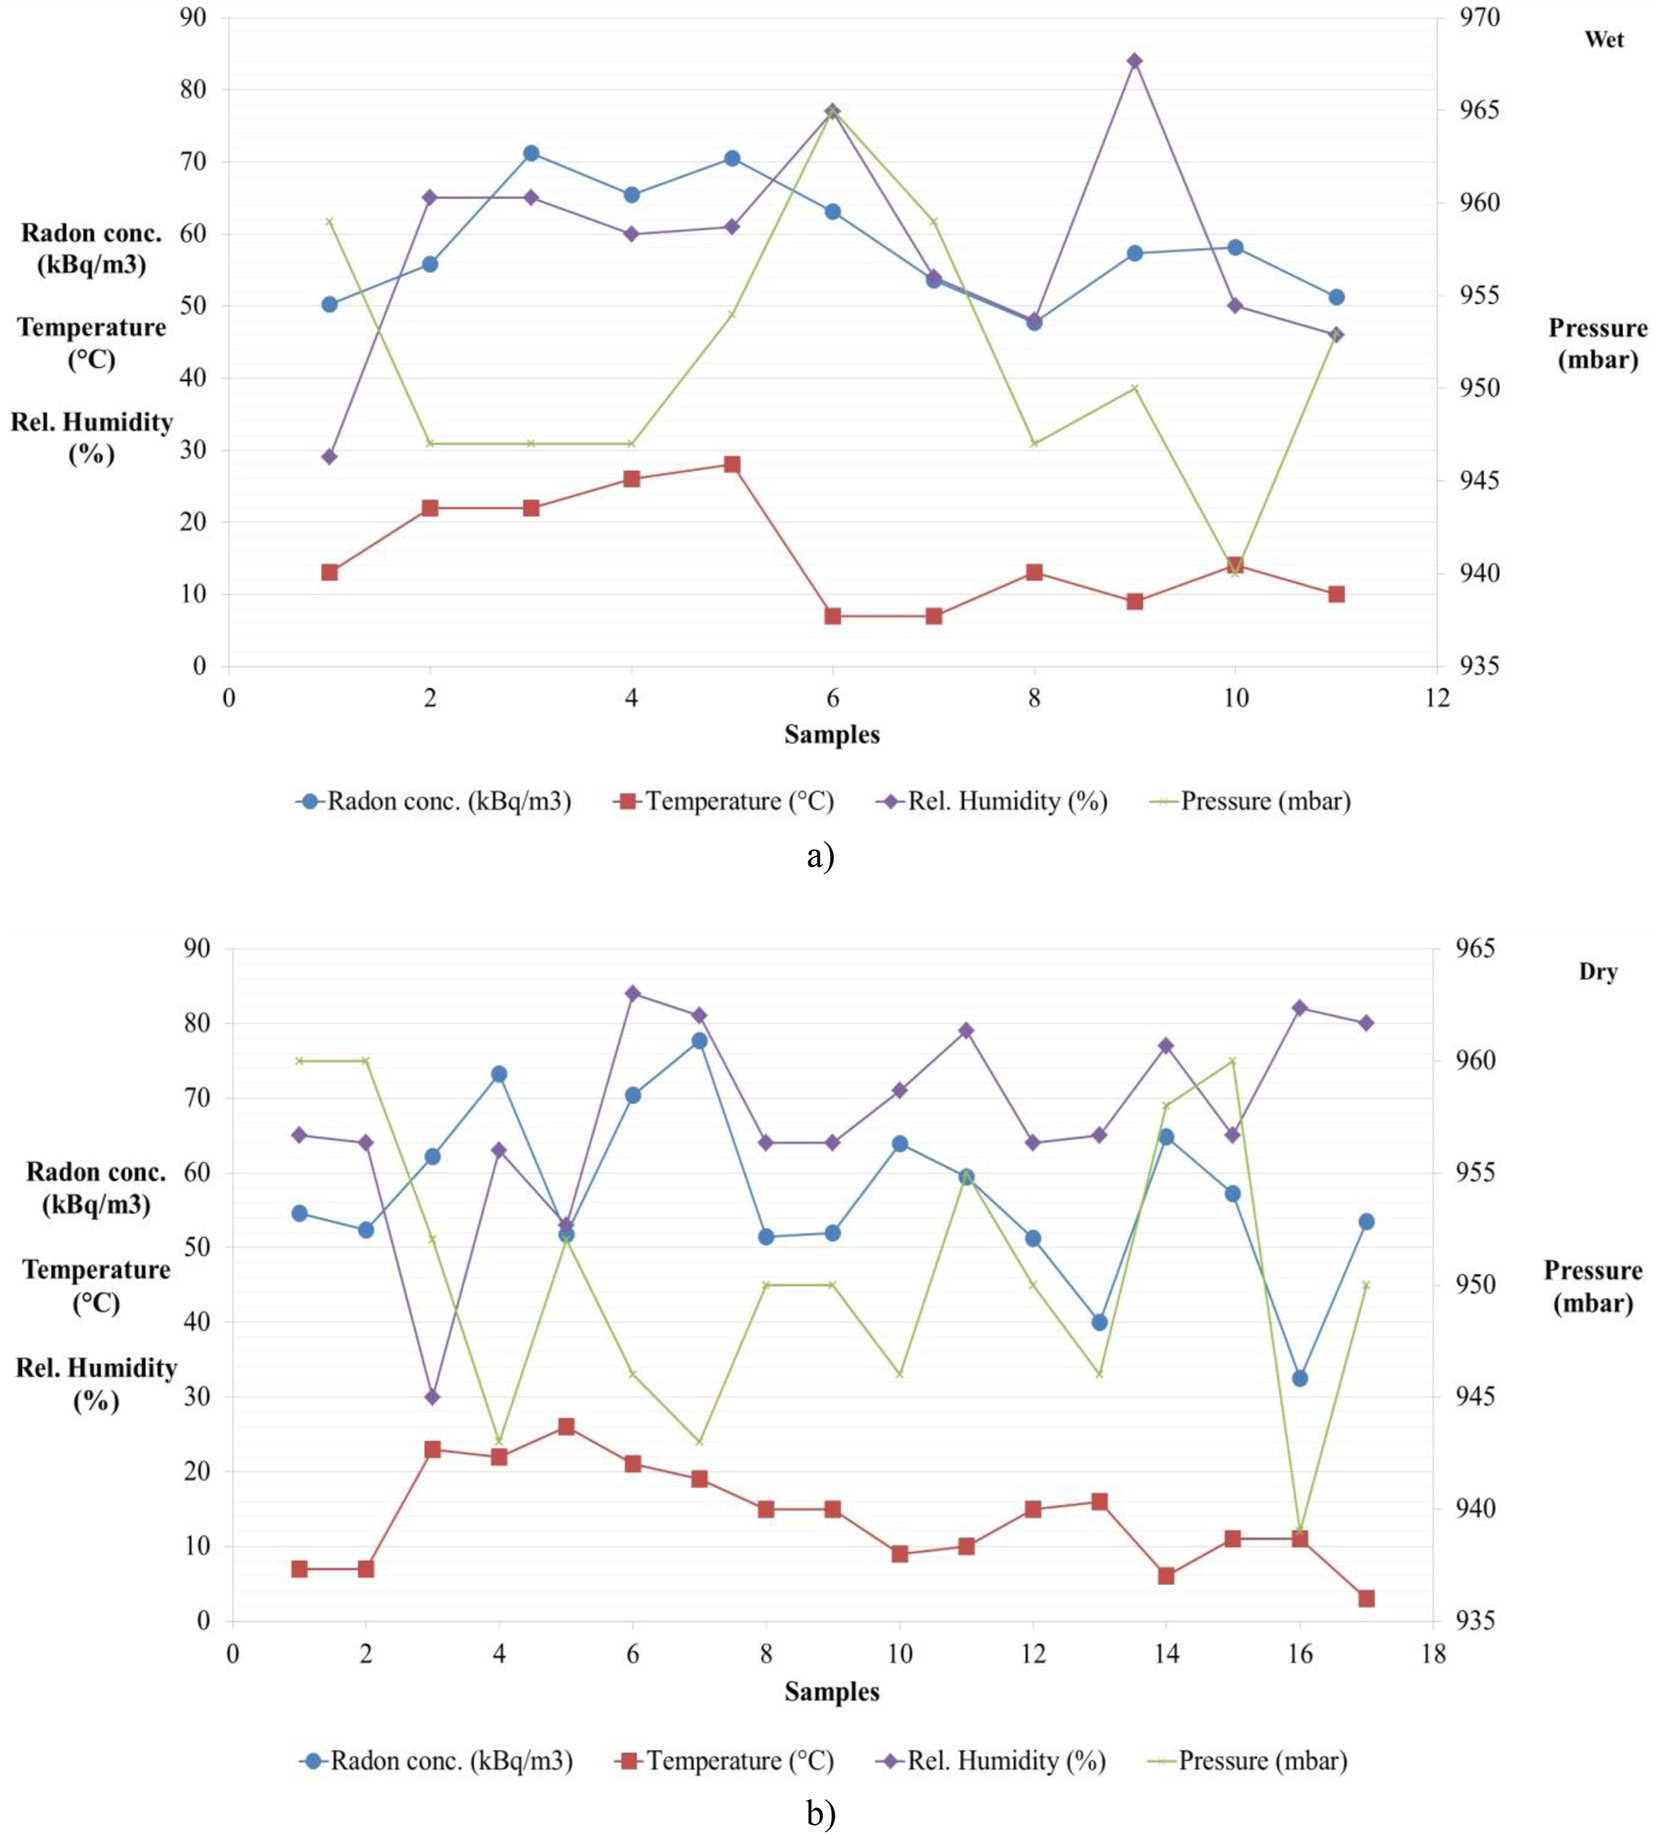
The relationship between radon concentration, relative humidity, temperature, and pressure in Vitia: a) During the wet season and b) during the dry season.
To study the impact of meteorological parameters on radon concentration, Pearson’s correlations for radon in soil and meteorological parameters have been calculated. The correlation coefficient between temperature and soil radon activity concentration during WS was a medium positive correlation (0.63), while during DS this correlation was a weak positive correlation (0.26). A positive correlation between the concentration of radon in soil and temperature has been found by other authors. 14 , 44 According to Nunes LJ et al. 2023, the decrease in the solubility of radon in water with increasing temperature may be due to the fact that, with increasing thermal energy, radon molecules have more energy to escape from the solution and enter the gas phase. 23 No correlation was found between radon concentration in soil and pressure during DS and WS. The correlation between relative humidity and radon was moderately positive (0.51) during WS, while no correlation was found between relative humidity and radon during DS. Similar results regarding the positive correlation between relative humidity and radon were also shown by some previous authors. 42 According this article 45 intermediate moisture levels enhance radon emanation but do not significantly affect permeability. However, high moisture levels can significantly decrease the gas permeability of the soil and impede radon movement through the soil.
Using gamma-ray spectrometry based on HPGe detectors, radionuclide measurements have shown activity concentration values of U-238, Ra-226, Pb-210, Ra-228, Th-228, K-40 and Cs-137 in the soil sample from Vitia: 30 ± 3 Bq/kg, 55 ± 4 Bq/kg, 32 ± 3 Bq/kg, 36 ± 2 Bq/kg, 36 ± 2 Bq/kg, 460 ± 20 Bq/kg, 4.1 ± 0.2 Bq/kg, respectively.
3.1.2 Radon concentration in the soil in relation to earthquakes-Peja area
The measurement of radon concentration in the area of Peja was carried out from February 2022 to March 2023. In the area of Peja, the highest value of radon concentration in soil was 130.4 kBq/m3, while the lowest was 34.6 kBq/m3. The earthquakes in the Peja area were of low magnitude and ranged from M = 1.5 to M = 1.7. The distance of the epicenters of the earthquake from the place where the radon concentration was measured varied from 15.34 km to 15.45 km. The earthquakes that occurred in the Peja area were on April 11, 2022 (week 11 of the monitoring period) and September 17, 2022 (week 33 of the monitoring period).
In Figure 5, sees the radon concentration during our research period in the Peja area, the measurements are not one-after-one in every case, in the graph the one-after-one measurements are connected with lines to show them. The red circle show the radon concentration during the period earthquakes occured. Figure 5 shows the weekly rainfall during the monitoring period of this study. The precipitation data were obtained from the official website of the Kosovo Hydrometeorological Institute. The closest meteorological station to the radon concentration sampling site in the Peja area is the Peja meteorological station, located approximately 7.3 km away.
Radon concentration in soil and weekly rainfall in the Peja from: February 2022 to March 2023.
The average radon concentration and standard deviations were calculated from the results obtained during our research period in the Peja area. The average value concentration of radon in Peja was 85.19 ± 2.15 kBq/m3. The results of radon concentration when there were earthquakes and heavy rains were not taken into account. In Figure 5 from the intervals of the measurements it can see that the meteorological factor of the rainfall had an impact on the reduction of the radon concentration value, these measurements were made at the same time as the heavy rainfall. It is mentioned by researcher Friedmann that precipitation will change the permeability of the soil, which can influence the concentration of radon activity. 18
Measurements with the highest concentration of radon activity were observed in weeks 48, 49, 51 and 53 of the research period (see Figure 5). According to the Institute of Seismology of Kosovo, the area of Peja during this time period, December and January, has not been active in terms of earthquakes. Earthquakes with magnitude M = 2.4, M = 2.5 and M = 2.5 were recorded on 03/12/2022, 21/12/2022 and 27/12/2022 in Montenegro. Montenegro is a neighboring country to Kosovo and the area of Peja is located on the border with Montenegro. 46 The distance from epicenters occurrniess in Montenegro to Peja was varied nearly 30 km till to farest 120 km.
Figure 6 shows the seasonal variation of radon concentration in soil in the Peja area in two different weather periods, the dry and wet season.The months that were characterized by the highest precipitation during the monitoring period were called the wet season while the months that were the driest were presented as the dry season. In the Peja area, the months with the most precipitation were: January, May, June, August, September and November, while the months with the least precipitation were: February, March, April, July, October and December.
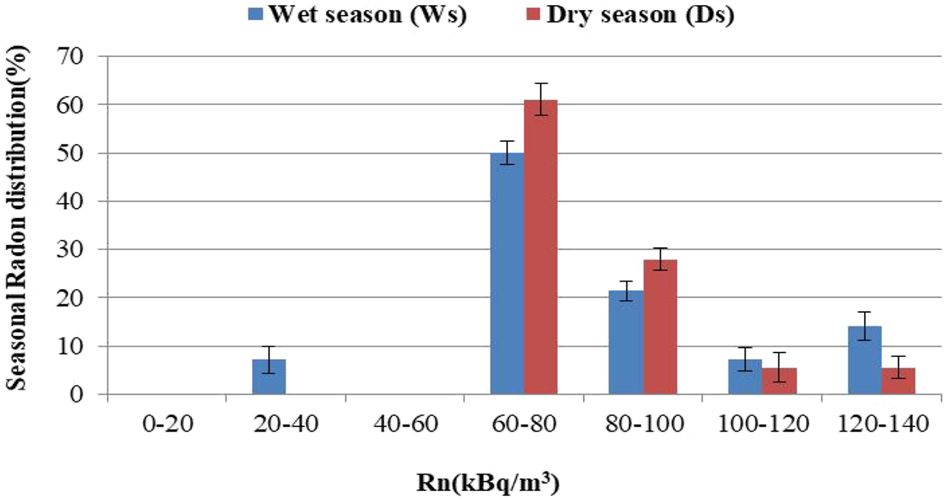
Seasonal variation of radon concentration with error bars in soil in the Peja area.
In the Peja area, Ds and Ws showed the highest frequency distribution within the 60–80 kBq/m3 interval, with 50 % and 61 % respectivly. The lowest frequency distribution value for Ws was 7 % within the 20–40 kBq/m3 and 100–120 kBq/m3 interval, while the lowest frequency distribution value for Ds was about 5.5 % within the 100–120 kBq/m3 and 120–140 kBq/m3 interval. From the interval of 80 to 100 kBq/m3, Ds was approximately 28 %. For the 80–100 kBq/m3 and 120–140 kBq/m3 intervals, the frequency for Ws was about 22 % and 14 %, respectively.
Table 2 presents the seasonal correction factor (SCF) for the wet (WS) and dry (DS) season for the Peja area. All data obtained in the Peja area were divided into two cycles (DS and WS), and then the seasonal correction factor was found. The SCF was obtained simply by taking the ratio of the seasonal arithmetic mean of radon to the annual arithmetic mean. 20
Seasonal radon correction factor (SCF).
| Seasons | SCF |
|---|---|
| Dry (DS) | 0.98 |
| Wet (WS) | 1.01 |
According to the Table 2 the highest SCF value (1.01) was recorded during Ws while the lowest SCF value (0.98) was obtained during DS. According to a previous study, 43 the soil becomes water-saturated during the rainy season, causing the radon gas in the soil to move from the wet areas to the dry ones. The SCF value for Ds means that the radon concentration during the dry period is slightly lower compared to the annual arithmetic mean, while the SCF value for WS means that the radon concentration during the dry period is slightly higher compared to the annual arithmetic mean. The SCF for DS and WS were close to each other since the average annual value of radon concentration in soil does not differ much from the arithmetic mean of the two seasons.
Figure 7 presents the values of P, T, relative humidity (rH), and soil radon concentration during the: a) dry season (DS) and the b) wet season (WS).
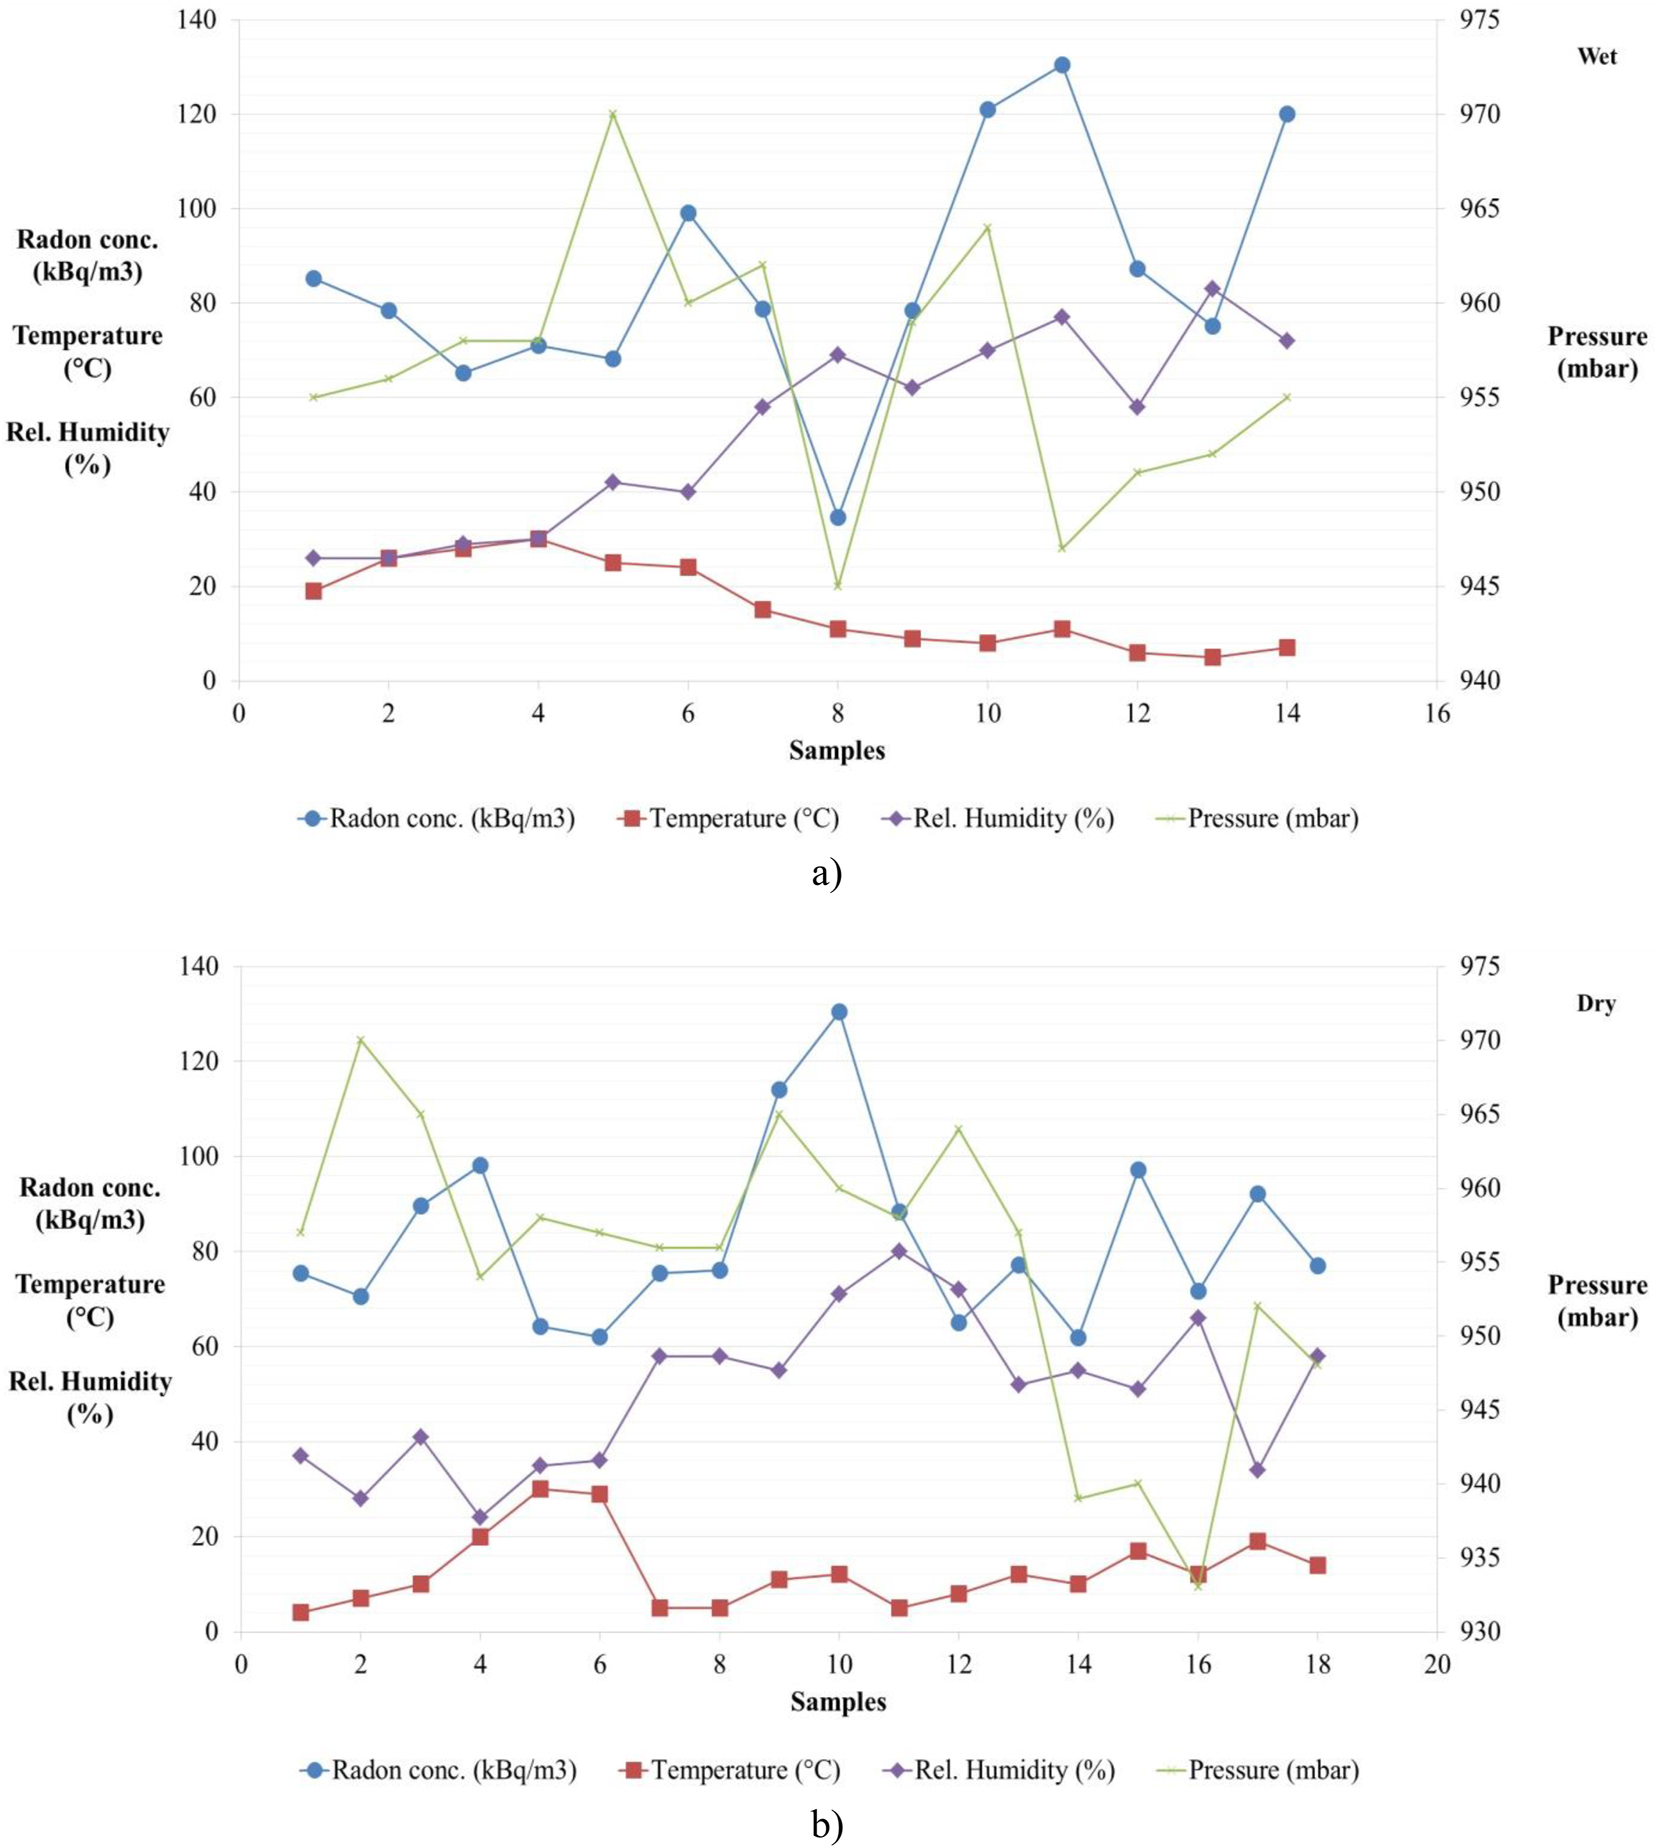
The relationship between radon concentration, relative humidity, temperature, and pressure in Peja: a) During the wet season and b) during the dry season.
To study the influence of meteorological parameters on radon concentration, Pearson correlations were calculated for soil radon and meteorological parameters. The correlation coefficient between temperature and soil radon activity concentration during WS was a weak negative correlation (−0.32), while during DS no correlation between temperature and radon appeared. No correlation and insignificant correlation was found between soil radon concentration and pressure during WS and DS, respectively. The correlation between relative humidity and radon was a positive correlation (0.32) during WS, while insignificant correlation (0.16) during DS. Radon concentration and soil gas humidity are positively correlated in contrast to temperature, was the result presented by a group of authors in 2017. 42
Radionuclide measurements have shown that the average activity concentrations of U-238, Ra-226, Pb-210, Ra-228, Th-228, K-40 and Cs-137 in the soil sample from Peja were as follows:18 ± 5 Bq/kg, 54 ± 5 Bq/kg, 23 ± 3 Bq/kg, 45 ± 2 Bq/kg, 43 ± 2 Bq/kg, 460 ± 20 Bq/kg, 3.1 ± 0.2 Bq/kg, respectively.
3.2 Radon in water
The physico-chemical parameters were monitored in this research to have a clear understanding of the influence of radon concentration and in what correlation they stand with radon activity, similar studies were also found by some authors. 47 , 48 , 49 Parameters such as: pH, EC, TH and TDS in area of Peja and Vitia was analyzed in 16 water samples which were taken from spring water during the winter and spring seasons.
Water samples were measured in 2023 and the frequency of measurements was approximately every week, eight samples were analyzed in winter and eight in spring. During this period, there were no earthquakes in the area of Peja, while in the area of Vitia there were earthquakes of low magnitude: M = 1.8 (09/03/2023). The maximum values of radon in water during research period were observed on 10/03/2023 (275.3 Bq/L).
The concentration of radon in spring water in the area of Peja varied from 6.7 ± 1.3 Bq/L to 9.6 ± 1.6 Bq/L, while in the area of Vitia it varied from 212.8 ± 10.7 Bq/L to 275.5 ± 13.8 Bq/L. In Vitia area sampling site, observed a high level of radon concentration in water, this coordinate is located in volcanic rock. According to some researchers in 2021, volcanic rocks were found to contain higher amounts of uranium. 50 The concentration of radon activity in spring water in the Vitia area exceeds the standard recommended by the EC. 51
The pH value in the area of Peja varied from 7.71 to 7.92, while in the area of Vitia the pH varied from 7.22 to 7.64.
TH values during our research period in Peja and Vitia varied from: (8.4 to 9.2) dᵒH and (1.5–2.6) dᵒH respectively.
Electrical conductivity in spring water samples in Vitia and Peja area varied from: (250.4 to 290.7) μS/cm and (71.52–98.2) μS/cm respectively. TDS values in the area of Peja varied from 125.2 to 145.3 mg/L, while in the area of Vitia, TDS varied from 35.7 to 49.1 mg/L. In the Peja area, the temperature varied from (9 to 26) °C while in the Vitia area, it varied from (10 to 20) °C.
Based on the data obtained from the research referred to Table 3, the values of the physicochemical parameters (pH, electrical conductivity, total dissolved solids and total hardness) do not exceed the recommended values according to the World Health Organization. 41
Concentration of radon activity, pH, EC, TDS, TH, T and Standard Values (WHO) in water samples in Peja and Vitia.
| Parameters | Peja | Vitia | Guideline values (WHO) | |
|---|---|---|---|---|
| Rn- radon concentration (Bq/L) | Range (min-max) | 6.7–9.6 | 212.8–275.3 | 100 |
| Average | 7.49 | 249.56 | ||
| pH- concentration of hydrogen | Range (min-max) | 7.711–7.921 | 7.22–7.64 | 6.5–8.5 |
| Average | 7.826 | 7.45 | ||
| EC electrical conductivity (μS/cm) | Range (min-max) | 250.4–290.7 | 71.52–98.2 | 300 |
| Average | 268.78 | 79.03 | ||
| TDS total dissolved solids (mg/L) | Range (min-max) | 125.2–145.3 | 35.7–49.1 | 1,000 |
| Average | 134.38 | 39.46 | ||
| TH total hardness (d°H) | Range (min-max) | 8.4–9.2 | 1.5–2.6 | 500 |
| Average | 8.70 | 2.40 | ||
| T temperature (°C) | Range (min-max) | 9–26 | 10–20 | |
| Average | 17.25 | 16 | ||
Table 4 shows the correlation coefficient of radon in relation to some physicochemical parameters (pH, EC, TDS, TH and T).
Pearson’s correlations for radon in water and pH, EC, TH, TDS and T parameters in Peja and Vitia.
Parameters |
Correlation coefficient | ||
|---|---|---|---|
| Peja | Vitia | Measure of strength | |
| pH- concentration of hydrogen | 0.12 | 0.14 | Insignificant correlation |
| EC- electrical conductivity | 0.65 | 0.51 | Medium correlation |
| TDS- total dissolved solids | 0.40 | 0.15 | Medium correlation/Insignificant correlation |
| TH- total hardness | 0.34 | 0.36 | Weak correlation |
| T-temperature | −0.51 | −0.56 | Medium negative correlation |
Based on the results presented in Table 4, Peja and Vitia showed an insignificant correlation between pH and radon concentration, 0.12 in Peja and 0.14 in Vitia. From these results the activity of radon in spring water it is not depended on the pH value, this is because radon is an inert gas. No correlation between radon concentration and pH parameter was found by several groups of authors. 47 , 48 , 49 , 52
In the area of Peja, the correlation of radon in relation to EC was observed to be 0.65 (medium positive correlation), according to 53 the concentration of radon activity in water is positively correlated with EC. While in the area of Vitia the correlation of radon in relation to EC was observed to be 0.15 (insignificant correlation). These authors found an insignificant correlation between radon concentration and EC. 48 , 54
The concentration of radon in relation to TDS in the area of Peja was presented with the correlation coefficient value of 0.40 (low positive correlation) while in Vitia with the value of 0.15 (negligible correlation). According these authors 47 , 48 , 49 also found an insignificant correlation between radon concentration and TDS. The numerical value of the correlation coefficient for the concentration of radon activity in water in relation to TH was almost the same in Peja 0.34 and in Vitia 0.36 (weak positive correlation). Likewise, the correlation coefficient for the concentration of radon activity in water in relation to T was approximately the same in both areas, in Peja with −0.51 and in Vitia −0.56 (medium negative correlation). Acording to 52 , 55 the radon concentration was found to be negatively correlated with water temperature, (−0.70) and (−0.43) respectively.
The values of the correlation coefficients between the concentration of radon activity and the physico-chemical parameters, such as pH, TH, TDS, and EC were found to be less than the significant values required for the present data set. 47 , 48 , 49 , 56 Based on the results obtained from both sampling sites (Peja and Vitia), an average negative relationship was observed between the concentration of radon activity in water and the temperature. 52 , 55
4 Conclusions
The temporal variation of radon in soil is studied for more than one year in Vitia and Peja areas in Kosovo. The concentrations of radon in soil in Vitia area is found to vary from 19.8 kBq/m3 to 73.2 kBq/m3, while in Peja area vary from 34.6 kBq/m3 to 130.4 kBq/m3. There are differences in radon levels between Peja and Vitia, which are due to geology and specifically mechanical properties, since radium levels are similar, 55 ± 4 Bq/kg and 54 ± 5 Bq/kg in Vitia and Peja area. Vitia has a greater geological diversity, including sedimentary melange, alluviums, and also magmatic rocks, while Peja consists of proluvium sediments with intergranular porosity. During this period radon activity in soil gases and monitor seismic activity are investigated in order to make an effort of this nature. It should be noted that the earthquakes that occurred during the study period were of low magnitude (below 2.6), which may result in slight variations in radon concentration. Indeed the average value concentration of radon in Vitia was 56.6 ± 1.19 kBq/m3 neglecting results when earthquakes and heavy rains have occurred. While in Peja the average value concentration of radon was 85.19 ± 2.15 kBq/m3. Although the correlation between seismic activity and radon concentration appeared slight positive, the data unequivocally supports the notion that seismic disturbances influence of radon dynamics in soil. Despite its subtlety, this correlation underscores the intricate relationship between geological activities and the patterns of radon emissions.
Observations also delved into the relationship between radon levels and meteorological factors such as barometric pressure and relative humidity. The seasonal variation of radon concentration in soil in the Peja and Vitia area is studied in two different weather periods, the dry and wet season. According to the results the SCF values are found to be similar (1.01) was recorded during Ws while the lowest SCF value (0.98) was obtained during DS both in Vitia and Peja area. Since measurements were performed during both the dry and wet seasons (Ds and Ws), the application of the seasonal correction factor SCF only modestly improved the accuracy of the results in obtaining the true annual average radon concentrations. On the other hand from the study of the correlation of soil radon and meteorological parameters is found a week negative correlation with the temperature and positive correlation with humidity while no correlation is found wiht pressure both in Vitia and Peja areas. While these relationships were not definitively strong, they highlight the complex nature of radon’s response to atmospheric conditions a subject that remains diversely interpreted in scientific literature. Some studies report a negligible correlation between soil radon exhalation and atmospheric pressure, while others underscore its significance, pointing to a nuanced scientific debate that our findings contribute to.
Regarding the temporal variation of radon in water in Vitia and Peja areas in Kosovo show concentrations of 7.5 Bq/L and 251.1875 Bq/L respectively. The results presented in this research have shown that the concentration of radon activity in water did not depend on the value of pH, TDS, EC, and TH of the water, but most likely depended on temperature.
These data constitute the first preliminary results of measuring the concentration of radon activity in the soil/water in the Republic of Kosovo. This research recommends that continuous, long-term measurements of radon concentration could clarify its correlation with seismic events, thereby strengthening the argument for its predictive value.
-
Research ethics: Not applicable.
-
Informed consent: Not applicable.
-
Author contributions: NE: conceptualization, data analysis, investigation, visualization, methodology writing original draft; GX: conceptualization, data analysis; BZ: conceptualization, data analysis, methodology, original draft; VB: geological aspect; SM: erthquake data; BR: data analysis, investigation.
-
Use of Large Language Models, AI and Machine Learning Tools: Not applicable.
-
Conflict of interests: The authors declare no competing interests.
-
Research funding: The authors declare no competing interests.
-
Data availability: There was no data set, the measurements were performed manually through the AlphaGuard instrument and each measurement performed was placed directly in the pertinent tables.
References
1. Immè, G.; Morelli, D. Radon as Earthquake Precursor. Earthquake Research and Analysis – Statistical Studies, Observations and Planning. InTech 2012; https://doi.org/10.5772/29917.Suche in Google Scholar
2. Martinelli, G.; Tamburello, G. Geological and Geophysical Factors Constraining the Occurrence of Earthquake Precursors in Geofluids: A Review and Reinterpretation. Front. Earth Sci. 2020, 8, 596050. https://doi.org/10.3389/feart.2020.596050.Suche in Google Scholar
3. Jordan, T. H.; Chen, Y. T.; Gasparini, P.; Madariaga, R.; Main, I.; Marzocchi, W.; Papadopoulos, G.; Sobolev, G.; Yamaoka, K.; Zschau, J. Operational Earthquake Forecasting. State of Knowledge and Guidelines for Utilization. Ann. Geophys. 2011, 54 (4). https://doi.org/10.4401/ag-5350.Suche in Google Scholar
4. Szajerski, P.; Zimny, A. Numerical Analysis and Modeling of Two-Loop Experimental Setup for Measurements of Radon Diffusion Rate through Building and Insulation Materials. Environ. Pollut. 2020, 256, 113393. https://doi.org/10.1016/j.envpol.2019.113393.Suche in Google Scholar PubMed
5. Galiana-Merino, J. J.; Molina, S.; Kharazian, A.; Toader, V. E.; Moldovan, I. A.; Gómez, I. Analysis of Radon Measurements in Relation to Daily Seismic Activity Rates in the Vrancea Region, Romania. Sensors 2022, 22 (11), 4160. https://doi.org/10.3390/s22114160.Suche in Google Scholar PubMed PubMed Central
6. Kulalı, F.; Akkurt, İ.; Özgür, N.; Sezer, M. The Correlation of the Seismic Activities and Radon Concentration in Soil Gas. Arab J Geosci 2018, 11, 447. https://doi.org/10.1007/s12517-018-3743-8.Suche in Google Scholar
7. Ye, Q.; Singh, R. P.; He, A.; Ji, S.; Liu, C. Characteristic Behavior of Water Radon Associated with Wenchuan and Lushan Earthquakes along Longmengshan Fault. Radiat. Meas. 2015, 76, 44–53. https://doi.org/10.1016/j.radmeas.2015.04.001.Suche in Google Scholar
8. Kawabata, K.; Sato, T.; Takahashi, H. A.; Tsunomori, F.; Hosono, T.; Takahashi, M.; Kitamura, Y. Changes in Groundwater Radon Concentrations Caused by the 2016 Kumamoto Earthquake. J. Hydrol. 2020, 584, 124712; https://doi.org/10.1016/j.jhydrol.2020.124712.Suche in Google Scholar
9. Namvaran, M.; Negarestani, A. Measuring the Radon Concentration and Investigating the Mechanism of Decline Prior an Earthquake (Jooshan, SE of Iran). J. Radioanal. Nucl. Chem. 2013, 298, 1–8; https://doi.org/10.1007/s10967-012-2162-7.Suche in Google Scholar
10. Ambrosino, F.; Thinová, L.; Briestenskỷ, M.; Guidicepietro, F.; Roca, V.; Sabbarese, C. Analysis of Geophysical and Meteorological Parameters Influencing 222Rn Activity Concentration in Mladě C Caves (Czech Republic) and in Soils of Phlegrean Fields Caldera (Italy). Appl. Radiat. Isot. 2020, 160, 109140; https://doi.org/10.1016/j.apradiso.2020.109140.Suche in Google Scholar PubMed
11. Tomer, A. Radon as a Earthquake Precursor: a Review. Int. J. Sci., Eng. Technol. 2016, 4 (6), 815–822. https://www.ijset.in/wp-content/uploads/2016/12/10.2348.11160815.pdf.Suche in Google Scholar
12. Wang, H.; Zhang, L.; Wang, Y.; Sun, C.; Guo, Q. New-designed In-Situ Measurement System for Radon Concentration in Soil Air and its Application in Vertical Profile Observation. J. Nucl. Sci. Technol. 2022, 59 (2), 222–229. https://doi.org/10.1080/00223131.2021.1961638.Suche in Google Scholar
13. Catalano, R.; Immé, G.; Mangano, G.; Morelli, D.; Aranzulla, M.; Giammanco, S.; Thinova, L. In Situ And Laboratory Measurements for Radon Transport Process Study. J. Radioanal. Nucl. Chem. 2015, 306, 673–684. https://doi.org/10.1007/s10967-015-4336-6.Suche in Google Scholar
14. Haider, T.; Barkat, A.; Hayat, U.; Ali, A.; Awais, M.; Alam, A.; Rehman, K.; Shah, M. A. Identification of Radon Anomalies Induced by Earthquake Activity Using Intelligent Systems. J. Geochem. Explor. 2021, 222, 106709. https://doi.org/10.1016/j.gexplo.2020.106709.Suche in Google Scholar
15. Tsuchiya, M.; Nagahama, H.; Muto, J.; Hirano, M.; Yasuoka, Y. Detection of Atmospheric Radon Concentration Anomalies and Their Potential for Earthquake Prediction Using Random Forest Analysis. Sci. Rep. 2024, 14 (1), 11626. https://doi.org/10.1038/s41598-024-61887-6.Suche in Google Scholar PubMed PubMed Central
16. Woith, H. Radon Earthquake Precursor: A Short Review. Eur. Phys. J. Special Top. 2015, 224 (4), 611–627. https://doi.org/10.1140/epjst/e2015-02395-9.Suche in Google Scholar
17. Riggio, A.; Santulin, M. Earthquake Forecasting: a Review of Radon as Seismic Precursor. Boll. Di Geofisic. Teor. Appl. 2015, 56 (2), 95–114; https://doi.org/10.4430/bgta0148.Suche in Google Scholar
18. Friedmann, H. Radon in Earthquake Prediction Research. Radiat. Prot. Dosim. 2012, 149 (2), 177–184. https://doi.org/10.1093/rpd/ncr229.Suche in Google Scholar PubMed
19. Huang, P.; Lv, W.; Huang, R.; Luo, Q.; Yang, Y. Earthquake Precursors: A Review of Key Factors Influencing Radon Concentration. J. Environment. Radioact. 2024, 271, 107310. https://doi.org/10.1016/j.jenvrad.2023.107310.Suche in Google Scholar PubMed
20. Algin, E.; Asici, C. E. L. A. L.; Sogukpinar, H.; Akkurt, N. A Case Study on the Use of Seasonal Correction Factors for Indoor Radon Measurements. Radiat. Protect. Dosim. 2019, 183 (4), 423–431. https://doi.org/10.1093/rpd/ncy161.Suche in Google Scholar PubMed
21. Miles, J. C. H.; Howarth, C. B.; Hunter, N. Seasonal Variation of Radon Concentrations in UKhomes. J. Radiol. Prot. 2012, 32 (3), 275–287. https://doi.org/10.1088/0952-4746/32/3/275.Suche in Google Scholar PubMed
22. Denman, A. R.; Crockett, R. G.; Groves-Kirkby, C. J.; Phillips, P. S. Interpreting Short and Medium Exposure Etched-Track Radon Measurements to Determine whether an Action Level Could Be Exceeded. J. Environment. Radioact.2 2016, 162-163, 279–284. https://doi.org/10.1016/j.jenvrad.2016.06.004.Suche in Google Scholar PubMed
23. Nunes, L. J.; Curado, A.; Lopes, S. I. The Relationship between Radon and Geology: Sources, Transport and Indoor Accumulation. Appl. Sci. 2023, 13 (13), 7460. https://doi.org/10.3390/app13137460.Suche in Google Scholar
24. Appleton, J. D. Radon in Air and Water. In Essentials of Medical Geology; Selinus, O., Ed.; Springer: Dordrecht, 2013.10.1007/978-94-007-4375-5_11Suche in Google Scholar
25. Kessongo, J.; Bahu, Y.; Inácio, M.; Peralta, L.; Soares, S. Radon Concentration Potential in Bibala Municipality Water: Consequences for Public Consumption. Radiat. Phys. Chem. 2020, 173, 108951. https://doi.org/10.1016/j.radphyschem.2020.108951.Suche in Google Scholar
26. Neziri, F.; Bytyqi, V. Mass Movements Analysis along a Road Segment (Batushë-Rrasa e Kosharës) in Alpine Region in Kosova. Eco. Eng. Environmen. Technol. 2024, 25 (2), 302–310. https://doi.org/10.12912/27197050/177070.Suche in Google Scholar
27. Bytyqi, V. Water and Popuplation: Spatial and Temporal Distribution of Water and Population in Kosovo. KASA 2024. https://ashak.org/botime/ujerat-dhe-popullsia/.Suche in Google Scholar
28. Bytyqi, V.; Agaj, T. Spatial Estimation of Soil Erosion Using Geospatial Technique – a Case Study of Janjeva River Catchment (Kosovo). Carpathian J. Earth Environment. Sci. 2024, 19 (2), 233–243. https://doi.org/10.26471/cjees/2024/019/294.Suche in Google Scholar
29. Gürbüz, A.; Shala, A.; Mustafa, S.; Erten, A. Active Tectonics of Western Kosova: Insights from Geomorphic 1 and Structural Analyses. Bulletin Mineral Res. Explor. 2022, 1–34. https://doi.org/10.19111/bulletinofmre.1186708.Suche in Google Scholar
30. Retkoceri, B.; Ahmeti, M.; Çadraku, H. S. Seismicity and Tectonics of the Republic of Kosovo. Studia Geotech. Et Mech. 2024, 46 (3), 223–229. https://doi.org/10.2478/sgem-2024-0015.Suche in Google Scholar
31. Li, T.; Wang, N.; Li, S. Preliminary Investigation of Radon Concentration in Surface Water and Drinking Water in Shenzhen City, South China. Radiat. Prot. Dosim. 2015, 167 (1-3), 59–64. https://doi.org/10.1093/rpd/ncv207.Suche in Google Scholar PubMed
32. Alonso, H.; Cruz-Fuentes, T.; Rubiano, J. G.; González-Guerra, J.; Cabrera, M. D. C.; Arnedo, M. A.; Tejera, A.; Rodríguez-Gonzalez, A.; Pérez-Torrado, F. J.; Martel, P. Radon in Groundwater of the Northeastern Gran Canaria Aquifer. Water 2015, 7 (6), 2575–2590. https://doi.org/10.3390/w7062575.Suche in Google Scholar
33. Bertin Technologies AlphaGUARD Portable Radon Monitors User Manual. Germany 2024. https://www.bertin-technologies.com/product/radon-professional-monitoring/radon-alphaguard/.Suche in Google Scholar
34. APHA, AWWA, WEF. Standard Methods for Examination of Water and Wastewater. 22nd ed. Washington: American Public Health Association; 1360, 2012; http://www.standardmethods.org/.Suche in Google Scholar
35. Elezaj, N.; Zorko, B.; Xhixha, G.; Bytyqi, V. Radon Activity Concentrations and Radiological Exposure Assessment in Drinking Water in Prizren Region–Kosovo. Int. J. Environ. Anal. Chem. 2023, 1–15. https://doi.org/10.1080/03067319.2023.2298719.Suche in Google Scholar
36. Glavič-Cindro, D.; Korun, M.; Nečemer, M.; Vodenik, B.; Zorko, B. Evaluation of Comparison and Proficiency Test Resu S of Gamma-Ray Spectrometry at Jožef Stefan Institute from 1986 to 2014. Appl. Ration Isot. 2016, 109, 54–60. https://doi.org/10.1016/j.apradiso.2015.12.025.Suche in Google Scholar PubMed
37. Hazou, E.; Zorko, B.; Dzagli, M. M.; Haliba, E. M.; Guembou Shouop, E. J.; Ndontchueng Moyo, M.; Tchakpele, P. K. Transfer from Soil to Grass and Statistical Analysis of Naturally Occurring Radionuclides in Soil from Phosphate Mining and Processing Sites in Maritime Region of Togo. Environ. Earth Sci 2021, 80, 626. https://doi.org/10.1007/s12665-021-09931-w.Suche in Google Scholar
38. Glavič-Cindro, D.; Hazou, E.; Korun, M.; Krištof, R.; Osterman, P.; Petrovič, T.; Vodenik, B.; Zorko, B. Measurement Uncertainty Arising from Sampling of Environmental Samples. Appl. Radiat. Isot. 2020, 156, 108978. https://doi.org/10.1016/j.apradiso.2019.108978.Suche in Google Scholar PubMed
39. Korun, M.; Kovačič, K. Determination of the U-238 in Ground-Water Samples Using Gamma-Ray Spectrometry. Appl. Radiat. Isot. 2011, 69 (3), 636–640. https://doi.org/10.1016/j.apradiso.2010.12.010.Suche in Google Scholar PubMed
40. Bučar, K.; Korun, M.; Vodenik, B. Influence of the Thorium Decay Series on the Background of High-Resolution Gamma-Ray Spectrometers. Appl. Radiat. Isot. 2012, 70 (6), 1005–1009. https://doi.org/10.1016/j.apradiso.2012.03.014.Suche in Google Scholar PubMed
41. World Health Organization Guidelines for Drinking-Water Quality: Fourth Edition Incorporating the First and Second Addenda; World Health Organization: Geneva, 2022, ISBN: 978-92-4-004506-4 (electronic version), ISBN: 978-92-4-004507-1 (print version).Suche in Google Scholar
42. Kulali, F.; Akkurt, I.; Özgür, N. The Effect of Meteorological Parameters on Radon Concentration in Soil Gas. Acta. Physica. Polonica A 2017, 132 (3), 999–1001; https://doi.org/10.12693/APhysPolA.132.999.Suche in Google Scholar
43. Otoo, F.; Kpordzro, R.; Amable, A. S. Radon Mapping, Correlation Study of Radium, Seasonal Indoor Radon and Radon Exhalation Levels in Communities Around Ghana Atomic Energy Commission. Heliyon 2023, 9 (4). https://doi.org/10.1016/j.heliyon.2023.e15259.Suche in Google Scholar PubMed PubMed Central
44. Tareen, A. D. K.; Rafique, M.; Basharat, M. Study of Diurnal and Seasonal Variations in the Time Series Data of Soil 222Rn Gas. Int. J. Environ. Anal. Chem. 2021, 101 (3), 337–350. https://doi.org/10.1080/03067319.2019.1666834.Suche in Google Scholar
45. Pyngrope, A.; Saxena, A.; Khardewsaw, A.; Sharma, Y.; Sahoo, B. K. Effect of Soil’s Porosity and Moisture Content on Radon and Thoron Exhalation Rates. J. Radioanal. Nucl. Chem. 2022, 331 (4), 1975–1984. https://doi.org/10.1007/s10967-021-08168-y.Suche in Google Scholar
46. Montenegro Earthquakes Archive: Past Quakes in 2022. Volcano Discovery. https://earthquake.usgs.gov/earthquakes/map.Suche in Google Scholar
47. Qadir, R. W.; Asaad, N.; Qadir, K. W.; Ahmad, S. T.; Abdullah, h. y. Relationship between Radon Concentration and Physicochemical Parameters in Groundwater of Erbil City, Iraq. J. Radiat. Res. Appl. Sci. 2021, 14 (1), 61–69. https://doi.org/10.1080/16878507.2020.1856588.Suche in Google Scholar
48. Srilatha, M. C.; Rangaswamy, D. R.; Sannappa, J. Studies on Concentration of Radon and Physicochemical Parameters in Ground Water Around Ramanagara and Tumkur Districts, Karnataka, India. Int J Adv Sci Tech Res. 2014, 2 (4), 641–660. http://www.rspublication.com/ijst/index.html.Suche in Google Scholar
49. Idriss, H.; Salih, I.; Sam, A. Study of Radon in Ground Water and Physicochemical Parameters in Khartoum State. J. Radioanal. Nucl. Chem. 2011, 290 (2), 333–338. https://doi.org/10.1007/s10967-011-1295-4.Suche in Google Scholar
50. Saleh, G. M.; Emad, B. M.; Kader, I. B. A.; Sakr, R. M. The Possible Source of Uranium Mineralization in Felsic Volcanic Rocks, Eastern Desert, Egypt of the Arabian-Nubian Shield: Constraints from Whole-Rock Geochemistry and Spectrometric Prospection. Acta Geochim. 2021, 40, 819–845. https://doi.org/10.1007/s11631-021-00472-4.Suche in Google Scholar
51. Directive, E. .U. Council Directive 51/EURATOM of 22 October 2013 Laying Down Requirements for the Protection of the Health of the General Public with Regard to Radioactive Substances in Water Intended for Human Consumption. Off J Eur Union 2013, 296, 12–21. https://data.europa.eu/eli/dir/2013/51/oj.Suche in Google Scholar
52. Kasić, A.; Kasumović, A.; Adrović, F.; Hodžić, M. Radon Measurements in Well and Spring Water of the Tuzla Area, Bosnia and Herzegovina. Arhiv za higijenu rada i toksikologiju 2016, 67 (4), 332–339. https://doi.org/10.1515/aiht-2016-67-2788.Suche in Google Scholar PubMed
53. Guida, D.; Guida, M.; Guadagnuolo, D.; Cuomo, A.; Knöller, K.; Schubert, M.; Siervo, V.; Aloia, A. Origin of high radon levels in karst spring mixed waters – the case-study of the Capodifiume spring group, National Park of the Cilento and Vallo di Diano -European Geopark (Southern Italy). Boll. Della Societa Geologica Italiana 2013, 28, 78–81.Suche in Google Scholar
54. Smail, J. M.; Azeez, H. H.; Mansour, H. H.; Ahmad, S. T. Radon Activity Concentration Measurements in the Water Collected from the Lower Zab River in the Kurdistan Region of Iraq. ARO-The Sci. J. Koya Univ. 2023, 11 (2), 51–58. https://doi.org/10.14500/aro.11192.Suche in Google Scholar
55. Duggal, V.; Mehra, R.; Rani, A. Determination of 222Rn Level in Groundwater Using a Rad7 Detector in the Bathinda District of Punjab, India. Radiat. Prot. Dosim. 2013, 156 (2), 239–245. https://doi.org/10.1093/rpd/nct054.Suche in Google Scholar PubMed
56. Sharma, N.; Sharma, R. Survey of Radon Concentration in Drinking Water Samples of Hoshiarpur and Ropar Districts of Punjab, India. Adv. Appl. Sci. Res. 2013, 4, 226–231. www.pelagiaresearchlibrary.com.Suche in Google Scholar
© 2025 the author(s), published by De Gruyter, Berlin/Boston
This work is licensed under the Creative Commons Attribution 4.0 International License.
Artikel in diesem Heft
- Frontmatter
- Original Papers
- Synthesis of amide imidazole-based functionalized ionic liquid for separation of Th/Pu
- Measurement of integral cross sections of some neutron induced reactions on rubidium at a TRIGA reactor: comparison with integrated data from evaluated data libraries
- Production and purification of research scale 161Tb using cation-exchange semi-preparative HPLC for radiopharmaceutical applications
- The enhancement of mtrABDEF gene expressions in Shewanella azerbaijanica, through acclimation in high uranium concentrations
- Temporal variation of radon in soil and water in Kosovo
- Investigation of some radiation interaction parameters with aluminum–boron alloys
- Radiation shielding performance of lead-borate glasses with rare-earth oxides: a comparative analysis