
Magnetic hybrid materials interact with biological matrices
-
Christine Gräfe


Abstract
Magnetic hybrid materials are a promising group of substances. Their interaction with matrices is challenging with regard to the underlying physical and chemical mechanisms. But thinking matrices as biological membranes or even structured cell layers they become interesting with regard to potential biomedical applications. Therefore, we established in vitro blood-organ barrier models to study the interaction and processing of superparamagnetic iron oxide nanoparticles (SPIONs) with these cellular structures in the presence of a magnetic field gradient. A one-cell-type–based blood-brain barrier model was used to investigate the attachment and uptake mechanisms of differentially charged magnetic hybrid materials. Inhibition of clathrin-dependent endocytosis and F-actin depolymerization led to a dramatic reduction of cellular uptake. Furthermore, the subsequent transportation of SPIONs through the barrier and the ability to detect these particles was of interest. Negatively charged SPIONs could be detected behind the barrier as well as in a reporter cell line. These observations could be confirmed with a two-cell-type–based blood-placenta barrier model. While positively charged SPIONs heavily interact with the apical cell layer, neutrally charged SPIONs showed a retarded interaction behavior. Behind the blood-placenta barrier, negatively charged SPIONs could be clearly detected. Finally, the transfer of the in vitro blood-placenta model in a microfluidic biochip allows the integration of shear stress into the system. Even without particle accumulation in a magnetic field gradient, the negatively charged SPIONs were detectable behind the barrier. In conclusion, in vitro blood-organ barrier models allow the broad investigation of magnetic hybrid materials with regard to biocompatibility, cell interaction, and transfer through cell layers on their way to biomedical application.
1 Introduction
A broad and highly promising branch of nanotechnology is covered by nanomedicine—the field of health and medicine involving the development and application of nanoscale objects for diagnostic and therapeutic purposes as well as for monitoring and preventing diseases. Thus, it is expected that nanomedicine will improve early diagnosis and treatment of a wide range of diseases by development of better devices, highly specific and efficient drugs, and innovative therapies [1]. More precisely, the utilization of nanoparticle formulations and nanodrugs can help to overcome obstacles like the appearance of severe side effects, instability of drugs, drug delivery to difficult-to-reach sites, and bioavailability, while at the same time increasing therapeutic efficiencies [2]. Passive drug targeting usually is achieved by enhanced permeability and retention (EPR) effects often prevailing in fenestrated tissues and leaky vessels of tumors combined with low lymphatic drainage [3]. By specific conjugation of nanoparticles with ligands directed toward cellular surface or environmental markers, particles can be targeted actively to sites of interest such as tumors, metastases, or inflammation [4]. A horizontal scan published in 2015 by Noorlander et al [5] identified clearly assigned nanomedicinal products already approved for clinical use by the European Medicines Agency (EMA) and Food and Drug Administration [5]. The authors identified most of the products being designated to therapeutic applications, especially cancer treatment, whereas nanomedicinal objects directed toward diagnosis and vaccines constitute a small percentage only. As proposed by Pelaz et al. [1], a major scientific challenge is the lack of knowledge about the behavior of nanoparticles inside living organisms. In order to bridge the gap between laboratory and clinics, an intensive and multidisciplinary cooperation between physicists, chemists, biologists, pharmacists, and physicians is of vital importance.
A special class of nanoparticles is constituted by superparamagnetic iron oxide nanoparticles (SPIONs), whose magnetization appears to be zero in the absence of an external magnetic field, whereas they behave similarly to a paramagnet under the influence of an external magnetic field [6]. Cores of such particles are made of the two main forms, magnetite (Fe3O4) or its oxidized product maghemite (γ-Fe2O3), and usually comprise multiple domains with single magnetic domain sizes below 12–15 nm in order to achieve the superparamagnetic character [7], [8]. While its saturation magnetization is moderate only [9], in contrast to other solid nanoparticles including cobalt and nickel, the essential element iron is naturally occurring in the human body and therefore not associated with any intrinsic risk [10]. The daily uptake of iron via dietary products is estimated to be 1–2 mg, whereby upon its metabolization, it is used as an essential cofactor of several enzymes and proteins [11]. However, not only iron deficiency constitutes a general problem in human health but also iron excess and accumulation within cells and organelles can result in pathological disorders [12]. Usually, SPIONs are equipped with an additional coating surrounding the iron oxide core in order to maintain colloidal stability especially in aqueous solutions and to protect the magnetite core from further oxidation. Such coatings are adopted according to the application and are also important for particles’ biocompatibility and biodegradability. Additionally, they open the possibility of ligand conjugation for further functionalization [13], [14]. For instance, polymers such as polysaccharides and polyethylene glycol (PEG) are frequently used materials showing good biocompatibility [15], while silica coatings allow low loss rates of transmitted light and therefore are widely used for bioimaging and biosensing purposes [16].
The superparamagnetic property of SPIONs opens up new and highly attractive applications especially in the biomedical field. Thus, they can be utilized for site-specific drug delivery during magnetic drug targeting, as contrast agents for magnetic-based imaging techniques, as heat inducers in hyperthermia anticancer therapy, in magnetic tissue engineering, and for cell labeling and in vivo cell tracking [1], [13], [14], [17]. As the first nanomedicinal product, ferumoxil (also known as Lumirem®—a siloxane-coated SPION of 300 nm) was approved by the EMA as an MRI contrast agent in 1994, and since then, four more SPION products have been introduced into clinics until today [5]. The shortening effect of SPIONs on especially transverse relaxation time T2 induces a signal loss during MRI, which results in a negative (i.e., dark) contrast image [18]. In addition, approaches utilizing aminosilane-coated SPIONs together with application cycles of alternating magnetic fields are approved for efficient hyperthermia treatment of tumor entities such as glioblastoma and other entities [19]. Thus, clinical trials revealed an improvement of median survival time from 6.2 to 13.4 months without any complications compared to conventional therapy of glioblastoma [20]. Further studies indicate that hyperthermia treatment prior to radiotherapy induces a radiosensitizing effect on glioma cells [18].
A currently arising new nanomedical sector is formed by the fusion of diagnostic and therapeutic applications, called “theranostics” [21]. Particularly, theranostics allows both monitoring of pharmacokinetics via methods such as imaging and therapeutic treatment of diseases including cancer. Therefore, multistep procedures are eliminated, which in turn accelerates disease treatment and pave the way for individualized medicine. Especially SPIONs are highly predestined candidates for implementations of theranostics as their multifunctional potential easily allows the combination of contrast-enhancing features in MRI with magnetic drug targeting and hyperthermia-based cancer therapy [13]. Impressively, preclinical investigations performed by Hayashi et al. [22] using SPIONs heterofunctionalized with PEG and folic acid demonstrated efficient particle accumulation in myeloma cancer tissues of mice, resulting in enhanced contrast during MRI. At the same time, the application of an external alternating magnetic field specifically induced local hyperthermia, promoted tumor shrinkage, and significantly prolonged overall survival of diseased animals.
Despite the various beneficial and promising functions of SPIONs in biomedicine, there are still several obstacles limiting their unconditional use. A major aspect comprises the fact that studies have revealed that only a small proportion of actively targeted SPIONs actually reach target tissue [4]. To overcome this problem by magnetic drug targeting, magnetic field configurations allowing elevated penetration depths are critical as the magnetic field strength shrinks cubically with growing distance. Furthermore, premature burst of drug cargoes, especially at instillation time points, impairs delivery efficiencies to target sites and may evoke cytotoxic side effects [23]. The so-called protein corona comprising an adsorptive layer of ambient proteins on the particles’ surface immediately after contact with the environmental medium can critically influence biological effects of SPIONs and thus hamper intended purposes [24]. This phenomenon also impedes the comparability of data obtained from both in vitro and in vivo studies using similar particle formulations and might induce their premature immunologic clearance from the bloodstream caused by the reticuloendothelial system (RES). Finally, in several cases, the fate of internalized SPIONs into cells and their biodistribution are not clear, whereas for a safe and effective clinical application, such information is of vital importance. Hence, more standardized studies related to these issues are imperatively needed [13].
1.1 Cellular barriers
Cellular barriers define a compartment for organs and tissues and allow protection from harmful materials and influences as well as control of entry and release of substances and molecules. Most of the cellular barriers in the human body form an interface between peripheral blood and organs, like the brain, the placenta, or the eye. But also the skin, the air-lung barrier, or the intestinal barrier have to be mentioned.
1.1.1 Blood-brain barrier
As the center of the central nervous system (CNS), the brain constitutes a highly complex organ controlling all other body parts and functions. Despite its mass with only 2% relative to the total body mass, its demand for 20% of the body’s nutrients is considerably high [25]. For its sufficient supply on the one hand and its protection from harmful stimuli on the other hand, the blood-brain barrier (BBB) forms a selective physiologic barrier between the peripheral circulatory system and the CNS. Thus, the maintenance of homeostatic concentrations of ions, such as Na+, K+, and Ca2+, is considered an essential prerequisite for proper neuronal functions [26].
1.1.1.1 General structure
The BBB is maintained by a complex interplay between several components of the so-called “neurovascular unit.” The central element of this unit is embodied by the endothelial cells of cerebral microvessels, also referred to as brain microvascular endothelial cells (BMECs). Compared to peripheral endothelial cells, BMECs are featured by tight cell-cell junctions lacking fenestration, increased contents in mitochondria, and minimal pinocytotic activity [26], [27]. In addition to ubiquitously abundant adherence junctions, the presence of tight junctions sealing intercellular clefts between the adjacent cells is a characteristic of BMECs. The formation of such tight junctions is accomplished on the one hand by transmembrane molecules such as junctional adhesion molecule 1, occludin, and claudin and on the other hand by membrane-associated guanylate kinase (MAGUK) proteins, which coordinate cytoplasmic protein-protein interactions via multiple protein-binding domains [26]. MAGUK proteins comprise zonula occludens (ZO) constructs with three subforms (ZO-1–3) joining transmembrane tight junction units with the actin cytoskeleton. As tight junctions are located in apical cellular segments, they not only restrict paracellular permeability to molecules of a few nanometers only [28] and induce strongly elevated transendothelial electrical resistance (TEER; i.e., measurement of electrical resistance across the cellular layer [29]) but also allow cell polarity and asymmetric distribution of membrane constituents [26]. Caused by this asymmetric and site-specific expression of receptors, transporters, and enzymes facing luminal (i.e., apical membrane) or abluminal (i.e., basolateral membrane) sides, the BBB additionally presents a metabolic barrier modulating the activity of toxic and neuroactive compounds. With regard to TEER, the dense abundance of tight junctions in BMECs mediates resistances of more than 1,000 Ω cm2 in vivo compared to 2–20 Ω cm2 in peripheral capillaries [30], [31]. Apart from endothelial cells (i.e., BMECs), further cell types are involved in the formation of the neurovascular unit. In this way, granular and filamentous pericytes irregularly cover abluminal membranes of BMECs forming the closest association with the endothelium. As pericytes possess contractile proteins, they are believed to be involved in the regulation of capillary blood flow [26]. Additionally, pericyte-derived angiopoietin has been shown to induce endothelial expression of occludin enhancing BBB tightness [32]. The 30- to 40-nm-thick basal lamina encloses both pericytes and BMECs [33]. The composition of this lamina is covered by collagen type IV, heparin sulfate, proteoglycans, laminin, fibronectin, and other components of the extracellular matrix and affects BMECs’ intracellular signaling pathways and tight junction expressions via interactions with endothelial integrins [33]. Finally, astrocyte end feet connected to the basal lamina support the BBB and provide the cellular link to neurons. There is strong evidence that astrocytes influence BBB formation by regulating endothelial expression of tight junction proteins, distinct transporters, and specialized enzyme systems via secreted factors including transforming growth factor beta, glial cell–derived neurotrophic factor, and basic fibroblast growth factor [34], [35].
1.1.1.2 Ways across the BBB
For a sufficient supply of the brain with nutrients and the efficient efflux of metabolic waste products on the one hand and its protection from harmful compounds on the other hand, the BBB constitutes not only a physical barrier but also a metabolic and transport barrier too. Small gaseous molecules such as O2 and CO2 can freely pass lipid membranes of the BBB as well as small lipophilic agents including alcohol, cocaine base, and barbiturates. For the transport of small hydrophilic compounds across the BBB, specific transport systems on luminal and abluminal endothelial surfaces are available. The two major superfamilies of such transporters cover ATP-binding cassette (ABC) transporters and solute carriers. In contrast to the transporter-mediated passage, hydrophilic molecules larger than 400–500 Da, such as peptides and proteins, usually are excluded from transcellular trafficking, unless they specifically undergo receptor- or adsorption-mediated transcytosis [18], [36]. Adsorption-mediated transcytosis relies on nonspecific interactions of ligands with surface moieties expressed on luminal membrane sides of endothelial cells. It is predominantly mediated by caveolae- and clathrin-mediated endocytotic processes as well as endocytotic processes independent from clathrin and caveolin. The specific binding of ligands to BMECs’ surface receptors, such as insulin receptors, transferrin receptors, and low-density lipoprotein (LDL) receptor–related proteins, is mandatory for receptor-mediated transcytosis. In this way, the brain is efficiently supplied with insulin, transferrin-bound iron, LDL, lactoferrin, and many more.
The tight regulation of transport systems across the BBB often constitutes a considerable obstacle for efficient delivery of therapeutic drugs into the brain. Therefore, specific strategies for overcoming this hurdle have been developed. The injection of hyperosmolar solutions of mannitol, lactamide, saline, or others into the brain-supplying carotid artery has been shown to transiently disrupt cerebral tight junctions by shrinking endothelial cells, which in turn improves the delivery of chemotherapeutic drugs into the CNS of patients with various types of brain tumors [37]. Similarly, chemical destabilization of the BBB by alkylglycerols efficiently limits BBB opening to 3–15 min [38]. Another strategy to temporarily access the brain comprises acoustic cavitation of polymer- or lipid-shelled microbubbles by focused ultrasound [39]. Resulting oscillations of microbubbles induce localized disintegration of tight junctions conveying brain entry for coapplied drugs. Despite indicated conventional approaches facilitating paracellular drug transport, strategies enhancing transcellular carrying have also been developed. These include drug modification toward a more lipophilic character as well as the use of prodrugs, such as l-3,4-dihydroxyphenylalanine, capable for crossing the BBB via transport systems and being converted into active forms on entry [40]. Recently emerged approaches use nanoparticle carriers for enhanced drug delivery into the CNS [13], [36], [41]. For instance, doxorubicin-loaded liposomes functionalized with cationic surface peptides have been shown to efficiently cross the BBB via adsorption-mediated transcytosis in brain tumor–bearing rats [42]. For metallic nanoparticles including SPIONs, passive diffusion, clathrin-mediated transcytosis, and trans-synaptic transport have been demonstrated as mechanisms for overcoming the BBB, whereby the additional application of an external magnetic field enhances SPION accumulation in cerebral perivascular zones within mice [38]. The conjugation of nanoparticle formulations with targeting moieties such as monoclonal antibodies, peptides, and specific plasma proteins encourages transcellular passage through BBB-forming endothelial cells too. Coupling of transferrin or transferrin-binding antibodies to particle surfaces are typical candidates for promoting receptor-mediated transcytosis [43]. Similarly, insulin, lactoferrin, folate, heparin-binding epidermal growth factor (EGF), and integrin α v β 3 have been utilized as ligands for CNS-directed delivery [13], [38], [41], [43]. Another common attempt includes particle coating with polyoxyethylene sorbitan monooleate (polysorbate 80). This nonionic surfactant is expected to adsorb apolipoproteins A-I, B-100, and E, mimicking LDL particles, which interact with LDL receptors leading to receptor-mediated transcytosis through BBB-forming endothelial cells [44]. With respect to brain tumor–specific targeting, tumor-directed ligands, e.g., lactoferrin, neutrophilin-1, EGF, antibodies directed toward vascular endothelial growth factor or EGF receptors including mutant EGF receptor variant III and many others have been suggested to be conjugated to nanoparticles’ surface [18].
1.1.2 Blood-placenta barrier
Pregnant women are daily exposed not only to foreign substances like occupational or environmental materials but also to prescribed maternal medication [45] since prescribed drug use during pregnancy is common in many developed countries [46]. Owing to the placenta being indispensable for a pregnancy, any interference with its function can lead to severe adverse effects on the development of the unborn child [47], [48]. In order to prevent new scandals, like the severe thalidomide-induced birth defects in the 1960s [49], it is important to understand transport mechanisms of different substances through the blood-placenta barrier (BPB) to the fetus and furthermore potential harmful consequences of these materials inside the unborn child and the placenta. Understanding these mechanisms might also help to develop novel drugs that are able to selectively treat complications in the mother, the fetus, or the placenta without harming or affecting the others [50].
1.1.2.1 General structure and functions of the BPB
The BPB, which has the highest interspecies variability among mammals, is a fascinating multifunctional organ [51]. This highly effective structure is responsible for the bidirectional transfer of important substances, like carbon dioxide, oxygen, water, nutrients, vitamins, and hormones, between maternal and fetal blood circulations. Besides these vital materials, xenobiotics also can be transported across this barrier [45].
The placenta is a hemochorial organ, where the fetal tissue directly comes in contact with maternal blood circulation [47]. The actual cellular barrier, which separates the maternal blood in the intervillous space from the fetal blood in the placental vessels, consists of a continuous layer of the syncytiotrophoblast with some individual cytotrophoblasts, a thin layer of chorionic connective tissue and the endothelium of the fetal capillary system [47], [52]. The syncytiotrophoblast layer, which is formed out of cytotrophoblasts by syncytial fusion, was found to be the rate-limiting barrier component [53]. There is only one syncytiotrophoblast in a placenta, which is maintained by the incorporation of cytotrophoblasts throughout gestation [54]. The villous core is filled with mesenchymal cells during early pregnancy, which can later differentiate into various cell types, like endothelial cells and blood cells, macrophages, myofibroblasts, and fibroblasts, which can all be found in this space [47], [54]. Fibroblasts are responsible for the secretion of typical matrix proteins like collagen type I and III and proteoglycans. Furthermore, Hofbauer cells, the macrophages of the placenta, are also present in the villous stroma during pregnancy [54]. During the course of pregnancy, the barrier between maternal and fetal blood supply decreases in thickness from over 50 µm in the second month to less than 5 µm by week 37 of pregnancy owing to thinning of the syncytiotrophoblast layer and spreading of the cytotrophoblasts [52]. This in turn leads to enhanced transport of substances, especially nutrients, through the barrier, which are needed for the growth of the fetus especially in the later stages of gestation [47].
1.1.2.2 Transport mechanisms across the BPB
The most important function of the placenta is the exchange of nutrients, oxygen, and other substances between maternal and fetal blood circulation [45]. To date, several mechanisms are known for the exchange of endogenous as well as exogenous substances through the BPB: passive diffusion, facilitated diffusion, active carrier-mediated transport, and endocytic pathways, especially pinocytosis [47]. Many transporters, among these ABC efflux pumps, were found to be expressed in the fetal capillary endothelium as well as in the syncytiotrophoblast layer. Here, most of the carriers are located on the apical side facing maternal blood, which may help to protect the fetus from putatively cytotoxic or teratogenic substances. Furthermore, the basolateral side of the syncytiotrophoblasts expresses transporters different from the apical ones, which indicates a polarized transport system across the biological barrier [52]. Depending on the thinning of the BPB and the concurrent minimization of the maternal-fetal diffusion distance throughout the course of pregnancy [45], the exchange mechanisms across this barrier might also depend on the gestation time in which the tissue comes in contact with the substance of interest. Furthermore, the characteristics of the compound and its protein-binding capacity also influence its capability to cross the placental barrier [45].
1.2 In vitro barrier models
The BBB constitutes a complex network of several collaborating components, making a plain isolation for functional analyses complicated. In order to experimentally study different aspects with regard to BBB cell biology and screening for CNS drug permeability, diverse models have been developed. Especially, high-throughput drug screening draws on parallel artificial membrane permeability assays as non–cell-based surrogate models composed of filters with lipid membranes [27]. In context of functional studies, on the one hand, in vivo models include animal testing usually using mice and rats as well as guinea pigs, rabbits, dogs, and monkeys [54]. Owing to profound differences in anatomy, physiology, and genetics, the obtained results cannot be directly extrapolated to the human organism [20], though approaches using freshly isolated capillaries from brain tissues have been utilized for ex vivo studies for several decades [55], [56]. As the constant availability of required human tissues is limited and animal testing should be minimized, several cell culture–based in vitro models representing the BBB have been developed for multifunctional analyses. The deliberate isolation of primary BMECs from porcine, bovine, murine, or ratty sources and their implementation in transwell-based studies have contributed to valuable insights into physiologic and pathophysiologic processes regarding the BBB [55], [57], [58]. With regard to setups representing the human BBB, only few models are available. These are either based on stem cell–derived endothelial cells or immortalized human BMEC lines [55]. For the latter case, the lentiviral-immortalized cell line hCMEC/D3 is most widely spread and well characterized. While monocultured cell layers of hCMEC/D3 gain TEER values of 30–50 Ω cm2, co-culture with astrocytes raise TEER values to 60 Ω cm2 [55], [59]. Anyway, a comparative study by Eigenmann et al [59] comprising hCMEC/D3, human brain microvascular endothelial cells (HBMECs), and two other cell lines revealed that while all four endothelial cell lines specifically expressed the adherence junction protein VE-cadherin, tight junction protein ZO-1 was only confirmed in hCMEC/D3 and HBMECs. Focusing on TEER and molecular paracellular permeability, the monoculture of HBMECs attained cell layers of highest tightness in this study. Advanced approaches applying shear stress to endothelial cells by the integration of flow conditions to the apical and/or basolateral side superiorly mimic the in vivo situation of the BBB. As a consequence, endothelial cells respond by structural and functional remodeling and differentiation and result in higher TEER values as compared to static transwell models [27], [60]. However, no model exactly mimics the full expression pattern of enzymes, transporters, receptors, and other structural proteins of an in vivo BBB [34], [55], and no gold standard in vitro model exists.
Since novel medical products like nanoparticles are rapidly developed, there is a requirement for valid and predictive models to mimic the behavior of these materials in the blood-placenta barrier (BPB). Furthermore, the need for medications that are available for pregnant women increases, for which the preclinical study using non–in vivo models is also important [61].
In vivo models using rodents are applied in current research, especially to give information about the biodistribution of materials in whole organisms [50]. But owing to the high species-to-species differences in placental constitution [51], the data gained from these models cannot be readily extrapolated to the human organism [50].
The dual perfused ex vivo human placenta perfusion model, which was first described by Panigel [62] in the 1960s, is based on the usage of the term placentae to study placental function and translocation rates of substances and particles across the BPB. This experimental model allows studying the transfer of substances in the placenta in an organized placental tissue and the simultaneous investigation of physiochemical and pharmacokinetic factors that influence the transfer [63]. While this model maintains the complexity of an intact placenta and is therefore very close to the in vivo situation, the transport studies are technically challenging, the exposure time is limited to 4–8 h, and large amounts of substances or particles are required for the investigations [64]. All in all, this ex vivo model can provide information about the transplacental translocation rate, acute cytotoxicity and possible fetal exposure of substances, and also the potential role of transporters in the placental barrier [47], [50]. Despite all this, a huge drawback of the model is that owing to the usage of the term placentae, the behavior of investigated substances in the first trimester and during the course of pregnancy cannot be studied sufficiently using only this model [47].
Transwell systems, isolated plasma membrane vesicles, and placental tissue explants are classical ways to study the BPB in vitro, which are well-established alternatives to ex vivo and in vivo models and furthermore allow higher throughput [61]. For the transwell system, there are several possible human cell lines, like BeWo, Jar, or JEG-3 [64], but until now, most in vitro studies of transfer across the BPB were performed using the BeWo cell line, in particular the b30 clone [65], [66], [67], [68], [69], [70], which was developed in the 1980s [71]. These human choriocarcinoma-derived cells with strong resemblance to cytotrophoblastic cells have the ability to form confluent monolayers on permeable transwell inserts and are therefore a suitable in vitro model to study the transfer and also special transport mechanisms of different substances, e.g., nanoparticles [48], [50], [61], [64], [65], [70]. Combined, in vitro models, especially transwell-based ones, are suitable for the prescreen of a plethora of compounds and substances in advance to other more complex models and furthermore have the ability for mechanistic transfer studies. Nevertheless, there is still need for improvement of this in vitro model, which lacks anatomic integrity and blood flow, in order to increase its predictive value [47], [50].
1.3 Nanoparticle-barrier interactions
1.3.1 Biocompatibility/toxicity
As the variety of biomedicinal nanoparticles is huge, so are their biological effects. According to the particle type, they can influence cell physiology in many different ways. Obviously, particles characterized by an intensive cellular interaction bring along a great capability for influencing both vitality and physiology of cells. The particle’s ability to penetrate biological barriers and their resulting biodistribution are crucial factors determining nanoparticle-induced outcomes at the systemic level. Apart from the particle size, shape, dose, incubation duration, and type of exposed cells, especially surface coating and functionalization play a substantial role in determining biological effects [13], [72]. Thus, many studies have identified a cationic surface charge of nanoparticle formulations as a decisive factor mediating cytotoxicity via various mechanisms [10], [72], [73], [74], including the induction of nanoscale holes within plasma membranes, which promotes substantial membrane damage resulting in cell death [75]. Fischer et al. [73] demonstrated that besides the cationic surface net charge, the charge density and flexibility of the three-dimensional structure of the coating molecules also essentially determine biological effects. Endosomal escape of cationic nanoparticle formulations explicitly results in the presence of bare particles within the cytosol, which in turn can induce direct interaction of particles with cellular organelles and proteins including the actin cytoskeleton inducing destabilization and cell cycle arrest [10]. Apart from cationic surface charges, anionic nanoparticles are associated with cytotoxic effects, too, whereas neutral particles are largely nontoxic [74], [76], [77]. A reasonable cause for this is provided by the respective studies which show the low adherence of particles coated by dextran, starch, or other neutral materials at the polar plasma membrane, whereas anionic nanoparticles can still cluster at the sparse membrane areas constituting positive charges [76], [78]. Based on the fact that the hydrodynamic size of nanoparticles (and particle agglomerates) affects particles’ reactivity—whereby higher surface-to-volume ratios render elevated surface energies—small particles tend to be more toxic than larger ones [74], [79]. Finally, the formation of a protein corona can also influence biological effects of distinct nanoparticles. After depletion of coating material, cells are exposed to the particle’s often inorganic core, which in the case of SPIONs is per se considered biocompatible in contrast to silver, cadmium, or other metals [10], [80]. However, during further degradation, increasing contents of free iron ions can cross mitochondrial membranes reacting with hydrogen peroxide and oxygen during the Fenton reaction, giving rise to highly reactive hydroxyl radicals [10], [80]. The resulting oxidative stress can provoke radical damage of DNA and other components including the cytoskeleton, which brings on inflammatory processes and cytotoxic events [74].
1.3.2 Attachment and endocytosis
Uptake mechanisms for nanoparticles into the human body are versatile as they can enter via different routes such as the lungs after inhalation, the skin by dermal application, or by enteral resorption upon ingestion [81]. In terms of biomedical applications, direct intravenous administration is widely used—especially in case of cancer nanotherapeutics [82]. The nanoparticles’ biodistribution upon this systemic administration modality is determined according to particle size, shape, surface charge, and other surface properties [83]. While for passive targeting, advantage is taken of the EPR effect, active targeting by grafting distinctive ligands, markers, or functional groups onto particles’ surface can considerably affect their accumulation and elevate local concentrations at specific target sites. Similarly, magnetic drug targeting in case of SPIONs and other magnetic nanoparticles displays another relevant option for actively directing particle distribution. As a consequence of their size in a typical range of subcellular components and biological molecules [84], nanoparticles can show intensive cellular interactions and be taken up into cells via distinct endogenous uptake mechanisms. Usually, nanoparticles are taken up into cells by active endocytotic pathways, though the cellular entry via passive diffusion has been described as well, especially in case of cationic particle formulations [76], [80]. While large particles with exceeding sizes of 500 nm can only be engulfed by specialized cells including macrophages and neutrophils via phagocytosis, the ingestion of smaller particles via pinocytotic vesicles can be actioned by virtually all types of eukaryotic cells [85], [86], [87]. The binding affinity mediated by hydrophobic or electrostatic interactions and receptor-ligand binding to cellular surfaces plays a crucial role in the first step of particle internalization. In this context, diverse studies revealed that cationic surface charges of nanoparticles show intensive interactions with anionic phospholipids or protein domains originating from the glycocalyx (e.g., sialic acids) of cellular plasma membranes [88], whereas neutral and anionic nanoparticles show less pronounced membrane adsorption and subsequent particle internalization [76]. Additionally, the elevated abundance of negatively charged phosphatidylserine in the cytosolic leaflets of the plasma membrane, endosomes, and lysosomes is thought to strengthen the entry of cationic proteins to endocytotic pathways [89]. Subsequent endocytotic ingestion is distinguished into macropinocytosis, caveolin-dependent endocytosis, clathrin-mediated endocytosis, and pathways independent from both clathrin and caveolin with further subclassifications [90], [91]. Most studies focus on clathrin-mediated endocytosis when investigating uptake mechanisms for particles below 200 nm [92], [93], though other processes and even an interplay of several pathways might occur [94]. Regardless of whether particle internalization is induced via plasma membrane invaginations at clathrin-coated pits (i.e., clathrin-mediated endocytosis), cholesterol-rich domains (i.e., caveolin-dependent endocytosis), or other active processes, membrane-budded vesicles transfer the nanoparticle cargo into early endosomes first [87]. Within these compartments, which possess a mild acidified milieu, receptors can be recycled, and digestion off the received material by hydrolysis, as well as its sorting into delivery to specific intracellular compartments or transcytotic pathways, is initiated [95]. Next, the cargo is directed to acidic late endosomes with increasing proteolytic activity before it finally enters lysosomes. For nanoparticle cargoes directed to distinct subcellular targets, pathways avoiding the lysosomal destination of the nanoscaled vehicle are indispensable for successful implementations. Indeed, endosomal escape has been shown for some nanoparticle formulations [13], [96]. Especially, a strongly cationic particle surface charge seems to promote the escape from endosomes to reach the cytoplasm via destabilization of endosomal membranes by mechanisms including ion-pair formation with anionic lipids and endosomal/lysosomal buffering, swelling, and rupture (i.e., the “proton sponge effect”) [97]. Besides the resulting cytosolic delivery, targeting of distinct cellular compartments such as the nucleus, mitochondria, and Golgi has also been pursued [82]. As mentioned earlier, besides surface chemistry, the level of nanoparticle interaction with cells is significantly influenced by particles’ properties including size and shape as well as the cellular type itself and the microenvironment as it can induce the protein corona formation, which in turn provides the particle with a new biological identity [13], [80]. In terms of particle size, gathered data emphasize that, in general, smaller particles are internalized more intensively, although a minimum size seems beneficial for efficient induction of particle uptake probably owing to sufficient cross-linking of membrane receptors [80], [86], [93], [98]. In this regard, Win and Feng [99] observed that polystyrene nanoparticles of 100 nm show most pronounced particle internalization into adenocarcinomal cells, while the uptake of larger (200–1000 nm) particles is gradually decreased and lowest for 50 nm.
The aim of this approach is to investigate the interaction of multifunctional hybrid materials with cellular barriers. The cell membrane can be described as a hybrid matrix, so does the cellular composition of a distinct barrier in the human body. The membranous lipid bilayer with its incorporated proteins, carbohydrates, and fatty acids is on the one hand perfectly structured and on the other hand highly dynamic. With regard to the potential of SPIONs as multifunctional hybrid nanomaterials applicable in biomedicine, their interaction with cellular barriers is of large impact. In order to study the cell-nanoparticle interaction, we established two in vitro blood-barrier models with regard to the medical need and the grade of complexity. On the one hand, a BBB model is based on one representative cell type, and on the other hand, a blood-placenta model consists of two cell types. Furthermore, we evolved the models from a static to a fluidic setup. The SPIONs that were applied to the in vitro barrier models were selected especially for their different coatings and surface charge. The models were run in the presence of a magnetic field gradient, with a special focus on the putative accumulation of nanoparticles behind the barriers.
2 Materials and methods
2.1 Characterization of SPIONs
To determine the hydrodynamic diameter of SPIONs, dynamic light scattering was applied using a Zetasizer nano series ZS (Malvern Instruments, Herrenberg, Germany). Scattered He-Ne laser light (633 nm) detected at 173°, during three independent measurements with 12 replicates each, was used to determine intensity-weighted hydrodynamic diameters. Additionally, zeta potentials were measured using the same instrument but based on laser Doppler velocimetry. Particle concentrations were determined by measuring the saturation magnetization of the prepared samples by means of vibrating sample magnetometry (PMC MicroMag 3900 VSM – Lakeshore Cytotronics Inc., Westerville, USA). The properties of the nanoparticles used are presented in Figure 1. Nanoparticles were applied in concentrations as indicated.
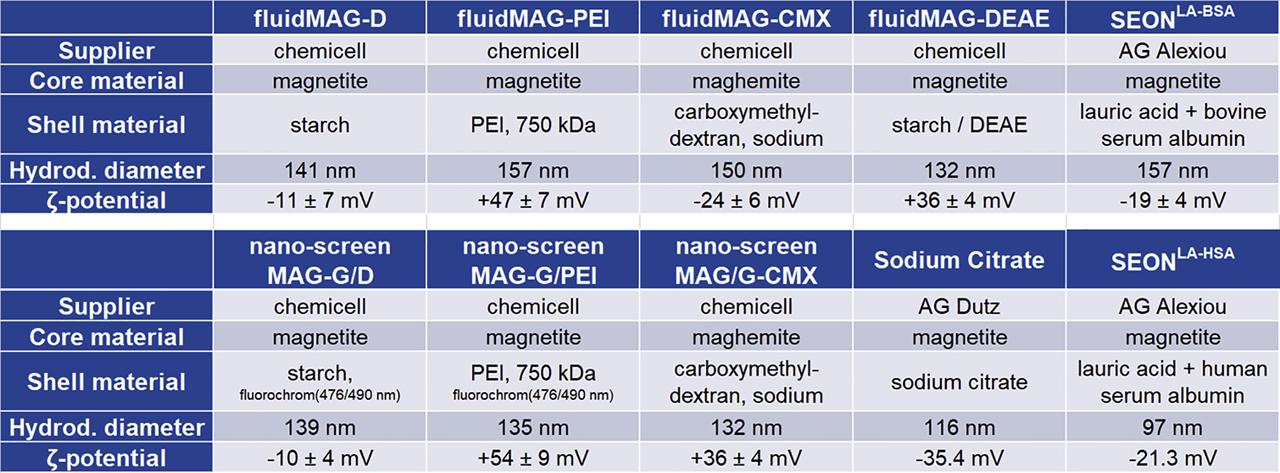
Characteristics of experimentally used SPIONs. SPION = superparamagnetic iron oxide nanoparticle; BSA = bovine serum albumin; DEAE = diethylamine ethyl; PEI = polyethylenimine.
2.2 Cell culture
Cell culture preparations and respective solutions were handled under laminar flow hoods. Equipment was autoclaved and sterilized by rapidly acting ethanol-based wipe disinfection or filtration by using 0.2-µm pore size membrane filters. If not stated otherwise, all cells were cultured at 37 °C in a water-saturated atmosphere supplemented with 5% CO2.
2.2.1 Cell lines
An established cell line of HBMECs was used for building up the in vitro BBB model. This adherent cell line originally isolated from cortical capillaries has been immortalized by introduction of the SV40 large T antigen [100]. HBMECs were kindly provided by Werner Reichardt from Ernst-Abbe-Hochschule Jena. HBMECs were cultivated using RPMI 1640 cell culture medium supplemented with 10% (v/v) fetal bovine serum (FBS) and 1% penicillin/streptomycin (Pen/Strep: 10,000 U/ml/10,000 µg/ml).
Adherent MCF-7 (DSMZ GmbH, Braunschweig, Germany) cells constitute an epithelial cell line derived from the pleural effusion of a female patient with a mammary gland adenocarcinoma. MCF-7 cells were cultured in Dulbecco’s Modified Eagle Medium (DMEM) provided with 10% (v/v) FBS.
The adherent, epithelial-like human choriocarcinoma cell line BeWo (DSMZ), which was first isolated by Pattillo and Gey [101] in 1968, was selected as an in vitro model for the BPB [65], [70]. Furthermore, primary human placental pericytes (hPC-PL, PromoCell GmbH, Heidelberg, Germany), which are multipotent mesenchymal-like cells often found in association with small blood vessels, were used for supporting BeWo cells and extending the in vitro model. These cells were first cultivated in Pericyte Growth Medium (PGM, PromoCell GmbH, Heidelberg, Germany) according to the purchaser’s recommendations, while BeWo cells were grown in DMEM supplemented with GlutaMAX-I and 10% (v/v) FBS. Since pericytes and BeWo cells had to be cultivated in the same medium for the coculture model, both were later kept in DMEM. For some experiments, BeWo cells were cultivated in pericyte-conditioned medium (PCM), which was collected after 3–4 days of pericyte cell cultivation. After centrifugation (10 min at 1000 rcf), the medium was sterile filtrated (0.2-µm pore size), supplemented with 1% Pen/Strep, and stored at 4 °C until further usage. At confluence, the cells were detached using trypsin-EDTA and subsequently subcultured in a ratio of 1:2 to 1:5 with fresh medium. BeWo cells were used for experiments between passages 8 and 30, while pericytes were used in passages 6–10.
In regular intervals, cell cultures were tested with regard to mycoplasmic contaminations using the commercial PCR-based Venor™ Gem mycoplasma detection kit (Sigma-Aldrich Chemie GmbH, Steinheim, Germany).
2.3 Transwell-based generation of an in vitro BBB model
For the creation of in vitro barrier models, transwell permeable supports (diameter: 6.5 mm) with a PET membrane and a pore size of 3.0 µm (Corning, Inc., Corning, USA) were used.
In order to generate the in vitro BBB model, subconfluent HBMECs were harvested and resuspended in a seeding medium being composed of RPMI 1640 supplied with 10% FBS and 1% Pen/Strep. After 30-min equilibration of 24-well transwell inserts within the seeding medium, the equilibration medium was removed, and per insert, 100 µl containing 240,000 cells was added into the insert (apical membrane site/donor compartment). Subsequently, the cell-equipped transwell inserts were carefully placed into 24-well companion plates filled with 600 µl of seeding medium per well (basolateral site/acceptor compartment) (Figure 2A). Cellular growth and cell integrity were verified regularly by means of TEER measurements.
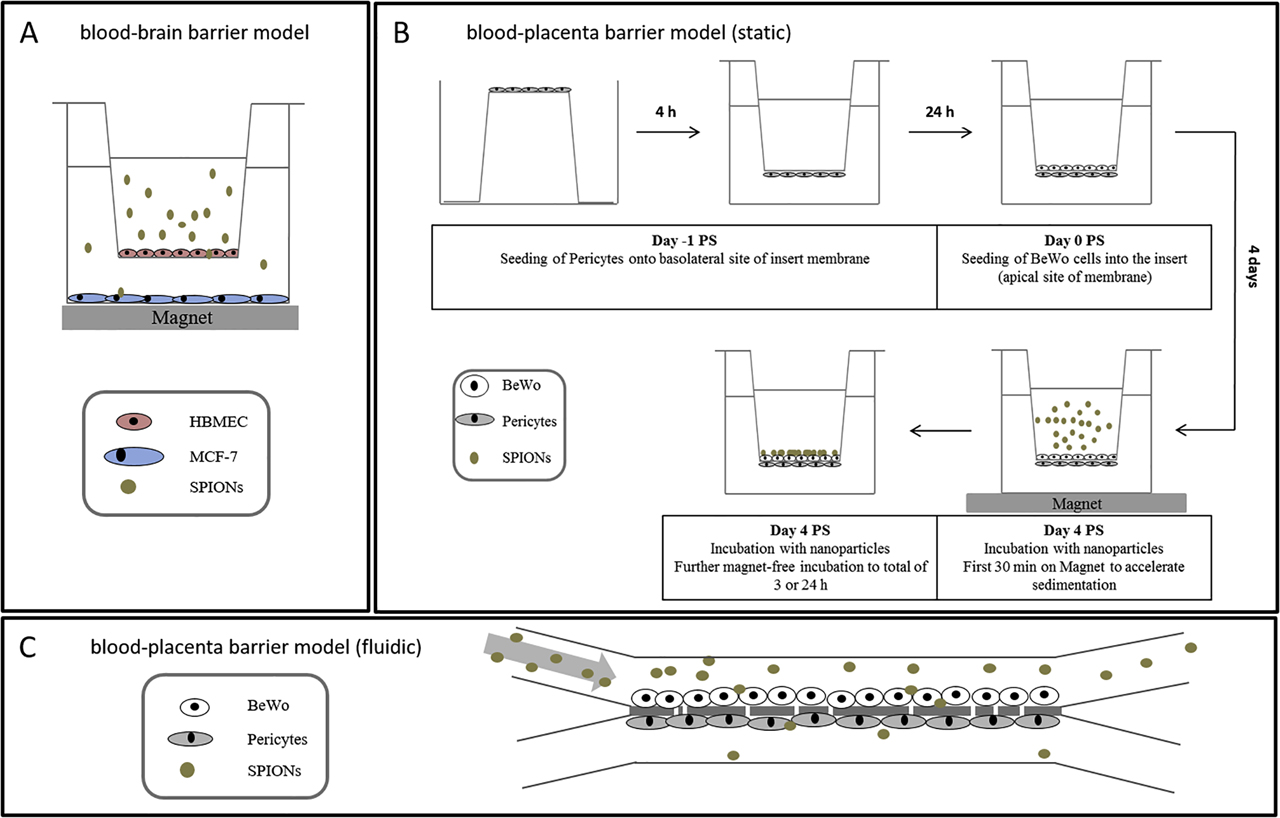
The established in vitro barrier models. (A) In vitro blood-brain barrier model; (B) in vitro blood-placenta barrier model—setup of the static system; (C) in vitro blood-placenta barrier model in a microfluidic biochip. PS = post seeding; HBMEC = human brain microvascular endothelial cell; SPION = superparamagnetic iron oxide nanoparticle.
2.4 Transwell-based generation of an in vitro BPB model
All steps were performed using DMEM supplemented with 1% Pen/Strep. For the coculture model, 350,000 pericytes in 80 µl were seeded onto the basolateral site of inserts that were placed upside down into 12-well plates and let to adhere for 4 h while adding the fresh medium every 30 min [102], [103]. Afterward, the inserts were transferred into 24-well plates and cultivated for additional 24 h. Subsequently, 50,000–400,000 BeWo cells were seeded into the inserts onto the apical site of membranes in 100 µl of medium. For monocultures, only BeWo cells were used. The cells were cultured for 3–5 days post seeding (PS), during which the medium in both the donor and the acceptor compartment was changed every other day. Cellular growth and cell integrity were verified regularly by means of TEER measurements. The timeline of seeding and incubation of the transwell model is shown in Figure 2B.
2.5 Microfluid-based in vitro blood-placenta model
For building up the in vitro BPB, 200,000 BeWo cells (1.0 × 10⁵ cells/cm2) were seeded into the donor compartment (upper channel) of a microfluidic biochip [104] (microfluidic chipshop GmbH, Jena, Germany) and incubated for 24 h at 37 °C, 5% CO2 in a humidified atmosphere. Afterward, 350,000 human placental pericytes (2.3 × 10⁵ cells/cm2) (hPC-PL) were seeded into the acceptor compartment (lower channel) and incubated for another 48 h under the same conditions. For incubation under continuous flow, the biochip was connected to an Ismatec peristaltic pump (Cole-Parmer, Wertheim, Germany), and the cell barrier was incubated for additional 96 h at a flow rate of 44 µl/min corresponding to a shear stress rate of 0.5 dyn/cm2 (0.05 Pa) (Figure 2C). Shear stress rate was calculated according to Raasch et al. [104]. For a static incubation, the biochip was not connected to the pump but incubated applying the same conditions. DMEM + 15% FBS + 1% Pen/Strep was used in all experiments. The cell barrier integrity was routinely verified by molecular permeability assay using sodium fluorescein (NaFl), histological analysis, as well as immunofluorescence staining of the tight junction-associated protein ZO-1 of BeWo cells. SPIONs were added to the upper compartment to a final concentration of 100 µg/ml, and biochips were incubated with a single circulation of the upper compartment at a constant flow rate of 44 µl/min. The medium of the upper compartment was immediately sampled after one flow through. The content of the lower compartment was also collected, as well as the membrane was excised for further investigations. All samples were analyzed for their absolute iron content at the PTB Berlin using a commercially available magnetic particle spectroscopy (MPS) device (see Section 2.12.1).
2.6 Cell viability assays
Different assays were used in order to verify cellular viability of HBMECs after exposure to diverse types of SPIONs. While acute cytotoxicity for SPION incubations of up to 24 h was investigated using biochemical and flow cytometry–based assays, SPION-associated long-term effects on cell viability were analyzed by means of real-time cell analysis (RTCA) using the xCELLigence system (see Section 2.7).
2.6.1 PrestoBlue™ assay
The PrestoBlue™ assay (Invitrogen, Karlsruhe, Germany) is based on the reduction of a nonfluorescent resazurin-based reagent to fluorescent resorufin by metabolically active cells and is used to analyze cell viability on nanoparticle incubation.
In order to test the SPION-specific cytotoxic effect on HBMECs, per well of a 96-well black-walled µ-Clear® plate, 15,000 cells resuspended within RPMI 1640 cell culture medium supplied with 10% FBS were seeded in triplicate. In case of BeWo cells and pericytes, 20,000 cells were applied per well in triplicate. If necessary, 1% Pen/Strep was added to the culture medium. On cultivation overnight, SPIONs dispersed within 18 µl aqua bidest. were added to a final volume of 90 µl, resulting in final SPION concentrations of 5–100 µg/cm2 (corresponding to 19–378 µg/ml) and incubated for 3 h or 24 h. Positive and negative controls were always obtained by adding 18 µl aqua bidest. only or 0.1% Triton X-100 to cell-seeded wells, respectively. Additionally, cell-free wells containing the cell culture medium and 18 µl of the respective SPION formulations were carried along as background controls.
According to the manufacturer’s protocol, PrestoBlue™ reagent supplied as a 10× solution was added into each well and incubated at 37 °C for 30–60 min. The emitted fluorescence at 600 nm (10 to 40 nm bandwidth) upon excitation with 545 nm (20-nm bandwidth) was detected using the CLARIOstar microplate reader (BMG LABTECH GmbH, Orthenberg, Germany). The measured values of nanoparticle-treated cells were background corrected and compared to diluent-treated controls.
2.6.2 SYTOX® Red dead cell staining
The principle of SYTOX® dead cell staining is based on the inability of a high-affinity, nucleic acid–intercalating fluorescent dye to pass intact cell membranes, whereas cells with compromised plasma membranes are easily penetrated. Thus, damaged and dead cells can be identified by bright fluorescence signals and can be distinguished from nonstained vital cells.
In scope of investigating the cytotoxic effect of different nanoparticles, 80,000–350,000 cells were seeded into 12-well plates and incubated overnight. After incubation with indicated concentrations of nsMAG/G particles for 3 or 24 h, the cells including the supernatant were harvested by treatment with accutase. After washing twice with PBS supplemented with 2 mM EDTA (PE), the cells were resuspended within 500 µl of 2.5 nM SYTOX® Red (diluted in PE buffer) and incubated at 4 °C for 15 min. Pure SPION solutions were stained analogously in order to verify both nonspecific interactions between particles and dye and the spectral overlap of fluorescently labeled SPIONs into the SYTOX® Red channel. Additionally, these only-SPION–containing samples were utilized for setting up gates excluding free particles from data acquisition during flow cytometric analysis. Without washing, at least 10,000 cellular events per sample were analyzed by the use of a FACS Calibur cytometer (BD Biosciences, San Jose, USA) with SYTOX® Red staining detected with a 661/16 nm bandpass filter upon excitation with 633 nm and fluorescently labeled SPIONs detected with a 585/42 nm bandpass filter upon excitation with 488 nm.
2.7 Real-time cell analysis
The RTCA via the xCELLigence DP (ACEA Biosciences Inc., San Diego, USA) presents a noninvasive approach for monitoring cellular proliferation, size, morphology, and attachment. This method was used to analyze the dynamic effects of SPIONs on cell proliferation and viability especially for long-term incubations.
Here, this method was used to detect the toxicity of the investigated nanoparticles to the cells of interest. For the experiments, after measuring the background of medium-containing wells, the cells were seeded into 16-well E plates (HBMEC and BeWo: 35,000 cells, pericytes: 30,000 cells/well). After sedimentation for 30 min at RT, the cells were monitored for the first 24 h; afterward, SPIONs dispersed within 10 µl aqua bidest. were added, resulting in final concentrations of 25–100 µg/cm2 (corresponding to 25–100 µg/ml). Alternatively, negative control cells were incubated with 10 µl aqua bidest. only, whereas cell free wells containing the cell culture medium were treated with the respective SPION solutions as background controls. Cell index progression was monitored for further 72 h. The cell index was monitored each 30 s for the initial 30 min, afterward each 30 min for approximately 96 h. For analysis of the received data, RTCA software 1.2 (Roche Diagnostics GmbH, Penzberg, Germany) was used.
2.8 Analysis of the cell layer integrity
The cell layer integrity of HBMECs seeded on transwell membranes resembles a critical aspect in verifying the in vitro BBB model’s condition and quality. While repetitive TEER measurements were used in order to monitor the progression of this tightness parameter in vital cell cultures, end point determinations such as molecular permeability assays or microscopic analysis of fixed cells with subsequent fluorescent staining or histological cross sections were used to get a more complete insight into the cell layer functionality and composition.
2.8.1 TEER measurements
For continuously verifying the tightness of a cellular barrier, measuring the TEER is a well-established method and vitally important for the evaluation of in vitro BBB models [57]. As permeability barriers restrict the movement of ions through the cell layer, an increased TEER indicates an in vitro barrier of elevated tightness.
By using chopstick electrodes connected to an epithelial voltohmmeter (EVOM Epithelial Voltohmmeter, World Precision Instruments, Berlin, Germany), the TEER values of HBMECs and BeWo/pericyte layers were determined. Thus, per insert, the mean of three TEER measurements determined at three different positions was aligned to the effective membrane area (i.e., 0.33 cm2 membrane area including pores). Further, reference TEER measurements of cell-free membrane inserts with respective cell culture media served as background resistances and were subtracted from sample values.
2.8.2 Molecular permeability assay
The determination of paracellular permeability of cellular barriers was performed using NaFl (376 Da; Sigma-Aldrich Chemie GmbH, Steinheim, Germany). As NaFl is small, freely diffusible, and nontoxic, this fluorescent molecule is frequently utilized as a highly sensitive paracellular tracer for both in vitro and in vivo studies [57], [105].
After preparation of the transwell models as described, the cells were incubated with 100 µl of 2.5 µM NaFl diluted within phenol red–free medium and 10% FBS at the apical site, whereas companion plates at the basolateral site were filled with 600 µl of phenol red–free medium supplied with 10% FBS. The NaFl-exposed inserts were incubated at 37 °C under orbital shaking (90 rpm, 30-mm amplitude) for 10–60 min, whereby at defined time points, inserts including the incubation medium were transferred to a new well containing 600 µl of fresh phenol red–free medium with 10% FBS, and incubation was continued as stated above. Fluorescence intensities of samples obtained from the basolateral medium upon 10-, 30-, and 60-min incubation were transferred into black-walled 96-well µ-Clear® plates in triplicate and measured by using the CLARIOstar microplate reader (λ ex = 460/9 nm, λ em = 515/20 nm). NaFl permeability coefficients P NaFl were calculated from applied and detected concentrations (c in nM) and volumes (V in cm3) as described by Audus and Borchardt [106] according to the following equation (I):
with t and A defining the incubation time (s) and the effective diffusion area (cm2), respectively. Alternatively, NaFl restraints were calculated from NaFl permeability coefficients as the ratio of cell-free and cell-grown insert membranes.
2.9 Histological analysis of cross sections
Thin microtome sections of 5–15 µm were prepared from the membranes of the transwell inserts to get a broader image of the thickness and integrity of the cell layers as well as the interaction of nanoparticles with the barrier. After preparation of the transwell model and nanoparticle incubation as described earlier, the membranes were cut out of the inserts and embedded in 1% agarose dissolved in PBS in a truncated 1.5-ml Eppendorf tube after washing with PBS and fixation with 10% formalin solution. The membranes were incubated for at least 20 min at 4 °C for consolidation; afterward, the agarose blocks containing the membranes were transferred into embedding cassettes and incubated in 10% formalin for 1–2 days. After removing the formalin with distilled water for 4 × 15 min, the blocks were dehydrated using the automatic tissue processor Leica TP1020 (Leica Biosystems Nussloch GmbH, Nussloch, Germany). Directly afterward, the blocks were embedded into paraffin using a Leica EG1160 embedding center (Leica Biosystems Nussloch GmbH, Nussloch, Germany) and cooled at −20 °C for at least 2 h. Sections of 15-µm thickness of the membrane-containing blocks were prepared using the Leica RM 2165 automated rotary microtome (Leica Biosystems Nussloch GmbH, Nussloch, Germany). The sections were first transferred to a RT water bath to remove air bubbles and then transferred to a 40 °C water bath for stretching before they were applied to microscopy slides and dried at 37 °C overnight. For microscopic analysis, the sections were stained with Nuclear Fast Red and Prussian blue. The paraffin was removed from the dried samples by using xylene, followed by a descending ethanol series to rehydrate the sections. Subsequently, the sections were stained with a 2% potassium ferrocyanide solution for 10 min. After washing with distilled water, the cell nuclei were stained with Nuclear Fast Red for additional 10 min before washing for 1 min with running tap water. Before embedding the sections with Entellan®. New, they were dehydrated using an ascending ethanol series. The slides were analyzed using the microscope Axiovert 25, the camera AxioCam HRc and the software AxioVision SE64 4.9 (Carl Zeiss GmbH, Jena, Germany).
2.9.1 Prussian blue staining
Prussian blue resembles a dark blue pigment generated by the iron chelating reaction of ferrocyanides. Thus, the staining is commonly used to visualize ferric iron within biological samples, such as iron-based nanoparticles within cellular environments.
In order to stain SPIONs in cellular samples, a protocol adapted from the study by Schlorf et al. [107] was used. In detail, samples fixed by incubation with 10% formalin solution for 15 min were permeabilized by a 10-min incubation in 0.1% Triton X-100 (dissolved in D-PBS) and washed twice with D-PBS. Next, a freshly prepared solution of 2% (w/v) potassium ferrocyanide dissolved in 1 M hydrochloric acid was applied and incubated at 37 °C for 10 min before two washing steps using D-PBS were carried out. Unless otherwise stated, the cells were counterstained by sample incubation with the eosin Y-containing DiffQuick II solution for 30 s. As the resulting cytoplasmic red staining was not stable, microscopic images were acquired immediately. Alternatively, cells were counterstained using Nuclear Fast Red solution and subtracted to a dehydrating alcoholic series in order to achieve stable dyeing.
2.10 Fluorescent staining for confocal laser scanning microscopy
Confocal laser scanning microscopy (cLSM) upon (immuno)fluorescence staining offers the possibility to specifically view distinct cellular structures and their three-dimensional distribution. The spatial pinhole allows the acquisition of signals from the confocal plain only, thus eliminating out-of-focus light. On the one hand, cytoskeletal staining was used for the sake of studying both the cell integrity and the cellular uptake of fluorescently labeled SPIONs. On the other hand, the expression and distribution of the tight junction protein ZO-1 upon immunofluorescence staining was additionally used in order to assess the tightness of transwell-cultured cell layers. For all approaches, the confocal laser scanning microscope LSM 510 META and the appendant software ZEN 2009 6.0 SP2 (both Carl Zeiss Microscopy GmbH, Jena, Germany) were used.
2.10.1 Phalloidin staining
Phalloidin is a bicyclic heptapeptide strongly binding filamentous actin (F-actin) preventing its depolymerization. Labeled with a fluorescent tag, this molecular dye is prevalently used for visualization of F-actin in vitro.
For the investigation of the cellular uptake mechanism of SPIONs, 200,000 to 400,000 cells were resuspended in the appropriate cell culture medium and seeded on glass cover slips, which had been flamed and placed into 24-well plates. Upon cell cultivation overnight, SPIONs were applied and incubated for 3 h. If appropriate, endocytosis inhibitors were added as indicated and preincubated for 60 min before SPION addition. The samples were washed three times with D-PBS before they were fixed at RT by applying a 10% formalin solution for 15 min. Next, formalin was removed by another three washing steps with D-PBS, and the cells were permeabilized by a 10-min treatment with 0.1% Triton X-100 (diluted with D-PBS). The samples were incubated with the D-PBS–based staining solution containing 19 ng/ml Alexa Fluor® 633 Phalloidin (Invitrogen) and either 10 ng/ml DAPI I (Abbott Laboratories) or 12 µg/ml Hoechst 33258 (Invitrogen). Afterward, the cells were washed with D-PBS again and analyzed microscopically without embedding. The cells were scanned layer by layer with a constant slice distance of 1 µm, each resulting in z-stacked images of 10–18 slices. Acquired image stacks were quantitatively analyzed using MATLAB® R2013a software (MathWorks, Natick, USA), wherein the amount of internalized SPIONs was calculated from overlapping signals derived from the cytoskeletal F-actin and the SPION channels. Actin channels were binarized using the threshold algorithm as described by Otsu [108], multiplied with original SPION channels, and integrated to total SPION intensities per image slice. For comparability of multiple microscopic field views containing divergent numbers of cells, particle amounts were normalized to the cell-representing F-actin signal.
2.10.2 Immunofluorescence staining of ZO-1
In order to quantify the integrity of the barrier layer in the in vitro coculture transwell model, both tight junctions and adherens junctions were visualized using antibodies against ZO-1 and β-catenin, respectively, which were already shown to contribute to cell-cell contacts in the human placenta [109]. The peripherally located ZO-1 is associated with cytoplasmic parts of cell-cell contacts after formation of these junctions and is therefore applicable to visualize tight junctions in cell layers [110]. Since β-catenin is part of the cadherin-catenin complex, which is present at adherens junctions, it can be used as a reliable marker for cell-cell interactions [109].
After preparation of the monoculture or coculture transwell models accordingly, the cells were washed, fixed, and permeabilized. Before staining, unspecific binding sites were blocked by incubation of the inserts in 5% BSA solution for 1 h at RT using an orbital shaker. The membranes were cut out of the inserts and cut into half. Each half was incubated with either rabbit anti–ZO-1 or rabbit anti–β-catenin in a 1:100 dilution in 1% BSA and 0.1% Triton X-100 in PBS for 1 h in a wet chamber at 37 °C. After washing twice with PBS, the membrane halves were incubated with a staining solution containing the AlexaFluor® 488–labeled goat anti-rabbit secondary antibody (1:200 in 1% BSA and 0.1% Triton X-100 in PBS), 0.19 µg/ml AlexaFluor® 633 Phalloidin, and 12 µg/ml Hoechst 33258. After staining, the membranes were washed twice and embedded on microscopy slides before analysis. For cocultures, the orientation of embedding depended on the cells of interest.
Moreover, samples stained without primary antibodies and samples not stained with primary or secondary antibodies were carried along and served as controls for specific secondary antibody binding and autofluorescence, respectively. Upon staining, the samples were washed with D-PBS; membranes were cut out of retainers and embedded on glass slides using water-based mounting medium prior to microscopic analysis.
2.11 Flow cytometry
Flow cytometry is an analytic method based on the principles of light scattering and light excitation/emission of fluorochromes, which is an essential technique to analyze many different parameters of cells simultaneously, like cell viability using DNA-binding dyes or expression of different cell surface markers using targeting antibodies. Here, this method was used to characterize pericytes by investigation of surface markers and to analyze cytotoxic effects of SPIONs on cells. For the experiments, the FACS Calibur cytometer (BD Biosciences, San Jose, USA) was used, and the results were evaluated using FlowJo™ software (FlowJo, LLC, Ashland, USA).
2.11.1 Flow cytometry–based nanoparticle-cell interaction
For the purpose of investigating the interaction of fluorescently labeled SPIONs with cells and its correlation to cell viability, 80,000 cells/cm2 were seeded into 12-well plates in duplicate. Following overnight culture, the cells were incubated with fluorescently labeled SPIONs dispersed within 100 µl aqua bidest. resulting in final concentrations of 25 µg/cm2 or 50 µg/cm2 (corresponding to 94.5 µg/ml or 189 µg/ml) for up to 24 h. Negative controls were treated analogously using 100 µl aqua bidest. only. After incubation time was completed, sample cell culture media were collected, and the cells were harvested using HyQTase™. Next, the cells were spun down by a 5-min centrifugation step at 300 rcf (4 °C), washed with ice-cold PE buffer, and centrifuged as mentioned before. For investigating the correlation between SPION interaction with cells and cytotoxicity, cell pellets were additionally treated with SYTOX® dead cell staining and directly analyzed as described earlier. Otherwise, cell pellets were fixed using 10% formalin for 15 min, washed using ice-cold PE buffer, and resuspended in 500 µl of PE buffer again. Finally, per sample, at least 10,000 cellular events were analyzed by flow cytometry, wherein cellular loading with fluorescent-labeled SPIONs was detected with a 585/42-nm bandpass filter upon excitation with 488 nm. Additionally, cell-free samples containing SPIONs only were utilized for setting up gates, excluding free particles from data acquisition during flow cytometric analysis.
2.12 Detection and quantification of SPIONs
For studying the passage of SPIONs through HBMEC layers, complete basolateral acceptor compartments were analyzed for the presence of SPIONs either by magnetic particle or atomic absorption spectroscopy (AAS). Both approaches resemble highly sensitive methods of quantifying superparamagnetic or elementary iron, respectively.
For the experimental investigations, HBMECs were plated out on transwell membranes as described earlier. After five days of cultivation, barrier tightness was confirmed by means of TEER measurements (see above). If indicated, one day prior to the particle incubation, MCF-7 cells with a density of 350,000 cells/well were seeded into 24-well plates and cultivated overnight. On the day of incubation experiment, HBMEC-grown inserts were transferred to implied MCF-7–grown or cell-free 24-well companion plates each containing 600 µl of RPMI 1640 medium supplemented with 10% FBS and 1% Pen/Strep. Unless stated otherwise, 100 µg/cm2 of SPIONs dissolved within 165 µl (equal to 200 µg/ml) of medium supplemented with 10% FBS was added. For the first 30 min, particle incubation was carried out on top of a block magnet (210 mT at 3-mm distance, field gradient: 6.8 T/m) in order to bring the particles in close proximity to the cell layer localized on the transwell membrane. Thereafter, the incubation was continued without the magnet until the indicated incubation time was complete. In order to precisely quantify the amount of SPIONs in the respective compartments, samples were analyzed by MPS and AAS. Additionally, cell layer integrity upon SPION exposure was verified as well as by microscopic analysis upon fluorescence staining.
2.12.1 Magnetic particle spectroscopy
MPS represents a sensitive magnetic detection method that allows for the quantification of the superparamagnetic nanoparticle iron content without being affected by biological components such as cells or the suspension medium [111], [112], [113]. It is based on the nonlinear magnetic susceptibility response of magnetic nanoparticles exposed to an oscillating magnetic field. Thus, odd harmonics of magnetic moments Ai of the detected time-dependent signal are Fourier transformed, yielding the MPS spectrum. As the SPION-specific amplitude signal is proportional to the applied SPION amounts, MPS provides the opportunity to precisely determine SPION contents of biological samples [114].
For the quantification of SPIONs within the distinct compartments of the transwell system, samples were processed as described by Gräfe et al. [115]. Briefly, complete apical donor and basolateral acceptor compartment media were collected upon incubation time. By avoiding the application of any metallic materials during preparations, porous membranes including cellular layers were cut off retainers and homogenized within 800 µl aqua bidest. by using a ceramic scalpel and the gentleMACS™ dissociator. Sample volumes were reduced to 20–50 µl by centrifugal vacuum concentration using the Speed Vac™ SPD111 (Thermo Fisher Scientific Inc., Waltham, USA) at 100 × g and 40 °C. In case of the BPB, the two cell layers located on the apical and basolateral site of the transwell membrane were individually trypsinated using 100 and 600 µl in the donor and acceptor compartment, respectively, and the reaction was stopped by adding the same amounts of the medium supplemented with FBS. The cells were resuspended and lysed in 20 µl of 10% sodium dodecyl sulfate (Carl Roth GmbH, Karlsruhe, Germany) after centrifugation at 400 rcf for 5 min. MPS spectra were measured using a commercial MPS device (Bruker Biospin, Rheinstetten, Germany) operating at an oscillating magnetic field B drive of 25 mT and a frequency f 0 of 25 kHz. The third harmonic A 3 of the MPS spectrum was used for iron quantification by normalization to the corresponding A 3,ref of a reference sample of known iron amount. In turn, the reference sample’s iron amount was cross-validated by photometry (510 nm) upon phenanthroline staining by dissolving in hydrochloric acid, reduction by hydroxylamine, and addition of 1,10-phenanthroline monohydrate. Furthermore, A 5/A 3 was recorded in order to verify the magnetic behavior including particle agglomeration. Analogous samples without the addition of SPIONs served as background controls from which the limit of detection (LOD) was calculated according to equation II:
where
2.12.2 Atomic absorption spectroscopy
In addition to the quantitative estimation of SPIONs via MPS, AAS was applied in order to verify the SPIONs’ interaction with and passage through HBMEC layers based on the spectroanalytical detection of elementary iron. Thus, iron concentrations of analyzed samples were determined on measuring the absorbance at the characteristic and highly sensitive wavelength of 248.3 nm.
To this end, complete media of both donor and acceptor compartments were collected, and SPIONs were pelleted by centrifugation at 20,000 × g for 45 min. Upon discarding the excessive supernatant, 25 µl of the sediment-containing solution was dissolved in 162.5 µl of 32% HCl. In contrast, MCF-7 cells seeded into bottom wells of 24-well companion plates as well as cut outs of cell-covered transwell membranes were directly dissolved in 187.5 µl of 32% HCl. The samples were supplemented with 62.5 µl of 10% trichloroacetic acid and incubated for 5 min at RT before precipitated proteins and debris were removed by a 5-min centrifugation at 3600 × g. Finally, the supernatants were transferred into conic AAS tubes, and iron contents were analyzed by using the AAS-5 FL supplied by Analytik Jena AG, Jena, Germany. For the quantification, a calibration curve with defined iron concentrations (0–50 µmol/l) was prepared. Samples exceeding these concentrations were diluted in aqua bidest. and measured again. For testing the accuracy of measurement, precision controls containing 6.5 mg/ml FeCl3 were also measured. The LOD was calculated as described above.
2.13 Statistical analyses
Data of repetitive independent experiments with multiple replicates each are presented as weighted mean ± (weighted) standard deviation. Statistical significance tests were performed using Prism 6 (GraphPad Software, La Jolla, USA) applying a one- or two-way analysis of variance (ANOVA) with 95% confidence intervals, followed by a multiple comparison test and correction according to Dunnett [117], [118], Tukey [119], or Sidak [120]. Differences are considered as statistically significant for p < 0.05 (*), p < 0.01 (**), p < 0.001 (***), or p < 0.0001 (****).
3 Results and discussion
3.1 Establishment of a suitable in vitro BBB model for SPION-cell interaction studies
3.1.1 SPION-associated effects on cell viability
The in vitro BBB model should be established with the cell line HBMEC. At first, the acute cytotoxic effects of SPION exposure on HBMECs for 3 h were tested using the PrestoBlue™ assay. For concentrations of up to 100 µg/cm2, no noticeable effect on HBMECs’ viability can be observed after 3 h or 24 h of incubation with neutral fluidMAG-D and anionic SEONLA-BSA particles resulting in a relative cell viability of 90.0 ± 2.5% and 79.7 ± 1.9% after 24 h of incubation with the respective SPIONs. The exposure of HBMECs to up to 100 µg/cm2 of cationic fluidMAG-DEAE for 24 h induced a slight concentration-dependent reduction in cellular viability to 67.1 ± 4.2% compared to controls. Cationic PEI-coated SPIONs strongly affect cell viabilities as incubations of 100 µg/cm2 for 3 h as well as for 24 h trigger a relative decrease to 49.4 ± 3.6% and 13.1 ± 1.7%, respectively [115].
3.1.2 Binding of SPIONs to cells and particle uptake
Cellular binding and uptake of SPIONs are closely connected with cytotoxicity. While biocompatible particles are often characterized by lower cellular affinities, highly interactive particle types are usually associated with cytotoxic effects. In order to study these aspects for selected SPIONs, both Prussian blue staining and flow cytometry were applied. Within a 3-h incubation, the cellular binding of neutral fluidMAG-D particles is low. In contrast, cells exposed to anionic SEONLA-BSA, cationic DEAE-coated and PEI-coated SPIONs exhibit a strong Prussian blue stain with the highest intensity for the latter. After 24 h, extensive Prussian blue staining of fluidMAG-D–incubated HBMECs was observed and indicates an enhanced cellular binding of these neutral particles compared to exposures for 3 h. Similarly, anionic SEONLA-BSA and cationic fluidMAG-DEAE and fluidMAG-PEI showed a pronounced particle adherence as indicated by a more intense staining pattern upon 24 h. In all cases, the particles formed clusters, whereby fluidMAG-PEI was again most notable.
In order to monitor the temporal progress of cellular SPION loading in context of quantity, flow cytometry of HBMECs exposed to fluorescently labeled SPIONs was performed. HBMECs incubated with neutral nano-screenMAG-G/D show low fluorescence upon incubation for 5 min (11 ± 1 relative fluorescence units [RFU]), which gradually increases during incubation for 30 and 180 min with cellular fluorescence of 37 ± 4 and 228 ± 22 RFU, respectively. Additional to cellular fluorescence labeling, side scatters (SSC) were recorded in order to monitor SPION loading via this granularity-representing parameter. However, for nano-screenMAG-G/D incubation for up to 180 min, the SSC shows only minor changes to 173 ± 10 AU compared to control cells with 162 ± 11 AU. After particle incubation for 24 h, both the cellular fluorescence loading and the SSC strongly expand to 877 ± 68 RFU and 329 ± 20 AU, respectively. In contrast, cationic fluidMAG-PEI shows the highest cellular labeling affinities of 2878 ± 156 RFU immediately after particle addition to the cells (5 min) with a gradual decrease during 30 min, 60 min, and 180 min to 2273 ± 291, 1834 ± 65, and 719 ± 504 RFU, respectively. Analogously, SSC rapidly increases from 162 ± 11 to 896 ± 34 AU upon incubation with nano-screenMAG-G/PEI for 5 min and subsequently decreases to 651 ± 2 AU upon the 180-min incubation.
Flow cytometry allows the analysis of cellular SPION loadings in a (semi)quantitative manner. However, it is not possible to gain information of the actual particle uptake into the cells. This is why in the next step, cLSM was used in order to identify the spatial distribution of fluorescently labeled SPIONs within fixed, fluorescently stained HBMECs. By specifically blocking endocytotic pathways with diverse inhibitors, the uptake mechanisms for both starch- and PEI-coated SPIONs were investigated in detail. Figure 3 summarizes this analysis, whereby the image acquisition layer by layer was used to study the colocalization of SPIONs with the intracellular F-actin cytoskeleton within the limits of optical resolution. Based on this premise, internal SPIONs were quantified by integrating the particles’ fluorescence intensities of F-actin overlapping signals. During microscopic analysis, SPIONs have not been observed colocated with the cell’s nucleus. The effects of specific inhibitors on the internalization of neutral fluidMAG-D into HBMECs are presented in Figure 3A. The SPION uptake into HBMECs is massively compromised by approximately 90% when particle incubation is carried out at 4 °C instead of 37 °C, indicating an energy-dependent uptake mechanism for this particle type. Through blocking of caveolin- and clathrin-dependent endocytotic pathways by polyene macrolide filipin (Sigma-Aldrich, Taufkirchen, Germany) and chlorpromazine hydrochloride (Sigma-Aldrich, Taufkirchen, Germany), the amount of internalized starch-coated particles is significantly reduced to 39 ± 10% and 53 ± 34%, respectively. While the single-drug treatment of HBMECs with the fungal toxin cytochalasin D (Sigma-Aldrich, Taufkirchen, Germany) does not impair particle uptake significantly (61 ± 29%), the combination of this F-actin depolymerizing substance with chlorpromazine hydrochloride efficiently decreases the SPION internalization by 82%. In contrast, the reduction of the incubation temperature from 37 to 4 °C does not impair the presence of internalized nano-screenMAG-G/PEI into HBMECs as relative SPION internalization is 100 ± 3 and 114 ± 17%, respectively (Figure 3B).
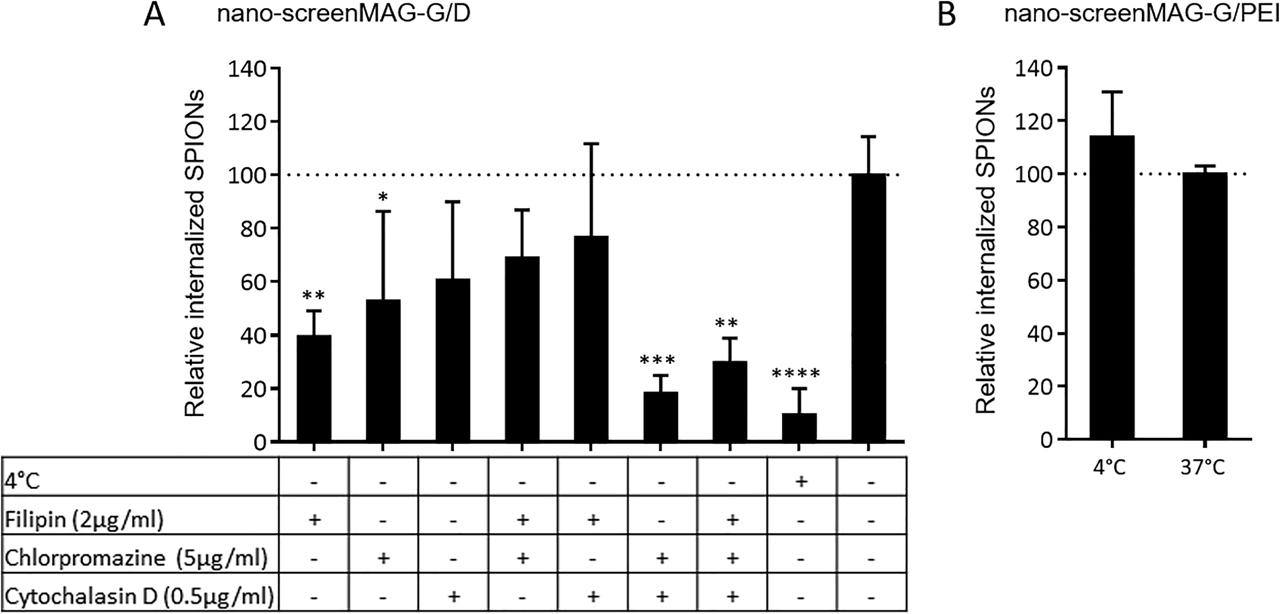
Cellular uptake mechanisms of SPIONs analyzed by confocal laser scanning microscopy. HBMECs were seeded on glass cover slips placed within 24-well plates with a seeding density of 165,000 cells/cm2. After preincubation of cells with indicated inhibitors for 60 min, nano-screenMAG-G/D or -G/PEI were added, resulting in a final concentration of 50 µg/cm2 (corresponding to 60 µg/ml), and incubated for 3 h. Cells were fixed, permeabilized, and stained with DAPI and Alexa Fluor® 633 Phalloidin. Internalized SPIONs were identified by SPION-derived fluorescence overlapping with cells’ actin-derived signals. (A) Quantitative analysis of internalized nano-screenMAG-G/D into HBMECs subjected to indicated incubation conditions. (B) Quantitative analysis of internalized nano-screenMAG-G/PEI into HBMECs subjected to indicated incubation conditions. Shown are means ± standard deviation of two independent experiments with three microscopic fields of view each. Statistical significance of indicated samples compared to controls was tested by one-way ANOVA followed by Dunnett’s multiple comparison, wherein differences are considered statistically significant for p < 0.05 (*), p < 0.01 (**), p < 0.001 (***), and p < 0.0001 (****). Filipin, Chlorpromazine: endocytosis inhibitors; cytochalasin D: inhibitor of actin polymerization. SPION = superparamagnetic iron oxide nanoparticle; HBMEC = human brain microvascular endothelial cell; ANOVA = analysis of variance; PEI = polyethylenimine.
These data confirm that SPIONs are internalized by HBMECs through endocytosis and thus encourage using this cell line as the barrier model.
3.1.3 Establishment and optimization of the BBB model
In order to obtain a BBB-representing in vitro test model, the human cell line HBMEC was utilized. Therefore, transwell inserts comprising a porous membrane were used for generating HBMEC layers separating the upper donor compartment from the lower acceptor compartment. As the barrier integrity is a critical factor for all further investigations regarding particle interaction and passage through the barrier cells, initial experiments revealing optimal cell culture conditions were performed.
3.1.3.1 Testing of the transwell system and cell-seeding density
Different types of membranes and additional coatings for transwell inserts are available for the generation of a cellular transwell barrier system. Testing collagen-coated PTFE- and tissue culture–treated PET membranes, each seeded with cell numbers of 160,000–300,000 cells per insert, indicates distinct differences between the two transwell types. While cells seeded on PTFE membranes can easily be imaged by bright-field microscopy, the optically visible pores of PET membranes strongly impede the microscopic evaluation of cellular growth on the latter membrane type. However, investigating the cell barrier integrity regarding TEER revealed that HBMECs seeded on the PET membrane—irrespective of the cell seeding number—reach higher TEER values than HBMECs seeded on PTFE membrane inserts. For instance, seven days after seeding 240,000 cells per insert, HBMECs cultivated on PET membranes achieve TEER values of 53 ± 2 Ω cm2, whereas PTFE-cultivated cells remain at 26 ± 1 Ω cm2. Based on these findings, PET membrane inserts and a cell seeding number of 240,000 cells per insert were used for all further experiments in order to obtain cellular barriers with appropriate characteristics.
3.1.3.2 Influence of cell media supplements on HBMEC layer integrity
The influence of different cell media and media supplements on HBMEC layers was tested in context of their effect on diverse barrier integrity parameters. Figure 4 summarizes the results of these investigations. The Nuclear Fast Red staining of histological cross sections prepared from HBMEC layers cultivated under indicated media conditions (see Figure 4A) demonstrates that for nonsupplemented RPMI medium, a loose cell cluster is formed. By using astrocyte-conditioned medium (ACM), a more connected but tenuous cell layer is developed, whereas the addition of 10% FBS to ACM seems to strengthen the cellular layer to a more consolidated appearance. However, the cultivation of HBMEC transwell systems with RPMI medium containing 10% FBS induces the formation of a dense, continuous, and uniform cell barrier. Both the cytoskeletal and ZO-1 staining of HBMEC layers cultivated under the very same conditions shown in Figure 4B give similar results, whereby cells cultivated with nonsupplemented RPMI appear rounded and sparse in cell-cell contacts without ZO-1 proteins located in the peripheral cell areas. In comparison, ACM-cultivated HBMEC layers seem to be flat and connected intercellularly, which is highlighted in particular by the increased presence of ZO-1 at the cell margins. For both RPMI and ACM, the addition of 10% FBS seems to enhance the three-dimensional assembly of a tight cellular network, whereas the peripheral ZO-1 localization is still present but slightly less intense. By repetitive TEER measurements, the tightness of developing HBMEC layers was quantified over time (see Figure 4C). Notably, TEER values strongly increase during the first days after cell seeding and seem to reach a plateau between day five and seven, whereas on day six, the nonsupplemented RPMI medium results in the lowest TEER values of 24.0 ± 0.7 Ω cm2, plain ACM-treated HBMECs achieve a TEER value of 31.9 ± 0.8 Ω cm2. The FBS supplementation of ACM and RPMI elevates the prospective TEER values to 36.4 ± 0.6 and 46.9 ± 0.7 Ω cm2, respectively. The HBMEC layer’s retention to the small molecular dye NaFl was tested as another integrity parameter. The results shown in Figure 4D indicate that both nonsupplemented RPMI and ACM only allow a low barrier tightness with a 12.8 ± 3.4- and 7.1 ± 0.4-fold increase of the NaFl retention relative to cell-free transwell inserts after 10-min incubation with the molecular dye. Again, the addition of 10% FBS to ACM and RPMI medium showed the most pronounced effects with elevations of the cell layer’s molecular retention of 37.0 ± 3.4- and 31.4 ± 9.2-fold, respectively.
![Figure 4:
Influence of cell culture media and media supplements on barrier integrity parameters. HBMECs were seeded on transwell inserts and cultured for up to nine days. One day after cell seeding, media were replaced by indicated fresh media and cultivated further. (A) Nuclear Fast Red–stained histological cross sections of cell layers cultivated under indicated conditions for five days. (B) Fluorescent staining of filamentous actin (red) and zonula occludens-1 (green) of cell layers cultivated under indicated conditions for 6 days. (C) Transendothelial electrical resistance (TEER) measurements of HBMEC layers. Shown are means of two replicate transwell inserts with three measurements each and background correction with cell-free membrane inserts. (D) Molecular retention of cell layers to sodium fluorescein (NaFl) upon dye incubation for 10, 30, or 60 min. Shown are means of two replicate transwell inserts cultivated for six days relative to cell-free inserts. Statistical significance among grouped samples was tested by two-way ANOVA followed by Dunnett’s multiple comparison, where differences are considered statistically significant for p < 0.001 (***). [115]. ACM = astrocyte-conditioned medium; ANOVA = analysis of variance; HBMEC = human brain microvascular endothelial cell; FBS = fetal bovine serum.](/document/doi/10.1515/psr-2019-0114/asset/graphic/j_psr-2019-0114_fig_004.jpg)
Influence of cell culture media and media supplements on barrier integrity parameters. HBMECs were seeded on transwell inserts and cultured for up to nine days. One day after cell seeding, media were replaced by indicated fresh media and cultivated further. (A) Nuclear Fast Red–stained histological cross sections of cell layers cultivated under indicated conditions for five days. (B) Fluorescent staining of filamentous actin (red) and zonula occludens-1 (green) of cell layers cultivated under indicated conditions for 6 days. (C) Transendothelial electrical resistance (TEER) measurements of HBMEC layers. Shown are means of two replicate transwell inserts with three measurements each and background correction with cell-free membrane inserts. (D) Molecular retention of cell layers to sodium fluorescein (NaFl) upon dye incubation for 10, 30, or 60 min. Shown are means of two replicate transwell inserts cultivated for six days relative to cell-free inserts. Statistical significance among grouped samples was tested by two-way ANOVA followed by Dunnett’s multiple comparison, where differences are considered statistically significant for p < 0.001 (***). [115]. ACM = astrocyte-conditioned medium; ANOVA = analysis of variance; HBMEC = human brain microvascular endothelial cell; FBS = fetal bovine serum.
Taking into account all the results regarding the analysis of the influence of cultivation conditions on barrier integrity, for all further transwell experiments, HBMEC layers were prepared by using the RPMI medium supplemented with 10% FBS and cultivation for 5–6 days.
Comparing the resulting TEER values of a maximum of 52 ± 2 Ω cm2 to those in the literature reveals a good agreement with experimental setups using similar human cell models [57], [121], [122], [123]. Nevertheless, it is to be noted that these human models using immortalized cell lines represent tightness parameters achieving only small fractions of the ones present in vivo, which are estimated to be 1000–2000 Ω cm2 [31], [122]. Although comparable in vitro models utilizing primary cells of porcine or bovine origin generate up to 2500 Ω cm2 [55], the transfer of experimental outcomes to human context is limited. Thus, instead of switching to nonhuman models, a further advancement of human models in vitro seems reasonable. As indicated by several studies, the shift from static to dynamic cell culture systems does not only mimic in vivo situations present at the BBB more closely, but also beneficially affects phenotypes of BMECs [27], [60], [124], [125]. Moreover, other sophisticated dynamic models utilize hollow fibers, which carry pulsatile flow and provide the framework for scaffolding BMECs in addition to astrocytes on luminal and abluminal surfaces [126].
3.1.4 Interaction of SPIONs with the BBB model
After having established an appropriate in vitro BBB model based on a HBMEC-seeded transwell system, the setup was used for SPION interaction studies. On the one hand, the particles’ effects on barrier integrity were tested by various methods in a time-dependent manner in order to gain an insight into the consequences for the barrier itself. On the other hand, SPION passage through the barrier-forming cells was analyzed and quantified in a next step for evaluating the particles’ barrier-penetrating ability.
3.1.4.1 SPION-associated effects on barrier integrity
Maintaining the physiological integrity of the BBB is an essential premise for keeping the brain’s homeostasis. In order to investigate consequences of SPION exposure on the HBMEC-based in vitro model, TEER measurements before and after incubation with diverse types of SPIONs as well as molecular permeability assays and microscopic analysis of histological cross sections were performed. Data summarized in Figure 5 show that SPIONs differently affect the barrier integrity after particle exposure for 180 min. Both TEER measurements and molecular retentions to NaFl shown in Figure 5A and B reveal strong and significant alterations under the influence of cationic fluidMAG-PEI with a decrease in TEER values (relative to initial values) to 0.80 ± 0.03 and NaFl retentions to 0.40 ± 0.02 (relative to control cells). While a slight but significant decrease in TEER values to 0.94 ± 0.01 is observed for fluidMAG-DEAE particles, no influence of these cationic particles is detected by molecular permeability assays based on NaFl. While for exposure of HBMEC layers to fluidMAG-D for 3 and 24 h, TEER values do not show any significant changes, NaFl retentions are slightly but significantly reduced to 0.79 ± 0.07 and 0.78 ± 0.10, respectively. However, in case of incubation with SEONLA-BSA, relative TEER values are significantly reduced to 0.86 ± 0.03, whereas the cell layer’s retention toward NaFl elevates the NaFl retention to 1.38 ± 0.08 for 3-h incubations. An incubation of 24 h with these anionic particles is characterized by a strong and significant reduction in both relative TEER values (0.63 ± 0.08) and NaFl retentions (0.41 ± 0.24). Stained histological cross sections of particle-incubated transwell systems shown in Figure 5C and D provide a more comprehensive insight into the cell layers’ conditions after particle exposure to neutral fluidMAG-D and anionic SEONLA-BSA. Microscopic images imply that after incubation with fluidMAG-D, HBMEC layers keep an intact and continuous appearance for incubation times of up to 24 h. In contrast, cross sections of SEONLA-BSA-incubated cells seem already slightly diminished after 3 h and strongly compromised after 24 h, where the layer’s continuity is barely visible. Notably, HBMEC layers are not located directly on the transwell membrane, which might be a result of the multistep sample preparation for this method. Focusing on Prussian blue–stained SPIONs detected within the cross sections, it is striking that fluidMAG-D is hardly detectable in samples obtained after an incubation for 3 h but intensively abundant upon a 24-h incubation. In contrast, cellular layers exposed to SEONLA-BSA show extensive SPION staining as soon as 3 h after particle addition.
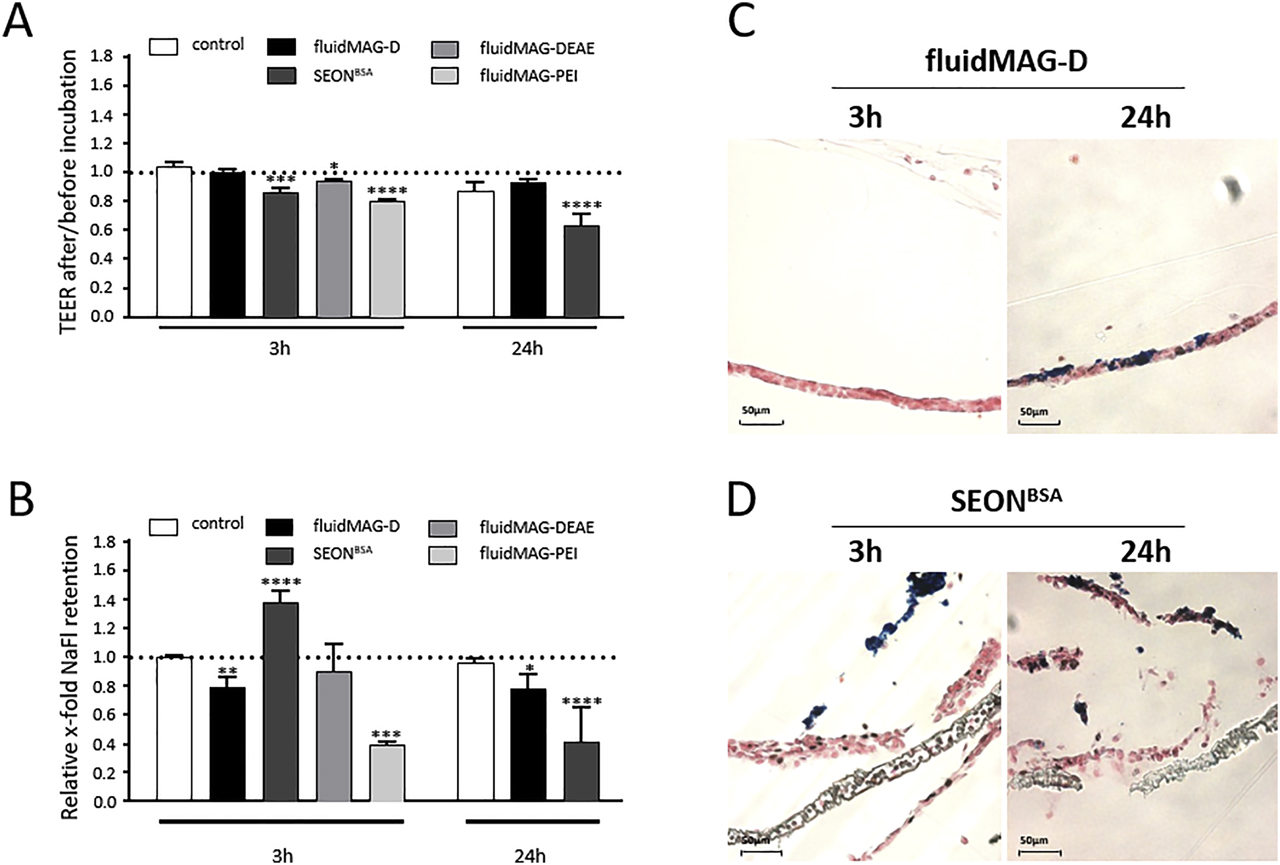
SPION-associated effects on barrier integrity parameters of HBMEC layers. HBMECs were seeded on transwell inserts and cultured for five days. Indicated SPIONs were added resulting in a final concentration of 100 µg/cm2 (corresponding to 200 µg/ml) and incubated for 3 h or 24 h as indicated, whereby the first 30 min were carried out on top of a block magnet. (A) Ratios of transendothelial electrical resistance (TEER) measurements of cell layers before and after SPION incubation. Shown are means of two to four independent experiments with two replicate inserts each. (B) Molecular retention of SPION-incubated cell layers to sodium fluorescein (NaFl). Shown are means of two to four independent experiments with two replicate inserts each. Statistical significance of indicated samples compared to controls was tested by one-way ANOVA for fluidMAG-DEAE and fluidMAG-PEI and two-way ANOVA for fluidMAG-D and SEONLA-BSA. Both cases were followed by Dunnett’s multiple comparison, where differences are considered statistically significant for p < 0.05 (*), p < 0.01 (**), p < 0.001 (***), and p < 0.0001 (****). (C and D) Nuclear Fast Red– and Prussian blue–stained histological cross sections of cell layers incubated with fluidMAG-D (C) or SEONLA-BSA (D) as stated above. HBMEC = human brain microvascular endothelial cell; ANOVA = analysis of variance; SPION = superparamagnetic iron oxide nanoparticle; DEAE = diethylamine ethyl; PEI = polyethylenimine.
Using the established HBMEC-based model system, SPION-associated effects on barrier integrity are investigated first. Therefore, realistic SPION concentration prevailing at the biological barrier is difficult to estimate [127]. In general, particle dilution within the blood volume and clearance by the RES contribute to low global concentrations. However, targeting strategies—either by surface functionalization or magnetic forces—might bring on strongly elevated local particle amounts [10]. Owing to that, following investigations primarily address consequences of incubations with elevated SPION concentrations. In agreement with cytotoxicity data from two-dimensional cell culture experiments discussed above, neutral fluidMAG-D hardly influences the intactness of transwell HBMEC layers with respect to TEER values and NaFl retention, as well as microscopic analysis of histological cross sections for incubation of up to 24 h. A related study performed by Thomsen et al [121] using starch-coated SPIONs made similar observations. In contrast, the exposure to anionic SEONLA-BSA reduces TEER values in a time-dependent manner, while NaFl retention is significantly increased relative to controls before its pronounced reduction. Correlating these findings to microscopic investigations provides a reasonable explanation for the observed phenomenon: the rapid and comprehensive accumulation of SEONLA-BSA on HBMEC layers during the first 3 h might obstruct the diffusion of NaFl molecules from the upper donor into the lower acceptor compartment, which gives rise to an apparently elevated retention capacity for this molecular dye. Following further SEONLA-BSA incubation, NaFl permeability is finally increased owing to the barrier-disrupting nature of these anionic SPIONs.
Taking all these factors together, data strongly indicate the possibility that intensively interacting SEONLA-BSA destabilizes the established cell layers by events such as disturbing cell-cell contacts, which eventually reduces barrier integrity and elevates endothelial permeability. Moreover, it has to be noted that the strongly damaged appearance of histological HBMEC cross sections upon SEONLA-BSA incubation is probably strengthened by the multistep sample preparation upon barrier destabilization. Do SEONLA-BSA particles specifically bind distinct cellular structures and surface components or are there general nonspecific interactions with cells that bring on the barrier disruption? Does immunogenicity in cells of human origin in response to the massive exposure to bovine albumin via the induction of permeability-increasing cytokines play a role? Based on the protein alignment of human and bovine albumin (UniProt identifiers: P02768 and P02769), an identity not exceeding 76.34% leaves scope for such a possibility [128]. Additionally, cytokine-inducing effects in human cell cultures have been described before [129]. In order to answer this question, further comprehensive analyses are still necessary.
With reference to cationic fluidMAG-PEI, more pronounced diminishing impacts on HBMEC layers are already detectable after a 3-h incubation, which manifest in the significant reduction of both TEER and NaFl retention and agrees to PEI particles’ cytotoxic phenotype. Similarly, in accordance with biocompatibility observations, an exposure to cationic fluidMAG-DEAE entails no relevant detectable effects on barrier integrity. In spite of these interesting aspects, both cationic particle formulations are not suitable for the transwell test system assessing particle passage through the biological barrier. The reason for being that—probably based on excessive particle accumulation and agglutination within the cell culture medium with aggregates of up to 5 µm (data not shown)—neither fluidMAG-PEI nor fluidMAG-DEAE passes cell-free transwell membranes in an appropriate manner. Hence, for subsequent evaluations of SPION passage through the in vitro model representing the human BBB, neutral fluidMAG-D and anionic SEONLA-BSA are utilized.
3.1.4.2 Passage of SPIONs through the in vitro BBB
Because starch-coated fluidMAG-D minimally affects barrier integrities of HBMEC-based transwell models, the passage of these neutral particles was investigated in detail for incubation times of up to 3 h [115]. To this end, MPS was used for directly detecting and quantifying SPIONs within the distinct compartments of the transwell system with a high sensitivity. Figure 6 sums up the experimental data obtained. The particle standard curve presented in Figure 6A implies a close correlation of utilized fluidMAG-D and its detection and quantification via this magnetization response–based method over multiple orders of magnitude ranging from few nanograms to several hundred micrograms. Thus, the lower detection limit is as small as 1.9 ng of iron for the biological sample. Analyses of compartment-specific contents of SPION-associated magnetic iron shown in Figure 6B demonstrate that with an average of 92.2 ± 1.5%, the great majority but not all utilized particles are recovered via this method including sample preparation. Furthermore, data imply that fluidMAG-D is predominantly found within the lower acceptor compartment after a 3-h incubation of cell-free transwell inserts with 100 and 200 µg/cm2, as 83.3 ± 9.4% (14.7 ± 1.7 µg) and 93.1 ± 11.3% (31.5 ± 3.8 µg) of detected SPION-associated iron are found here, respectively. In the presence of HBMEC layers on the transwell membrane, most (95.9–99.3%) of the fluidMAG-D are detected within the upper donor compartment (Figure 6C). During the incubation of blank transwell inserts with 100 µg/cm2 of fluidMAG-D, particle amounts recovered within the cell-free membranes are 7.3 ± 5.4 ng, whereas for cell-studded inserts, the amount of magnetic iron within this compartment is significantly increased to 112.8 ± 17.4 and 371.9 ± 198.4 ng after 0.5 and 3 h, respectively (Figure 6D). A detailed analysis of lower acceptor medium of HBMEC-grown inserts incubated with 100 µg/cm2 indicates a low (0.7 ± 2.1 ng) amount of magnetic iron after 0.5 h, though below the lower detection limit. However, extending the incubation time to 3 h results in the significant increase in magnetic iron to 5.8 ± 3.0 ng within this compartment. Strikingly, neither for the 3-h incubation with 50 µg/cm2 nor for 200 µg/cm2 fluidMAG-D, such pronounced increases are detectable (2.2 ± 1.6 and 1.6 ± 2.0 ng).
![Figure 6:
SPION distribution of distinct compartments of the in vitro blood-brain barrier model analyzed by magnetic particle spectroscopy (MPS). HBMECs were seeded on transwell inserts and cultured for 5 days. FluidMAG-D particles were added, resulting in a final concentration of 50–200 µg/cm2 (corresponding to 100–400 µg/ml) and incubated for up to 3 h, whereby the first 30 min were carried out on top of a block magnet. (A) Standard correlation curve of fluidMAG-D diluted in the cell culture medium and measured by MPS. (B) Compartment-specific contents of magnetic iron determined by MPS. (C–E) SPION distribution in the upper compartment (C), cells/membrane fraction (D), and lower compartment (E) (all shown in more detail). Shown are means ± standard deviation of three independent experiments with three replicate inserts each. Statistical significance of samples compared to controls without SPIONs and among each other was tested by one-way ANOVA followed by Tukey’s multiple comparison, wherein differences are considered statistically significant for p < 0.05 (*), p < 0.01 (**), p < 0.001 (***), and p < 0.0001 (****) [115]. SPION = superparamagnetic iron oxide nanoparticle; HBMEC = human brain microvascular endothelial cell; ANOVA = analysis of variance.](/document/doi/10.1515/psr-2019-0114/asset/graphic/j_psr-2019-0114_fig_006.jpg)
SPION distribution of distinct compartments of the in vitro blood-brain barrier model analyzed by magnetic particle spectroscopy (MPS). HBMECs were seeded on transwell inserts and cultured for 5 days. FluidMAG-D particles were added, resulting in a final concentration of 50–200 µg/cm2 (corresponding to 100–400 µg/ml) and incubated for up to 3 h, whereby the first 30 min were carried out on top of a block magnet. (A) Standard correlation curve of fluidMAG-D diluted in the cell culture medium and measured by MPS. (B) Compartment-specific contents of magnetic iron determined by MPS. (C–E) SPION distribution in the upper compartment (C), cells/membrane fraction (D), and lower compartment (E) (all shown in more detail). Shown are means ± standard deviation of three independent experiments with three replicate inserts each. Statistical significance of samples compared to controls without SPIONs and among each other was tested by one-way ANOVA followed by Tukey’s multiple comparison, wherein differences are considered statistically significant for p < 0.05 (*), p < 0.01 (**), p < 0.001 (***), and p < 0.0001 (****) [115]. SPION = superparamagnetic iron oxide nanoparticle; HBMEC = human brain microvascular endothelial cell; ANOVA = analysis of variance.
In order to verify the results of particle passage through the in vitro barrier model by MPS-based quantification of magnetic iron, AAS was applied, which allows the quantification of total iron. In addition to the detailed analysis of SPION presence within the barrier-forming HBMEC layer and lower acceptor medium, a second cell type (MCF-7) located on bottom wells mimicking underlying tissues was applied and analyzed for iron. Furthermore, the passage of fluidMAG-D was compared to that of SEONLA-BSA in a time-dependent manner. The results summarized in Figure 7 show the standard curve for fluidMAG-D derived from AAS quantification. While the linear correlation of utilized iron and AAS-detected signals are indicated for these particles in Figure 7A, the detection range is limited to a maximum of 3 µg, implicating additional dilution steps for quantifications of elevated iron amounts. The lower detection limit of this method is 2 ng. The compartment-specific iron contents shown in Figure 7B indicate again that the highest amounts of fluidMAG-D are found within the lower acceptor compartment and MCF-7 cells if cell-free transwell inserts are incubated for 3 h (20.5 ± 4.7 and 2.8 ± 1.2 µg) or 24 h (15.4 ± 5.8 and 8.0 ± 2.7 µg).
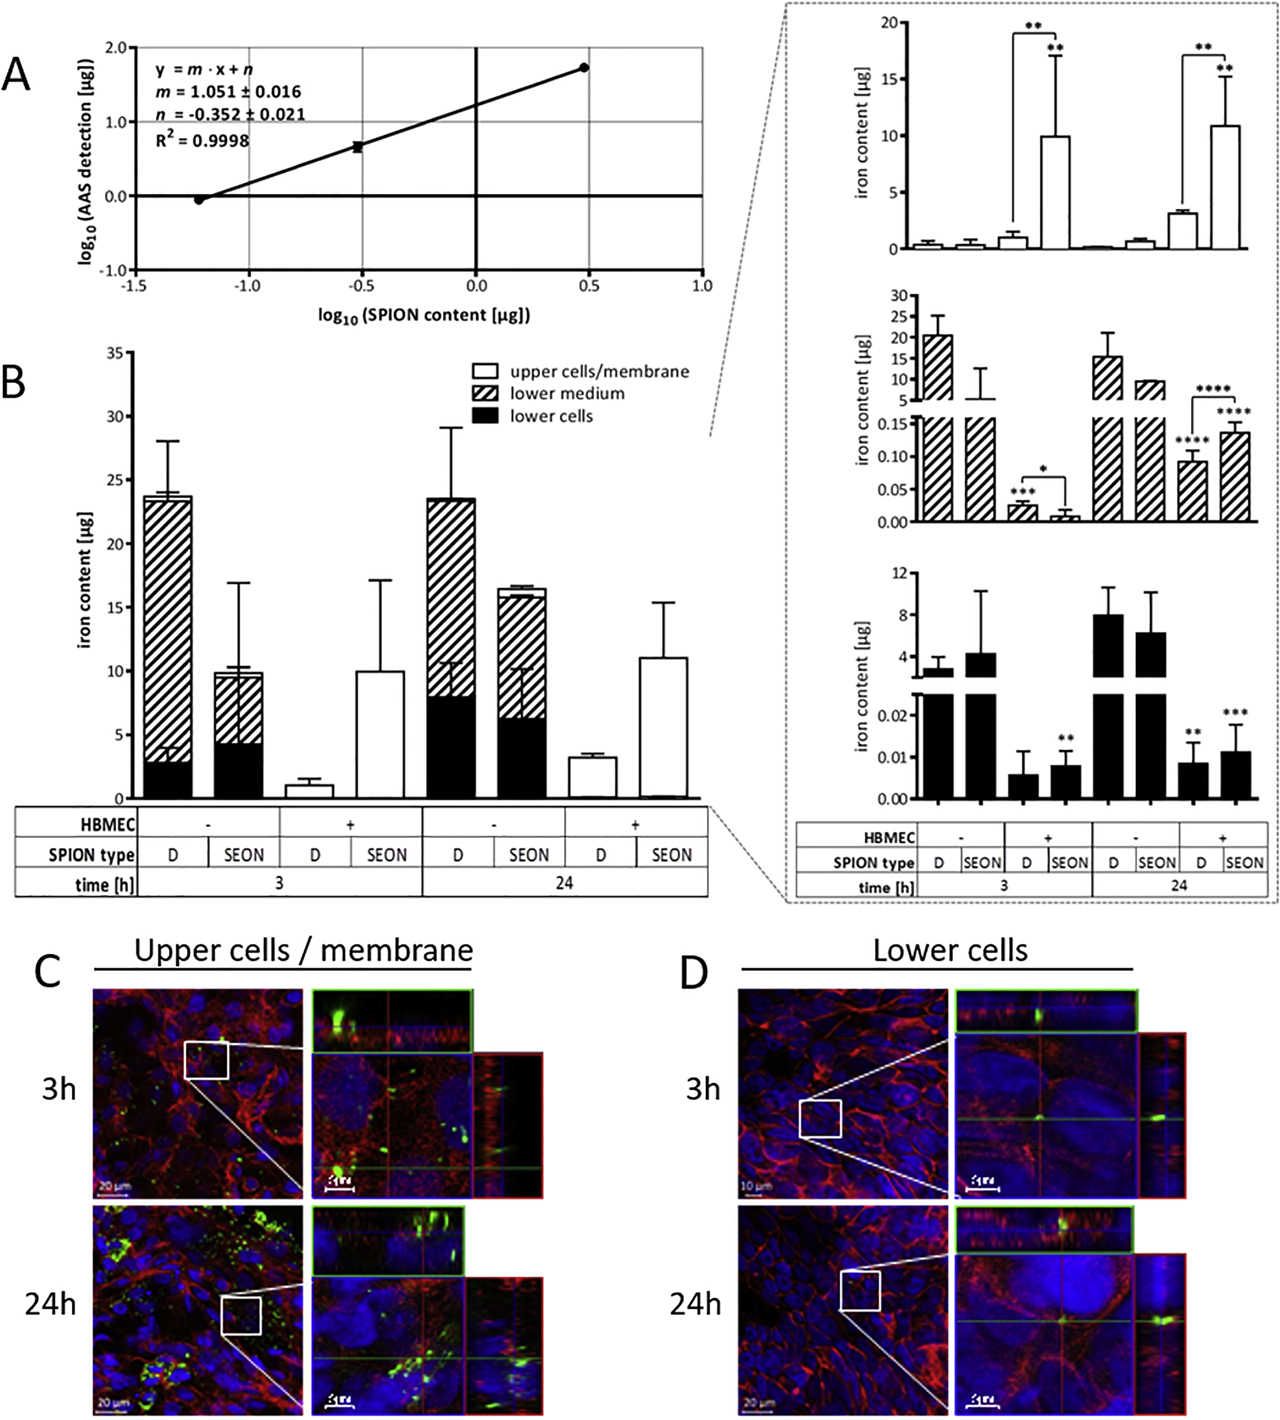
SPION distribution of distinct compartments of the in vitro blood-brain barrier model analyzed by atomic absorption spectroscopy (AAS). HBMECs were seeded on transwell inserts and cultured for five days. Indicated SPIONs were added, resulting in a final concentration of 100 µg/cm2 (corresponding to 200 µg/ml) and incubated for 3 h or 24 h, whereby the first 30 min were carried out on top of a block magnet. (A) Standard correlation curve of fluidMAG-D diluted in the cell culture medium measured by AAS. (B) Compartment-specific contents of total iron determined by AAS. Shown are means ± standard deviation of three independent experiments with three replicate inserts each. (C and D) Fluorescent staining of barrier-forming HBMECs (upper cells/membrane, C) and MCF-7 cells seeded into well bottoms (lower cells, D) after incubation with nano-screenMAG-G/D (green). Nuclei and filamentous actin are stained with DAPI (blue) and Alexa Fluor® 633 Phalloidin (red), respectively. Samples were analyzed by confocal laser scanning microscopy. Statistical significance of grouped samples compared to controls without SPIONs and among each other was tested by two-way ANOVA followed by Dunnett’s multiple comparison, where differences are considered statistically significant for p < 0.05 (*), p < 0.01 (**), p < 0.001 (***), and p < 0.0001 (****). ANOVA = analysis of variance; HBMEC = human brain microvascular endothelial cell; SPION = superparamagnetic iron oxide nanoparticle.
Compared to that, the amount of analogously applied anionic SEONLA-BSA into cell-free inserts is 5.2 ± 7.4 and 4.3 ± 2.7 µg for 3 h and increases to 9.5 ± 0.2 and 6.2 ± 6.0 µg for 24 h. However, if membrane inserts are covered with HBMEC layers, most detected SPIONs are present within the barrier-forming HBMEC compartment. Thus, an incubation with fluidMAG-D increases iron accumulation to 3.1 ± 0.3 µg after 24 h, whereas in case of SEONLA-BSA, iron amounts within this compartment are significantly elevated to 10.0 ± 7.2 µg after 3 h and 10.9 ± 4.3 µg after 24 h. Focusing on iron contents detected within the lower acceptor medium, data imply that a 3-h incubation with fluidMAG-D results in a significant increase of iron (25.2 ± 12.7 ng) compared to control inserts without SPION treatments, while for SEONLA-BSA, an elevated tendency is observed but without statistical evidence. Extending incubation times for both particle types to 24 h significantly elevates iron contents of acceptor medium compartments especially for anionic SEONLA-BSA. Similarly, enhanced iron levels in well bottom-seeded lower MCF-7 cells are detectable with statistical evidence after 24 h for both fluidMAG-D (8.5 ± 3.6 ng) and SEONLA-BSA (11.2 ± 6.6 ng); for an incubation time of 3 h, a statistically significant increase is observable for SEONLA-BSA-treated conditions only. In addition to the MPS- and AAS-based quantification of iron within the distinct compartments of the transwell system, microscopic analyses of both apical barrier–forming HBMECs and underlying lower MCF-7 cells after the incubation with fluorescently labeled starch particles were performed. On the one hand, images presented in Figure 7C demonstrate the presence of green particle signals in HBMEC layers after a 3-h incubation, which is further enhanced after 24 h. It is remarkable that nano-screenMAG-G/D colocalizes with intracellular F-actin staining for both incubation times. On the other hand, analogous SPION signals colocalizing with F-actin staining of lower MCF-7 cells beyond the barrier can microscopically be detected very rarely after both 3 and 24 h (Figure 7D).
Taken together, the passage of SPIONs through the BBB-representing in vitro model is demonstrated by diverse methods comprising MPS and AAS for highly sensitive quantification and cLSM for the optical detection and verification of particle internalization.
SPIONs’ superparamagnetic properties are exploited in order to highly sensitively quantify particle amounts present within the distinct compartments of incubated HBMEC transwell systems, which in turn gives insights into particle passage at this biological barrier. By applying MPS, it is shown that this technique based on the nonlinear magnetic susceptibility response accurately and highly sensitively detects fluidMAG-D particles over multiple orders of magnitude. Utilizing the MPS-based direct detection of SPIONs within such barrier interaction studies provides profound insights into the passages’ dynamics and underlying mechanisms [115]. Actually, the comparison of MPS, ultraviolet/visible spectroscopy, AAS, and atomic emission spectroscopy by Friedrich et al. [130] already identified MPS as the most sensitive technique.
Focusing on the here presented experimental outcome obtained from compartment-specific quantification of fluidMAG-D in the transwell model, data indicate that the presence of an HBMEC layer on the transwell membrane almost entirely prevents the translocation of fluidMAG-D from the upper into the lower compartment, which confirms the pronounced barrier tightness. Strikingly, the increase in particle concentrations from 50 to 100 µg/cm2 and 200 µg/cm2 (equal to 100–400 µg/ml) does not enhance SPION accumulation within the cellular fraction. This fact might suggest that HBMECs cannot bind and internalize more of the starch-coated particles during the first 3 h of incubation, potentially owing to a fully stretched cellular endocytosis apparatus. As discussed above, the slow cellular accumulation kinetics as well as the active clathrin-dependent uptake of fluidMAG-D into HBMECs corresponds well to this assumption. Moreover, another substantial factor affecting the bioavailability of SPIONs to cells must be seen in particle agglomeration. As high SPION concentrations diminish the nanoparticles’ stability, decreased amounts of free particles contribute to less particle-cell interaction and the generation of false-negative or false-positive results, which have been discussed in the literature previously [131]. The fact that within the lower acceptor compartment a small but statistically significant amount of SPIONs is detectable after the 3-h incubation with 100 µg/cm2 of fluidMAG-D only provides further proofs for the active particle transport across the BBB model via transcytotic processes. The absence of SPIONs within this compartment after 30 min implies the time-dependent character.
The overall comparison of data obtained from MPS and AAS shows elevated iron amounts for the latter. This is accounted for by the fact that MPS is based on the specific detection of intact superparamagnetic particles, while during AAS, degraded particles or particle fragments also contribute to the determined signal. Another relevant issue can be seen in potentially altered magnetic behavior of SPIONs during the incubation progress. Thus, pronounced particle agglomeration modifies the magnetic susceptibility response. As such, a shift is detected by ratios of the 5th and 3rd spectrum amplitude (i.e., A 5/A 3 ratio) recorded during MPS measurements, inaccuracies can be corrected by switching to references of convenient A 5/A 3 ratios [111]. An alternative method for the highly sensitive in vitro quantification of SPIONs, regardless of any particle labeling, might be seen in a technique introduced by Gunn et al [132]. There, authors utilized the standardized methodology of proton nuclear magnetic resonance to quantitatively detect SPIONs within biological samples for five orders of magnitude and iron concentrations of 10 ng/ml. However, the particles’ disintegration as well as cell debris and cell digest hampers the unconditional application of this methodology [132]. Taken together, the data presented here demonstrate that the combination of the in vitro model with both SPION quantification methods (i.e., MPS and AAS) and integrity-evaluating assays allows the detailed investigation of the SPION passage through this biological barrier and the assessment of the resulting consequences on the barrier itself.
In order to develop the concept of a cellular barrier as a dynamic matrix further, we moved to a more complex mammalian cellular barrier, the BPB. The in vitro BPB consists of 2 cell types instead of one in the BBB model.
3.2 Establishment and optimization of an in vitro BPB model
As a first step toward the investigation of nanoparticle processing in the BPB, a transwell-based in vitro model of this barrier was established and optimized with regard to the cell culture medium, seeding density, and incubation time. Furthermore, the additional effect of pericytes on the barrier function was investigated comprehensively [133].
3.2.1 Medium adjustment for coculture of BeWo cells and pericytes
In order to create a transwell-based coculture BPB model, used cell types, BeWo, as well as pericytes needed to be cultivated in a uniform cell culture medium. For this purpose, both cells were cultured in DMEM + 10% FBS, instead of PGM in case of pericytes. After confirming that substitution of the cultivation medium did not lead to any morphologic alterations of the pericytes, alterations in the characteristic cell surface marker expression of pericytes evoked by the change in the cultivation medium were investigated by flow cytometry. According to the purchaser, pericytes should be CD31 and CD34 negative as well as CD105 and CD146 positive. Pericytes grown in PGM were also analyzed in passage four for comparison. Cells in all investigated passages and both media were negative for the markers CD31 and CD34. CD146 expression was stable over the observation time period, while CD105 expression depended on the cell passage. Its expression for cells in DMEM increased in early passages (<p6) and decreased again after p12. Furthermore, CD105 was only sparsely expressed in cells grown in PGM. Overall pericyte growth was dramatically reduced in higher passages. As a consequence, all further experiments were performed with pericytes cultured in DMEM and with a passage number between 6 and 10.
3.2.2 Effect of coculture on barrier formation and integrity
In the following section, the coculture model is compared to the monoculture with regard to the morphology of the cell layers, electrical resistances, and permeability. Different seeding densities of BeWo cells were used, and the model was investigated on day 3–5 post seeding (PS) in order to find optimal conditions for further studies using this in vitro model.
The seeding density directly influenced the thickness of the BeWo cell layers, especially for the monoculture. While the cell layer was found to be loosely packed for the monoculture, it was tighter and thinner for the coculture regarding all cell densities. The pericytes on the basolateral side of the membranes grew as a very thin layer. Afterward, the resulting barrier of the coculture in comparison to the monoculture was further investigated using TEER measurements and NaFl permeability measurements and by visualization of cell-cell contacts by cLSM. The transepithelial electrical resistances evoked by the cell barriers of monoculture and coculture models were measured for different BeWo densities during days 3–5 PS. The cocultivation of cell layers showed higher TEER values for all seeding densities than the corresponding monoculture samples. Pericytes cultivated alone did not produce any TEER values exceeding 15 Ω cm2 but were able to increase values when cultivated together with BeWo cells. For the monoculture, the resistance values increased from 18 to 46 Ω cm2 (day 4) with rising amounts of BeWo cells, while for the coculture, 200,000 cells showed the highest TEER measurements, with about 100 Ω cm2 at day 4 PS. Measurement of the passage of the passive permeability marker NaFl across the cell barrier revealed a higher restraint of the marker for the coculture in comparison to the monoculture for days 3–5 PS. The barrier tightness for the permeability marker of the coculture model increased steadily throughout the observation time from 60- to 140-fold restraint, while the values for the monoculture did not exceed a 35-fold restraint.
In order to investigate the formation of cell-cell contacts in the in vitro barrier, both ZO-1 as a marker for tight junctions and β-catenin for adherens junctions were visualized by immunofluorescent staining and subsequent cLSM (Figure 8). Apically located BeWo cells were shown to form dense layers under both monoculture and coculture conditions, which was visualized using Hoechst (blue) and AlexaFluor® 633 Phalloidin (red) for counterstaining of cells. The cell-contact markers ZO-1 and β-catenin (green) were shown to be mostly peripherally localized in monoculture as well as in coculture, but were both expressed higher in the coculture. The adherens junction marker seemed to be expressed higher in the BeWo cells than the one for tight junctions.
![Figure 8:
Comparison of expression of cell-cell contact markers β-catenin and ZO-1 for monoculture and coculture models using immunofluorescent staining. Transwell systems were prepared using 200,000 BeWo cells in monoculture and with 350,000 pericytes for coculture, and cultivated until day 4 PS; fixed and permeabilized cells were stained with rabbit anti–ZO-1 or β-catenin primary antibody followed by AlexaFluor® 488–labeled goat anti-rabbit secondary antibody (green), Hoechst 33258 (blue) and AlexaFluor® 633 Phalloidin (red) to visualize cell-cell contacts, cell nuclei, and cell cytoskeleton, respectively; fluorescence signals were acquired by cLSM; scale bar = 10 µm; PS = post seeding [133]. ZO = zonula occludens; cLSM = confocal laser scanning microscopy.](/document/doi/10.1515/psr-2019-0114/asset/graphic/j_psr-2019-0114_fig_008.jpg)
Comparison of expression of cell-cell contact markers β-catenin and ZO-1 for monoculture and coculture models using immunofluorescent staining. Transwell systems were prepared using 200,000 BeWo cells in monoculture and with 350,000 pericytes for coculture, and cultivated until day 4 PS; fixed and permeabilized cells were stained with rabbit anti–ZO-1 or β-catenin primary antibody followed by AlexaFluor® 488–labeled goat anti-rabbit secondary antibody (green), Hoechst 33258 (blue) and AlexaFluor® 633 Phalloidin (red) to visualize cell-cell contacts, cell nuclei, and cell cytoskeleton, respectively; fluorescence signals were acquired by cLSM; scale bar = 10 µm; PS = post seeding [133]. ZO = zonula occludens; cLSM = confocal laser scanning microscopy.
Taken together, these data confirmed the development of an in vitro cell barrier using both monoculture and coculture. Since the coculture barrier was shown to produce higher TEER resistances, higher NaFl restraint and more cell-cell contacts than the monoculture, further experiments concerning the passage of SPIONs were conducted using the coculture transwell BPB model with 200,000 BeWo cells, which produced the highest electrical resistance values. Furthermore, based on the results for TEER and permeability measurements, day 4 PS and day 5 PS were chosen for investigating the passage of nanoparticles through the in vitro barrier.
3.2.3 Pericyte-associated effects on the BPB model
In order to further investigate the effect pericytes evoked on BeWo cells during cocultivation, different conditions were compared concerning TEER and cell layer morphology via histologic cross sections. Besides the monoculture and coculture conditions, an indirect coculture, where pericytes were seeded on the bottom of the wells in the same density as for the direct coculture, and a monoculture supplemented with PCM were used.
TEER values of all conditions increased during the observation period (day 3–4 PS) (Figure 9A). While resistances measured for the coculture (>100 Ω cm2) were representatively higher than the ones measured for the monoculture, as already shown in the previous chapter, the values for the indirect coculture as well as for the monoculture + PCM were located at about 50 Ω cm2, hence in the same range as the model with only BeWo cells. Transverse sections of the cell-bearing transwell membranes at day 4 PS also revealed looser cell layers for the monoculture + PCM, which is comparable to the monoculture. The cell layer of the indirect coculture shows a denser packing, similar to the findings for the coculture (Figure 9B).
![Figure 9:
Investigation of the pericyte-associated effects in the BPB model using TEER and histologic slices. Transwell systems were prepared using 200,000 BeWo cells and (if applicable) 350,000 pericytes and cultivated for 3–4 days; conditions: coculture, monoculture, indirect coculture (pericytes on the bottom of the well), and monoculture + PCM. (A) TEER values were measured for day 3 and 4 PS; mean TEER values (Ω cm2) ± SD (n = 3) are shown. (B) Histologic slices of transwell membranes were prepared for day 4 PS; transwell membranes were embedded in paraffin and sectioned, and cells were stained with Nuclear Fast Red; arrows mark pericytes grown on the basolateral side of the membrane; scale bars represent 20 µm; PS = post seeding [133]. BPB = blood-placenta barrier; TEER = transendothelial electrical resistance; PCM = pericyte-conditioned medium; SD = standard deviation.](/document/doi/10.1515/psr-2019-0114/asset/graphic/j_psr-2019-0114_fig_009.jpg)
Investigation of the pericyte-associated effects in the BPB model using TEER and histologic slices. Transwell systems were prepared using 200,000 BeWo cells and (if applicable) 350,000 pericytes and cultivated for 3–4 days; conditions: coculture, monoculture, indirect coculture (pericytes on the bottom of the well), and monoculture + PCM. (A) TEER values were measured for day 3 and 4 PS; mean TEER values (Ω cm2) ± SD (n = 3) are shown. (B) Histologic slices of transwell membranes were prepared for day 4 PS; transwell membranes were embedded in paraffin and sectioned, and cells were stained with Nuclear Fast Red; arrows mark pericytes grown on the basolateral side of the membrane; scale bars represent 20 µm; PS = post seeding [133]. BPB = blood-placenta barrier; TEER = transendothelial electrical resistance; PCM = pericyte-conditioned medium; SD = standard deviation.
These results emphasize the positive effect of pericytes on the barrier tightness in the in vitro model, which seems to be dependent on the direct cocultivation, where BeWo cells are localized on the apical membrane side and pericytes are localized on the basolateral one.
The commercial clone of BeWo was used to create a transwell in vitro BPB model with higher seeding densities of about 6 × 10⁵ cells/cm2. Investigations concerning TEER measurements and permeability revealed the formation of a barrier using BeWo cells (monoculture) after 4–5 days, where measured TEER values exceeded 50 Ω cm2 and NaFl restraints were located at about 25-fold in comparison to cell-free inserts. The presence of tight junctions in the barrier cell layer was also verified by confocal microscopy. These values already indicate the formation of a tighter barrier using this clone than another study achieved using the b30 clone [65]. Histologic cross sections of the transwell membranes revealed the formation of a BeWo multilayer as soon as day 3 PS. Observations of the growth of BeWo cells in cell culture flasks showed that owing to the lack of growth inhibition after cell-cell contact, these cells tend to grow in multilayered patches before even forming confluent layers. Since these findings can be translated into the growth of these cells on transwell membranes, obtaining an intact monolayer of BeWo cells on membranes seemed impossible. Even researchers using the b30 clone suggested that the formation and maintenance of confluent monolayers is challenging owing to the lack of growth inhibition upon contact, and therefore, they used a BeWo multilayer for transport studies as a reproducible model since the integrity of the barrier is a critical point for in vitro transport studies across the BPB [70]. Furthermore, it is noted that the BPB in the human organism is composed of multiple layers in early stages of pregnancy, a syncytiotrophoblast layer, a confluent cytotrophoblast layer beneath, as well as the fetal blood vessels. Considering all the above mentioned aspects, in the present study, transport studies across the BPB were performed using a BeWo multilayer on transwell inserts rather than taking the change of subconfluent monolayers.
In order to reveal the effect of pericytes in the coculture model consisting of BeWo and pericytes, comparison between this setting and the monocultivation of BeWo cells in transwell inserts was performed, wherein the coculture model was shown to form a tighter barrier than the monoculture. Addition of pericytes to the BPB model led to higher TEER values and NaFl restraints as well as an increased expression of cell-cell contact markers. In comparison to other studies using the b30 clone, the coculture BPB model in this study created higher TEER values, which show the formation of a tighter cellular barrier compared to the b30 clone barrier [65], [66].
3.2.4 Effect of SPIONs on BPB cells
The effects of three differently charged SPIONs, neutral starch-coated particles, cationic PEI-coated particles, and anionic CMX-coated particles, onto the cells of the in vitro BPB model concerning cellular viability were evaluated in the following section using different methods. These experiments were performed in cell culture plates for each cell type independently prior to coculture transwell experiments. Concentration-dependent as well as incubation time-dependent effects of the particles were investigated in more detail.
3.2.4.1 Influence of SPIONs on cellular viability
Effects of SPIONs on the cellular viability of BeWo and pericytes were investigated using three different methods. The PrestoBlueTM cell viability assay and the SYTOX® red dead cell staining were used to reveal any cytotoxic effects for short-term nanoparticle exposure of 3 h, while the RTCA using the xCELLigence system showed changes in cellular behavior for up to 96 h. For both cell types, incubation with negatively charged CMX-coated particles did not lead to any inhibition of cellular viability for concentrations up to 100 µg/cm2. Interestingly, SYTOX® staining even showed an increase in the viable population up to 110% for pericytes incubated with 50 µg/cm2. For the treatment with neutral starch-coated particles, the results achieved from the PrestoBlueTM assay indicated an increasing cytotoxicity with increasing concentrations for both cell types since the viable cell population decreased to 60% for the highest concentration. Meanwhile, the viable population of analogously incubated cells analyzed by SYTOX staining did not decrease. Focusing on the PrestoBlue results, PEI-coated particles seemed to have no effect on the BeWo cells in any concentration used since the viability was always higher than 80%, while a significant decrease in the SYTOX-negative population to less than 50% could be seen for the flow cytometric analysis. The cellular viability of pericytes was shown to be decreased in a concentration-dependent manner, which could be seen for both experimental settings. Interestingly, the cellular viability upon incubation with PEI-coated particles obtained from flow cytometric experiments with values of less than 40% was significantly lower than the one from PrestoBlueTM assay (70–80%), which was already seen for the BeWo cells.
In order to investigate the long-term effects of the differently charged SPIONs on the cellular viability of BeWo cells and pericytes, cells incubated with fluidMAG particles were monitored for 96 h via impedance measurements using RTCA. In Figure 10, the relative cell indices (%) are depicted compared to the control sample (100%) for both cell types. Neither fluidMAG-D nor fluidMAG-CMX particles inhibited the cellular viability of BeWo cells for all concentrations investigated, wherein all values measured were above 85%. Interestingly, even increasing cell indices could be shown after about 24 h of incubation for the neutral starch-coated particles, indicating a stimulating effect on BeWo cells up to 120%. However, cellular viability of cells incubated with 100 µg/cm2 of fluidMAG-PEI particles was strongly inhibited (50%), while lower concentrations of these particles even stimulated the cells up to more than 120% shortly after addition of nanoparticles in the same manner as starch-coated particles. In contrast, all particles showed a concentration-dependent cytotoxic effect on pericytes, where the viability of cells was decreased to less than 75% for all particles and all concentrations. Here again, fluidMAG-PEI particles influenced cellular viability to the strongest extent, with the highest concentration decreasing the viability by more than 80%.
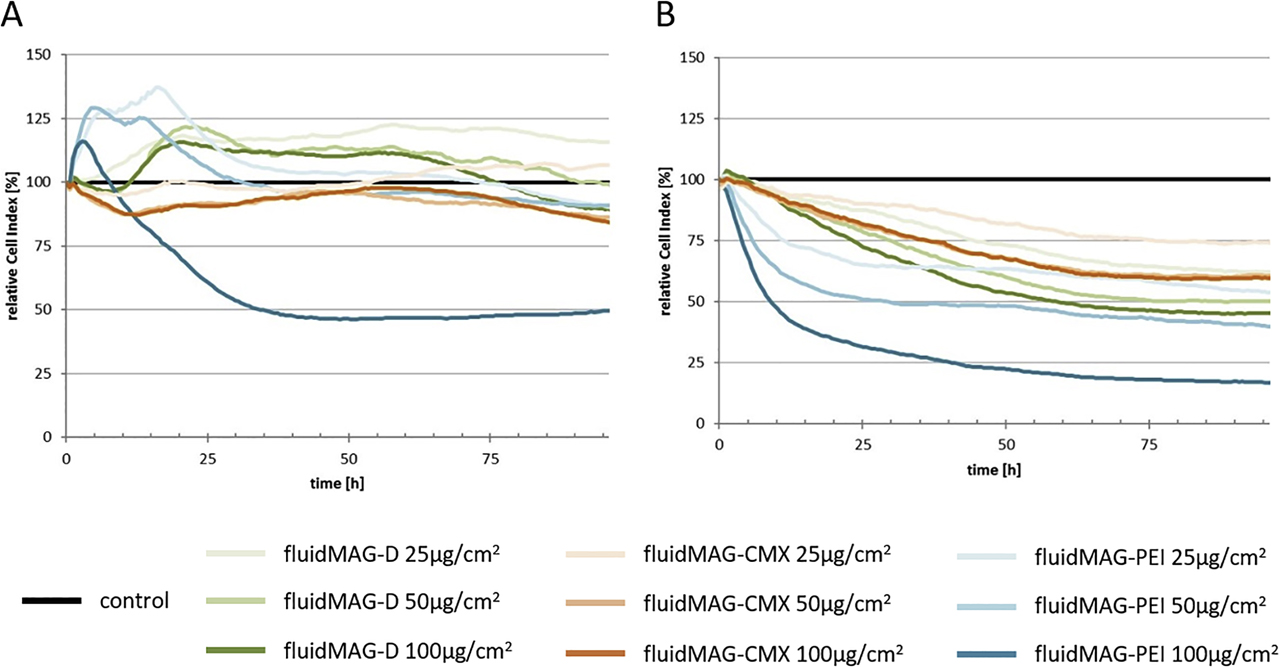
Viability of BeWo cells (A) and pericytes (B) after long-term incubation with SPIONs (96 h) measured by RTCA: 35,000/30,000 cells (BeWo/pericytes) were seeded in RTCA 16-well E plates; cell indices were recorded via impedance measurements at different time points over a period of 96 h; fluidMAG-D/PEI/CMX particles were added in different concentrations at time point 0; relative cell indices (%) obtained by normalization to time point 0 and dividing measured values by respective data from diluent-treated control cells; values represent means of two replicates. Shown are the results of one representative experiment of three independent experiments. RTCA = real-time cell analysis; SPION = superparamagnetic iron oxide nanoparticle; PEI = polyethylenimine.
In summary, it could be shown that cationic PEI-coated particles exhibited short- and long-term cytotoxic effects on both cell types, where pericytes showed the stronger reactions. Pericyte viability was furthermore influenced by all SPIONs in a concentration-dependent manner after long-term exposure, while BeWo cells were not affected.
The in vitro BPB model, with the direct cocultivation of BeWo cells and pericytes, was afterward used to study the behavior of three differently coated and thereby differently charged SPIONs. Neutral starch-coated particles consisted of a starch coating, cationic PEI-coated particles had polyethylenimine, and anionic CMX-coated particles had a carboxymethyldextran shell. For all particle types, intracellular localization could be shown by confocal microscopy owing to colocalization of particles with F-actin. As demonstrated with the BBB model, clathrin-dependent endocytosis is the most prominent mechanism by which nanomaterials enter cells [95]. However, cationic particles, especially PEI-coated ones, were also shown to create nanoscale holes in the negatively charged cell membrane, which leads to another entry port for these nanoparticles into the cells [134]. Whether these are the internalization mechanisms for the SPIONs used in this study needs to be investigated in further experiments.
In different experimental settings, the cytotoxicity of the particles for short- and long-term incubations was investigated. Cationic particles showed the strongest short- and long-term cytotoxic effects on both cell types. These results are in concordance with those of previous studies that investigated the impact of nanoparticle charge onto the cytotoxicity [77], [135]. In general, pericyte viability was more influenced by incubations with all three particles than BeWo cells, which might be accounted for by the larger cellular surface of pericytes resulting in an increased interaction surface.
The finding of a higher interaction of PEI-coated particles in comparison to the other particles can be explained by the strong interaction of cationic particles with the negatively charged cell membrane [81]. This interaction may also lead to a perforation of the membrane and subsequently to the formation of nanoscale holes [95]. Besides a higher incorporation rate into the cells, these small holes in the cell membrane also explain the higher cytotoxic effects of PEI-coated particles. Another factor influencing the toxicity of these particles is the “proton sponge effect,” wherein cationic particles induce organelle rupture via osmotic swelling after uptake into cells by endocytic pathways [86]. In addition to short-term cytotoxicity screens, the long-term cytotoxicity of the three SPIONs also was investigated by RTCA, which showed pronounced long-term toxic effects of PEI-coated particles on BeWo cells for high concentrations and on pericytes for all concentrations used. Furthermore, increased relative cell indices were measured for BeWo cells incubated with starch-coated particles in all concentrations as well as for lower concentrations of PEI-coated ones after addition of NPs compared to diluent-treated samples. With this impedance-based method, the net cell adhesion on the culture plates is measured, which is influenced by the cell morphology, the cell count, and the movement of cells [136]. The subsequent rise in the cell index after NP addition could therefore be caused by different factors influencing this value. Besides the induction of cell proliferation, an increase in the cell size or an increased adhesion of the cells also could be accounted for the increased values. The detailed mechanism by which incubation with nanoparticles stimulates BeWo cells and thereby increases the measured cell indices by RTCA could not be identified in the present study and should therefore be further investigated.
3.2.5 Interactions of the SPIONs with the BPB model
First, the behavior and distribution of the SPIONs in the BPB model as well as the barrier integrity and morphology were investigated using histologic cross sections from transwell membranes of the coculture model after 3 and 24 h of particle exposure (Figure 11A). The nanoparticles that interacted with the barrier cells were visualized by Prussian blue staining. For all conditions, no disruption of the barrier integrity and no changes in cellular morphology were visible in comparison to untreated models. Regarding the rate of nanoparticle interaction, PEI-coated particles were shown to interact most intensively with the apically located BeWo cell layer of the barrier, while fluidMAG-CMX interaction was the weakest. For starch-coated particles, the interaction strongly increased for an incubation time of 24 h in comparison to the shorter exposure time, being consistent with observations obtained from interaction studies of SPIONs with BeWo cells alone. With this method, no nanoparticles could be visualized in the pericyte cell layer on the basolateral side of the transwell membrane. The integrity of the in vitro transwell barrier after SPION incubation for 3 h or 24 h was further quantified using the transepithelial electrical resistance and the permeability measurement for the marker NaFl (Figure 11C). Comparison of TEER values after and before SPION incubation revealed no alteration of electrical resistance of the coculture model for all particles and both incubation times. Regarding molecular permeability, NaFl restraint was slightly lower for barriers incubated with particles for 3 h than for diluent-treated control barriers. After 24 h, only values for the incubation with cationic PEI-coated particles showed lower values than the control (Figure 11D). Since no nanoparticles could be visualized in the pericytes by histologic cross sections, for further investigation of the nanoparticle distribution in the two cell layers of the coculture BPB model, both sides of the transwell membranes incubated with fluorescently labeled particles (nsMAG/G-) for 3 and 24 h were investigated by cLSM (Figure 11B). Fluorescence signals of multiple z-layers (1-µm thick) were acquired, and one representative layer showing particles that penetrated the cell barrier is depicted for each condition for a 24-h incubation. As already described before, BeWo cells formed dense cell layers on the apical side of the membrane, while pericytes were found on the basolateral side. All three particle types could be visualized in the apical cell layer. For 24 h, only few NP spots (highlighted by white arrows) could be seen for the model incubated with CMX-coated particles, while D- and PEI-coated particles were visible all over the apical side of the cell barrier. For these two conditions, some nanoparticles also were visible in the basolateral pericyte cell layer, which are also highlighted by white arrows. For incubation with nsMAG/G-CMX, no particles could be seen on the basolateral side of the membrane. After 3 h of NP incubation, fewer particles were visible in the apical BeWo cell layer, while only PEI-coated particles were detected in the pericyte cell layer.
![Figure 11:
Analysis of the barrier integrity and morphology of the transwell coculture BPB model after exposure to different SPIONs for 3 h or 24 h. For the coculture model, 1.1 × 10⁶ cells/cm2 of pericytes were seeded onto the basolateral side of 24-well membrane inserts, and 6.1 × 10⁵ cells/cm2 of BeWo cells were seeded on the apical side of the insert membrane after 24 h. On day four post seeding (PS), barrier models were exposed to 100 µg/cm2 (200 µg/ml) of D/PEI/CMX-coated SPIONs for 3 h or 24 h. (A) After SPION exposure, histologic cross sections of transwell models were prepared and stained with Nuclear Fast Red and Prussian blue. Scale bars represent 10 µm. (B) For the analysis by confocal laser scanning microscopy (cLSM), samples incubated with fluorescently labeled SPIONs (green) were fixed and stained with Hoechst 33258 (blue) and Alexa Fluor® 633 phalloidin (red). White arrows mark SPION aggregates in the pericyte cell layer. Scale bars represent 10 µm. (C) Transepithelial electrical resistance (TEER) values measured in triplicate per insert before and after SPION exposure were compared for each condition. Shown are the mean values of the quotient of measured TEER values before/after SPION incubation ± standard deviation of three independent experiments. (D) The passage of the permeability marker sodium fluorescein (NaFl) through the barrier after SPION incubation was measured in duplicate for each condition, and the calculated permeability coefficients were normalized to blank membranes. Shown are mean values of the x-fold NaFl retention ± standard deviation of three independent experiments. The significance of the results compared to control measurements without SPIONs was tested using two-way ANOVA followed by Tukey’s multiple comparison test. Statistically significant differences are depicted as *p < 0.05 [133]. SPION = superparamagnetic iron oxide nanoparticle; PEI = polyethylenimine; ANOVA = analysis of variance.](/document/doi/10.1515/psr-2019-0114/asset/graphic/j_psr-2019-0114_fig_011.jpg)
Analysis of the barrier integrity and morphology of the transwell coculture BPB model after exposure to different SPIONs for 3 h or 24 h. For the coculture model, 1.1 × 10⁶ cells/cm2 of pericytes were seeded onto the basolateral side of 24-well membrane inserts, and 6.1 × 10⁵ cells/cm2 of BeWo cells were seeded on the apical side of the insert membrane after 24 h. On day four post seeding (PS), barrier models were exposed to 100 µg/cm2 (200 µg/ml) of D/PEI/CMX-coated SPIONs for 3 h or 24 h. (A) After SPION exposure, histologic cross sections of transwell models were prepared and stained with Nuclear Fast Red and Prussian blue. Scale bars represent 10 µm. (B) For the analysis by confocal laser scanning microscopy (cLSM), samples incubated with fluorescently labeled SPIONs (green) were fixed and stained with Hoechst 33258 (blue) and Alexa Fluor® 633 phalloidin (red). White arrows mark SPION aggregates in the pericyte cell layer. Scale bars represent 10 µm. (C) Transepithelial electrical resistance (TEER) values measured in triplicate per insert before and after SPION exposure were compared for each condition. Shown are the mean values of the quotient of measured TEER values before/after SPION incubation ± standard deviation of three independent experiments. (D) The passage of the permeability marker sodium fluorescein (NaFl) through the barrier after SPION incubation was measured in duplicate for each condition, and the calculated permeability coefficients were normalized to blank membranes. Shown are mean values of the x-fold NaFl retention ± standard deviation of three independent experiments. The significance of the results compared to control measurements without SPIONs was tested using two-way ANOVA followed by Tukey’s multiple comparison test. Statistically significant differences are depicted as *p < 0.05 [133]. SPION = superparamagnetic iron oxide nanoparticle; PEI = polyethylenimine; ANOVA = analysis of variance.
3.2.5.1 Passage of SPIONs through the in vitro BPB
In scope of studying the passage of SPIONs in the BPB model, the total amount of magnetic iron in each of the four compartments after incubation with nanoparticles for 3 and 24 h was quantified via MPS. The results of three independent experiments are depicted in Figure 12. PEI-coated particles could be shown to interact with the cells to the highest extent, indicated by detected SPION contents as high as 13.4 µg in the BeWo cell layer after 24 h. Consistent with these findings, less particles were detected in the upper donor compartment. Since CMX-coated particle interaction with BeWo cells was the lowest with 2.3 µg of detected SPIONs after 24 h, the highest amounts of iron (11.6 µg) could be found in the donor compartment for this condition. For starch-coated particles, an enhanced interaction could be shown by an increased detection of SPIONs in the BeWo layer from 0.5 µg after 3 h to 3.9 µg after incubation for 24 h. In the pericyte cell layer on the basolateral side of the transwell membrane, only small amounts of magnetic iron up to 7 ng could be detected. For an incubation time of 3 h, only CMX-coated particles could be detected in the pericyte cell layer with an amount of 6.6 ng since this was the only sample exceeding the lower detection limit of 1.8 ng. For 24 h of incubation, all particles could be reliably detected in the basolateral pericyte cell layer, where incubation with PEI-coated particles showed the lowest SPION content of 2.6 ng and the highest values were obtained for incubation with starch-coated particles with an iron amount of 4.5 ng. Nanoparticle amounts detected in the lower acceptor compartment were located in a range from 0 to 1 ng of iron. Since the lower detection limit for this compartment was calculated to be 0.9 ng, only starch-coated particles could be reliably measured in the acceptor compartment with an amount of 1.1 ng after 24 h.
![Figure 12:
Investigation of the passage of SPIONs through the transwell BPB model after exposure for 3 h or 24 h via MPS. Transwell coculture systems were prepared using 200,000 BeWo cells/350,000 pericytes; on day 4 PS, barrier models were exposed to 100 µg/cm2 of fluidMAG-D/PEI/CMX particles for 3 and 24 h; complete medium of lower and upper compartments was collected, and cells from the apical and basolateral side of the membrane were harvested by trypsination; samples were measured using a MP spectrometer; Nanoparticle spectra were normalized to corresponding nanoparticle solutions of known iron content. Shown are the iron contents of all four compartments (ng) ± SD from 2 to 3 independent experiments. For pericytes (basolateral side) and the lower compartment, the lower detection limit is depicted as a dotted line at 1.83 and 0.88 ng, respectively. PS = post seeding [133]. SPION = superparamagnetic iron oxide nanoparticle; BPB = blood-placenta barrier; MPS = magnetic particle spectroscopy; PS = post seeding; PEI = polyethylenimine; SD = standard deviation.](/document/doi/10.1515/psr-2019-0114/asset/graphic/j_psr-2019-0114_fig_012.jpg)
Investigation of the passage of SPIONs through the transwell BPB model after exposure for 3 h or 24 h via MPS. Transwell coculture systems were prepared using 200,000 BeWo cells/350,000 pericytes; on day 4 PS, barrier models were exposed to 100 µg/cm2 of fluidMAG-D/PEI/CMX particles for 3 and 24 h; complete medium of lower and upper compartments was collected, and cells from the apical and basolateral side of the membrane were harvested by trypsination; samples were measured using a MP spectrometer; Nanoparticle spectra were normalized to corresponding nanoparticle solutions of known iron content. Shown are the iron contents of all four compartments (ng) ± SD from 2 to 3 independent experiments. For pericytes (basolateral side) and the lower compartment, the lower detection limit is depicted as a dotted line at 1.83 and 0.88 ng, respectively. PS = post seeding [133]. SPION = superparamagnetic iron oxide nanoparticle; BPB = blood-placenta barrier; MPS = magnetic particle spectroscopy; PS = post seeding; PEI = polyethylenimine; SD = standard deviation.
In order to investigate the ability of the three SPIONs to cross cell-free transwell membranes, similar experiments as described with the in vitro model were also performed with blank inserts. While for D- and CMX-coated particles the majority of nanoparticles were able to cross the blank membrane, most of the PEI-coated particles were detected in the upper donor compartment, indicating a hindered passage across the transwell membrane.
Taken together, it could be shown that incubation with all three investigated SPIONs had no significant harmful effect on the barrier integrity of the in vitro BPB model. In different experiments, PEI-coated particle interaction with the apical BeWo cell layer could be shown to be the highest among the investigated particles, while CMX-coated ones showed the lowest interaction capacity. For starch-coated particles, a significant increase in the amount of interacting particles could be seen after 24 h. Nanoparticles could also be detected in the basolateral pericyte cell layer by cLSM and MPS. Furthermore, using MPS measurements, the distribution of nanoparticles in the four compartments of the transwell BPB model could be quantified.
In order to quantify the amount of nanoparticles in the upper and lower compartment of the transwell system as well as in both cell layers, analysis via MPS was performed. The detected amounts of particles in the upper compartment and the apical BeWo cell layer confirm the previous microscopic studies, where cationic particles showed the highest interaction capacity with the cells, while neutral particles interacted intermediately, and anionic particles showed the lowest interaction. Furthermore, in the basolateral pericyte cell layer, some particles were detected too. In contrast to the BBB model, almost all measured magnetic iron contents in the lower compartment were located below the detection limit, only neutral D-coated particles could be detected after a 24-h incubation with a magnetic iron amount of 1.1 ng. These results indicate that either no particles were able to cross the tight in vitro barrier or the magnetic properties might be altered owing to the transcellular passage of SPIONs and are therefore not detected by this method.
3.2.6 Passage of SPIONs through the in vitro BPB under flow conditions
In order to go a step forward, we transferred the in vitro blood-placenta model from the transwell setup to a microfluidic biochip as this allows adding shear stress to the cells, an important factor for placental function [137]. Shear stress rates below 2 dyn/cm2 (0.2 Pa) are observed in the early stages of pregnancy, which is protective of maintenance of the trophoblast layer with its villous structures [138]. We established the biochip and investigated the interaction of different nanoparticles under fluidic conditions with a special focus on their passaging abilities.
After formation of the BeWo cell layer on the apical side of the membrane and the pericyte cell layer on the basolateral side of the membrane, the cell layers were examined by histologic slices. A thin barrier consisting of BeWo cells and pericytes was visible, which significantly reduced the permeability of the membrane for NaFl in comparison to the blank (46.2 vs. 345 nM NaFl). Incubation of the biochip with or without laminar flow affects neither the expression of the tight junction protein ZO-1 nor the overall cell morphology (Figure 13). The applied SPIONs do not disrupt the cell barrier on the biochip.
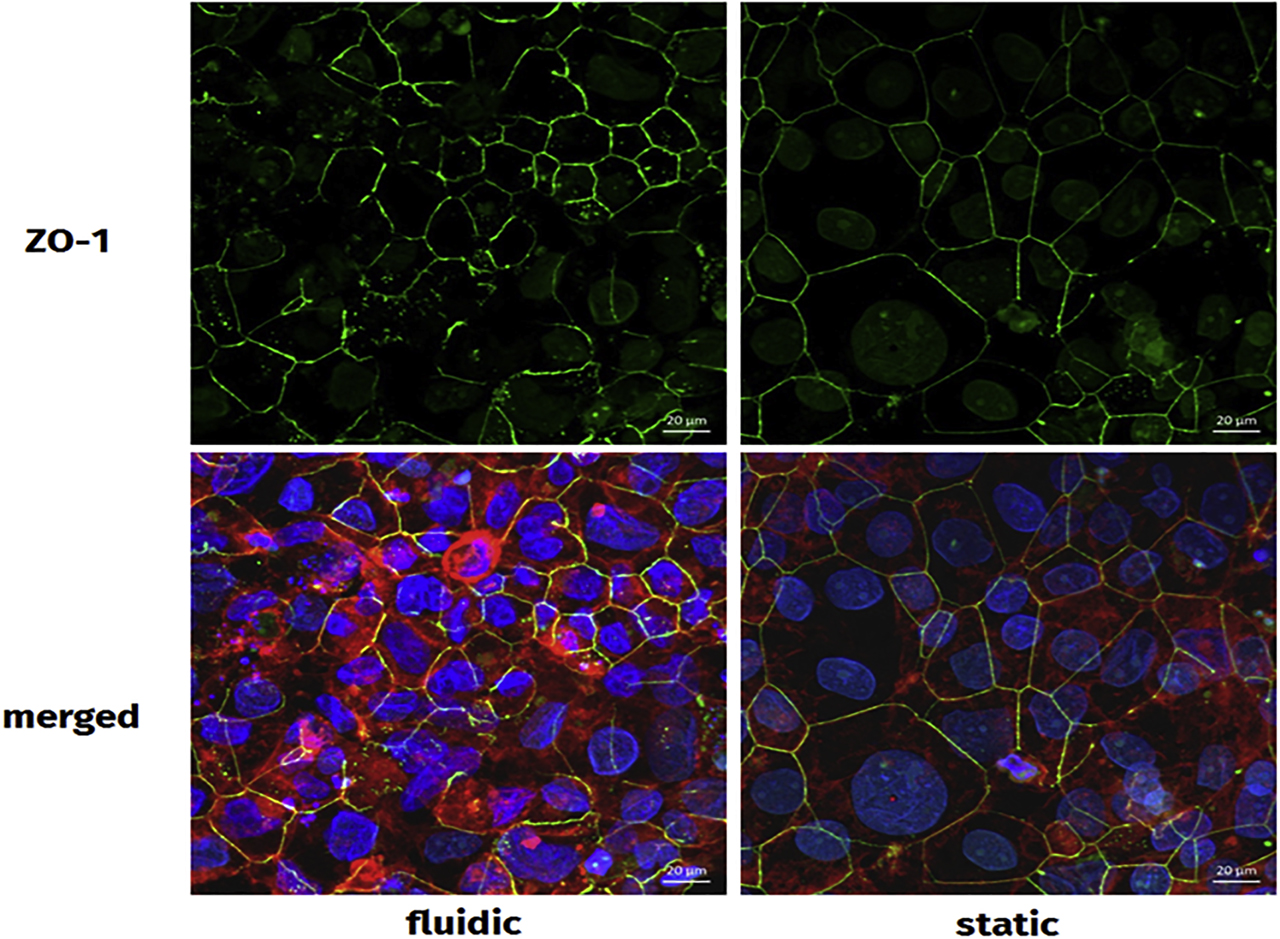
Effects of incubation with and without laminar flow on cell-cell contacts and cell morphology. The BeWo cells were stained with Alexa Fluor® 633 Phalloidin (red), Hoechst 33258 (blue), and zonula occludens-1 (ZO-1) antibody (green), followed by analysis by confocal laser scanning microscopy (cLSM) for detection of F-actin, cell nuclei, and ZO-1. Both incubation regimes (with and without laminar flow) allowed similar cell morphology and localization of ZO-1.
The putative passage of the SPIONs through the barrier was monitored by MPS after a single round of circulation without a magnetic field gradient and compared to the static situation. In that scenario, the nanoparticle-containing medium remains in the biochip for 3 h. The distribution within the upper donor channel, the lower acceptor channel, and the membrane was measured by MPS and was SPION specific (Figure 14). More than 90% of sodium citrate–coated nanoparticles remain in the upper donor channel independent of the presence of a cell layer or FBS. A low amount of sodium citrate nanoparticles was detectable in the barrier cells (2.5% ± 0.8% SD; without FBS 6.1% ± 1.8% SD). SEONLA-HSA nanoparticles displayed a different distribution. Almost all SEONLA-HSA nanoparticles remain in the upper donor channel. In the lower acceptor channel, less than 0.2% of SEONLA-HSA nanoparticles could be measured in the fluidic and the static setting each. This shows that the in vitro BPB under fluidic conditions is comparable to the static conditions with regard to the transportation behavior of the added nanoparticles.
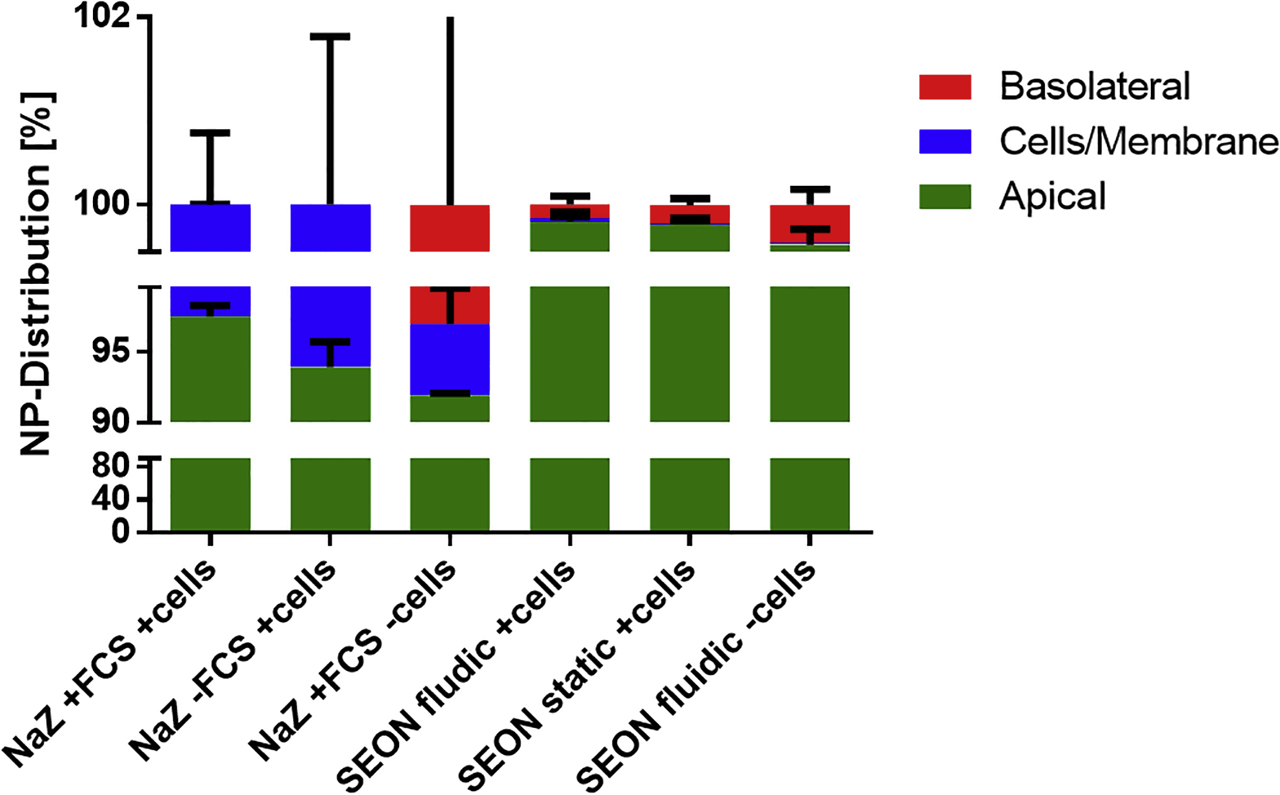
Quantification and passage of different nanoparticles in the BPB model by magnetic particle spectroscopy (MPS). After 7 days of incubation, the reservoir of the biochip was emptied. For the single round of circulation, the upper channel was filled with 800 µl of the nanoparticle solutions (100 µg/ml in the standard medium), respectively. The nanoparticle solution circulated one time through the upper channel of the biochip followed by 800 µl of fresh medium without nanoparticles in an incubator at 37 °C, 5% CO2 in a humidified atmosphere. The flow through was collected in one sample (apical: upper channel). Subsequently, the medium of the lower channel (basolateral: lower channel) was collected, and the membrane carrying the BeWo cells and pericytes (cells/membrane) was excised. All samples were reduced to a final volume of ∼50 µl and analyzed by MPS. All relative concentrations were calculated from the obtained absolute values. NaZ = sodium citrate nanoparticles; SEON = SEONLA-HSA nanoparticles. BPB = blood-placenta barrier.
BeWo cells cocultured with pericytes form a stable barrier inside the microfluidic biochip, confirming the observations from the static transwell system. Incubation of the biochip with or without laminar flow affects neither the expression of the tight junction protein ZO-1 nor the overall cell morphology. Histologic slices (not shown) reveal the formation of a thin barrier by the BeWo cells, which significantly reduced the permeability of the membrane for fluorescein sodium. Different nanoparticles neither reduce the vitality of BeWo cells in 2D cell culture (data not shown) nor disrupt the cell barrier on the biochip. MPS is a suitable technique to determine the nanoparticle concentrations for different compartments of the chip. The cellular accumulation of SPIONs as well as the nanoparticle passage depends on core-shell particle characteristics.
4 Conclusions
The here presented data establish experimental in vitro tools for the detailed evaluation of SPION interactions and passage through biological barriers including the assessment of SPION-associated consequences for barrier integrity. For the first time, MPS is adopted in this experimental biological setting analyzing SPION passage through biological barriers in order to achieve direct and highly sensitive particle detection within the distinct compartments. Hence, a profound insight into passage’s dynamics is provided. Furthermore, the presented results impressively demonstrate that free fluidMAG-D traverse the barrier system in a time-dependent manner most likely based on clathrin-induced transcytotic processes. In addition, barrier integrity remains unaffected on particle passage, which is explained by the comparatively slow and gentle cellular accumulation and uptake. In contrast, data imply that nanoparticles with cationic surface charge as well as the BSA-coated nanoparticles intensively assemble within the barrier-forming cells and affect the BBB model in a barrier-disrupting manner. These observations are made for nonfunctionalized SPIONs and can be carried out for each individual SPION formulation in order to achieve a comprehensive risk assessment. For applications not targeting the brain or the placenta, particle penetration into and accumulation off-target upon repeated administration is strictly undesirable. Though, according to purposes when transition of SPIONs into, e.g., the brain is required, additional functionalization such as by ligand binding may be utilized for the enhanced particle delivery across the BBB and need to be evaluated as well. The here presented test systems provide an appropriate platform and allow an insight into the underlying mechanisms, thus contributing to a comprehensive understanding of particle interactions with the BBB and the BPB. In consequence, gained knowledge aids in the tailored design of SPIONs according to the particular application.
The presented investigations ignore the impact of the biomolecule corona and its pivotal role on biological effects. These aspects are investigated and discussed in detail in the study by Dutz et al. [139]. The role of the biomolecule corona should be considered during SPION functionalization as it may present opsonins or shield functional groups on the particle surface.
Utilizing and extending the here established systems, the inclusion of flow conditions by using a microfluidic biochip might mimic the in vivo situation even closer. Nevertheless, it has to be noted that the experimental setup has some limitations too. The results indicate that especially when testing the passage of free SPIONs across the barriers under inflammatory conditions, the extension from the monoculture system to a coculture or triculture system with astrocytes or/and pericytes is consequent. Even if such elevated models are more difficult in handling and more interference prone, they even closer represent the complexity of biological tissues and incorporate the eclectic interplay of different cell types during inflammatory states.
The detailed analysis and magnetic characterization of SPIONs after barrier penetration is of vital importance as this also influences tissue distribution, magnetic response during SPION applications such as imaging or therapeutic heating, and elimination processes. Hence, the presented in vitro barrier models in line with further verifications according to Barnes et al. [140] must be utilized for such clarifications in the future. Resulting knowledge can help to improve arrangement of magnets in order to achieve appropriate magnetic fields, which optimize SPION application efficacy. Pedram et al. [141] emphasized that the application of a magnetic field between 0.6 and 2.5 T and a minimal gradient and/or amplitude are crucial for not damaging the BBB. Furthermore, alternative approaches in magnet-assisted transport of SPIONs across barriers and into deeper tissues might solve problems in the delivery of therapeutic substances. A remarkable example can be seen in the novel method developed by Shapiro et al [142], who use a two-magnet system in order to push magnetic nanomedicines into diseased tissue. Taken together, SPION-based therapies bear promising and versatile potentials to solve major biomedical problems.
Acknowledgments
We highly appreciate the continuous support of the DFG in the frame of the high priority program 1681. The success of this program is closely connected with Prof. Stefan Odenbach. Without his enthusiasm and outstanding engagement—at first in science but also in organizing affairs—the efforts within the SPP1681 would not be imaginable. We thank all colleagues for their support and the inspiring discussions during collaborations and meetings. Funded by the DFG, High Priority Program 1681: AL552/5-3; CL202/3-3; WI4230/1-3; DU1293/7-3. We further acknowledge the support of the Core Facility “Metrology of ultra-low magnetic fields” at Physikalisch-Technische Bundesanstalt, which receives funding from the Deutsche Forschungsgemeinschaft-DFG (funding code DFG KO 5321/3-1 and TR 408/11-1).
-
Author contribution: All the authors have accepted responsibility for the entire content of this submitted manuscript and approved submission.
-
Research funding: None declared.
-
Conflict of interest statement: The authors declare no conflicts of interest regarding this article.
References
1. Pelaz, B, Alexiou, C, Alvarez-Puebla, RA, Alves, F, Andrews, AM, Ashraf, S, et al. Diverse applications of nano-medicine. ACS Nano 2017; 11: 2313. https://doi.org/10.1021/acsnano.6b06040.Search in Google Scholar PubMed PubMed Central
2. Onoue, S, Yamada, S, Chan, HK. Nanodrugs: pharmacokinetics and safety. Int J Nanomed 2014; 9: 1025. https://doi.org/10.2147/ijn.s38378.Search in Google Scholar PubMed PubMed Central
3. Matsumura, Y, Maeda, H. A new concept for macromolecular therapeutics in cancer chemotherapy: mechanism of tumoritropic accumulation of proteins and the antitumor agent smancs. Cancer Res 1986; 46: 6387.Search in Google Scholar
4. Bazak, R, Houri, M, El Achy, S, Kamel, S, Refaat, T. Cancer active targeting by nanoparticles: a comprehensive review of literature. J Cancer Res Clin Oncol 2015; 141: 769. https://doi.org/10.1007/s00432-014-1767-3.Search in Google Scholar PubMed PubMed Central
5. Noorlander, CW, Kooi, MW, Oomen, AG, Park, MV, Vandebriel, RJ, Geertsma, RE. Horizon scan of nanomedicinal products. Nanomedicine 2015; 10: 1599. https://doi.org/10.2217/nnm.15.21.Search in Google Scholar PubMed
6. Bean, CP, Livingston, JD. Superparamagnetism. J Appl Phys 1959; 30: S120. https://doi.org/10.1063/1.2185850.Search in Google Scholar
7. Caruntu, D, Caruntu, G, O’Connor, CJ. Magnetic properties of variable-sized Fe3O4 nanoparticles synthesized from non-aqueous homogeneous solutions of polyols. J Phys D Appl Phys 2007; 40: 5801. https://doi.org/10.1088/0022-3727/40/19/001.Search in Google Scholar
8. Qiang, Y, Antony, J, Sharma, A, Nutting, J, Sikes, D, Meyer, D. Iron/iron oxide core-shell nanoclusters for biomedical applications. J Nanoparticle Res 2006; 8: 489. https://doi.org/10.1007/s11051-005-9011-3.Search in Google Scholar
9. Blasiak, B, van Veggel, FCJM, Tomanek, B. Applications of nanoparticles for MRI cancer diagnosis and therapy. J Nanomaterials 2013:148578. https://doi.org/10.1155/2013/148578.Search in Google Scholar
10. Singh, N, Jenkins, GJ, Asadi, R, Doak, SH. Potential toxicity of superparamagnetic iron oxide nanoparticles (SPION). Nano Rev 2010; 1: 5358. https://doi.org/10.3402/nano.v1i0.5358.Search in Google Scholar PubMed PubMed Central
11. Kautz, L, Nemeth, E. Molecular liaisons between erythropoiesis and iron metabolism. Blood 2014; 124: 479. https://doi.org/10.1182/blood-2014-05-516252.Search in Google Scholar PubMed PubMed Central
12. Worwood, M, Bain, BJ, Bates, I. Chapter 7 – Iron deficiency anaemia and iron overload A2 – Lewis, S. Mitchell. Philadelphia: Churchill Livingstone; 2006, 131–60.10.1016/B0-44-306660-4/50011-8Search in Google Scholar
13. Santhosh, PB, Ulrih, NP. Multifunctional superparamagnetic iron oxide nanoparticles: promising tools in cancer theranostics. Cancer Lett 2013; 336: 8. https://doi.org/10.1016/j.canlet.2013.04.032.Search in Google Scholar PubMed
14. Wahajuddin, AS. Superparamagnetic iron oxide nanoparticles: magnetic nanoplatforms as drug carriers. Int J Nano 2012; 7: 3445. https://doi.org/10.2147/ijn.s30320.Search in Google Scholar
15. Yu, M, Huang, S, Yu, KJ, Clyne, AM. Dextran and polymer polyethylene glycol (PEG) coating reduce both 5 and 30 nm iron oxide nanoparticle cytotoxicity in 2D and 3D cell culture. Int J Mol Sci 2012; 13: 5554. https://doi.org/10.3390/ijms13055554.Search in Google Scholar PubMed PubMed Central
16. Alwi, R, Telenkov, S, Mandelis, A, Leshuk, T, Gu, F, Oladepo, S, et al. Silica-coated super paramagnetic iron oxide nanoparticles (SPION) as biocompatible contrast agent in biomedical photoacoustics. Biomed Optics Express 2012; 3: 2500. https://doi.org/10.1364/boe.3.002500.Search in Google Scholar PubMed PubMed Central
17. Laurent, S, Dutz, S, Häfeli, UO, Mahmoudi, M. Magnetic fluid hyperthermia: focus on superparamagnetic iron oxide nanoparticles. Adv Colloid Interface Sci 2011; 166: 8. https://doi.org/10.1016/j.cis.2011.04.003.Search in Google Scholar PubMed
18. Shevtov, M, Multhoff, G. Recent developments of magnetic nanoparticles for theranostics of brain tumor. Curr Drug Metab 2016; 17: 737. https://doi.org/10.2174/1389200217666160607232540.Search in Google Scholar PubMed
19. MagForce Nanotechnologies AG. MagForce Nanotechnologies AG receives European regulatory approval for its NanoCancer therapy. http://www.magforce.de/en/presse-investoren/news-events/detail/article/magforce-nanotechnologies-ag-erhaelt-europaeische-zulassung-fuer-die-nano-krebsR-therapie.html [Accessed August 2017].Search in Google Scholar
20. Su, H, Wang, Y, Gu, Y, Bowman, L, Zhao, J, Ding, M. Potential applications and human biosafety of nanomaterials used in nanomedicine. J Appl Toxicol 2018; 38: 3. https://doi.org/10.1002/jat.3476.Search in Google Scholar PubMed PubMed Central
21. Angelakeris, M. Magnetic nanoparticles: a multifunctional vehicle for modern theranostics. Biochim Biophys Acta (BBA) Gen Subj 2017; 1861: 1642. https://doi.org/10.1016/j.bbagen.2017.02.022.Search in Google Scholar PubMed
22. Hayashi, K, Nakamura, M, Sakamoto, W, Yogo, T, Miki, H, Ozaki, S, et al. Superparamagnetic nanoparticle clusters for cancer theranostics combining magnetic resonance imaging and hyperthermia treatment. Theranostics 2013; 3: 366. https://doi.org/10.7150/thno.5860.Search in Google Scholar PubMed PubMed Central
23. Brazel, CS, Huang, X. The cost of optimal drug delivery: reducing and preventing the burst effect in matrix systems. ACS Symp Ser 2014; 879: 267. https://doi.org/10.1021/bk-2004-0879.ch019.Search in Google Scholar
24. Mahmoudi, M, Simchi, A, Milani, AS, Stroeve, P. Cell toxicity of superparamagnetic iron oxide nanoparticles. J Colloid Interface Sci 2009; 336: 510. https://doi.org/10.1016/j.jcis.2009.04.046.Search in Google Scholar PubMed
25. Rolfe, DF, Brown, GC. Cellular energy utilization and molecular origin of standard metabolic rate in mammals. Physiol Rev 1997; 77: 731. https://doi.org/10.1152/physrev.1997.77.3.731.Search in Google Scholar PubMed
26. Hawkins, BT, Davis, TP. The blood–brain barrier/neurovascular unit in health and Disease. Pharmacol Rev 2005:57173. https://doi.org/10.1124/pr.57.2.4.Search in Google Scholar PubMed
27. Bicker, J, Alves, G, Fortuna, A, Falcão, A. Blood–brain barrier models and their relevance for a successful development of CNS drug delivery systems: a review. Eur J Pharm Biopharm 2014; 87: 409. https://doi.org/10.1016/j.ejpb.2014.03.012.Search in Google Scholar PubMed
28. Jain, KK. Nanobiotechnology-based strategies for crossing the blood–brain barrier. Nanomedicine 2012; 7: 1225. https://doi.org/10.2217/nnm.12.86.Search in Google Scholar PubMed
29. Srinivasan, B, Kolli, AR, Esch, MB, Abaci, HE, Shuler, ML, Hickman, JJ. TEER measurement techniques for in vitro barrier model systems. J Lab Autom 2015; 20: 107. https://doi.org/10.1177/2211068214561025.Search in Google Scholar PubMed PubMed Central
30. Butt, AM, Jones, HC, Abbott, NJ. Electrical resistance across the blood–brain barrier in anaesthetized rats: a developmental study. J Physiol 1990; 429: 47. https://doi.org/10.1113/jphysiol.1990.sp018243.Search in Google Scholar PubMed PubMed Central
31. Abbott, NJ, Patabendige, AAK, Dolman, DEM, Yusof, SR, Begley, DJ. Structure and function of the blood–brain barrier. Neurobiol Dis 2010; 37: 13. https://doi.org/10.1016/j.nbd.2009.07.030.Search in Google Scholar PubMed
32. Hori, S, Ohtsuki, S, Hosoya, KI, Nakashima, E, Terasaki, T. A pericyte-derived angiopoietin-1 multimeric complex induces occludin gene expression in brain capillary endothelial cells through Tie-2 activation in vitro. J Neurochem 2004; 89: 503. https://doi.org/10.1111/j.1471-4159.2004.02343.x.Search in Google Scholar PubMed
33. Farkas, E, Luiten, PG. Cerebral microvascular pathology in aging and Alzheimer’s disease. Prog Neurobiol 2001; 64: 575. https://doi.org/10.1016/s0301-0082(00)00068-x.Search in Google Scholar
34. Takeshita, Y, Ransohoff, RM. Inflammatory cell trafficking across the blood–brain barrier (BBB): chemokine regulation and in vitro models. Immunol Rev 2012; 248: 228. https://doi.org/10.1111/j.1600-065x.2012.01127.x.Search in Google Scholar
35. Abbott, NJ, Ronnback, L, Hansson, E. Astrocyte-endothelial interactions at the blood–brain barrier. Nat Rev Neurosci 2006; 7: 41. https://doi.org/10.1038/nrn1824.Search in Google Scholar
36. Fernandes, C, Soni, U, Patravale, V. Nano-interventions for neurodegenerative disorders. Pharmacol Res 2010; 62: 166. https://doi.org/10.1016/j.phrs.2010.02.004.Search in Google Scholar
37. Doolittle, ND, Miner, ME, Hall, WA, Siegal, T, Hanson, EJ, Osztie, E, et al. Safety and efficacy of a multicenter study using intraarterial chemotherapy in conjunction with osmotic opening of the blood–brain barrier for the treatment of patients with malignant brain tumors. Cancer 2000; 88: 637. https://doi.org/10.1002/(sici)1097-0142(20000201)88:3<637::aid-cncr22>3.0.co;2-y.10.1002/(SICI)1097-0142(20000201)88:3<637::AID-CNCR22>3.0.CO;2-YSearch in Google Scholar
38. Hersh, DS, Wadajkar, AS, Roberts, N, Perez, JG, Connolly, NP, Frenkel, V, et al. Evolving Drug Delivery strategies to overcome the blood brain barrier. Curr Pharm Des 2016; 22: 1177. https://doi.org/10.2174/1381612822666151221150733.Search in Google Scholar
39. Hynynen, K, McDannold, N, Vykhodtseva, N, Jolesz, FA. Noninvasive MR imaging–guided focal opening of the blood–brain barrier in rabbits. Radiology 2001; 220: 640. https://doi.org/10.1148/radiol.2202001804.Search in Google Scholar
40. Simuni, T, Hurtig, H. Parkinson’s disease: diagnosis and clinical management, chapter levadopa: a pharmacologic miracle four decades later. New York, NY, USA: Demos Medical Publishing; 2008.Search in Google Scholar
41. Cheng, Y, Morshed, RA, Auffinger, B, Tobias, AL, Lesniak, MS. Multifunctional nanoparticles for brain tumor imaging and therapy. Adv Drug Deliv Rev 2014; 66: 42. https://doi.org/10.1016/j.addr.2013.09.006.Search in Google Scholar
42. Schnyder, A, Huwyler, J. Drug transport to brain with targeted liposomes. NeuroRX 2005; 2: 99. https://doi.org/10.1602/neurorx.2.1.99.Search in Google Scholar
43. Smith, MW, Gumbleton, M. Endocytosis at the blood–brain barrier: from basic understanding to drug delivery strategies. J Drug Target 2006; 14: 191. https://doi.org/10.1080/10611860600650086.Search in Google Scholar
44. Tian, XH, Lin, XN, Wie, F, Feng, W, Huang, ZC, Wang, P. Enhanced brain targeting of temozolomide in polysorbate-80 coated polybutylcyanoacrylate nanoparticles. Int J Nanomed 2011; 6: 445. https://doi.org/10.2147/IJN.S16570.Search in Google Scholar PubMed PubMed Central
45. Myren, M, Mose, T, Mathiesen, L, Knudsen, LE. The human placenta—an alternative for studying foetal exposure. Toxicol In Vitro 2007; 21: 1332. https://doi.org/10.1016/j.tiv.2007.05.011.Search in Google Scholar PubMed
46. Daw, JR, Hanley, GE, Greyson, DL, Morgan, SG. Prescription drug use during pregnancy in developed countries: a systematic review. Pharmacoepidemiol Drug Saf 2011; 20: 895. https://doi.org/10.1002/pds.2184.Search in Google Scholar PubMed PubMed Central
47. Buerki-Thurnherr, T, von Mandach, U, Wick, P. Knocking at the door of the unborn child: engineered nanoparticles at the human placental barrier. Swiss Med Wkly 2012; 142: w13559. https://doi.org/10.4414/smw.2012.13559.Search in Google Scholar PubMed
48. Correia Carreira, S, Walker, L, Paul, K, Saunders, M. The toxicity, transport and uptake of nanoparticles in the in vitro BeWo b30 placental cell barrier model used within NanoTEST. Nanotoxicology 2015; 9: 66. https://doi.org/10.3109/17435390.2013.833317.Search in Google Scholar PubMed
49. Kim, JH, Scialli, AR. Thalidomide: the tragedy of birth defects and the effective treatment of disease. Toxicol Sci 2011; 122: 1. https://doi.org/10.1093/toxsci/kfr088.Search in Google Scholar PubMed
50. Muoth, C, Aengenheister, L, Kucki, M, Wick, P, Buerki-Thurnherr, T. Nanoparticle transport across the placental barrier: pushing the field forward!. Nanomedicine 2016; 11: 941. https://doi.org/10.2217/nnm-2015-0012.Search in Google Scholar PubMed
51. Enders, AC, Blankenship, TN. Comparative placental structure. Adv Drug Deliv Rev 1999; 38: 3. https://doi.org/10.1016/s0169-409x(99)00003-4.Search in Google Scholar PubMed
52. Vähäkangas, K, Myllynen, P. Drug transporters in the human blood–placental barrier. Br J Pharmacol 2009; 158: 665. https://doi.org/10.1111/j.1476-5381.2009.00336.x.Search in Google Scholar PubMed PubMed Central
53. Young, AM, Allen, CE, Audus, KL. Efflux transporters of the human placenta. Adv Drug Deliv Rev 2003; 55: 125. https://doi.org/10.1016/s0169-409x(02)00174-6.Search in Google Scholar PubMed
54. Huppertz, B. The anatomy of the normal placenta. J Clin Pathol 2008; 61: 1296. https://doi.org/10.1136/jcp.2008.055277.Search in Google Scholar PubMed
55. Helms, HC, Abbott, NJ, Burek, M, Cecchelli, R, Couraud, PO, Deli, MA, et al. In vitro models of the blood–brain barrier: an overview of commonly used brain endothelial cell culture models and guidelines for their use. J Cerebral Blood Flow Metab 2016; 36: 862. https://doi.org/10.1177/0271678x16630991.Search in Google Scholar
56. Pardridge, WM, Yang, J, Eisenberg, J, Tourtellotte, WW. Isolation of intact capillaries and capillary plasma membranes from frozen human brain. J Neurosci Res 1987; 18: 352. https://doi.org/10.1002/jnr.490180213.Search in Google Scholar PubMed
57. Deli, MA, Ábrahám, CS, Kataoka, Y, Niwa, M. Permeability studies on in vitro blood–brain barrier models: physiology, pathology, and pharmacology. Cell Mol Neurobiol 2005; 25: 59. https://doi.org/10.1007/s10571-004-1377-8.Search in Google Scholar PubMed
58. Wilhelm, I, Krizbai, IA. Vitro models of the blood–brain barrier for the study of drug delivery to the brain. Mol Pharm 2014; 11: 1949. https://doi.org/10.1021/mp500046f.Search in Google Scholar PubMed
59. Eigenmann, DE, Xue, G, Kim, KS, Moses, AV, Hamburger, M, Oufir, M. Comparative study of four immortalized human brain capillary endothelial cell lines, hCMEC/D3, hBMEC, TY10, and BB19, and optimization of culture conditions, for an in vitro blood–brain barrier model for drug permeability studies. Fluids Barr CNS 2013; 10: 33. https://doi.org/10.1186/2045-8118-10-33.Search in Google Scholar PubMed PubMed Central
60. Siddharthan, V, Kim, YV, Liu, S, Kim, KS. Human astrocytes/astrocyte-conditioned medium and shear stress enhance the barrier properties of human brain microvascular endothelial cells. Brain Res 2007; 1147: 39. https://doi.org/10.1016/j.brainres.2007.02.029.Search in Google Scholar PubMed PubMed Central
61. Wick, P, Grafmueller, S, Petri-Fink, A, Rothen-Rutishauser, B. Advanced human in vitro models to assess metal oxide nanoparticle–cell interactions. MRS Bull 2014; 39: 984. https://doi.org/10.1557/mrs.2014.219.Search in Google Scholar
62. Panigel, M. Past, present, and future of placental perfusion experiments. Contrib Gynecol Obstet 1985; 13: 132. https://doi.org/10.1159/000410681.Search in Google Scholar
63. Hutson, JR, Garcia-Bournissen, F, Davis, A, Koren, G. The human placental perfusion model: a systematic review and development of a model to predict in vivo transfer of therapeutic drugs. Clin Pharmacol Ther 2011; 90: 67. https://doi.org/10.1038/clpt.2011.66.Search in Google Scholar PubMed
64. Braakhuis, HM, Kloet, SK, Kezic, S, Kuper, F, Park, MV, Bellmann, S, van der Zande, M, Le Gac, S, Krystek, P, Peters, RJ, Rietjens, IM, Bouwmeester, H. Progress and future of in vitro models to study translocation of nanoparticles. Arch Toxicol 2015; 89: 1469. https://doi.org/10.1007/s00204-015-1518-5.Search in Google Scholar PubMed PubMed Central
65. Cartwright, L, Poulsen, MS, Nielsen, HM, Pojana, G, Knudsen, LE, Saunders, M, et al. In vitro placental model optimization for nanoparticle transport studies. Int J Nanomed 2012; 7: 497. https://doi.org/10.2147/IJN.S26601.Search in Google Scholar PubMed PubMed Central
66. Ali, H, Kalashnikova, I, White, MA, Sherman, M, Rytting, E. Preparation, characterization, and transport of dexamethasone-loaded polymeric nanoparticles across a human placental in vitro model. Int J Pharm 2013; 454: 149. https://doi.org/10.1016/j.ijpharm.2013.07.010.Search in Google Scholar PubMed PubMed Central
67. Poulsen, MS, Mose, T, Maroun, LL, Mathiesen, L, Knudsen, LE, Rytting, E. Kinetics of silica nanoparticles in the human placenta. Nanotoxicology 2015; 9: 79. https://doi.org/10.3109/17435390.2013.812259.Search in Google Scholar PubMed PubMed Central
68. Kloet, SK, Walczak, AP, Louisse, J, van den Berg, HH, Bouwmeester, H, Tromp, P, et al. Translocation of positively and negatively charged polystyrene nanoparticles in an in vitro placental model. Toxicol In Vitro 2015; 29: 1701. https://doi.org/10.1016/j.tiv.2015.07.003.Search in Google Scholar PubMed
69. Li, H, van Ravenswaay, B, Rietjens, IM, Louisse, J. Assessment of an in vitro transport model using BeWo b30 cells to predict placental transfer of compounds. Arch Toxicol 2013; 87: 1661. https://doi.org/10.1007/s00204-013-1074-9.Search in Google Scholar PubMed
70. Heaton, SJ, Eady, JJ, Parker, ML, Gotts, KL, Dainty, JR, Fairweather-Tait, SJ, et al. The use of BeWo cells as an in vitro model for placental iron transport. Am J Physiol Cell Physiol 2008; 295: C1445. https://doi.org/10.1152/ajpcell.00286.2008.Search in Google Scholar PubMed PubMed Central
71. van der Ende, A, Du Maine, A, Simmons, CF, Schwartz, AL, Strous, GJ. Iron metabolism in BeWo chorion carcinoma cells. Transferrin-mediated uptake and release of iron. J Biol Chem 1987; 262: 8910.10.1016/S0021-9258(18)47501-1Search in Google Scholar
72. Mahmoudi, M, Laurent, S, Shokrgozar, MA, Hosseinkhani, M. Toxicity evaluations of superparamagnetic iron oxide nanoparticles: cell “vision” versus physicochemical properties of nanoparticles. ACS Nano 2011; 5: 7263. https://doi.org/10.1021/nn2021088.Search in Google Scholar PubMed
73. Fischer, D, Li, Y, Ahlemeyer, B, Krieglstein, J, Kissel, T. In vitro cytotoxicity testing of polycations: influence of polymer structure on cell viability and hemolysis. Biomaterials 2003; 24: 1121. https://doi.org/10.1016/s0142-9612(02)00445-3.Search in Google Scholar PubMed
74. Marano, F, Hussain, S, Rodrigues-Lima, F, Baeza-Squiban, A, Boland, S. Nanoparticles: molecular targets and cell signaling. Arch Toxicol 2011; 85: 733. https://doi.org/10.1007/s00204-010-0546-4.Search in Google Scholar PubMed
75. Hong, S, Leroueil, PR, Janus, EK, Peters, JL, Kober, MM, Islam, MT, et al. Interaction of polycationic polymers with supported lipid bilayers and cells: nanoscale hole formation and enhanced membrane permeability. Bioconj Chem 2006; 17: 728. https://doi.org/10.1021/bc060077y.Search in Google Scholar PubMed
76. Verma, A, Stellacci, F. Effect of surface properties on nanoparticle– cell interactions. Small 2010; 6: 12. https://doi.org/10.1002/smll.200901158.Search in Google Scholar PubMed
77. Villanueva, A, Cañete, M, Roca, AG, Calero, M, Veintemillas-Verdaguer, S, Serna, CJ. The influence of surface functionalization on the enhanced internalization of magnetic nanoparticles in cancer cells. Nanotechnology 2009; 20: 115103. https://doi.org/10.1088/0957-4484/20/11/115103.Search in Google Scholar PubMed
78. Ghinea, N, Simionescu, N. Anionized and cationized hemeundecapeptides as probes for cell surface charge and permeability studies: differentiated labeling of endothelial plasmalemmal vesicles. J Cell Biol 1985; 100: 606. https://doi.org/10.1083/jcb.100.2.606.Search in Google Scholar PubMed PubMed Central
79. Sajid, M, Ilyas, M, Basheer, C, Tariq, M, Daud, M, Baig, N, Shehzad, F. Impact of nanoparticles on human and environment: review of toxicity factors, exposures, control strategies, and future prospects. Env Sci Poll Res 2015; 22: 4122. https://doi.org/10.1007/s11356-014-3994-1.Search in Google Scholar PubMed
80. Treuel, L, Jiang, X, Nienhaus, GU. New views on cellular uptake and trafficking of manufactured nanoparticles. J R Soc Interface 2013; 10: 20120939. https://doi.org/10.1098/rsif.2012.0939.Search in Google Scholar PubMed PubMed Central
81. Hoet, PH, Brüske-Hohlfeld, I, Salata, OV. Nanoparticles –known and unknown health risks. J Nanobiotech 2004; 2: 12. https://doi.org/10.1186/1477-3155-2-12.Search in Google Scholar PubMed PubMed Central
82. Shi, J, Kantoff, PW, Wooster, R, Farokhzad, OC. Cancer nanomedicine: progress, challenges and opportunities. Nat Rev Cancer 2017; 17: 20. https://doi.org/10.1038/nrc.2016.108.Search in Google Scholar PubMed PubMed Central
83. Kiessling, F, Mertens, ME, Grimm, J, Lammers, T. Nanoparticles for imaging: top or flop?. Radiology 2014; 273: 10. https://doi.org/10.1148/radiol.14131520.Search in Google Scholar PubMed PubMed Central
84. Canton, I, Battaglia, G. Endocytosis at the nanoscale. Chem Soc Rev 2012; 41: 2718. https://doi.org/10.1039/c2cs15309b.Search in Google Scholar PubMed
85. Aderem, A, Underhill, DM. Mechanisms of phagocytosis in macrophages. Annu Rev Immunol 1999; 17: 593. https://doi.org/10.1146/annurev.immunol.17.1.593.Search in Google Scholar PubMed
86. Kettiger, H, Schipanski, A, Wick, P, Huwyler, J. Engineered nanomaterial uptake and tissue distribution: from cell to organism. Int J Nanomed 2013; 8: 3255. https://doi.org/10.2147/IJN.S49770.Search in Google Scholar PubMed PubMed Central
87. Alberts, B, Johnson, A, Lewis, J, Raff, M, Roberts, K, Walter, P. Molecular biology of the cell, 5th ed., Garland Sciences; 2007: 789–99.Chapter 13.10.1201/9780203833445Search in Google Scholar
88. Schauer, R. Sialic acids and their role as biological masks. Trend Biochem Sci 1985; 10: 357. https://doi.org/10.1016/0968-0004(85)90112-4.Search in Google Scholar
89. Yeung, T, Gilbert, GE, Shi, J, Silvius, J, Kapus, A, Grinstein, S. Membrane phosphatidylserine regulates surface charge and protein localization. Science 2008; 319: 210. https://doi.org/10.1126/science.1152066.Search in Google Scholar PubMed
90. Conner, SD, Schmid, SL. Regulated portals of entry into the cell. Nature 2003; 422: 37. https://doi.org/10.1038/nature01451.Search in Google Scholar PubMed
91. Bohmer, N, Jordan, A. Caveolin-1 and CDC42 mediated endocytosis of silica-coated iron oxide nanoparticles in HeLa cells. Beilstein J Nanotechnol 2015; 6: 167. https://doi.org/10.3762/bjnano.6.16.Search in Google Scholar PubMed PubMed Central
92. Hillaireau, H, Couvreur, P. Nanocarriers’ entry into the cell: relevance to drug delivery. Cell Mol Life Sci 2009; 66: 2873. https://doi.org/10.1007/s00018-009-0053-z.Search in Google Scholar PubMed
93. Iversen, TG, Skotland, T, Sandvig, K. Endocytosis and intracellular transport of nanoparticles: present knowledge and need for future studies. Nano Today 2011; 6: 176. https://doi.org/10.1016/j.nantod.2011.02.003.Search in Google Scholar
94. Jiang, X, Musyanovych, A, Rocker, C, Landfester, K, Mailänder, V, Nienhaus, GU. Specific effects of surface carboxyl groups on anionic polystyrene particles in their interactions with mesenchymal stem cells. Nanoscale 2011; 3: 2028. https://doi.org/10.1039/c0nr00944j.Search in Google Scholar PubMed
95. Sahay, G, Alakhova, DY, Kabanov, AV. Endocytosis of nanomedicines. J Contr Rel 2010; 145: 182. https://doi.org/10.1016/j.jconrel.2010.01.036.Search in Google Scholar PubMed PubMed Central
96. Sandin, P, Fitzpatrick, LW, Simpson, JC, Dawson, KA. High-speed imaging of rab family small GTPases reveals rare events in nanoparticle trafficking in living cells. ACS Nano 2012; 6: 1513. https://doi.org/10.1021/nn204448x.Search in Google Scholar PubMed
97. Guo, S, Huang, L. Nanoparticles escaping RES and endosome: challenges for siRNA Delivery for cancer therapy. J Nanomater 2011; 11: 1. https://doi.org/10.1155/2011/742895.Search in Google Scholar
98. Oh, N, Park, JH. Endocytosis and exocytosis of nanoparticles in mammalian cells. Int J Nanomed 2014; 9: 51. https://doi.org/10.1016/j.biomaterials.2004.07.050.Search in Google Scholar PubMed
99. Win, KY, Feng, SS. Effects of particle size and surface coating on cellular uptake of polymeric nanoparticles for oral delivery of anticancer drugs. Biomaterials 2005; 26: 2713.10.1016/j.biomaterials.2004.07.050Search in Google Scholar
100. Stins, MF, Badger, J, Kim, KS. Bacterial invasion and transcytosis in transfected human brain microvascular endothelial cells. Microb Pathog 2001; 30: 19. https://doi.org/10.1006/mpat.2000.0406.Search in Google Scholar PubMed
101. Pattillo, RA, Gey, GO. The establishment of a cell line of human hormone-synthesizing trophoblastic cells in vitro. Cancer Res 1968; 28: 1231.Search in Google Scholar
102. Schiera, G, Bono, E, Raffa, MP, Gallo, A, Pitarresi, GL, Di Liegro, I, Savettieri, G. Synergistic effects of neurons and astrocytes on the differentiation of brain capillary endothelial cells in culture. J Cell Mol Med 2003; 7: 165. https://doi.org/10.1111/j.1582-4934.2003.tb00215.x.Search in Google Scholar PubMed PubMed Central
103. Xue, Q, Liu, Y, Qi, H, Ma, Q, Xu, L, Chen, W, et al. A novel brain neurovascular unit model with neurons, astrocytes and microvascular endothelial cells of rat. Int J Biol Sci 2013; 9: 174. https://doi.org/10.7150/ijbs.5115.Search in Google Scholar PubMed PubMed Central
104. Raasch, M, Rennert, K, Jahn, T, Gärtner, C, Schönfelder, G, Huber, O. An integrative microfluidically supported in vitro model of an endothelial barrier combined with cortical spheroids simulates effects of neuroinflammation in neocortex development. Biomicrofluidics 2016; 10: 044102. https://doi.org/10.1063/1.4955184.Search in Google Scholar PubMed PubMed Central
105. Kaya, M, Ahishali, B. Assessment of permeability in barrier type of endothelium in brain using tracers: evans blue, sodium fluorescein, and horseradish peroxidase. Totowa, NJ: Humana Press; 2011, 369–82.10.1007/978-1-61779-191-8_25Search in Google Scholar PubMed
106. Audus, KL, Borchardt, RT. Characterization of an in vitro blood–brain barrier model system for studying drug transport and metabolism. Pharm Res 1986; 3: 81. https://doi.org/10.1023/a:1016337202335.10.1023/A:1016337202335Search in Google Scholar PubMed
107. Schlorf, T, Meincke, M, Kossel, E, Glüer, CC, Jansen, O, Mentlein, R. Biological properties of iron oxide nanoparticles for cellular and molecular magnetic resonance imaging. Int J Mol Sci 2011; 12: 12. https://doi.org/10.3390/ijms12010012.Search in Google Scholar PubMed PubMed Central
108. Otsu, N. A threshold selection method from gray-level histograms. IEEE Trans Syst Man Cybern 1979; 9: 62. https://doi.org/10.1109/tsmc.1979.4310076.Search in Google Scholar
109. Leach, L, Lammiman, MJ, Babawale, MO, Hobson, SA, Bromilou, B, Lovat, S, Simmonds, MJ. Molecular organization of tight and adherens junctions in the human placental vascular tree. Placenta 2000; 21: 547. https://doi.org/10.1053/plac.2000.0541.Search in Google Scholar PubMed
110. Gottardi, CJ, Arpin, M, Fanning, AS, Louvard, D. The junction-associated protein, zonula occludens-1, localizes to the nucleus before the maturation and during the remodeling of cell–cell contacts. Proc Natl Acad Sci USA 1996; 93: 10779. https://doi.org/10.1073/pnas.93.20.10779.Search in Google Scholar PubMed PubMed Central
111. Poller, WC, Löwa, N, Wiekhorst, F, Taupitz, M, Wagner, S, Möller, K, et al. Magnetic particle spectroscopy reveals Dynamic changes in the magnetic behavior of very small superparamagnetic iron oxide nanoparticles During cellular uptake and enables Determination of cell-labeling efficacy. J Biomed Nanotechnol 2016; 12: 337. https://doi.org/10.1166/jbn.2016.2204.Search in Google Scholar PubMed
112. Scharlach, C, Kratz, H, Wiekhorst, F, Warmuth, C, Schnorr, J, Genter, G, Ebert, M, et al. Synthesis of acid-stabilized iron oxide nanoparticles and comparison for targeting atherosclerotic plaques: evaluation by MRI, quantitative MPS, and TEM alternative to ambiguous Prussian blue iron staining. Nanomedicine NBM 2015; 11: 1085. https://doi.org/10.1016/j.nano.2015.01.002.Search in Google Scholar PubMed
113. Harms, C, Datwyler, AL, Wiekhorst, F, Trahms, L, Lindquist, R, Schellenberger, E, Mueller, S, et al. Certain types of iron oxide nanoparticles are not suited to passively target inflammatory cells that infiltrate the brain in response to stroke. J Cereb Blood Flow Metab 2013; 33: 1. https://doi.org/10.1038/jcbfm.2013.22.Search in Google Scholar PubMed PubMed Central
114. Löwa, N, Wiekhorst, F, Metzkow, S, Ludwig, A, Trahms, L. Magnetic particle spectroscopy for the quantification of magnetic nanoparticles in living cells. Biomed Tech (Berl) 2013;58. https://doi.org/10.1515/bmt-2013-4138.Search in Google Scholar PubMed
115. Gräfe, C, Slabu, I, Wiekhorst, F, Bergemann, C, von Eggeling, F, Hochhaus, A. Magnetic particle spectroscopy allows precise quantification of nanoparticles after passage through human brain microvascular endothelial cells. Phys Med Biol 2016; 61: 3986. https://doi.org/10.1088/0031-9155/61/11/3986.Search in Google Scholar PubMed
116. McNaught, AD, Wilkinson, A. Compendium of chemical terminology, 2nd ed. Oxford, UK: Blackwell Science; 1997.Search in Google Scholar
117. Dunnett, CW. A multiple comparison procedure for comparing several treatments with a control. J Am Stat Ass 1955; 50: 1096. https://doi.org/10.1080/01621459.1955.10501294.Search in Google Scholar
118. Dunnett, CW. New tables for multiple comparisons with a control. Biometrics 1964; 20: 482. https://doi.org/10.2307/2528490.Search in Google Scholar
119. Tukey, JW. Comparing individual means in the analysis of variance. Biometrics 1949; 5: 99. https://doi.org/10.2307/3001913.Search in Google Scholar
120. Sidak, Z. Rectangular confidence regions for the means of multivariate normal Distributions. J Am Stat Ass 1967; 62: 626. https://doi.org/10.2307/2283989.Search in Google Scholar
121. Thomsen, LB, Linemann, T, Pondman, KM, Lichota, J, Kim, KS, Pieters, RJ. Uptake and transport of superparamagnetic iron oxide nanoparticles through human brain capillary endothelial cells. ACS Chem Neurosci 2013; 4: 1352. https://doi.org/10.1021/cn400093z.Search in Google Scholar PubMed PubMed Central
122. Abbott, NJ, Dolman, DEM, Yusof, SR, Reichel, A. In vitro models of CNS barriers. New York, NY: Springer New York; 2014, 163–197.10.1007/978-1-4614-9105-7_6Search in Google Scholar
123. Grover, A, Hirani, A, Pathak, Y, Sutariya, V. Brain-targeted delivery of docetaxel by glutathione-coated nanoparticles for brain cancer. AAPS Pharm Sci Technol 2014; 15: 1562. https://doi.org/10.1208/s12249-014-0165-0.Search in Google Scholar PubMed PubMed Central
124. Tarbell, JM. Shear stress and the endothelial transport barrier. Cardiovasc Res 2010; 87: 320. https://doi.org/10.1093/cvr/cvq146.Search in Google Scholar PubMed PubMed Central
125. Cucullo, L, Hossain, M, Puvenna, V, Marchi, N, Janigro, D. The role of shear stress in blood–brain barrier endothelial physiology. BMC Neurosci 2011; 12: 40. https://doi.org/10.1186/1471-2202-12-40.Search in Google Scholar PubMed PubMed Central
126. Stanness, K, Guatteo, DJE. A dynamic model of the blood–brain barrier “in vitro”. Neurotoxicology 1996; 17: 481.Search in Google Scholar
127. Kong, SD, Lee, J, Ramachandran, S, Eliceiri, BP, Shubayev, VI, Lal, R, Jin, S. Magnetic targeting of nanoparticles across the intact blood–brain barrier. J Contr Rel 2012; 164: 49. https://doi.org/10.1016/j.jconrel.2012.09.021.Search in Google Scholar PubMed PubMed Central
128. The UniProt Consortium. UniProt: the universal protein knowledge-base. http://www.uniprot.org/help/publications [Accessed April 2017].Search in Google Scholar
129. Schlesinger, JB, van Harmelen, V, Alberti-Huber, CE, Hauner, H. Albumin inhibits adipogenesis and stimulates cytokine release from human adipocytes. Am J Physiol Cell Physiol 2006; 291: 27. https://doi.org/10.1152/ajpcell.00172.2005.Search in Google Scholar PubMed
130. Friedrich, RP, Janko, C, Poettler, M, Tripal, P, Zaloga, J, Cicha, I, et al. Flow cytometry for intracellular SPION quantification: specificity and sensitivity in comparison with spectroscopic methods. Int J Nanomed 2015; 10: 4185. https://doi.org/10.2147/ijn.s82714.Search in Google Scholar PubMed PubMed Central
131. Dusinska, M, Boland, S, Saunders, M, Juillerat-Jeanneret, L, Tran, L, Pojana, G, et al. Towards an alternative testing strategy for nanomaterials used in nanomedicine: lessons from NanoTEST. Nanotoxicology 2015; 9: 118. https://doi.org/10.3109/17435390.2014.991431.Search in Google Scholar PubMed
132. Gunn, J, Paranji, RK, Zhang, M. A simple and highly sensitive method for magnetic nanoparticle quantitation using 1H-NMR spectroscopy. Biophys J 2009; 97: 2640. https://doi.org/10.1016/j.bpj.2009.08.013.Search in Google Scholar PubMed PubMed Central
133. Müller, EK, Gräfe, C, Wiekhorst, F, Bergemann, C, Weidner, A, Dutz, S, Clement, JH. Magnetic nanoparticles interact and pass an in vitro co-culture blood-placenta barrier model. Nanomaterials 2018; 8: E108. https://doi.org/10.3390/nano8020108.Search in Google Scholar PubMed PubMed Central
134. Hong, S, Leroueil, PR, Janus, EK, Peters, JL, Kober, M-M, Is- lam, MT, et al. Interaction of Polycationic Polymers with Supported Lipid Bilayers and Cells: Nanoscale Hole Formation and Enhanced Membrane Permeability. Bioconjugate Chemistry 2006; 17: 728. https://doi.org/10.1021/bc060077y.Search in Google Scholar PubMed
135. Bähring, F, Schlenk, F, Wotschadlo, J, Buske, N, Liebert, T, Bergemann, C, et al. Suitability of viability assays for testing biological effects of coated superparamagnetic nanoparticles. IEEE Trans Magn 2013; 49: 383. https://doi.org/10.1109/tmag.2012.2222635.Search in Google Scholar
136. Kho, D, MacDonald, C, Johnson, R, Unsworth, CP, O’Carroll, SJ, Du Mez, E, et al. Application of xCELLigence RTCA biosensor technology for revealing the profile and window of drug responsiveness in real time. Biosensors 2015; 5: 199. https://doi.org/10.3390/bios5020199.Search in Google Scholar PubMed PubMed Central
137. Morley, LC, Beech, DJ, Walker, JJ, Simpson, NAB. Emerging concepts of shear stress in placental development and function. Mol Hum Reprod 2019; 25: 329. https://doi.org/10.1093/molehr/gaz018.Search in Google Scholar PubMed PubMed Central
138. James, JL, Cartwright, JE, Whitley, GS, Greenhill, DR, Hoppe, A. The regulation of trophoblast migration across endothelial cells by low shear stress: consequences for vascular remodelling in pregnancy. Cardiovasc Res 2012; 93: 152–61. https://doi.org/10.1093/cvr/cvr276.Search in Google Scholar PubMed
139. Dutz, S, Weidner, A, von der Lühe, M, Gräfe, C. Biehl, P, Demut, J, et al. Hybrid nanomaterials of biomolecule corona coated magnetic nanoparticles and their interaction with biological systems. Phys Sci Rev. accepted.10.1515/9783110569636-006Search in Google Scholar
140. Barnes, AL, Wassel, RA, Mondalek, F, Chen, K, Dormer, KJ, Kopke, RD. Magnetic characterization of superparamagnetic nanoparticles pulled through model membranes. Biomagn Res Technol 2007; 5: 1. https://doi.org/10.1186/1477-044x-5-1.Search in Google Scholar PubMed PubMed Central
141. Pedram, MZ, Shamloo, A, Alasty, A, Ghafar-Zadeh, E. Optimal magnetic field for crossing superparamagnetic nanoparticles through the brain blood barrier: a computational approach. Biosensors 2016; 6: 25. https://doi.org/10.3390/bios6020025.Search in Google Scholar PubMed PubMed Central
142. Shapiro, B, Dormer, K, Rutel, IB. A two-magnet system to push therapeutic nanoparticles. AIP Conf Proc 2010; 1311: 77–88. 10.1063/1.3530064Search in Google Scholar PubMed PubMed Central
© 2020 Christine Gräfe et al., published by De Gruyter, Berlin/Boston
This work is licensed under the Creative Commons Attribution-NonCommercial-NoDerivatives 4.0 International License.
Articles in the same Issue
- Frontmatter
- Reviews
- Symmetry aspects in the macroscopic dynamics of magnetorheological gels and general liquid crystalline magnetic elastomers
- Studies about the design of magnetic bionanocomposite
- Advanced cell culture techniques for cancer research
- Magnetic Hybrid-Materials (Odenbach)
- Magnetic hybrid materials interact with biological matrices
- Reviews
- Principles of radiation therapy
- Modeling and theoretical description of magnetic hybrid materials—bridging from meso- to macro-scales