Online detection of residual stress near the gate using cavity pressure for injection molding
-
Hao-Hsuan Tsou

 ,
Chung-Ching Huang
,
Chung-Ching Huang

Abstract
Residual stress negatively affects the quality of optical products and is a difficult problem to solve. Regulating process parameters is a critical element in quality control. Therefore, the online monitoring of critical process variables is necessary for stabilizing product quality and reducing manufacturing cost. This study proposes a method for the online monitoring of residual stress near the gate of a mold using multiple pressure sensors to measure process variables and verifies the feasibility of online monitoring. The study found that residual stress near the gate could not be accurately measured with only a single sensor because measurements were susceptible to interference with process parameters. When a single sensor was used to measure process variables, correlation coefficients of between 0.48 and 0.59 were obtained, and when multiple sensors were used, correlation coefficients of between 0.80 and 0.92 were obtained, which indicated strong correlation. Therefore, the online monitoring of residual stress near the gate is feasible. This monitoring method can provide a new concept of online monitoring technology for the injection molding of optical products.
1 Introduction
In the injection molding process, product quality is negatively affected if the residual stress is excessively high. The internal polarization characteristics of optical products change with the level of residual stress, and certain polarization can result in birefringence caused by different rates of light passing through products [1, 2], the cracking of finished products because of material and environmental factors [3], and warpage deformation of finished products because of the stress distribution in different areas of the products [4], [5], [6]. Residual stresses generally tend to be concentrated at the corners of finished products, areas with drastic thickness variation, and areas near the gates of molds. Residual stress is mainly caused by the long chain-like molecules of plastic materials, which become deformed because of shear stress, pressure, and shrinkage during the injection process. While a product gradually solidifies during the molding process, its molecules attempt to return to their original state, which results in the generation of a force inside the product. This force is called the residual stress. The residual stress occurring during the injection molding process is mainly divided into two categories: flow stress and heat stress [7], [8], [9]. During the filling stage of injection molding, the long chains of plastic molecules are stretched and aligned. This phenomenon is affected by the shearing effect when the molten plastic is flowing. The molecular chains in the skin layer of a finished product are subjected to compressive stress in the direction of the product’s thickness; however, the inner core layer is subjected to tensile stress. If overfilling and overpressing occur during the packing stage of the injection molding process, molecules are easily compressed, which results in the production of high stresses and large volume shrinkage differences in different areas of the finished product; thus, the resulting product’s quality is poor. Heat stress is mainly caused by an inconsistency in the cooling rates of the molten plastic skin and core layer during the cooling process. This inconsistency causes compression and tension stresses between the skin and core layers inside a product.
The residual stress of transparent parts, which are often examined using a polarizing strain gauge, is measured using a photoelasticimeter [10]. Nontransparent parts are often inspected after partial material removal (delamination and drilling) and chemical coating have been performed [11]. With the development of computer-aided simulation and analysis techniques, mold flow analysis programs have been employed for high-accuracy prediction of residual stress [12], [13], [14], [15], [16]. Optimization of residual stresses, modification of mold design, optimization of the production process, and annealing treatment are common responses. For example, the residual stress can be effectively reduced by optimizing the mold gate design to improve the flow of molten glue and by improving the water circuit design to make the cooling rates of finished products more consistent [17, 18]. Moreover, the optimization of process parameters through a Taguchi experiment can effectively reduce the amount of residual stress generated. The process parameters that strongly influence the residual stress are the melt temperature, injection time, packing time, and mold temperature [19, 20]. Annealing treatment can reduce the residual stresses in a finished product [21].
The injection molding process for optical products requires sophisticated optimization, such as strict control of the injection process and monitoring of the molding process. Various sensors are used to quantify the pressure, temperature, and deformation of a mold or an injection machine. Process variables are extracted using sensors and used for subsequent construction and optimization of the process window [22], [23], [24]. The main process variables in injection molding are the injection pressure, melt temperature, mold temperature, clamping force, and mold deformation [25]. Multiple pressure sensors can be installed on the mold surface to monitor pressure gradient changes during the holding stage of the injection molding process, and the timing of gate solidification can be predicted by comparing these gradient changes with the pressure–volume–temperature graph of the adopted material [26]. From the pressure curve changes at different positions and related characteristic indices, the warpage deformation of a product can be determined. The standard pressure curve of a product can be used as a molding reference for subsequent mass production of the product [27].
According to the aforementioned discussion, the residual stress generated during the injection molding process negatively affects product quality; therefore, monitoring and reducing this stress is crucial. Consequently, this study focused on the residual stress caused by injection molding near the gate. Pressure changes in the injection, packing, and cooling stages of the injection molding process were captured using pressure sensors at various locations in the mold. The residual stress near the gate was then measured using a photoelasticimeter. According to the measurement results obtained for the residual stress, the correlation between the process parameters and the process variables and the residual stresses was compared. Six process variables—namely the packing-stage pressure peak (PSPP), residual pressure before mold opening (RPMO), injection process pressure integral (IPPI), difference in the PSPP (DPSPP) between sensing points A and B, difference in the RPMO (DRPMO) between sensing points A and B, and difference in the IPPI (DIPPI) between sensing points A and B—were defined to determine process variables that are strongly correlated with the residual stress near the gate. The monitor feasibility of the identified process variables was verified through a small-batch production experiment. An interference experiment was conducted in which the simulated heater failure was used as an interference factor to test whether the screened height-related process variables reflected the residual stress changes and were subject to minimal disturbance.
2 Theoretical analysis and experimental methods
This study investigated the feasibility of using a cavity pressure curve to monitor the residual stress at the gate of a mold cavity for a flat product. Two pressure sensors were installed in the mold (including at the gate) for obtaining the pressure curve. Process variables were extracted, and the correlations between various indicators and the residual stress at the gate were investigated. The obtained results were then verified through small-batch production experiments.
2.1 Materials and procedures
In this study, amorphous polymethyl methacrylate (PMMA; CM-211, Chi Mei Corporation, Tainan City, Taiwan) with high transparency and light transmittance was used. The melting temperature of the PMMA was between 240 and 280 °C, and the mold temperature was 40–80 °C.
The experimental machine was a direct-pressure injection molding machine (Arburg Allrounder 320C, Germany) with a maximum clamping force of 60 tons and an oil-type mold heater with a controllable temperature range of 60–180 °C. The steps involved in this study were as follows:
Selection of the sensor type and specification
Design of a set of molds for flat products
Installation of pressure sensors and establishment of a monitoring system
Quantization of the characteristic values of process variables
Measurement of the residual stress at the mold gate
Evaluation of the relationships between the process variable and the residual stress near the mold gate
Performance of a small-batch production validation study.
2.2 Equipment and injection mold
In this study, a rectangular flat plate was used as the injection molding product. The product specifications and configuration of the flow channel system are shown in Figure 1A. Two pressure sensors (6001B, Priamus System Technologies AG, Schaffhausen, Switzerland) were installed inside the mold: one near the gate (sensor A), and one in the middle of the product (sensor B), as indicated in Figure 1B. These sensors measured the pressure changes in the mold cavity during the injection molding process in real time and transferred the measurements to a signal acquisition device (eDAQ 8102B, Priamus System Technologies AG, Schaffhausen, Switzerland) for signal amplification and filtering and then to a computer.

Product and injection mold design: (A) product design, (B) sensor installation locations in the injection mold.
2.3 Measurements
A photoelasticimeter (DIAS-1600, Strainoptics, North Wales, PA, USA) was used to measure retardation distribution. This instrument can measure a retardation distribution of 0–280 nm and this retardation distribution is used to indirectly represent the residual stress near the gate. Therefore, the aforementioned instrument was used to measure the maximum residual stress near the gate of a mold of a rectangular flat plate.
2.4 Characterization and analysis of the pressure–time curve
2.4.1 Description of the pressure–time curve
Figure 2 depicts the pressure–time curve for different mold positions and the change in the screw position with time; thus, it indicates the pressure changes during the entire injection molding process.

Curves of the variation in the cavity pressure with time at different sensing points.
Filling stage: With an increase in the quantity of molten plastic in the mold cavity during the filling process, the highest forming pressure occurred at the gate. The pressure loss in the mold gradually decreased with an increase in the distance from the gate. The created product had uniform 1-mm thickness; therefore, the slope of the pressure curve in the two areas of the mold cavity where the sensors are installed will be approximately the same.
Packing stage: In the packing stage, the melt had not yet filled up the mold cavity. Moreover, the melt in the cavity was compressed because of a rapid increase in pressure, and the pressure in the mold reached its peak value. When the pressure inside the mold reached its peak value, the molten plastic in the mold cavity could not be further compressed; however, the pressure was still increased until the gate had solidified to prevent the backflow problem.
Cooling stage: As the melt temperature decreased, the pressure inside the mold cavity gradually decreased because of the influence of melt solidification; however, residual pressure rarely existed before the mold was opened, mainly because the mold cavity was under excessive pressure, which caused deformation of the template; therefore, during the shrinkage of the product, the template will also spring back with it, resulting in the residual pressure before opening the mold.
2.4.2 Defining the process variables of the cavity pressure curve
To investigate the relationships between the process variables for injection molding and the residual stress at the gate, this study captured the process variables by using cavity pressure sensors and defined related indices to evaluate the residual stress at the gate. The process variables were captured using single and composite sensors. The indicators captured using single sensors were the PSPP, RPMO, and IPPI (Figure 3A). Composite sensors were used to capture the DPSPP between sensing points A and B, DRPMO between sensing points A and B, and DIPPI between sensing points A and B (Figure 3B). The definitions of the aforementioned variables are provided in the following text.
PSPP: Usually, when the injection molding process enters the packing stage, molten plastic has not yet filled the entire mold cavity. In this stage, molten plastic fills the mold cavity and is gradually compressed under pressure. At this time, the pressure inside the mold cavity increases sharply, and the pressure peaks.
RPMO: During the injection molding process, the mold is deformed, which results in excessive molten plastic being injected. Although the mold deformation gradually reverses with the shrinkage of the plastic, the mold does not return to its original state until the mold is opened. Therefore, high residual pressure exists in the mold before mold opening, and the higher the residual pressure before mold opening, the more severe is the overfilling of the mold cavities.
IPPI: By integrating the cavity pressure curve over time during the injection process, the overall pressure curve integral can be obtained. Injection molding usually involves using packing pressure to compensate for and control dimensional shrinkage. The longer the duration for which cavity pressure exists, the less is the volume shrinkage; therefore, the overall area under the pressure curve represents the shrinkage state of melted plastic in the cavity and indirectly represents the quantity of melted plastic filling the area around a sensing point.
DPSPP between sensing points A and B: The pressure peak in the packing stage represents the state of compression of the melted plastic in the cavity. With a suitable molding window, it can indirectly represent the degree of compensation for the shrinkage of the molten plastic. Therefore, the difference in pressure peaks between sensing points A and B near the gate should represent the difference in the degree of shrinkage compensation between these points.
DRPMO between sensing points A and B: During the filling and packing stages, the pressure loss caused by an increased flow length results in pressure gradients at the gate and filling end of the mold. These gradients are higher for molds with thinner walls, possibly because of localized shrinkage differences, which result in internal residual stress and warpage deformation. Mold deformation often results in high residual pressure before mold opening. The residual stress usually occurs at the gate; therefore, in this study, the effect on the residual stress at the gate was investigated by quantifying the DRPMO between sensing points A and B.
DIPPI between sensing points A and B: The aforementioned discussion indicates that the pressure curve integral represents the shrinkage state of the melt at different points, and in general, regional shrinkage differences may lead to residual stresses and warpage deformation. Therefore, the DIPPI between sensing points A and B represents the difference in shrinkage between these points. The suitability of this process variables for monitoring the residual stress near the gate was examined in this study.

Characteristic definition of the cavity pressure curve: (A) variables processed using single sensors and (B) variables processed using multiple sensors.
2.4.3 Correlation coefficient
In this study, Pearson correlation coefficients were used to analyze the correlations between the process variables, and the residual stress. The Pearson correlation coefficient r was used to evaluate the degree of linear dependence between two variables. The parameter r is calculated using Equation (1), where x and y are process variables and, residual stress. If r = 1, the correlation is perfectly positive; that is, as the independent variable x increases, the dependent variable y also increases. Conversely, r = −1 indicates that y decreases as x increases. Finally, if r = 0, changes in x do not cause changes in y. According to related studies, r values of ≤0.3, between 0.3 and 0.7, and >0.7 indicate weak correlation, moderate correlation, and strong correlation, respectively.
2.5 Experimental design and procedure
2.5.1 Single-factor experimental design
A single-factor experimental design was developed to investigate the effect of cavity pressure on the residual stress near the gate. The effects of process variables on the residual stress near the gate were investigated by varying five process parameters: the melt temperature, mold temperature, injection speed, packing pressure, and packing time. The process variables suitable for monitoring product quality were identified through correlation analysis. The experimental design is presented in Table 1.
Single-factor experimental design.
| Experiment no. | Injection process parameters | ||||
|---|---|---|---|---|---|
| Packing pressure (bar) | Packing time (s) | Melt temperature (°C) | Mold temperature (°C) | Injection speed (mm/s) | |
| Ref. | 600 | 5 | 250 | 60 | 60 |
| 1 | 400 | 5 | 250 | 60 | 60 |
| 2 | 500 | 5 | 250 | 60 | 60 |
| 3 | 700 | 5 | 250 | 60 | 60 |
| 4 | 800 | 5 | 250 | 60 | 60 |
| 5 | 600 | 3 | 250 | 60 | 60 |
| 6 | 600 | 2 | 250 | 60 | 60 |
| 7 | 600 | 1 | 250 | 60 | 60 |
| 8 | 600 | 5 | 240 | 60 | 60 |
| 9 | 600 | 5 | 260 | 60 | 60 |
| 10 | 600 | 5 | 250 | 70 | 60 |
| 11 | 600 | 5 | 250 | 80 | 60 |
| 12 | 600 | 5 | 250 | 60 | 40 |
| 13 | 600 | 5 | 250 | 60 | 80 |
2.5.2 Small-batch and interference experiments
This study examined the feasibility of applying the process variables identified through single-factor experimental screening to online monitoring of the residual stress near mold gates in 110 cycle, small-batch production. The designed plan involved interfering with small-batch production by creating abnormal failures in a heater after 40 cycles of normal production and then returning to normal production to examine whether the process variation indicators had the same trend as product quality. Indicators with the same trend as product quality were deemed feasible for the aforementioned monitoring. Finally, a process variable indicator was defined on the basis of the experimental results for online monitoring of the residual stress at the gate, as presented in Table 2.
Design of the small-batch production experiment.
| Experiment no. | Injection process parameters | Simulation fault parameters | Number of production | ||||
|---|---|---|---|---|---|---|---|
| Packing pressure (bar) | Packing time (s) | Mold temperature (°C) | Injection speed (mm/s) | Melt temperature (°C) | Status | ||
| 1 | 600 | 5 | 60 | 60 | 250 | Normal | 40 |
| 2 | 600 | 5 | 60 | 60 | 240 | Heater abnormal | 30 |
| 3 | 600 | 5 | 60 | 60 | 250 | Normal | 40 |
3 Results and discussion
3.1 Effects of the process parameters on the process variable indicators and residual stress near the gate
The effects of the process parameters on the process variables and residual stress at the gate were investigated. In injection molding, residual stress can be caused by the asymmetric heat stress produced because of factors such as uneven cooling, local shrinkage differences, and molecular orientation. In this study, residual stress was quantified using the photoelasticity, which depends on the optical range difference, as shown in Figure 4A. The variation in the optical range difference with the process parameters represents the variation in the residual stress with these parameters, and the maximum optical range difference near the gate is quantified as the residual stress near the gate. The effects of various process parameters on the residual stress near the gate are explained in the following text.
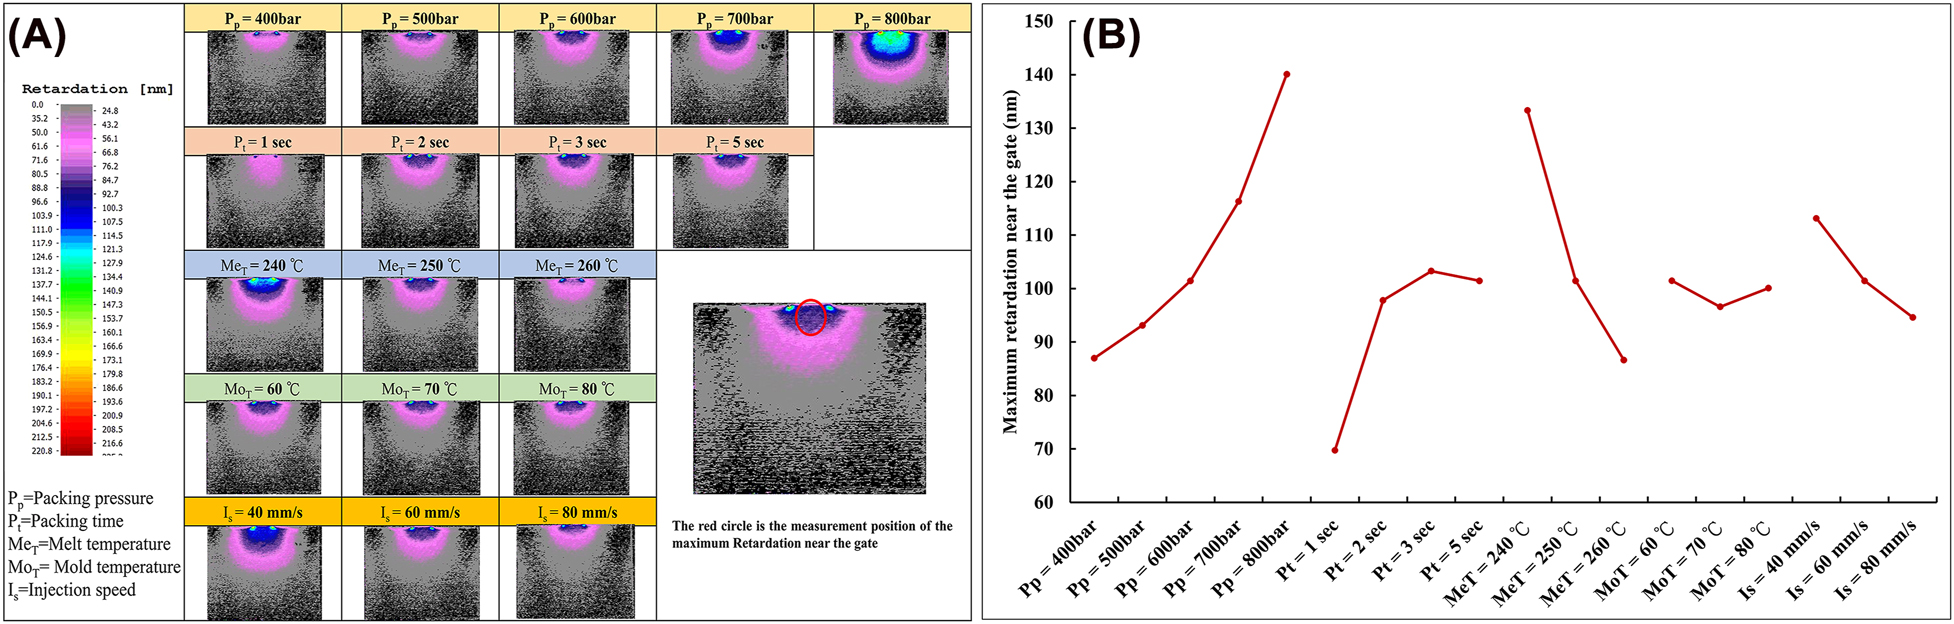
Effects of the process parameters on the (A) retardation distribution and (B) residual stress near the gate.
3.1.1 Effect of the packing pressure on the residual stress near the gate
As illustrated in Figure 4B, among the process parameters that affected the residual stress near the gate, the packing pressure had the strongest effect. When the packing pressure was increased from 400 to 800 bar, the residual stress near the gate increased from 87 to 140 nm because in the mid to late stage of the packing stage, the melted plastic at the middle and end of the product solidified. Therefore, transferring pressure from the gate to the middle and end of the product was difficult. Consequently, when the packing pressure was increased, the cavity pressure near the gate increased considerably and lasted for longer. For the aforementioned reasons, the DPSPP, DRPMO, and DIPPI between sensing points A and B increased with an increase in the packing pressure (Figure 5D–F).

Effects of the process parameters on the process variable indicators: (A) PSPP, (B) RPMO, (C) IPPI, (D) DPSPP between sensing points A and B, (E) DRPMO between sensing points A and B, and (E) DIPPI between sensing points A and B.
3.1.2 Effect of the packing time on the residual stress near the gate
As illustrated in Figure 4B, when the packing time was sufficient, it had a weak effect on the residual stress near the gate. However, when the packing time was insufficient (1 s), melted plastic was removed from the gate because of its backflow, which resulted in reductions in the cavity pressure near the gate and the local shrinkage difference. These reductions caused a decrease in the residual stress near the gate. When the DRPMO and DIPPI between sensing points A and B decreased considerably, the molecules previously under rapid compression expanded, and the residual stress near the gate decreased to 70 nm (Figure 5E and F).
3.1.3 Effect of the melt temperature on the residual stress near the gate
As shown in Figure 4B, when the melt temperature was increased from 240 to 260 °C, the residual stress near the gate decreased by approximately 46 nm. When the melt temperature was increased, the melt flow effectively increased, and the loss of cavity pressure during the filling and packing stages decreased; thus, the overall cavity pressure became more uniform, and the highly aligned molecular chains had more time to expand. Consequently, the residual stress decreased, and the PSPP, RPMO, and IPPI improved, as illustrated in Figure 5A–C. When the melt temperature was increased, the DPSPP between sensing points A and B decreased; thus, the melt was subjected to the same compression state in both areas, and the shrinkage difference was small, which effectively reduced the residual stress at the gate, as depicted in Figure 5D. Similar trends were observed for the DRPMO and DIPPI between sensing points A and B (Figure 5E and F).
3.1.4 Effect of the mold temperature on the residual stress near the gate
As shown in Figure 4B, when the mold temperature was increased, the residual stress near the gate did not change considerably, mainly because the increase in the mold temperature reduced the pressure loss during the filling and packing stages but only marginally increased the overall cavity pressure. As displayed in Figure 5, the mold temperature had weaker effects on the process variables than did the other process parameters. A weak correlation existed between the mold temperature and residual stress near the gate.
3.1.5 Effect of the injection speed on the residual stress near the gate
As shown in Figure 4B, when the injection speed was increased from 40 to 80 mm/s, the residual stress near the gate decreased by approximately 19 nm. When the injection speed was increased, the friction between the melted plastic and mold wall increased, which resulted in shear heating. Although the molecular alignment effect strengthened with an increase in the injection speed, the temperature of the melted plastic increased because of shear heating, and the melted plastic in the mold cavity had more time to expand. Therefore, the residual stress near the gate tended to decrease, and the PSPP, RPMO, and IPPI increased, as depicted in Figure 5A–C. When the injection speed was increased, because of shear heat generation, the solid layer produced by the melted plastic in the packing stage became thinner, and the overall temperature increased. Therefore, the pressure in each area of the product was better transmitted, and the pressure inside the mold was more uniform. Consequently, the DPSPP, DRPMO, and DIPPI between sensing points A and B decreased, which represented decreased shrinkage difference between these points and resulted in a decrease in the residual stress near the gate (Figure 5D–F).
In summary, the order of process parameters in terms of the strength of their effects on the residual stress near the gate was as follows: packing pressure > melt temperature > injection speed. According to the Pearson correlation coefficients in Section 2.4.3, the correlation between the process variables and the residual stresses is calculated. When the residual stress near the gate was monitored using a single pressure sensor, the measurements were susceptible to external interference and errors, as shown in Figures 4B and 5A. When the packing pressure increases, the residual stress and PSPP near the gate increase. However, when the melt temperature increases, the PSPP increases but the residual stress near the gate decreases. Therefore, the correlation between a process variable measured using a single pressure sensor and the residual stress near the gate is 0.48–0.59 because of the interference of variables such as the melt temperature and injection speed (Figure 6A–C).

Analysis of the correlations between the process variables and residual stress near the gate: analysis of the correlations of this residual stress with the (A) PSPP, (B) RPMO, (C) IPPI, (D) DPSPP between sensing points A and B, (E) DRPMO between sensing points A and B, and (F) DIPPI between sensing points A and B.
Therefore, the results of this study indicate that to monitor the residual stress near the gate, the difference in measurements between two pressure sensors (A and B) near the gate should be used; that is, the DPSPP, DRPMO, and DIPPI between sensing points A and B should be adopted for monitoring the aforementioned stress. The trends of these three variables with the residual stress near the gate were discovered to have similarities when the process parameters were varied, as shown in Figures 4B and 5D–F. The aforementioned indicators exhibited strong correlations (above 0.8) with the residual stress near the gate (Figure 6D–F); thus, they should be used to monitor this residual stress. Small-batch production was conducted to further validate the feasibility of using the aforementioned three indicators to monitor the residual stress near the gate.
3.2 Results of the small-batch production and interference experiments
The results of 110-mode, small-batch production were examined in this study. The adopted process involved conducting 40-mode stable production with the same process parameters and then simulating abnormal failure conditions in the heater power to reduce the melt temperature. This process was conducted to verify the feasibility of using the DPSPP, DRPMO, and DIPPI between sensing points A and B for monitoring the residual stress near the mold gate.
As displayed in Figure 7A–D, for the experimental group of simulate heater failure, the DPSPP, DRPMO, and DIPPI between sensing points A and B corresponded to the residual stress near the gate. When the heater failed, the melt temperature decreased, which resulted in the instability of the melt. Therefore, the melted plastic was less likely to transfer pressure in the mold cavity and had poor fluidity, which made it relatively likely that short shot would occur during production. In this case, the RPMO at sensing point B, which was farther from the gate than was sensing point A, caused large pressure fluctuations because of the instability of the melt (Figure 8). Consequently, the DRPMO between sensing points A and B fluctuated excessively, which reduced the accuracy of the residual stress monitoring at the gate. The DPSPP between sensing points A and B exhibited a similar trend to the residual stress near the gate in small-batch production. However, when the packing time was insufficient, the relevant correlation coefficients were lower (Figure 6D), which indicated that the DPSPP between sensing points A and B was susceptible to interference effects by the process parameters; thus, the stability of residual stress monitoring was negatively affected. In summary, the DIPPI between sensing points A and B is a more stable indicator than are the DPSPP and DRPMO between these sensing points for the online monitoring of the residual stress near the gate because among these indicators, the DIPPI is the least affected by external interference and represents the local shrinkage difference between two sensing points.

Results obtained in small-batch production (residual stress near the gate): (A) variation in the maximum retardation distribution at the gate with the cycle number, (B) variation in the DPSPP between sensing points A and B with the cycle number, (C) variation in the DRPMO between sensing points A and B with the cycle number, and (D) variation in the DIPPI between sensing points A and B with the cycle number.

Cavity pressure curves for sensing point B (cycle numbers 51–62).
4 Conclusions
In this study, a method for the online monitoring of residual stress near the gate of rectangular, flat products was formulated and its effect on cavity pressure was determined.
The experimental results indicated that the most to least influential process parameters on residual stress are packing pressure, melt temperature, injection speed, packing time, and mold temperature.
The study found that measurements from a single sensor were less accurate than measurements from multiple sensors, because sensors are susceptible to external interference and errors. The correlation between residual stress and process variables measured by a single sensor was only moderate, with Pearson correlation coefficients of between 0.48 and 0.59. The DPSPP, DRPMO, and DIPPI between sensing points A and B and residual stress near the gate exhibited strong correlations, with Pearson correlation coefficients of between 0.80 and 0.92. Therefore, using multiple sensors is suitable for online monitoring of residual stress near the gate.
According to the results from small-batch production experiments, among the aforementioned indicators, the DIPPI between sensing points A and B is the most resistant to external interferences.
In summary, this study developed an online monitoring method that is useful for the injection molding of optical parts. Preliminary results show that the method is effective in monitoring changes in residual stress. The study has implications for subsequent developments in quality control and online monitoring techniques for optical products.
-
Author contributions: All the authors have accepted responsibility for the entire content of this submitted manuscript and approved submission.
-
Research funding: None declared.
-
Conflict of interest statement: The authors declare no conflicts of interest regarding this article.
References
1. Chang, Y. R., Chiu, H. S., Yang, W. H., Chang, R. Y. A novel approach for predicting birefringence of optical parts. In SPE ANTEC Proceedings, 2007, Vol. 4; pp. 2490–2493.Search in Google Scholar
2. Tagaya, A. Birefringence of polymer. In Encyclopedia of Polymeric Nanomaterials; Kobayashi, S., Müllen, K., Eds.; Springer-Verlag: Berlin, Heidelberg, 2013; pp. 1–6.10.1007/978-3-642-36199-9_116-1Search in Google Scholar
3. Mandell, J. F., Smith, K. L., Huang, D. D. Effects of residual stress and orientation on the fatigue of injection molded polysulfone. Polym. Eng. Sci. 1981, 21, 1173–1180; https://doi.org/10.1002/pen.760211711.Search in Google Scholar
4. Sánchez, R., Aisa, J., Martinez, A., Mercado, D. On the relationship between cooling setup and warpage in injection molding. Measurement 2012, 45, 1051–1056.10.1016/j.measurement.2012.01.039Search in Google Scholar
5. Ammar, A., Leo, V. A. D., Régnier, G. Corner deformation of injected thermoplastic parts. Int. J. Form. Process. 2003, 6, 53–70; https://doi.org/10.3166/ijfp.6.53-70.Search in Google Scholar
6. Kim, B., Min, J. Residual stress distributions and their influence on post-manufacturing deformation of injection-molded plastic parts. J. Mater. Process. Technol. 2017, 245, 215–226; https://doi.org/10.1016/j.jmatprotec.2017.02.015.Search in Google Scholar
7. Guevara-Morales, A., Figueroa-López, U. Residual stresses in injection molded products. J. Mater. Sci. 2014, 49, 4399–4415; https://doi.org/10.1007/s10853-014-8170-y.Search in Google Scholar
8. Chen, X., Lam, Y. C., Li, D. Q. Analysis of thermal residual stress in plastic injection molding. J. Mater. Process. Technol. 2000, 101, 275–280; https://doi.org/10.1016/s0924-0136(00)00472-6.Search in Google Scholar
9. Macías, C., Meza, O., Pérez, E. Relaxation of residual stresses in plastic cover lenses with applications in the injection molding process. Eng. Fail. Anal. 2015, 57, 490–498.10.1016/j.engfailanal.2015.07.026Search in Google Scholar
10. Hong, J.-S., Park, S.-R., Lyu, M.-Y. Measurement of residual stress using photoelasticity and computer simulation of optical characteristics in a transparent injection molded article. Polym. Korea 2011, 35, 1–6.10.7317/pk.2011.35.1.1Search in Google Scholar
11. Turnbull, A., Maxwell, A. S., Pillai, S. Residual stress in polymers—evaluation of measurement techniques. J. Mater. Sci. 1999, 34, 451–459; https://doi.org/10.1023/a:1004574024319.10.1023/A:1004574024319Search in Google Scholar
12. Isayev, A. I., Shyu, G. D., Li, C. T. Residual stresses and birefringence in injection molding of amorphous polymers: simulation and comparison with experiment. J. Polym. Sci. B Polym. Phys. 2006, 44, 622–639; https://doi.org/10.1002/polb.20724.Search in Google Scholar
13. Zhou, H., Li, D. Residual stress analysis of the post-filling stage in injection moulding. Int. J. Adv. Manuf. Technol. 2005, 25, 700–704; https://doi.org/10.1007/s00170-003-1906-5.Search in Google Scholar
14. Weng, C., Lee, W. B., To, S., Jiang, B.-Y. Numerical simulation of residual stress and birefringence in the precision injection molding of plastic microlens arrays. Int. Commun. Heat Mass Tran. 2009, 36, 213–219; https://doi.org/10.1016/j.icheatmasstransfer.2008.11.002.Search in Google Scholar
15. Li, M., Zhang, H. M., Nie, Y. Simulation analysis of residual stress of the plastic gear based on moldflow. Key Eng. Mater. 2012, 501, 339–343; https://doi.org/10.4028/www.scientific.net/kem.501.339.Search in Google Scholar
16. Azaman, M. D., Sapuan, S., Sulaiman, S., Zainudin, E. S., Abdan, K. Numerical simulation analysis of the in-cavity residual stress distribution of lignocellulosic (wood) polymer composites used in shallow thin-walled parts formed by the injection moulding process. Mater. Des. 2014, 55, 381–386; https://doi.org/10.1016/j.matdes.2013.09.041.Search in Google Scholar
17. Xie, P., Guo, F., Jiao, Z., Ding, Y., Yang, W. Effect of gate size on the melt filling behavior and residual stress of injection molded parts. Mater. Des. 2014, 53, 366–372; https://doi.org/10.1016/j.matdes.2013.06.071.Search in Google Scholar
18. Torres-Alba, A., Mercado-Colmenero, J. M., Caballero-Garcia, J. D., Martin-Doñate, C. Application of new triple hook-shaped conformal cooling channels for cores and sliders in injection molding to reduce residual stress and warping in complex plastic optical parts. Polymers 2021, 13, 2944; https://doi.org/10.3390/polym13172944.Search in Google Scholar PubMed PubMed Central
19. Lin, C.-M., Hsieh, H.-K. Processing optimization of Fresnel lenses manufacturing in the injection molding considering birefringence effect. Microsyst. Technol. 2017, 23, 5689–5695; https://doi.org/10.1007/s00542-017-3375-z.Search in Google Scholar
20. Lin, C.-M., Chen, Y.-W. Grey optimization of injection molding processing of plastic optical lens based on joint consideration of aberration and birefringence effects. Microsyst. Technol. 2019, 25, 621–631; https://doi.org/10.1007/s00542-018-4001-4.Search in Google Scholar
21. Cho, J.-H., Park, S.-R., Kim, H., Lyu, M.-Y. Investigation on the residual stress relaxation according to annealing condition for transparent injection molded part. Polym. Korea 2012, 36, 131–136; https://doi.org/10.7317/pk.2012.36.2.131.Search in Google Scholar
22. Farahani, S., Brown, N., Loftis, J., Krick, C., Pichl, F., Vaculik, R., Pilla, S. Evaluation of in-mold sensors and machine data towards enhancing product quality and process monitoring via Industry 4.0. Int. J. Adv. Manuf. Technol. 2019, 105, 1371–1389; https://doi.org/10.1007/s00170-019-04323-8.Search in Google Scholar
23. Ageyeva, T., Horváth, S., Kovács, J. G. In-mold sensors for injection molding: on the way to industry 4.0. Sensors 2019, 19, 3551; https://doi.org/10.3390/s19163551.Search in Google Scholar PubMed PubMed Central
24. Zhao, P., Zhang, J., Dong, Z., Huang, J., Zhou, H., Fu, J., Turng, L.-S. Intelligent injection molding on sensing, optimization, and control. Adv. Polym. Technol. 2020, 2020, 7023616; https://doi.org/10.1155/2020/7023616.Search in Google Scholar
25. Kurt, M., Saban Kamber, O., Kaynak, Y., Atakok, G., Girit, O. Experimental investigation of plastic injection molding: assessment of the effects of cavity pressure and mold temperature on the quality of the final products. Mater. Des. 2009, 30, 3217–3224; https://doi.org/10.1016/j.matdes.2009.01.004.Search in Google Scholar
26. Leo, V., Cuvelliez, C. The effect of the packing parameters, gate geometry, and mold elasticity on the final dimensions of a molded part. Polym. Eng. Sci. 1996, 36, 1961–1971; https://doi.org/10.1002/pen.10592.Search in Google Scholar
27. Nian, S.-C., Fang, Y.-C., Huang, M.-S. In-mold and machine sensing and feature extraction for optimized IC-tray manufacturing. Polymers 2019, 11, 1348; https://doi.org/10.3390/polym11081348.Search in Google Scholar PubMed PubMed Central
© 2022 Walter de Gruyter GmbH, Berlin/Boston
Articles in the same Issue
- Frontmatter
- Material Properties
- Structural evolution and barrier properties in biaxially stretched polyethylene terephthalate/hydroxy-terminated polybutadiene films
- Characterizing CaCO3 particle dispersion in blown film
- Tuning rheological performance of silica concentrated shear thickening fluid by using boric acid as additive
- Mechanical and morphological characterization of recycled HD-PE bio-composites based on alfa fibers and natural pozzolan
- Preparation and Assembly
- Boosting the photocatalytic performance of the oligo (phenylene vinylene) moiety by copolymerization for the heterogeneous degradation of indigo carmine dye
- Fabrication and characterization of three-dimensional polycaprolactone/sodium alginate and egg whites and eggshells hybrid scaffold in bone tissue engineering
- In situ prepared composite of polypyrrole and multi-walled carbon nanotubes grafted with sodium polystyrenesulfonate as ammonia gas sensor with wide detection range
- Engineering and Processing
- Properties of compression molded ultra-high molecular weight polyethylene: effects of varying process conditions
- Formulating calcium carbonate masterbatches
- Online detection of residual stress near the gate using cavity pressure for injection molding
- Annual Reviewer Acknowledgement
- Reviewer acknowledgement Journal of Polymer Engineering volume 42 (2022)