Effect of infill density and pattern on the specific load capacity of FDM 3D-printed PLA multi-layer sandwich
-
József Dobos
 ,
Muammel M. Hanon
,
Muammel M. Hanon
 and
István Oldal
and
István Oldal

Abstract
Three-dimensional (3D) printing settings allow the existence of differently filled sections together within a piece. That means the use of inhomogeneous internal material structure. Knowing the load capacity that 3D printed plastic parts can withstand leads to the reduction of the filling degree, thus the amount of the used material in certain places. This approach has two advantages during production: (i) less material use and (ii) reduced manufacturing time, both being cost-reducing factors. The present research aims to find the optimal proportions for fabricating a bending test piece with varying filling degrees. To achieve this goal, experimental tests were performed for obtaining tensile strength and modulus of elasticity using different pairs of infill density and pattern. This provided a basis for creating a working mechanical model based on accurate and realistic material properties. Hence, a series of virtual bending test experiments were conducted on a sandwich structure specimen employing Ansys Workbench software. By doing so, the optimal thickness (of the sandwich’s inner layer) with the highest specific load capacity for the given filling patterns and densities were determined. To the best of our knowledge, the current procedure of experiments and method of settings optimization were not discussed elsewhere.
1 Introduction
3D printing (also known as additive manufacturing) as a manufacturing alternative is gaining more and more attention over conventional (subtractive) methods due to both environmental impact and machining advantages [1]. The most important advantages of 3D printing are minimal material loss and reduced tool expenses. Other benefits are the design of the production equipment is simplified [2], there are almost no geometrical constraints, raw materials are uniform (powder, filament, resin), and material handling is easier to integrate into modern production systems [3]. However, additive manufacturing technology has its disadvantages too. According to Attaran (2017), the main disadvantage of 3D printing originates from the fact that it is a relatively new technology, and there are still many areas unknown in it [4]. One of the critical areas, it is hard to tell how a material will behave during the printing process. Thus, the reliability of the technology remains questionable.
Studies showed how the layer thickness, infill percentage, and heat treatment are among the most crucial settings of 3D printing [5, 6]. Other research demonstrated how to improve the accuracy efficiency in the Fused Deposition Modeling (FDM) process through parameters optimization [7, 8]. The wear strength of the FDM fabricated component mainly depends on the airgap [9]. Furthermore, the effect of other process parameters such as building orientation [10, 11], and raster angle [12], [13], [14] on the performance of FDM printed parts were also investigated. It was also found that the influence of print orientation is more significant than the raster angle [15]. Moreover, there are many effects of processing conditions on bonding degree [16]. Raster width and the number of contours also affect the mechanical behavior of FDM-produced components [17]. Baich et al. (2015) demonstrated that low density had cost savings with similar strength performance for tensile loading compared to high density [18]. Onwubolu et al. (2014) have shown that in order to enhance the tensile strength of acrylonitrile butadiene styrene (ABS), layer and raster thickness should be increased [19]. However, Attaran (2017) claimed that the layer thickness impact is negligible on the mechanical properties of ABS material compared to the other parameters [4]. Ziemian et al. (2012, 2015) proved experimentally that to achieve the highest tensile strength, it is better to assign the rasters longitudinally rather than diagonally [20, 21].
There are also some studies in the literature around the modeling of bending tests employing proper pairs of 3D printing parameters for obtaining preferable results. Zur et al. (2019) examined the changes in stress caused by various patterns and infills. At first, a static bending test was modeled by finite element analysis. Then, the authenticity of the analysis was tested by bending the real body. For the optimization of mechanical properties, they performed the static bending test that is intended to be simulated in Ansys. Optimization of shape and structure made it possible to reduce the stress of the inspected element by 75.8%. Different filling patterns and reduced infill ratios allowed the weight and the cost of the printed object to be decreased to 50% compared to the filled one [22]. Today, it is possible to produce thermoplastic surgical instruments with 3D printing. Load-bearing structures are designed to be stronger at desired places where the maximum stress is applied. Kołodziej et al. (2019) dedicated one of their articles to the static bending test of polylactic acid (PLA) polymer. Two different filling patterns were tested (Honeycomb and Grid) simultaneously with various infill ratios and orientation. The authors concluded that increasing the filling density positively affects the modulus of elasticity and load capacity, as the highest values were obtained in the highest fill (100%). The orientation study showed that a 45-degree placement results in a more robust specimen than a 90-degree orientation. Further, the 25% Honeycomb fill gave almost the same flexibility values and maximum load capacity as the 50% Grid fill [23].
Although the last two articles mentioned have reviewed the importance of optimizing 3D printing parameters for better bending test outcomes, exploring this research area with fundamental differences is necessary. As in any sector of material technology, there are many opportunities for development in the plastics industry. One of the advantages of 3D printing, non-homogeneous material structures can be created with different settings. This manufacturing technology is known but not fully exploited.
The present work examined the 3D printing of multi-layered sandwich structures with different layers’ filling density and pattern. The structure was modeled to evaluate the bending test and implicitly for determining its specific load capacity. For more reliable results, accurate elastic modulus values (experimentally measured) were implemented in the modeling. An optimum could be achieved when a decent pairing of infill parameters is applied, with which better use of the inhomogeneous material construction possibility can be made. To date, such matters were not investigated in any study else.
2 Materials and methods
2.1 Procedure of research
The specimens were manufactured by 3D printing employing various process settings (four levels of infill ratio and filling pattern). At first, the fabricated samples were subjected to tensile testing to determine the effect of pattern and filling density on tensile strength. Secondly, Young’s modulus values have been examined in the elastic range using the previous fill and pattern variations at maximum load without breaking the specimen. Further, additional measurements were needed, such as scaling the weight of the inspected specimens using a digital lab balance. From the obtained results, material properties were determined for finite element analysis. Therefore, the outcomes of these tests were used as the input parameters for the virtual bending tests, which were modeled utilizing Ansys Workbench software (finite element method). The specimens of modeling were in the shape of a sandwich. Thus, in addition to investigating the same 3D printing parameters concerning filling ratio and pattern, the influence of layer thickness of the sandwich inner and outer layers was assessed. The aim of this is to achieve an optimal specific load capacity by optimizing material consumption. This would help to improve the product properties and simultaneously to reduce the production time and cost. More details about the 3D printing settings used as well as the testing and modeling parameters are mentioned in the following sections.
2.2 3D printing of specimens and process settings
According to the fused deposition modeling technology, the printed specimens were made by a 3D printer (CRAFTBOT3). The process was executed at a temperature of 60 °C and 195 °C for the workbench and printing head, respectively. The software employed for slicing the STL file (3D printing model) is Slic3r v.1.3.0. The printing material is a PLA filament (branded Filaticum) with yellow color having a diameter of 1.75 mm. The manufacturing of specimens was accomplished at a print speed of 60 mm/s using a nozzle diameter of 0.4 mm.
The tensile test specimens were fabricated following the ISO 527-2:2012 standard [24], with the dimensions demonstrated in Figure 1a. Two process settings which are filling patterns and infill percentage were employed at four levels. The four patterns used are Rectilinear, Hilbert Curve, Concentric, Honeycomb (see Figure 1b). The specimens of each pattern were manufactured in four different filling ratios, which are 40%, 60%, 80%, and 100%. The Honeycomb pattern was unattainable with 100% filling because this setting is not applicable in the slicing software. Therefore, the number of conditions utilized to produce all specimens was 15, as presented in Figure 1c, with three identical samples for each condition to yield reliable results (45 models in total).
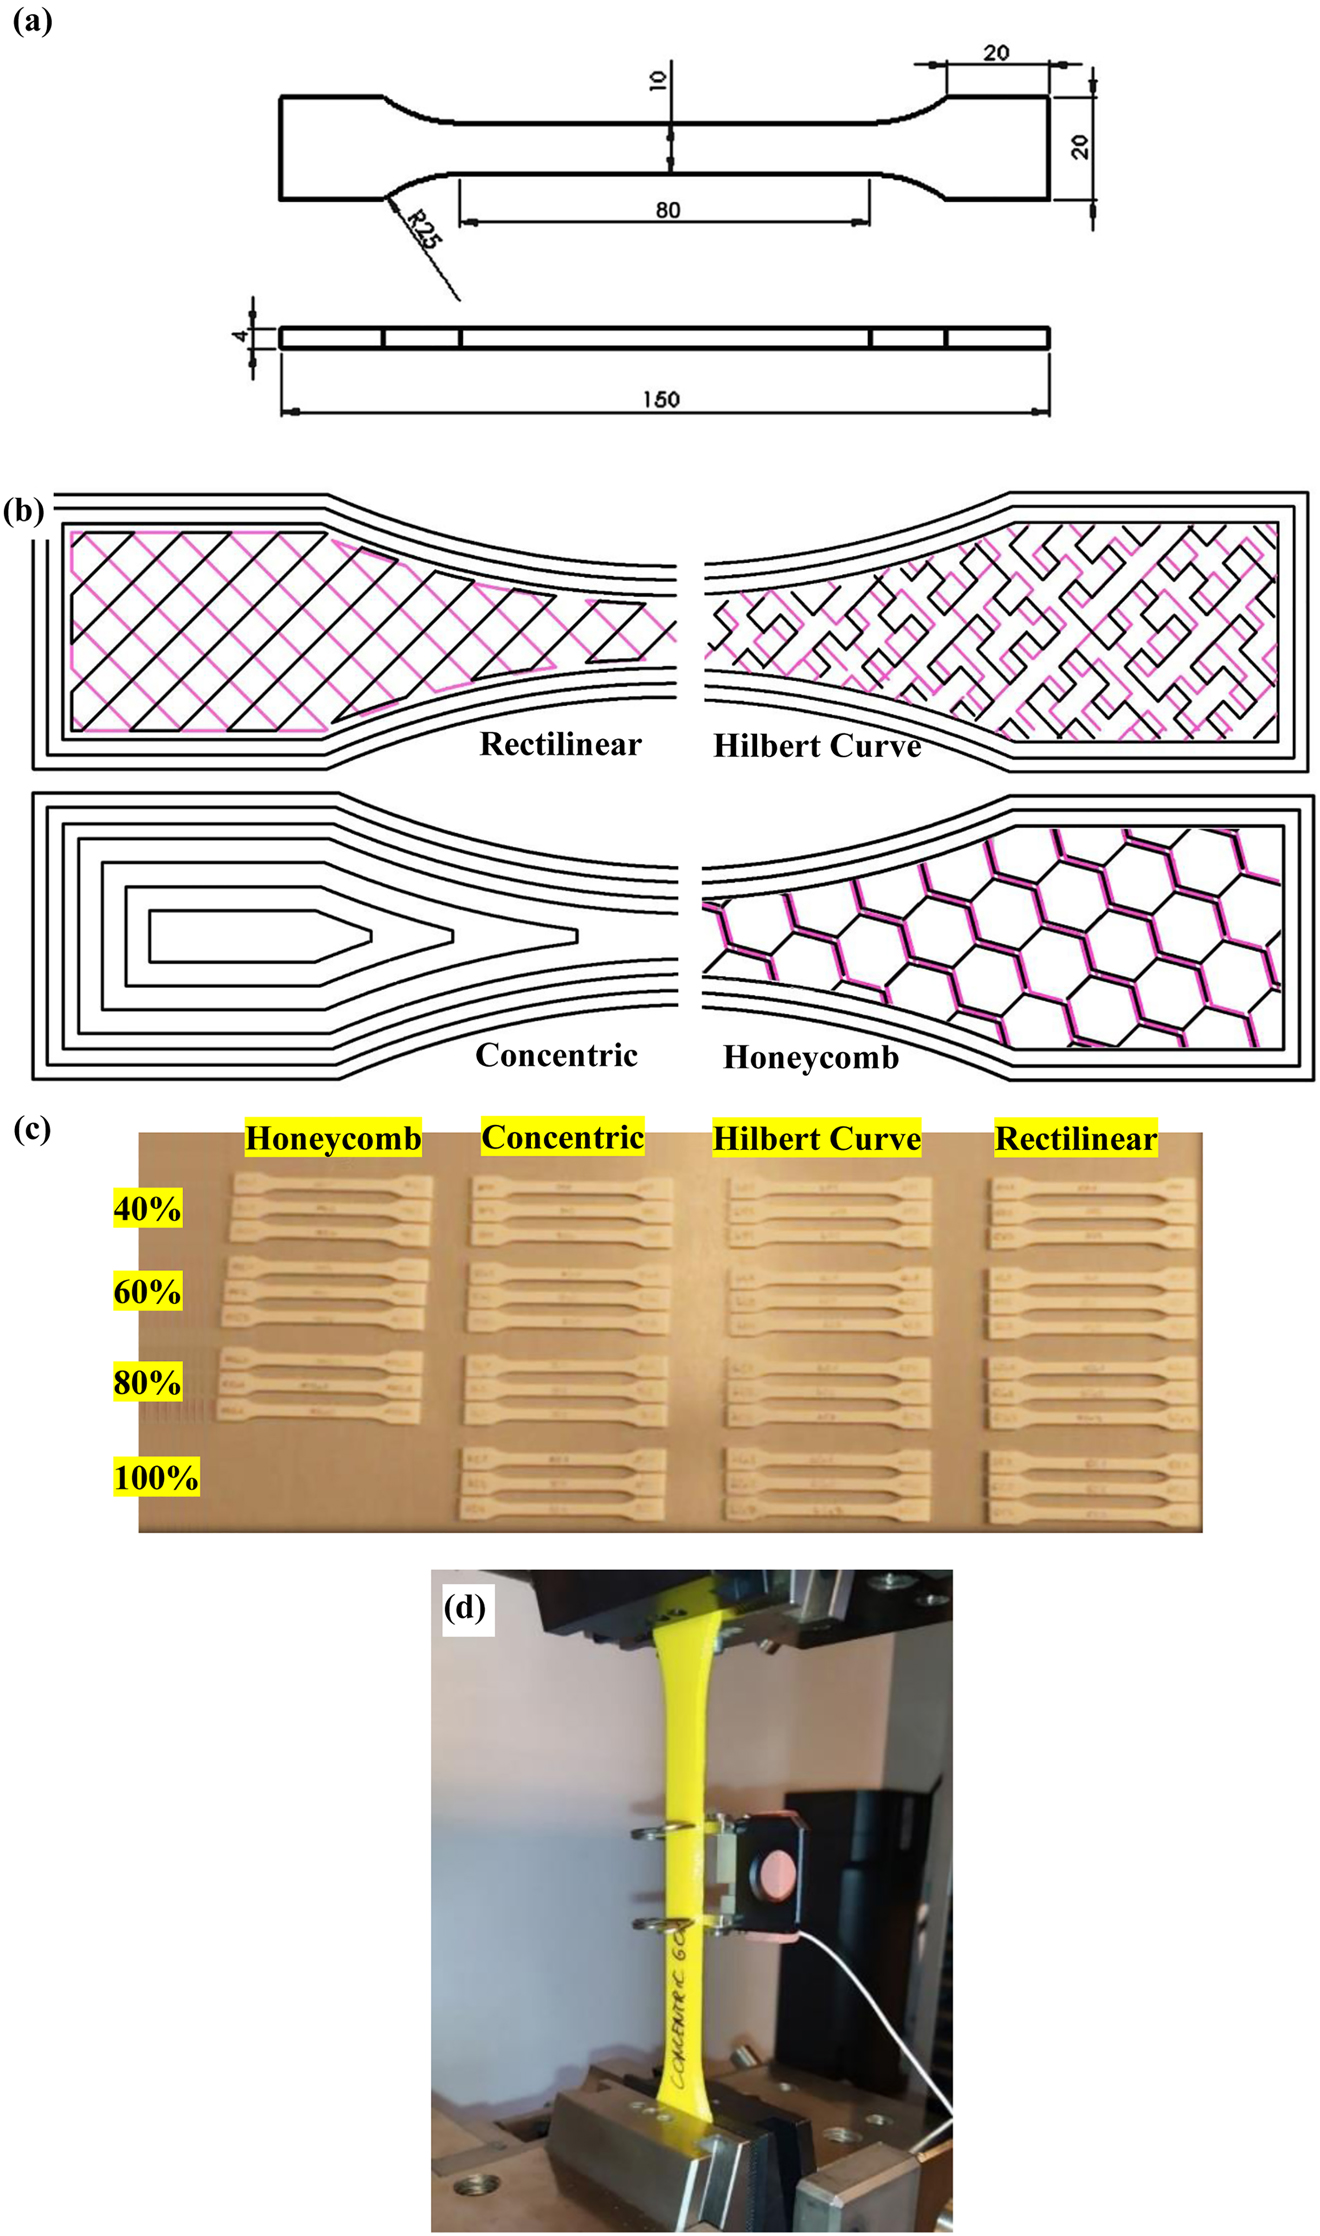
(a) ISO 527 standard specimen for tensile tests, (b) patterns used when fabricating the specimens, (c) actual appearance for 3D printed tensile samples under various pattern and infill density, (d) extensometer used to determine the modulus of elasticity.
2.3 Tensile test and elastic modulus determination
The specimens were examined with a universal tensile test machine Zwick/Roell Z100, according to the standard and test parameters of ISO 527 [25]. Mechanical experiments were carried out in Knowledge Transfer Centre at Szent István Campus, MATE University, Hungary.
The modulus of elasticity was determined experimentally within the elastic range using an extensometer (see Figure 1d). The extensometer is an instrument attached to the tensile test specimen for measuring the elongation, which implicitly helps determine Young’s modulus accurately. Since the sample is not fractured during this test, the measurements can be repeated frequently employing only one specimen of every examined condition. The measuring procedure requires meticulous adjustment, as an incorrectly adjusted tensile force can cause fiber breakage. This issue can lead to measurement inaccuracies that are not visible, hearable, or noticeable at all to the eye or ear. The chosen limit of measurement is up to 80% of the yield strength (the maximum elastic force). Considering this value carefully, the measurement of the modulus of elasticity was repeated 10 times for each condition (15 conditions). These 150 measurements were conducted to determine reliable values for Young’s modulus.
Accurate and realistic material properties are required to achieve precise and reliable data for modeling. Hence, the mass of every specimen was measured accurately using a digital balance branded Sartorius. It was needed for the final optimum calculations of every piece.
2.4 Modeling of bending tests
2.4.1 Specimen structure and varying parameters
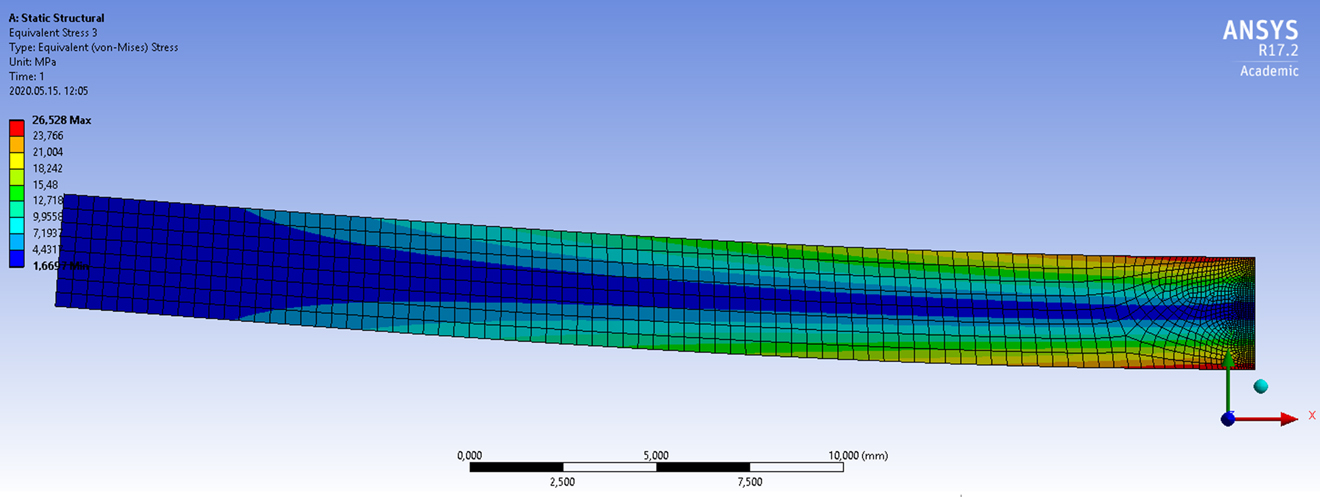
A virtual sandwich (multi-layered) specimen ISO-178 Standard compliant was created by Ansys Workbench software. A part of the structure cross-section of this sample is illustrated in Figure 2a. The total thickness of the specimen is constant as 4 mm according to the standard. The outer (top and bottom) layers have the same filling (100%) and pattern (Rectilinear) for all specimens. The height of the outer layers is changing and designated based on the thickness of the inner layer (core). In other words, the thickness of the outer layers (dark gray parts) depending on the internal layer height (v). When v increases, the thickness of the external (top and bottom) layers decreases, and vice versa. Starting at 0.2 mm, the core thickness has been increased 15 times up to 3 mm with an increment of 0.2 mm. This is to examine the influence of varying the inner layer thickness on the product properties at the current model. Consequently, when the inner layer is at the minimum thickness value set (0.2 mm), the outer layers’ thickness is 3.8 mm (1.9 mm for top and 1.9 mm for bottom). Whereas, at maximum inner layer thickness (3 mm), the outer layers become 1 mm (0.5 mm on each), and so on for the remaining thickness values in between.
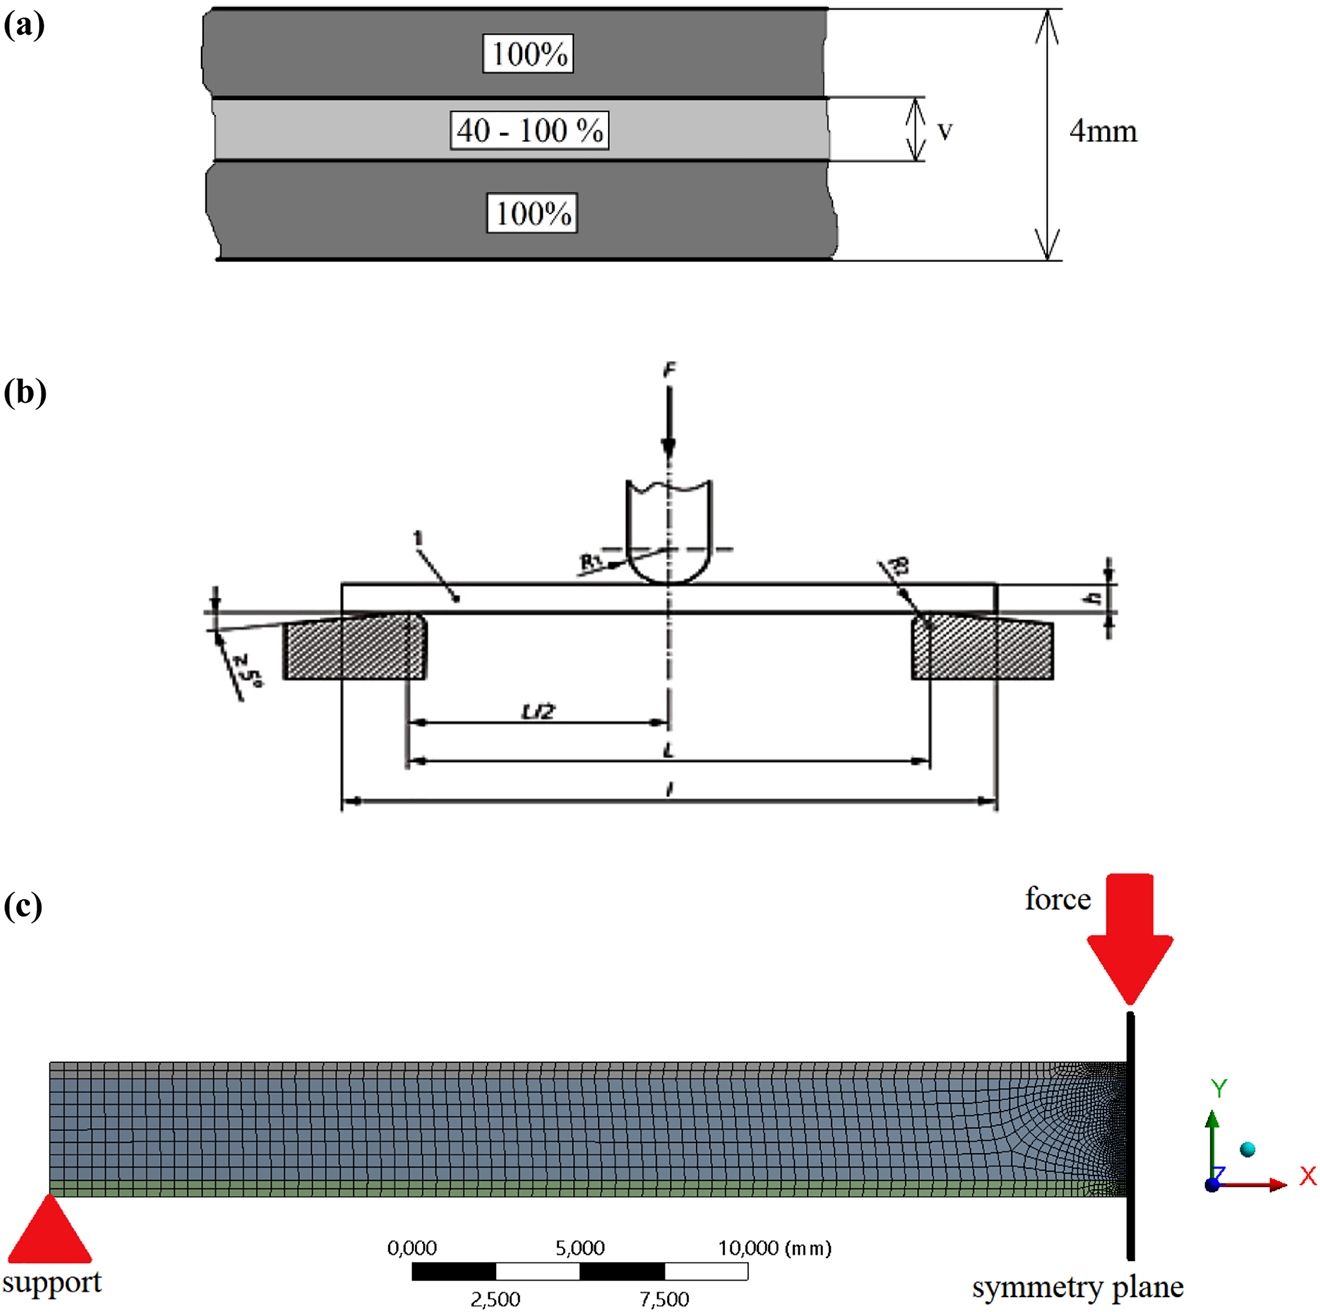
(a) Illustration of the sandwich specimen’s structure, (b) test method of ISO 178 bending standard, (c) the mesh of finite element model.
Moreover, the pattern and filling density of the core were also changed, imitating the parameters examined in the experimental (tensile) tests. Therefore, the applied variations were Concentric, Hilbert Curve, Honeycomb, and Rectilinear in terms of patterns, and 40%, 60%, 80%, and 100% regarding the infill ratios. As a result, the previous calculations (such as modulus of elasticity and mass) can be applied during the modeling tests. Throughout the modeling, the test procedure was implemented according to ISO 178 bending standard [26] for determining the specific load capacity, as displayed in Figure 2b.
2.4.2 Boundary conditions
The arrangement (shown in Figure 2c) was modeled in the finite element method using the symmetry of geometry and boundary conditions. Thus, it is enough to model half of the specimen. The mesh elements are quadrilateral between 0.05 and 0.5 mm. The modulus of elasticity values of the ISO 527 specimen, measured by extensometer, were fed into the boundary conditions of Ansys Workbench. The finite element mesh constitutes 6480 nodes and 2069 elements. The support was modeled as a y-direction displacement. Half of the force was applied due to symmetry. Symmetry was modeled as a displacement of x = 0 in its plane. During the tests, the load increased until the maximum stress was reached. The limit values were defined from the tensile test. As aforementioned, the specimens were tested at different layer heights, patterns, and filling densities. The modeling aims to find the optimal parameters that provide the highest specific load capacity for a 3D printed sandwich structural bent piece.
3 Results and discussion
3.1 Tensile strength and elastic modulus evaluation
The results of tensile tests for all examined patterns and filling ratios are shown in Figure 3. It can be seen that the values of force versus elongation are pretty affected by different 3D printing settings. Generally, increasing the infill percentage has increased the strength of the test pieces irrespective of the filling pattern. Fernandez-Vicente et al. confirmed a corresponding trend [27]. In terms of the influence of various patterns, the Concentric pattern at 40 and 60% infill percentage proved to be much stronger than the other samples’ styles. However, Honeycomb performed excellently at 80% filling, while Rectilinear specimens revealed the best at 100% density. On the other hand, the Hilbert curve pattern disclosed the weakest performance in all cases. Its samples at 40, 60, and 80% filling ratios were almost capable of withstanding half of the tensile force that the Concentric specimens could afford. This might be attributed to the fibers’ deposition direction of these patterns since most of the fibers in the Concentric were longitudinally oriented toward the direction where the specimens are being pulled. More deposited filaments parallel to the tensile test force would result in stronger tensile strength [28]. On the contrary, the Hilbert curve pattern contains discontinuous and short beads [29]. Even in other filling patterns, the placement of fibers was not longitudinal (side by side) with the tension direction. Thus, due to the deviation of fibers direction, torque may develop among them within a particular cross-section, and a higher tension arises at the connection of the fibers. This would be followed by a larger elongation with a smaller force and then a fracture.
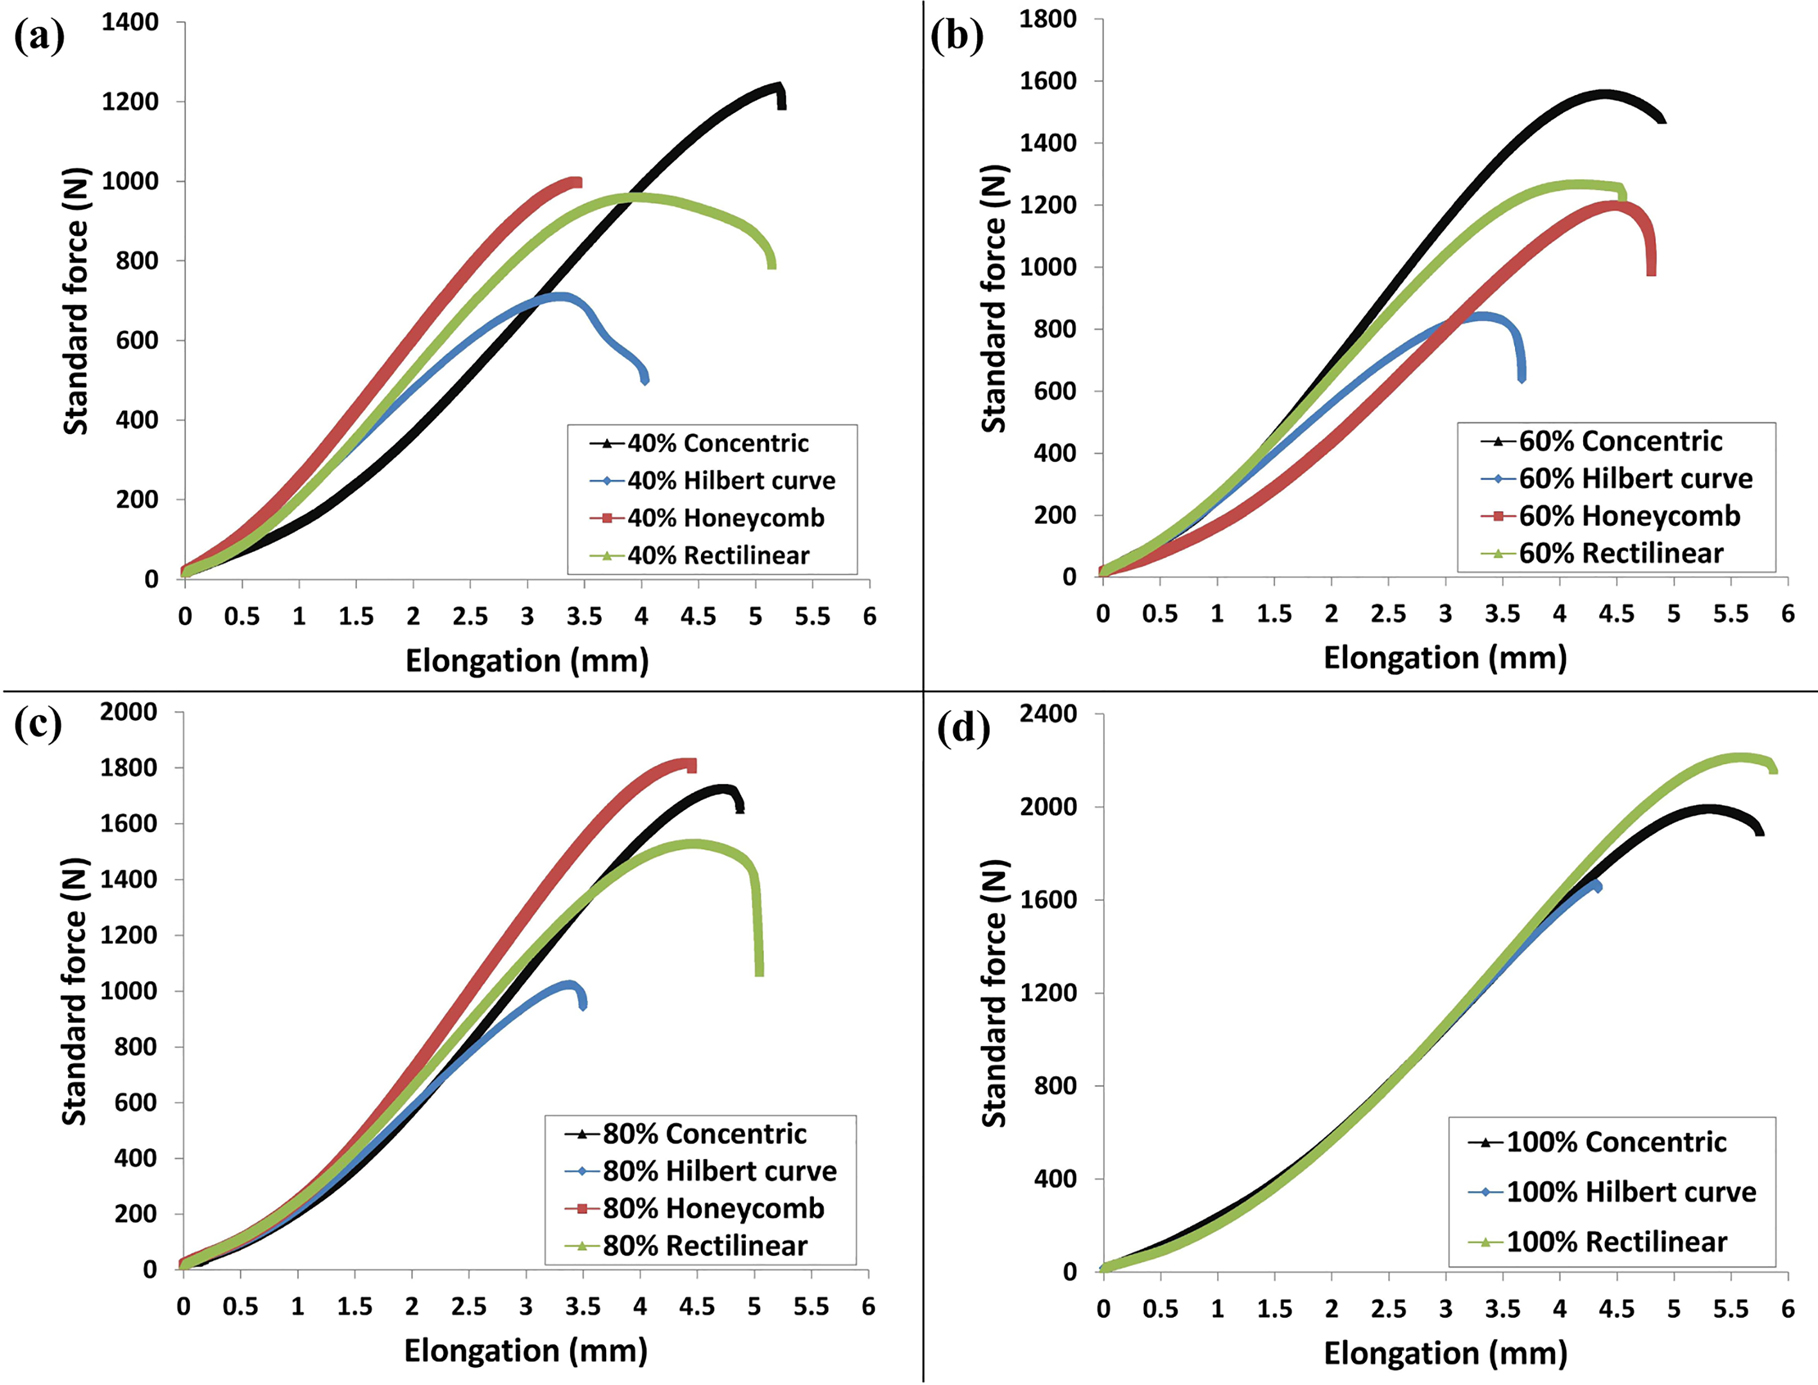
Tensile test curves (force vs. elongation) for all examined patterns and filling ratios.
Regarding the elongation, Concentric and Rectilinear patterns independently have almost offered identical values for all examined densities. It can be seen that the Hilbert curve filling has constantly demonstrated inferior elongation as compared to other patterns. Further, the Honeycomb specimens were elongated nearly as much as the Rectilinear and Concentric pattern at the infill ratio of 60 and 80%. However, it showed a brittle behavior (much lower elongation) at the 40% infill percentage. This indicates that both infill pattern and density are considerably essential for the elongation properties of the material. Nevertheless, the results showed that the infill ratio parameter has more impact on the elongation capacity.
The engineering tensile strength values were calculated and presented versus the filling density in Figure 4. Each point is the average of three basic measurements. The tensile strength is increasing as the filling ratio increases. A similar tendency was reported in a recently published study [30]. The Concentric pattern generally reported the highest tensile strength values (Max. 55.5 MPa at 100% filling density), which were an overall average of 34.31%, 9.97%, and 12.32% higher than the Hilbert curve, Honeycomb, and Rectilinear, respectively. The performance has significantly improved for the Honeycomb and Rectilinear specimens at 80% and 100%, consecutively. The overall attitude is in good agreement with the literature [29, 31].
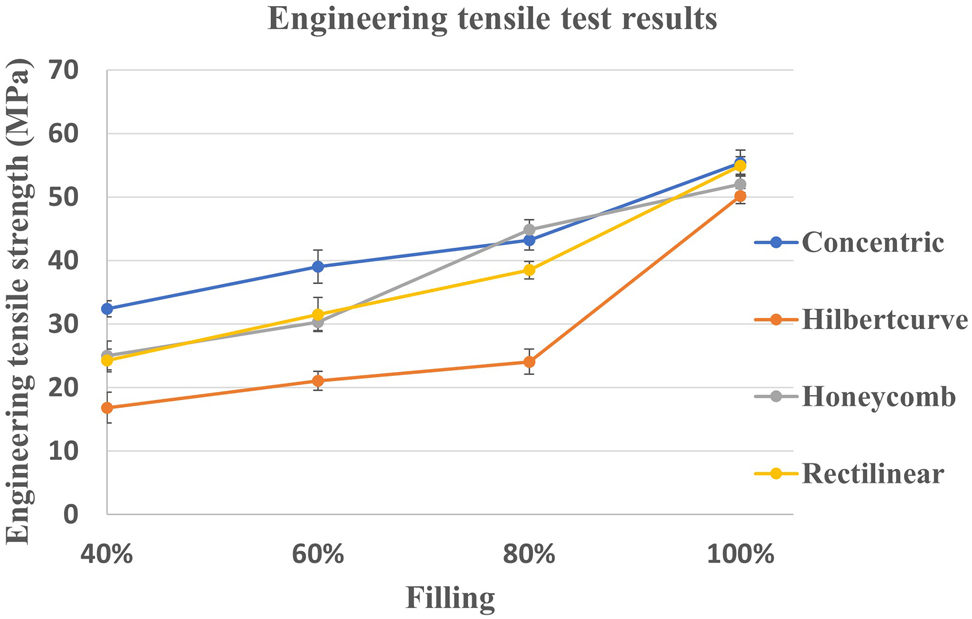
Engineering tensile strength results against the filling density.
The manufacturer specified the material’s tensile strength as 52 MPa for an injection molded solid body. Since the cross-sectional area of the specimen (at the gauge section) is 40 mm2 (10 mm × 4 mm). Thus, the force required to rupture per square millimeter is 52 N. Based on that, the maximum load that the material can withstand was defined when testing the elastic modulus. It is noteworthy that the perimeter cross-section area is not identical with the inner filling cross-section area, not even for 100% infill, due to the anisotropy of 3D printing. The modulus of elasticity was examined within the elastic range (see Figure 5a), where the stress does not cause permanent deformation in the material.
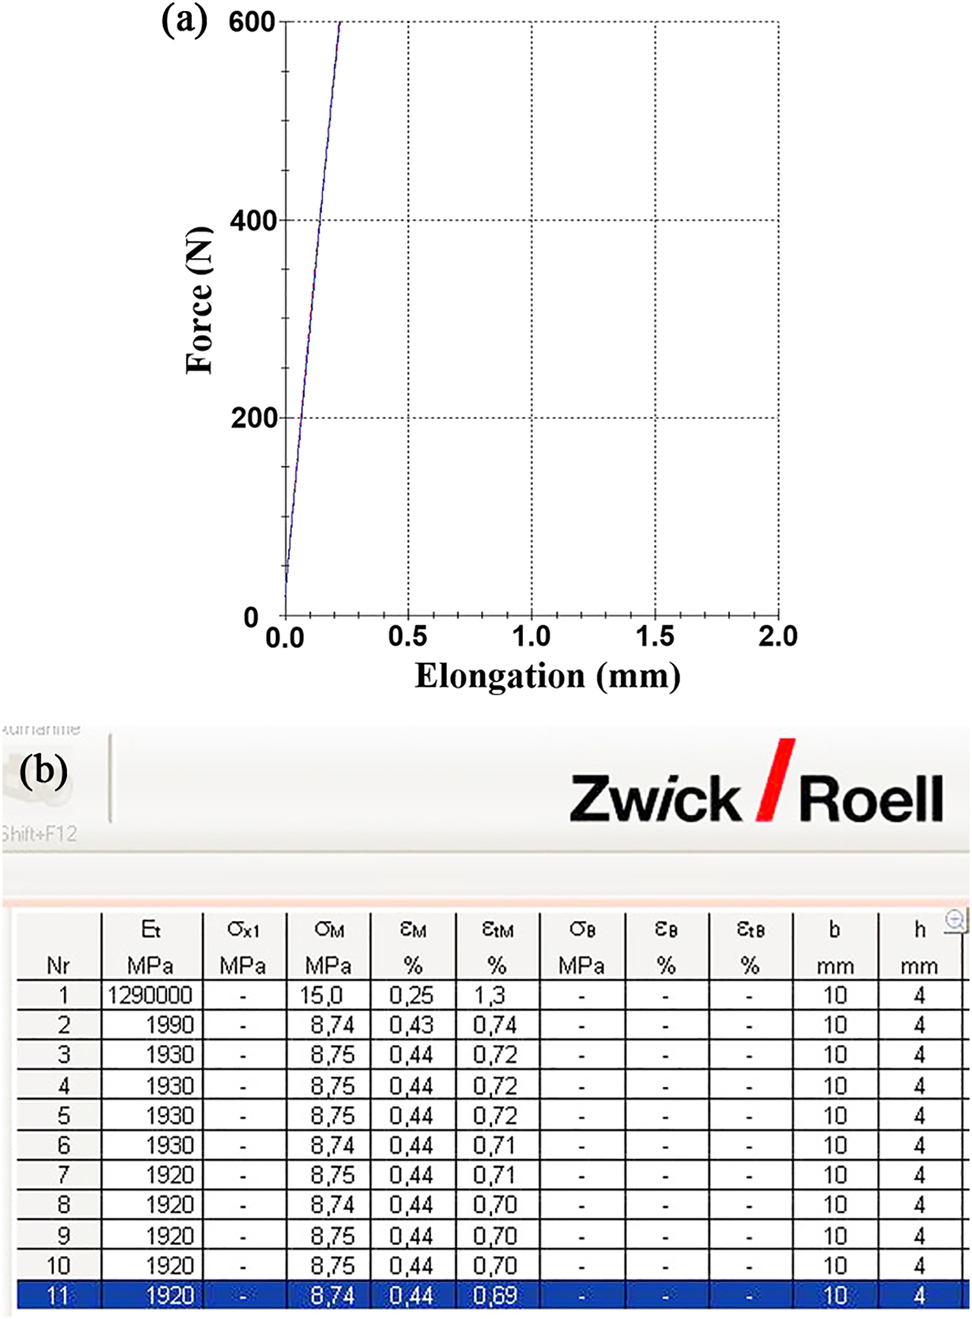
(a) Elastic zone during the modulus of elasticity test, (b) screenshot taken from the testing machine software for Young’s modulus (E t column) measurements of concentric pattern specimen at 40% density.
Using an extensometer, the modulus of elasticity was measured for all pattern and filling density specimens examined. For achieving credible results, 10 measurements were conducted (repeated) on each condition. As an example, Young’s modulus measurement results of the Concentric pattern specimen at 40% density are exhibited in Figure 5b. This figure is a screenshot of the data obtained and was taken from the machine software used. Row no. 1 shows a measurement error due to improper installation or mounting of the extensometer. The other 10 measurements show the validity of the results.
3.2 Virtual bending tests investigation
The values of modulus of elasticity measured were fed into the boundary conditions of Ansys Workbench. The modeled bending test specimen (ISO 178) has the same conditions (patterns and fillings) applied in the ISO 527 tensile samples. The force that the structure can be loaded was not known in advance. Therefore, a load test (named F force first) was used to determine the maximum stress. The value of the initial force obtained from the load test is 50 N. Since the system is linear, it is possible to determine the allowable stress and then the maximum force that the specimen can withstand. Hence, for determining the maximum force:
where F first is the first force (50 N, obtained from the load test aforesaid), σ first is the first tensile strength in (MPa), F max represents the maximum force in (N), and σ max is the maximum tensile strength in (MPa). From this:
The stress values obtained and 3D printing settings (patterns and fillings) were used in Ansys (see Figure 6). In addition to the pattern and filling density parameters, the layer thickness variation of the sandwich specimen’s inner layer (core) was also examined according to the manner explained in Section 2.4.1. The maximum bending force was calculated for each layer order based on the finite element results and the measured tensile strengths.
The stress obtained from the ISO-178 piece.
As the examined settings involve four levels of patterns, four levels of infill densities, and 15 levels of layer thicknesses, the total number of the resultant values would be 225 (Bearing in mind that Honeycomb at 100% density is impossible to print as aforementioned, thus the feasible measurements are 240 − 15 = 225). The acquired values were included in an excel table. Depending on the boundary conditions and the filling, the values of the maximum stress named “Max.force” are presented after the substitution into the formula with an initial load of 50 N. The external (100% Rectilinear, constant) and internal (variable) layer density and pattern were implemented during the calculations.
As an instance of the results, a screenshot for the data obtained (measured by Ansys) after testing a specimen of one pattern at one filling ratio (40% Concentric) and under 15 different levels of layer thicknesses is displayed in Figure 7 (upper part). It can be seen that as the layer thickness of the sandwich’s inner layer (column B) increases, the amount of the maximum force generated decreases continuously. This applies to the maximum force of the specimen’s outer and inner layers (columns C and D, respectively). A maximum force of 46.16 N could be measured at the outer layer when the core height is 0.2 mm. At the same time, the inner filling layer can withstand a maximum force of 313.7 N. This significant variance, in this particular case, was mainly due to the huge difference in total thickness and infill density between the outer layers and the core. As the total thickness was 3.8 mm for the cumulative outer layers, whereas only 0.2 mm for the core. In addition, the infill density of the outer layers was 100%, while 40% for the core. These obvious differences led to the maximum force measured for the outer layers being remarkably higher than the maximum force that the core can bear. On the other hand, it was observed that at 3 mm inner layer thickness, there was almost no difference between the maximum force measured in the outer and inner layers. The ratio of maximum load capacity to weight (force/mass in N/g) was also presented (column G). Increasing the core thickness caused decreasing in the mass due to the density of the inner layer (40% for the shown data). Further, it was expected that less material (decreasing the filling density) leads to the reduction of the load capacity. However, it was found that the “force/mass” increased with the decrease of weight, as it reached a maximum value (5.47) at 2.6 mm core thickness. This indicates that decreasing specimen weight up to a certain extent resulting in an increase in specific load capacity. Therefore, the point where the highest force/mass value was found refers to the optimum inner layer thickness. Column H represents the percentage of the core thickness (between 0.2 mm “5%” and 3 mm “75%”) out of the specimen’s total height (4 mm “100%”). Since the highest force/mass value was found at 2.6 mm core thickness, this means that the optimal point was achieved when the inner layer thickness was 65% of the total sample height. The curve of developing the specific load capacity (force/mass ratio) versus the inner layer thickness was drawn in Figure 7 (lower part).
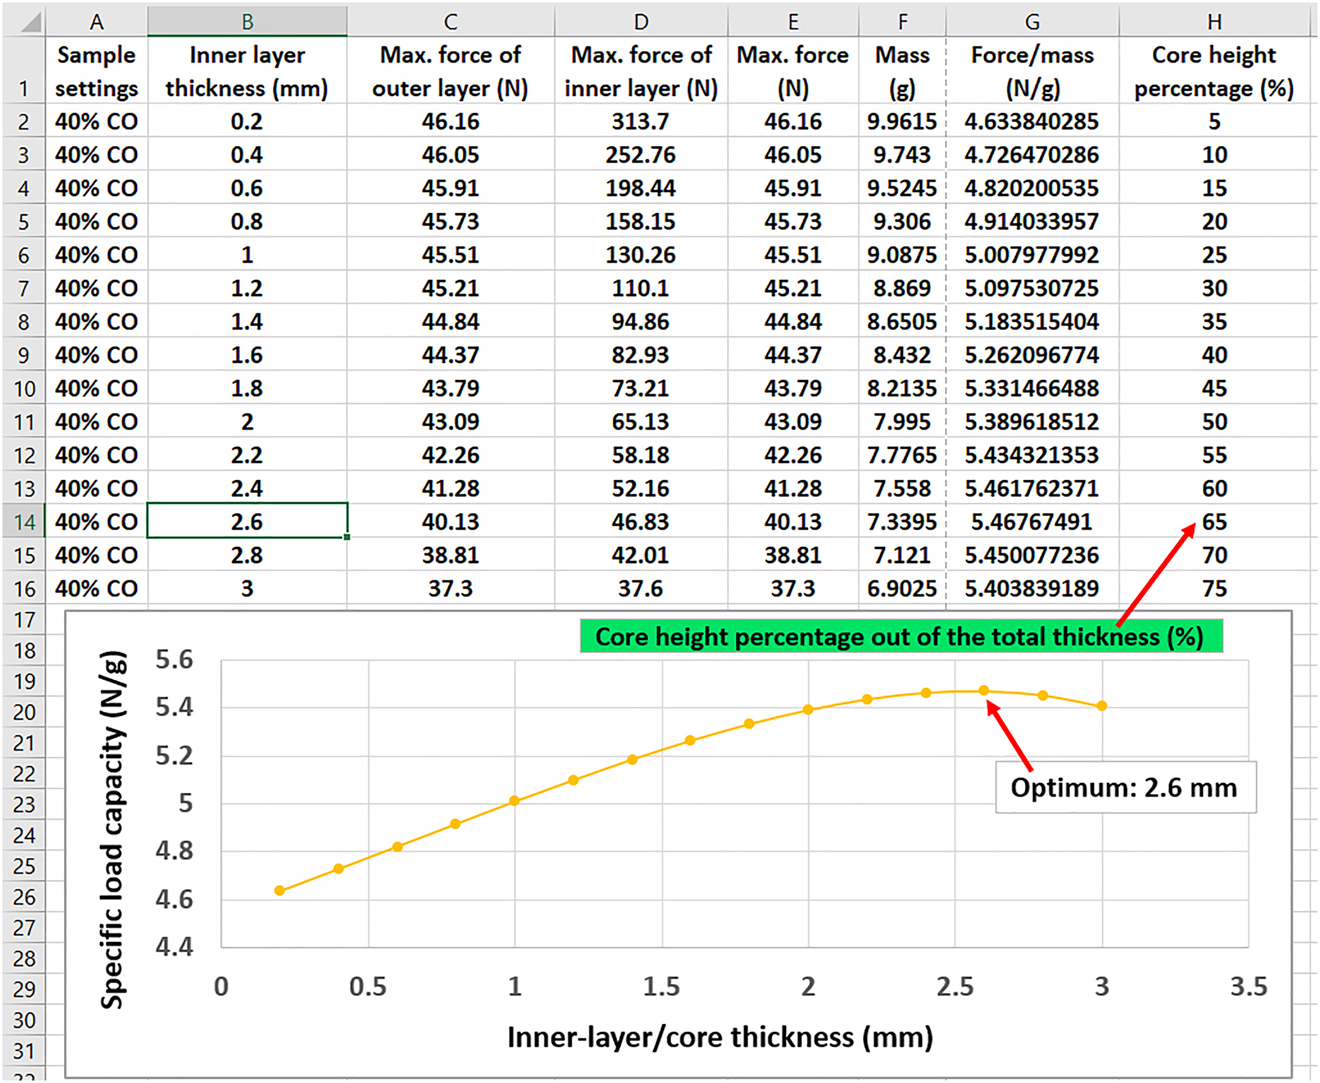
Evaluation of data obtained for determining the optimum specific load capacity (the specimen is 40% concentric).
The procedure carried out in Figure 7 was repeated on all settings examined (filling density and pattern). The curves of developing the specific load capacity versus the core thickness are presented in Figure 8a–d. Obviously, it can be seen that the best specific load capacity was always achieved at the infill density of 40%, irrespective of the filling pattern. After the regression, a third-degree polynomial trend line could be observed on all 40% curves since R2 is close or equal to 1. This means that the polynomial model fitted the data with a high coefficient of determination (R2).
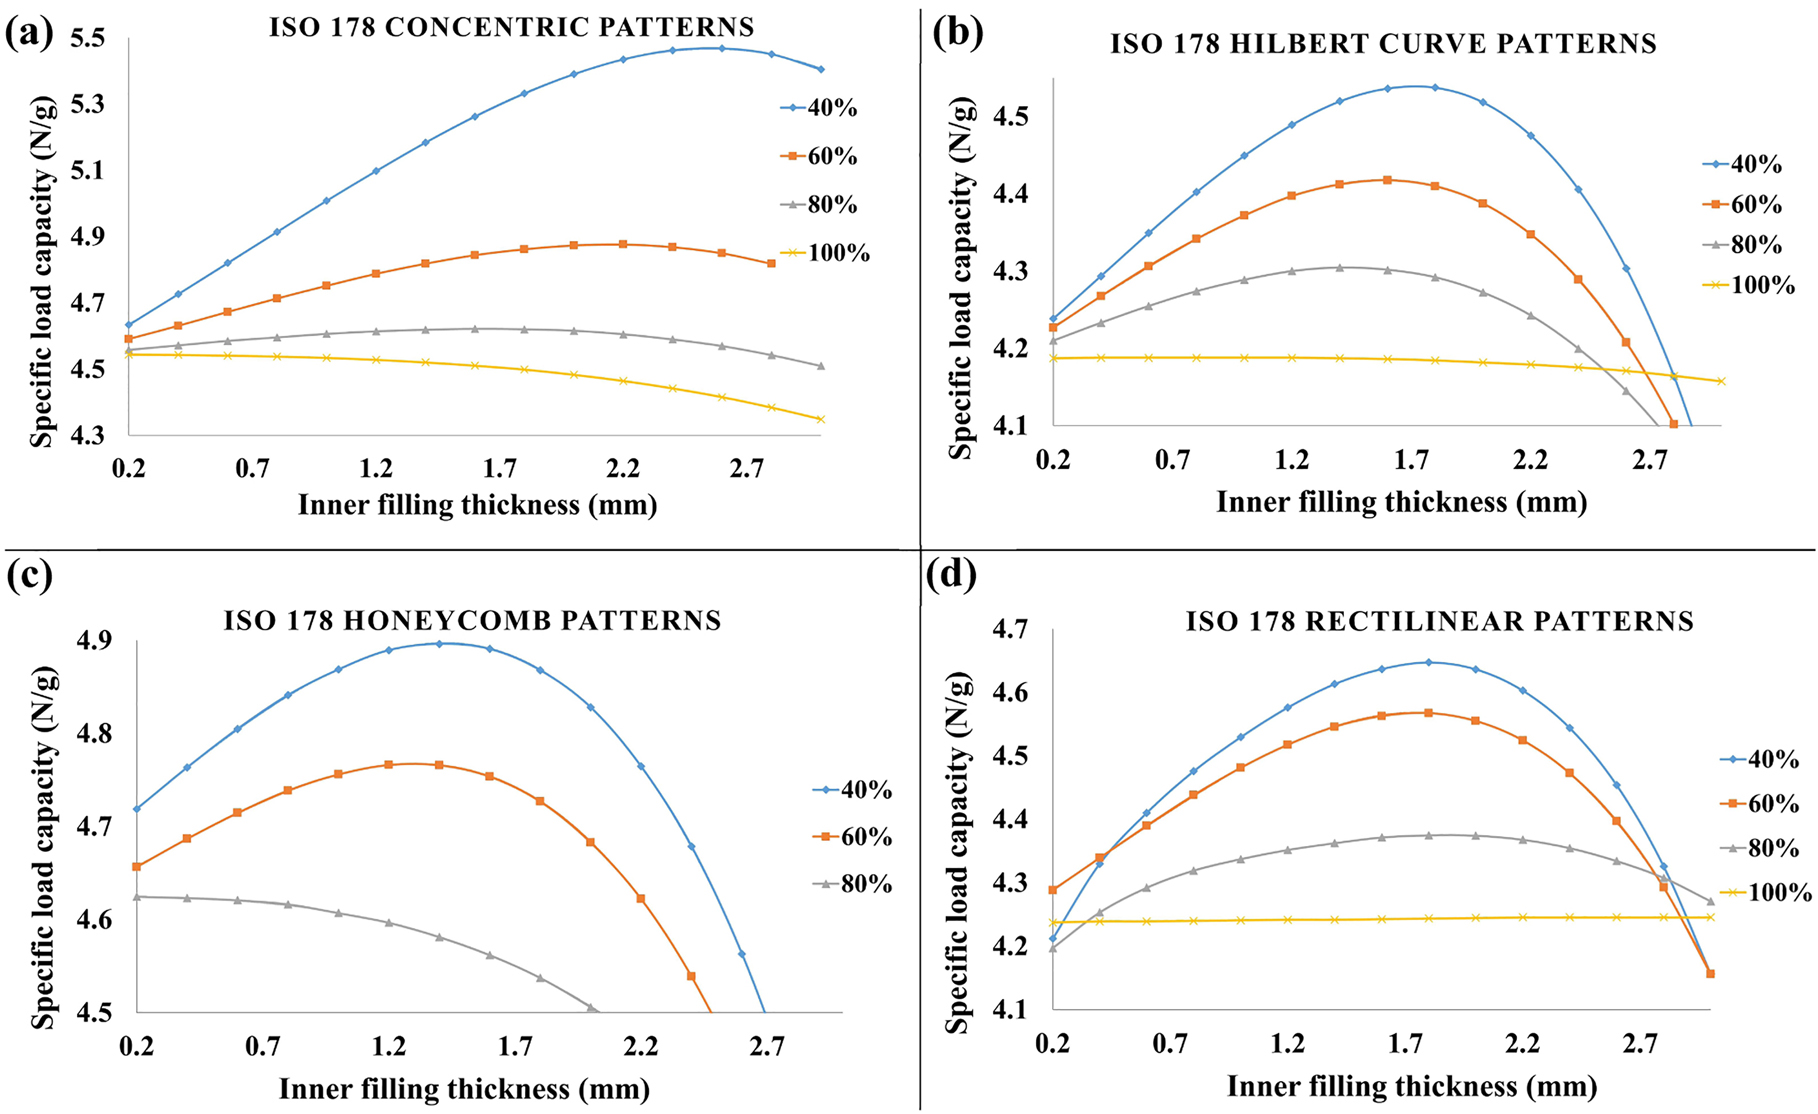
The curves of developing the specific load capacity in front of the inner layer thickness under various filling densities at (a) concentric pattern, (b) Hilbert curve pattern, (c) honeycomb pattern, and (d) rectilinear pattern.
In all exhibited patterns, the filling density of 100% has no optimum point (except for Honeycomb since it is already not existed as aforementioned) because the relationship was almost flat (without increment). The main reason for this is that the outer sandwich’s layers also have the same filling ratio (100%). Therefore, the material properties did not improve despite the increasing thickness. That was more evident in the Rectilinear sample where the line was relatively straight due to the pattern of both outer and inner layer, as well as the filling ratio, were the same.
The highest load-bearing capacity values were reported at the inner layer thickness of 2.6 mm (65% of total thickness), 1.8 mm (45% of total thickness), 1.6 mm (40% of total thickness), and 2 mm (50% of total thickness) for Concentric, Hilbert Curve, Honeycomb, and Rectilinear patterns, respectively, all under 40% filling ratio. Further, it was also noticed that after the highest point, there was a considerable decline in specific load capacity, especially at the filling density of 40 and 60% for most patterns. This intimates the significance of searching the optimal point, which seems not associated with a specific thickness for all conditions.
In summary, it is clear from the diagrams, shown in Figure 8, that there is an optimum for each filling density and pattern. This study attempted to provide the best values (optimal), which were represented by the maximum specific load capacity paired with the inner layer thickness (employing the procedure described in Figure 7). The core thickness in which the optimal specific load capacity values were found for each infill density and pattern are tabulated in Table 1.
The thickness of the inner layer where the optimum specific load capacity was obtained.
| Filling density | Infill pattern | |||||||
|---|---|---|---|---|---|---|---|---|
| Concentric | Hilbert curve | Honeycomb | Rectilinear | |||||
| Optimal thickness of the inner layer (total specimen’s height is 4 mm) | ||||||||
| mm | %a | mm | %a | mm | %a | mm | %a | |
| 40% | 2.6 | 65 | 1.8 | 45 | 1.6 | 40 | 2 | 50 |
| 60% | 2.2 | 55 | 1.6 | 40 | 1.4 | 35 | 2 | 50 |
| 80% | 1.6 | 40 | 1.5 | 37.5 | 0.2 | 5 | 2 | 50 |
| 100% | 0.2 | 5 | 0.4 | 10 | – | – | 2 | 50 |
-
a% represents the percentage of the core thickness out of the total specimen’s height.
4 Conclusions
In this research, the effect of 3D printing infill density and pattern on the specific load capacity was discussed. To this end, PLA material was used to fabricate specimens employing a 3D printer with FDM technology. Four levels of filling density and pattern were examined, and tensile tests have been conducted. Also, the modulus of elasticity was determined experimentally. The variation of these settings showed significant differences in the results of the tensile strength and elastic modulus. All the experimental testing results achieved were fed into the Ansys Workbench software in order to model the specific load capacity based on actual data. The modeled specimen was in a sandwich structure having two outer layers (one up and one down) and one inner layer (core). The outer layers had a fixed setting (100% filling density and Rectilinear pattern). At the same time, the core included the same parameters examined in the tensile experiments as well as varying its layer thickness in 15 steps. The total conditions performed concerning the core infill density, pattern, and thickness resulted in 225 measurements. Considering the harmonization of these settings, there is an optimal point where the load capacity is best as it relates to weight (force/mass). The obtained results were plotted in curves to determine the optimum load-bearing capacity at what inner layer height could be found. The modeling outcomes showed that the maximum load capacity what the outer and inner layers can withstand is different (the outer layer is always weaker). Further, the load capacity efficiency increases at a filling density of 40% regardless of the filling pattern. On the contrary, the filling density of 100% did not reveal a difference in the specific load capacity despite increasing the core thickness because its filling ratio is the same as the outer sandwich’s layers. This study demonstrated that the proper control of the manufacturing settings of a multi-layered structure would significantly influence the weight and load capacity of the product and thus improve the material properties. That would also be reflected in the material consumption and the running time of the production machine.
-
Author contributions: All the authors have accepted responsibility for the entire content of this submitted manuscript and approved submission.
-
Research funding: None declared.
-
Conflict of interest statement: The authors declare that they have no conflicts of interest regarding this article.
References
1. Baz, B., Aouad, G., Remond, S. Effect of the printing method and mortar’s workability on pull-out strength of 3D printed elements. Construct. Build. Mater. 2020, 230, 117002; https://doi.org/10.1016/j.conbuildmat.2019.117002.Search in Google Scholar
2. Kozior, T., Mamun, A., Trabelsi, M., Sabantina, L., Ehrmann, A. Quality of the surface texture and mechanical properties of FDM printed samples after thermal and chemical treatment. Strojniški Vestn. – J. Mech. Eng. 2020, 66, 105–113.10.5545/sv-jme.2019.6322Search in Google Scholar
3. Ngo, T. D., Kashani, A., Imbalzano, G., Nguyen, K. T. Q., Hui, D. Additive manufacturing (3D printing): a review of materials, methods, applications and challenges. Compos. B Eng. 2018, 143, 172–196; https://doi.org/10.1016/j.compositesb.2018.02.012.Search in Google Scholar
4. Attaran, M. The rise of 3-D printing: the advantages of additive manufacturing over traditional manufacturing. Bus. Horiz. 2017, 60, 677–688; https://doi.org/10.1016/j.bushor.2017.05.011.Search in Google Scholar
5. Torres, J., Cotelo, J., Karl, J., Gordon, A. P. Mechanical property optimization of FDM PLA in shear with multiple objectives. JOM 2015, 67, 1183–1193; https://doi.org/10.1007/s11837-015-1367-y.Search in Google Scholar
6. Hanon, M. M., Marczis, R., Zsidai, L. Anisotropy evaluation of different raster directions, spatial orientations, and fill percentage of 3D printed PETG tensile test specimens. Key Eng. Mater. 2019, 821, 167–173; https://doi.org/10.4028/www.scientific.net/kem.821.167.Search in Google Scholar
7. Peng, A., Xiao, X., Yue, R. Process parameter optimization for fused deposition modeling using response surface methodology combined with fuzzy inference system. Int. J. Adv. Manuf. Technol. 2014, 73, 87–100; https://doi.org/10.1007/s00170-014-5796-5.Search in Google Scholar
8. Hanon, M. M., Zsidai, L., Ma, Q. Accuracy investigation of 3D printed PLA with various process parameters and different colors. Mater. Today Proc. 2021, 42, 3089–3096; https://doi.org/10.1016/j.matpr.2020.12.1246.Search in Google Scholar
9. Vijayaraghavan, V., Garg, A., Lam, J. S. L., Panda, B., Mahapatra, S. S. Process characterisation of 3D-printed FDM components using improved evolutionary computational approach. Int. J. Adv. Manuf. Technol. 2015, 78, 781–793; https://doi.org/10.1007/s00170-014-6679-5.Search in Google Scholar
10. Alaimo, G., Marconi, S., Costato, L., Auricchio, F. Influence of meso-structure and chemical composition on FDM 3D-printed parts. Compos. B Eng. 2017, 113, 371–380; https://doi.org/10.1016/j.compositesb.2017.01.019.Search in Google Scholar
11. Hanon, M. M., Marczis, R., Zsidai, L. Impact of 3D-printing structure on the tribological properties of polymers. Ind. Lubric. Tribol. 2020, 72, 811–818; https://doi.org/10.1108/ilt-05-2019-0189.Search in Google Scholar
12. Sood, A. K., Ohdar, R. K., Mahapatra, S. S. Parametric appraisal of mechanical property of fused deposition modelling processed parts. Mater. Des. 2010, 31, 287–295; https://doi.org/10.1016/j.matdes.2009.06.016.Search in Google Scholar
13. Hanon, M. M., Marczis, R., Zsidai, L. Influence of the 3D printing process settings on tensile strength of PLA and HT-PLA. Period. Polytech. – Mech. Eng. 2020, 65, 38–46; https://doi.org/10.3311/ppme.13683.Search in Google Scholar
14. Fatimatuzahraa, A. W., Farahaina, B., Yusoff, W. A. The effect of employing different raster orientations on the mechanical properties and microstructure of fused deposition modeling parts. In 2011 IEEE Symposium on Business, Engineering and Industrial Applications (ISBEIA); IEEE: Langkawi, Malaysia, 2011; pp. 22–27.10.1109/ISBEIA.2011.6088811Search in Google Scholar
15. Durgun, I., Ertan, R. Experimental investigation of FDM process for improvement of mechanical properties and production cost. Rapid Prototyp. J. 2014, 20, 228–235; https://doi.org/10.1108/rpj-10-2012-0091.Search in Google Scholar
16. Li, H., Wang, T., Sun, J., Yu, Z. The effect of process parameters in fused deposition modelling on bonding degree and mechanical properties. Rapid Prototyp. J. 2018, 24, 80–92; https://doi.org/10.1108/rpj-06-2016-0090.Search in Google Scholar
17. Sood, A. K., Ohdar, R. K., Mahapatra, S. S. Experimental investigation and empirical modelling of FDM process for compressive strength improvement. J. Adv. Res. 2012, 3, 81–90; https://doi.org/10.1016/j.jare.2011.05.001.Search in Google Scholar
18. Baich, L., Manogharan, G., Marie, H. Study of infill print design on production cost-time of 3D printed ABS parts. Int. J. Rapid Manuf. 2015, 5, 308; https://doi.org/10.1504/ijrapidm.2015.074809.Search in Google Scholar
19. Onwubolu, G. C., Rayegani, F. Characterization and optimization of mechanical properties of ABS parts manufactured by the fused deposition modelling process. Int. J. Manuf. Eng. 2014, 2014, 1–13; https://doi.org/10.1155/2014/598531.Search in Google Scholar
20. Ziemian, C., Sharma, M., Ziemi, S. Anisotropic mechanical properties of ABS parts fabricated by fused deposition modelling. In Mechanical Engineering; InTech: Rijeka, Croatia, 2012.10.5772/34233Search in Google Scholar
21. Ziemian, S., Okwara, M., Ziemian, C. W. Tensile and fatigue behavior of layered acrylonitrile butadiene styrene. Rapid Prototyp. J. 2015, 21, 270–278; https://doi.org/10.1108/rpj-09-2013-0086.Search in Google Scholar
22. Żur, P. Finite elements analysis of PLA 3D-printed elements and shape optimization. Eur. J. Eng. Sci. Technol. 2019, 2, 59–64.10.33422/5ist.2018.12.118Search in Google Scholar
23. Żur, p. Influence of 3D-printing parameters on mechanical properties of PLA defined in the static bending test. Eur. J. Eng. Sci. Technol. 2019, 2, 65–70.10.33422/EJEST.2019.01.52Search in Google Scholar
24. International Organization for Standardization. ISO 527-2:2012: Plastics – Determination of Tensile Properties – Part 2: Test Conditions for Moulding and Extrusion Plastics; International Organization of Standardization: Geneva, Switzerland, 2012.Search in Google Scholar
25. International Organization for Standardization. ISO 527-1:2012 – Plastics – Determination of Tensile Properties – Part 1; General Principles; International Organization of Standardization: Geneva, Switzerland, 2012.Search in Google Scholar
26. ISO E. N. 178: 2019 Plastics—Determination of Flexural Properties; Int. Organ. Stand.: Geneva, Switz, 2019.Search in Google Scholar
27. Fernandez-Vicente, M., Calle, W., Ferrandiz, S., Conejero, A. Effect of infill parameters on tensile mechanical behavior in desktop 3D printing. 3D Print. Addit. Manuf. 2016, 3, 183–192; https://doi.org/10.1089/3dp.2015.0036.Search in Google Scholar
28. Hanon, M. M., Alshammas, Y., Zsidai, L. Effect of print orientation and bronze existence on tribological and mechanical properties of 3D-printed bronze/PLA composite. Int. J. Adv. Manuf. Technol. 2020, 108, 553–570; https://doi.org/10.1007/s00170-020-05391-x.Search in Google Scholar
29. Dave, H. K., Patadiya, N. H., Prajapati, A. R., Rajpurohit, S. R. Effect of infill pattern and infill density at varying part orientation on tensile properties of fused deposition modeling-printed poly-lactic acid part. Proc. Inst. Mech. Eng. Part C J. Mech. Eng. Sci. 2019, 235, 1811–1827, https://doi.org/10.1177/0954406219856383.Search in Google Scholar
30. Srinivasan, R., Ruban, W., Deepanraj, A., Bhuvanesh, R., Bhuvanesh, T. Effect on infill density on mechanical properties of PETG part fabricated by fused deposition modelling. Mater. Today Proc. 2020, 27, 1838–1842; https://doi.org/10.1016/j.matpr.2020.03.797.Search in Google Scholar
31. Lubombo, C., Huneault, M. A. Effect of infill patterns on the mechanical performance of lightweight 3D-printed cellular PLA parts. Mater. Today Commun. 2018, 17, 214–228; https://doi.org/10.1016/j.mtcomm.2018.09.017.Search in Google Scholar
© 2021 Walter de Gruyter GmbH, Berlin/Boston
Articles in the same Issue
- Frontmatter
- Material Properties
- Dynamic crystallization behavior of PA-12/PP-MWCNT nanocomposites: non-isothermal kinetics approach
- Effect of antiblock and slip additives on the properties of tubular quenched polypropylene film
- A local green composite study: the effect of edible oil on the morphological and mechanical properties of PBS/bentonite composite
- Effect of infill density and pattern on the specific load capacity of FDM 3D-printed PLA multi-layer sandwich
- Improving the rheological properties of water-based calcium bentonite drilling fluids using water-soluble polymers in high temperature applications
- Mechanical, thermal and morphological properties of polyoxymethylene nanocomposite for application in gears of diaphragm gas meters
- Preparation and Assembly
- Capacitive performance of electrochemically deposited Co/Ni oxides/hydroxides on polythiophene-coated carbon-cloth
- Engineering and Processing
- Nano-SiO2/hydroxyethyl cellulose nanocomposite used for 210 °C sedimentation control of petroleum drilling fluid
- Removal of crystal violet from water by poly acrylonitrile-co-sodium methallyl sulfonate (AN69) and poly acrylic acid (PAA) synthetic membranes