Novel proton exchange membranes based on PVC for microbial fuel cells (MFCs)
-


Abstract
Proton exchange membranes (PEMs), used as separators, are one of the important components in microbial fuel cells (MFCs). The efficiency of MFC is greatly influenced by PEM. Nafion, which is a commonly used membrane, has several disadvantages in addition to its high cost. The aim of the present work was to develop low-cost PEMs with higher conductivity. In the current work, membranes were prepared using comparatively cheaper material polyvinyl chloride with different concentrations of silica (SiO2), citric acid and phosphotungstic acid (PWA) by the solution casting method. Different membrane properties such as surface morphology, water uptake capacity, ion exchange capacity (IEC), tensile strength, leaching test and potential applications in MFCs were investigated. The results showed that the prepared membrane with 10% silica has the highest water uptake of 55.8%. The IEC of prepared membranes was found to vary from 0.024 to 0.875 meq/g. The membranes showing better IEC were applied to the MFC. The maximum power density obtained was 43.91 m W/cm2 in the case of a membrane with both 5% PWA and 5% silica. The results obtained make this membrane a promising and economically viable new material in MFC applications.
1 Introduction
Alternative sources of energy are always an important area of research due to the increasing global energy crisis [1], [2], [3], [4]. Fuel cells have emerged as one of the promising candidates for alternative energy due to its efficient and environmentally benign nature [5], [6]. In microbial fuel cells (MFCs), bacterial energy is converted to electricity [7]. MFCs provide opportunity for sustainable production of energy from biodegradable and renewable sources [7], [8]. This is a widely studied fuel cell due to its simple operation, low maintenance, high energy density and low cost. This type of cell has simultaneous applications in the treatment of wastewater and energy recovery [9], [10]. One of the vital components of any MFC is its proton exchange membrane (PEM), which must possess properties like high energy density, leak proof, high electrical conductivity and thermal stability [11], [12].
Polymeric PEMs have been receiving a great deal of attention due to their possible applications in various electrochemical devices [13], [14], [15]. The best example is Nafion, which has excellent proton conductivity (0.017 S cm−1) but is expensive and has certain issues related with its operation at high temperature [16], [17], [18]. This prompted the interest in developing low-cost, thermally and chemically stable PEM for applications in storage devices like fuel cells and batteries. In order to overcome the shortcomings of existing membranes without compromising conductivity (efficiency), the present work is focused on the synthesis and evaluation of a new PEM using the low-cost material polyvinyl chloride (PVC). PVC is widely used for membrane preparation due to its mechanical stability and flexibility [19], [20], [21], [22]. The widespread use of PVC is attributed mainly to the presence of lone pair electrons at the chlorine atom where inorganic salts can be solvated and the dipole-dipole interaction between the hydrogen and chlorine atoms can stiffen the polymer backbone [23]. Previously PVC-based polymer electrolytes could not be made successfully, but this problem was overcome by preparing the membrane using the solution casting method [24]. The thermodynamic and mechanical stability of polymer hybrid membranes is known to be better than that of pure polymers [25], [26], [27], [28]. Incorporation of inorganic additives results into improved membrane properties by utilizing the specific properties of fillers [29], [30], [31]. Silica, citric acid and phosphotungstic acid (PWA) are used as dopants to the polymeric materials for improving properties of the membrane in the present work.
2 Materials and methods
2.1 Experimental material
Silica, citric acid and DMF were purchased from Merck, Mumbai, India and were of analytical grade and used without further purifications. PWA (H3PW12O40·nH2O) and PVC (Mol Wt ~48,000) were purchased from Sigma, USA. De-ionized water was used for all the experiments performed.
2.2 Membrane preparation
The polymeric films of pure PVC and different compositions of PVC complexed with silica, citric acid and PWA were prepared in various weight percent ratios by solution casting method using dimethylformamide (DMF) as a solvent. The preparation was preceded by dissolving PVC resin into DMF and stirring until a homogenous solution is obtained. This was followed by dispersing a predetermined amount of silica (1, 2, 5 and 10%, w/w), citric acid (10 and 20%, v/w) and PWA acid (1, 3 and 5%, w/w) (Table 1) to the PVC solution with constant stirring at room temperature (40°C) which continued for 1 h. The solution was then allowed to cool below room temperature (20°C) for 6 h, so as to form the gel, and then cast onto polypropylene dishes. The solvent was evaporated by keeping the dishes in an oven at a temperature of 50°C for 1 day followed by 4 days at room temperature.
The various combinations of samples prepared using PVC (2 g).
| Serial no. | Sample no. | SiO2 (w/w) % | Citric acid (v/w) | PWA (w/w) % |
|---|---|---|---|---|
| 1 | A | – | – | – |
| 2 | B | 1 | – | – |
| 3 | C | 2 | – | – |
| 4 | D | 5 | – | – |
| 5 | E | 10 | – | – |
| 6 | F | 5 | 10 | – |
| 7 | G | 10 | 10 | – |
| 8 | H | 5 | 20 | – |
| 9 | I | 10 | 20 | – |
| 10 | J | – | – | 1 |
| 11 | K | 5 | – | 1 |
| 12 | L | 5 | – | 3 |
| 13 | M | 5 | – | 5 |
2.2.1 Leaching test of PWA from polymeric membranes for samples J to M
A sample of the synthesized membrane containing PWA (2×2 cm) was immersed in 100 ml of water, and the concentration of PWA in water was determined at a regular interval using a UV-visible spectrophotometer (Agilent Technologies, Double Beam, Cary 300 UV-Vis), taking absorbance measurements at 292 nm. A calibration curve relating the PWA concentration to absorbance at 292 nm was used to calculate the PWA concentration in the aqueous phase (Figure 1).
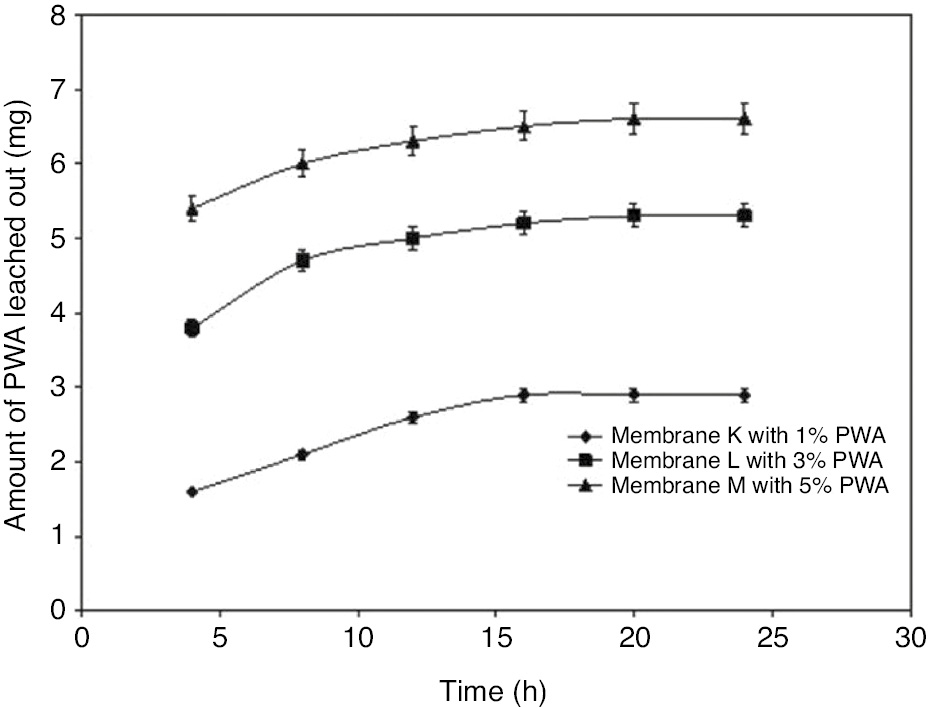
Amount of PWA leached out.
2.3 Membrane characterization
2.3.1 Morphological studies
Surface morphologies of the prepared membranes (or polymeric films) were investigated by scanning electron microscopy (SEM) (Figure 2).

SEM of synthesized membranes. (A, B) Pure PVC, (C, D) PVC +10% silica, (E, F) PVC +5% silica +5% PWA.
2.3.2 Tensile strength
Mechanical stability of membrane M and Nafion was determined by using an Instron Universal Materials Testing System (model 3369) (Figure 3).

Tensile test for Nafion 117 and membrane M. Tensile test for (A) Nafion-117 and (B) membrane M.
2.3.3 Water uptake analysis
The water uptake analysis was carried out by taking the dry and wet weight ratio of the prepared membranes. First, the weights of the dry membranes were taken. Then, the membranes were immersed for 24 h in a glass beaker (100 ml) with distilled water (50 ml) at room temperature. The samples were taken out and surface water was removed with absorbent paper to obtain the wet weight. The percentage of water uptake was calculated by the following equation [32]:
where Ww is the weight after immersing the samples in water and Wd is the dry weight, respectively. The results are reported in Figure 4.

Water uptake of prepared membranes.
2.3.4 Ion exchange capacity (IEC)
The IEC of the prepared membranes was evaluated using titration. The membranes were converted to their protonic form by immersing in a 1 m HCl solution for 24 h, and then the membranes were washed with distilled water to remove excess acid. Subsequently, the membranes were placed in a 0.1 m NaCl solution for 24 h, and then the solution was titrated with 0.01 m NaOH. The IEC was calculated using the following equation [33]:
where m is the mass (g) of dry membrane. The results are given in Figure 5.

IEC of prepared membranes.
2.4 Application in MFC
2.4.1 Bacterial culture for MFC
The bacterial species Alcaligens faecalis NCIM 2949 was obtained from the National Chemical Laboratory, Pune. The bacteria was incubated in Luria-Bertani medium containing tryptone (10 g/l), yeast extract (5 g/l) and NaCl (10 g/l). The pH of the medium was 7.0–7.5. Cells were grown at 37°C for 18 h at 200 rpm.
2.4.2 MFC construction
2.4.2.1 Two chambers with membrane
The setup consisted of two ARISTO airtight plastic containers (1500 ml) with holes of 1-inch diameter cut in the center of their broader face. The chambers were connected by an arrangement of PVC pipes (9-inch length). Synthesised membranes were inserted into the union by easy dissembling of union. Anode (graphite) and cathode (copper) were inserted into the chamber by making the required holes in the cover of the airtight containers. The electrodes were connected with an aluminum wire (16.54×10⁻⁴ Ω). The wires were than attached to the two electrodes of the multimeter (UNI-T) with an electrical tape (Steel Grip). All the vacant surfaces were sealed using M-Seal (PIDLITE) to make the anode chamber completely anaerobic.
2.4.2.2 Anolyte composition
The anode compartment was filled with medium containing NaCl (10 g/l), tryptone (10 g/l), yeast extract (5 g/l), glucose (100 g/l) and cysteine (0.75 g/l).
2.4.2.3 Catholyte composition
The cathode compartments were filled with an equivalent amount of distilled water with electrodes dipped in them.
2.4.2.4 Recording of data
The multimeter (UNI-T) was used to get the readings at the 1-h interval, and the voltage and current were recorded in units of mV and mA, respectively. The power density was calculated by using the equation
where V is the observed voltage, I is the observed current and A is the area of electrode dipped in the medium (5.91 cm2). The results are given in Figures 6–8.
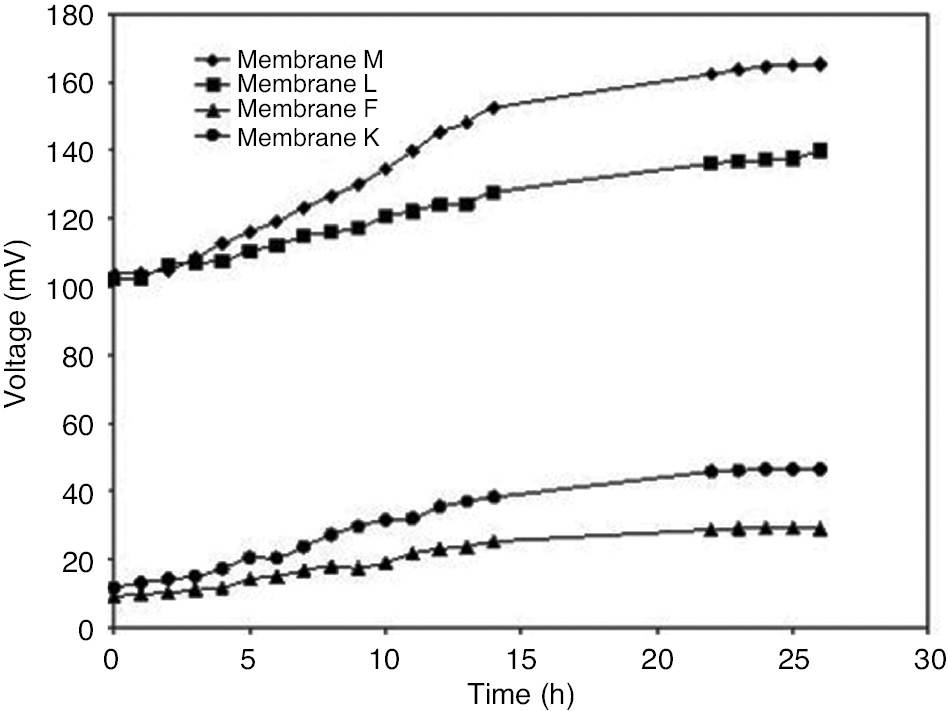
Combined OCV curve of selected prepared membranes applied in MFCs.

Polarization curve of selected prepared membranes applied in MFC. Polarization curves of (A) membrane F, (B) membrane K, (C) membrane L and (D) membrane M.

Power density curve of selected prepared membranes applied in MFC. Power density curves of (A) membrane F, (B) membrane K, (C) membrane L and (D) membrane M.
3 Results and discussion
PVC was chosen as the host polymer due to its inexpensive and easy availability. Also, PVC is compatible with a large number of plasticizers. The film was produced by the solution casting method, and the resulting film bears good mechanical strength. PVC is a water-insoluble polymer, and the literature survey reveals that its water uptake properties are increased by the addition of SiO2 [34], [35], [36], [37]. PWA, a heteropolyacid (HPA), was chosen as a proton conducting phase as HPA shows very strong Brønsted acidity as solid electrolyte, exceeding that of conventional solid acids. PWA has high proton conductivity (0.02–0.1 S cm−1) at room temperature and is thermally stable at higher temperatures [38]. The detailed studies of synthesized membranes have been discussed in the following sections.
3.1 Leaching of PWA from polymeric membrane
Three membranes (K, L and M) containing different amounts of PWA (1, 3 and 5%, w/w, respectively) were subjected to the leaching test to determine the amount of PWA coming out of the membrane. The amounts of PWA leached out at different time periods are shown in Figure 1. The graph shows that the amount of PWA leached out of the membrane increased linearly with time until 16 h, and thereafter no significant leaching was observed. The results show that the amount of PWA left in the membranes was sufficient to provide the enhanced conductivity of membranes.
3.2 Membrane morphology
The membranes are characterized by SEM. Figure 2A–F presents the morphologies of the representative membranes at 2500 magnitudes. SEM micrographs of the three samples – PVC, PVC and silica and PVC, silica and PWA – are shown in Figure 2A–F. In Figure 2A and B, a layered structural characteristic of PVC can be identified, and a smooth and crack-free surface is seen clearly. The images in Figure 2C and D show the morphology of the PVC containing 10% silica where the individual particles of the silica can be seen, resulting in a granular morphology, which is homogenously distributed all over the surface. The average size of the granules is 6–8 μm. In Figure 2E and F, the morphology of the PVC membrane along with silica and PWA is shown, which has a homogenously distributed surface.
3.3 Tensile test
All the prepared membranes contain PVC (2 g), and the mechanical strength of the membrane is due to the PVC matrix. So, the tensile test of membrane M (membrane showing better IEC) and Nafion was carried out. Figure 3 shows the stress – strain curves of the synthesized membrane M and Nafion-117 in the dry state. The synthesized membrane M showed high tensile strength (62 MPa) as compared to Nafion-117 (29 MPa). The higher tensile strength is attributed to the presence of the PVC matrix.
3.4 Water uptake
Water uptake capacity of the prepared membranes is shown in Figure 4. The water uptake of pure PVC is low (4.02%) as compared to those of all the prepared membranes. This is due to the strong hydrophobic character of the groups present there. Meanwhile, the water uptake is observed to increase steadily with the increase in concentration of SiO2, due to the formation of Si-OH bonds, which promotes water retention. Out of the four membranes (membranes B–E) where varying % of SiO2 was introduced, 10% showed a maximum water uptake of 55.8% (membrane E), with comparable water uptake of 46.6% (membrane D) at 5%. Therefore, these two concentrations were further used for preparing other membranes. This is also supported by the literature where water uptake increases with an increase in the % of SiO2 [39].
Further, when citric acid was used (membranes F–I), water uptake reduces as compared to that of SiO2. It shows that the citric acid molecules are chemically bonded to the host polymer, leading to increased cross-linking and reduction in water uptake [40]. Upon the addition of PWA, water uptake increases. This was an expected result since PWA is hydrophilic; therefore, water uptake should increase with an increase in PWA wt% [41], [42].
3.5 Ion exchange capacity
IEC is an important parameter for PEMs. A high IEC is required to ensure high proton conductivity. The results of the IEC are shown in Figure 5. The IEC of the membranes with varying percentage of silica (membranes B to E) are somewhat better than that of virgin membrane A. This is also supported by the literature where the introduction of SiO2 improved the ionic conductivity of membranes at room temperature [43]. The IEC values of the PWA-doped-PVC system vary from 0.63 to 0.875 meq/g. It can be seen that IEC increases almost linearly with PWA doping. Increase in IEC with PWA content is an expected trend since PWA acts as the proton source here. The maximum IEC value of 0.875 meq/g is obtained with 5% PWA (w/w) but is lower than that of Nafion-117 (0.98 meq/g) [44].
3.6 Fuel cell analysis
3.6.1 Performance of prepared membranes in MFC
The effect of a PEM on an MFC’s performance is commonly determined according to generated power density. The membranes showing better IEC (membranes F, K, L and M) were selected for an MFC setup. Membrane F was preferred over J, as J does not contain SiO2. Open circuit voltage (OCV) curve, polarization curve and power density curve were then plotted for each run. The combined OCV curve of all the membranes is shown in Figure 6. In all the four membranes, voltage gets stabilized after 22 h. The maximum voltage achieved was found to be 165.2 mV in the case of membrane M, followed by 140.1 (membrane L), 46.5 (membrane K) and 29.1 (membrane F).
The polarization curve was obtained by plotting the voltage (mV) vs. current (mA). Figure 7A–D shows the polarization curve of the different membranes within the MFC systems. The polarization curve was mostly used to find the internal resistance of the system. The internal resistance can be calculated by the slope of the I-V curve. From the polarization curves, it is clear that membrane M shows a better I-V relationship.
3.6.2 Calculation of power density
The power density for each run was calculated by using the following formula:
where V is the observed voltage, I is the observed current and A is the area of electrode dipped in the medium.
The maximum power densities obtained were 44 mW/cm2 in the case of membrane M (with 5% silica and 5% PWA) and 21 mW/cm2 in the case of membrane L (with 5% silica and 3% PWA) (Figure 8). Nafion-117 membrane has, until now, been used as a source of PEM connecting the anode and cathode chambers in a two-chamber system. Here, we have obtained a good amount of power density using a newly synthesized polymer membrane.
4 Conclusion
In the present work, various membranes were prepared by using the PVC polymer, which was modified by using different concentrations of dopants such as silica, citric acid and PWA acid, and their corresponding water uptake was studied. The introduction of the inorganic load was favorable for the adsorption of water due to the hygroscopic nature of the silica gel, and it also improves the ionic conductivity of polymer electrolytes by affecting the crystallinity of the host polymer. However, excessive silica amounts can cause agglomeration of the particles, affecting the mechanical properties due to the lack of homogenization inside the material. To increase the conductivity, citric acids and PWA, an HPA, have been used here. The water uptake percentage and the IEC of the resulting membranes were also found to increase with increasing concentration. For fuel cell usage, the OCV curve, polarization curve and power density curve were plotted to check the efficiency of the membranes. The power density obtained in the case of these membranes as PEMs showed encouraging results. This work ultimately results into developing membranes using easily available and low-cost materials, resulting in cost reduction. On the basis of power density vs. time plots of the MFC configurations set up by us, we conclude that some of the prepared membranes used are very efficient when the factor of highest power density is considered.
Low-cost, stable membranes with high ionic conductivity are required for the widespread adoption of polymer electrolyte membrane for application in fuel cells. The present work is an effort in this direction.
Acknowledgments
We thank the thin film and materials lab and the polymer processing lab, Delhi Technological University for providing instrumental facility to carry out the morphological and tensile studies of prepared membranes.
References
[1] Heinberg R, Fridley D. Nature 2010, 468, 367–369.10.1038/468367aSearch in Google Scholar PubMed
[2] Kinkus J. Ref. Revi. 2009, 23, 42–43.10.1108/09504120910979022Search in Google Scholar
[3] Balat M. Int. J. Green Energy 2008, 5, 212–3833.10.1080/15435070802107322Search in Google Scholar
[4] Gaurav K, Srivastava R, Singh R. Int. J. Green Energy 2013, 10, 775–796.10.1080/15435075.2012.726673Search in Google Scholar
[5] Zhang L, Chae SR, Hendren Z, Park JS, Wiesner MR. Chem. Eng. J. 2012, 204206, 87–97.10.1016/j.cej.2012.07.103Search in Google Scholar
[6] Liu H, Logan BE. Environ. Sci. Technol. 2004, 38, 4040–4046.10.1021/es0499344Search in Google Scholar PubMed
[7] Jafary T, Rahimnejad M, Ghoreyshi AA, Najafpour G, Hghparast F, Daud WRW. Energy Convers. Manage. 2013, 75, 256–262.10.1016/j.enconman.2013.06.032Search in Google Scholar
[8] Sevda S, Sreekrishnan TR. J. Envi. Sci. Health A 2012, 47, 878–886.10.1080/10934529.2012.665004Search in Google Scholar PubMed
[9] Pant D, Bogaert GV, Diels L, Vanbroekhoven K. Biores. Technol. 2010, 101, 1533–1543.10.1016/j.biortech.2009.10.017Search in Google Scholar PubMed
[10] Liu H, Ramnarayanan R, Logan BE. Environ. Sci. Technol. 2004, 38, 2281–2285.10.1021/es034923gSearch in Google Scholar PubMed
[11] Bhide A, Hariharan K. J. Power Sources 2006, 159, 1450–1457.10.1016/j.jpowsour.2005.11.096Search in Google Scholar
[12] Li G, Xie J, Cai H, Qiao J. Int. J. Hydrog. Energy 2014, 39, 2639–2648.10.1016/j.ijhydene.2013.11.049Search in Google Scholar
[13] Hickner MA, Ghassemi H, Kim YS, Einsla BR, McGrath JE. Chem. Rev. 2004, 104, 4587–4612.10.1021/cr020711aSearch in Google Scholar
[14] Li Q, He R, Jensen JO, Bjerrum NJ. Chem. Mater. 2003, 15, 4896–4915.10.1021/cm0310519Search in Google Scholar
[15] Rozière J, Jones DJ. Annu. Rev. Mater. Res. 2003, 33, 503–555.10.1146/annurev.matsci.33.022702.154657Search in Google Scholar
[16] Kreuer KD. J. Membr. Sci. 2001, 185, 29–39.10.1016/S0376-7388(00)00632-3Search in Google Scholar
[17] Mauritz KA, Moore RB. Chem Rev. 2004, 104, 4535–4586.10.1021/cr0207123Search in Google Scholar PubMed
[18] Collier A, Wang H, Yuan XZ, Zhang J, Wilkinson DP. Int. J. Hydrog. Energy 2006, 31, 1838–1854.10.1016/j.ijhydene.2006.05.006Search in Google Scholar
[19] Hosseini SM, Askari M, Koranian P, Madaeni SS, Moghadassi AR. J. Ind. Eng. Chem. 2014, 20, 2510–2520.10.1016/j.jiec.2013.10.034Search in Google Scholar
[20] Hosseini SM, Madaeni SS, Zendehnam A, Moghadassi AR, Khodabakhshi AR, Sanaeepur H. J. Ind. Eng. Chem. 2013, 19, 854–862.10.1016/j.jiec.2012.10.031Search in Google Scholar
[21] Hosseini SM, Madaeni SS, Heidari AR, Amirimehr A. Desalination 2012, 284, 191–199.10.1016/j.desal.2011.08.057Search in Google Scholar
[22] Akli K, Khoiruddin K, Wenten IG. J. Membr. Sci. Res. 2016, 2, 141–146.Search in Google Scholar
[23] Ramesh S, Teh GB, Louh RF, Hou YK, Sin PY, Yi LJ. Sadhna 2010, 35, 87–95.10.1007/s12046-010-0002-4Search in Google Scholar
[24] Rajendran S, Babu RS, Devi KR. Ionics 2009, 15, 61–66.10.1007/s11581-008-0222-3Search in Google Scholar
[25] Rana D, Mandal BM, Bhattacharyya SN. Macromolecules 1996, 29, 1579–1583.10.1021/ma950954nSearch in Google Scholar
[26] Rana D, Bag K, Bhattacharyya SN, Mandal BM. J. Polym. Sci. Polym. Phys. Ed. 2000, 38, 369–375.10.1002/(SICI)1099-0488(20000201)38:3<369::AID-POLB3>3.0.CO;2-WSearch in Google Scholar
[27] Marani D, Di Vona ML, Traversa E, Licoccia S, Beurroies I, Liewellyn PL, Knauth P. J. Phys. Chem. B, 2006, 110, 15817–15823.10.1021/jp062085hSearch in Google Scholar
[28] Arsalan M, Khan MMA, Rafiuddin. Desalin. Water Treat. 2015, 56, 1737–1745.10.1080/19443994.2014.951969Search in Google Scholar
[29] Unveren EE, Erdogan T, Çelebi SS, Inan TY. Int. J. Hydrog. Energy 2010, 35, 3736–3744.10.1016/j.ijhydene.2010.01.041Search in Google Scholar
[30] Woo JJ, Seo SJ, Yun SH, Fu RQ, Yang TH, Moon SH. J. Membr. Sci. 2010, 363, 80–86.10.1016/j.memsci.2010.07.009Search in Google Scholar
[31] Jon N, Samad NAb, Abdullah NA, Abdullah I, Othaman R. J. App. Poly. Sci. 2013, 129, 2789–2795.10.1002/app.38997Search in Google Scholar
[32] Wang J, Jiang S, Zhang H, Lv W, Yang X, Jiang Z. J. Membr. Sci. 2010, 364, 253–262.10.1016/j.memsci.2010.08.026Search in Google Scholar
[33] Zaidi SMJ. Arabian J. Sci. Eng. 2003, 28, 183–194.10.1038/sj.bdj.4809906Search in Google Scholar
[34] Sukeshini AM, Nishimoto A, Watanabe M. Solid State Ion. 1996, 8688, 385–393.Search in Google Scholar
[35] Rajendran S, Uma T. Ionics 2001, 7, 122–125.10.1007/BF02375478Search in Google Scholar
[36] Rajendran S, Babu RS, Sivakumar P. J. Membr. Sci. 2008, 315, 67–73.10.1016/j.memsci.2008.02.007Search in Google Scholar
[37] Subban RHY, Arof AK. Euro. Poly. J. 2004, 40, 1841–1847.10.1016/j.eurpolymj.2004.03.026Search in Google Scholar
[38] Mioč U, Davidovič M, Tjapkin N, Colomban P, Novak A. Solid State Ion. 1991, 46, 103–109.10.1016/0167-2738(91)90136-YSearch in Google Scholar
[39] Sethupathy M, Sethuraman V, Manisankar P. Soft Nanosc. Lett. 2013, 3, 37–43.10.4236/snl.2013.32007Search in Google Scholar
[40] Izhar SMM, Shaari KZK, Man Z, Samsudin YN. App. Mech. and Mate. 2014, 625, 123–126.10.4028/www.scientific.net/AMM.625.123Search in Google Scholar
[41] Li L, Wang Y. Chin. J. Chem. Eng. 2002, 10, 614–617.10.1023/A:1020922921422Search in Google Scholar
[42] Li L, Xu L, Wang Y. Mate. Lett. 2003, 57, 1406–1410.10.1016/S0167-577X(02)00998-9Search in Google Scholar
[43] Xu W, Liu C, Xue X, Su Y, Lv Y, Xing W, Lu T. Solid State Ion. 2004, 171, 121–127.10.1016/j.ssi.2004.04.009Search in Google Scholar
[44] Lin CW, Thangamuthu R, Yang CJ. J. Membr. Sci. 2005, 253, 23–31.10.1016/j.memsci.2004.12.021Search in Google Scholar
©2019 Walter de Gruyter GmbH, Berlin/Boston
Articles in the same Issue
- Frontmatter
- Material properties
- Chemical and biological effects of low pressure N2-O2 plasma setup on polymeric materials
- Effect of aging conditions on the mechanical properties and antimicrobial activity of elastomer nanocomposites
- Creep and dynamic mechanical behavior of cross-linked polyvinyl alcohol reinforced with cotton fiber laminate composites
- Preparation and assembly
- Foam rubber from centrifuged and creamed latex
- Preparation and properties of multi-walled carbon nanotubes and eggshell dual-modified polycaprolactone composite scaffold
- Effectiveness of a coagulation step and polyester support on blend polyvinylchloride membrane formation and performance
- Novel proton exchange membranes based on PVC for microbial fuel cells (MFCs)
- Preparation of graphene-based compounds with improved dispersion by a two-stage production process
- Engineering and processing
- Implementation of partial slip boundary conditions in an open-source finite-volume-based computational library
- Ultrasonic measurement of clamping force for injection molding machine
- Experimental and simulation studies on the mold replicability in the thermoforming process