Slags from Bronze Age copper production in Acqua Fredda
-
R. Haubner
Roland Haubner is Ao.Univ.Prof. at TU-Wien. His fields of activity till now were industrial tungsten production, CVD (Chemical Vapor Deposition) and the low-pressure diamond deposition. He is also involved in materials characterization, ceramics, corrosion and archaeometallurgy.
Suanne Strobl is working as a scientific officer at the Institute of Chemical Technologies and Analytics (TU-Wien) and is teaching supervisor of metallography. She studied chemistry and her doctoral thesis was about sintered steels.

Abstract
So-called “plate slags” from the archaeological Bronze Age copper smelting site Acqua Fredda were examined. What was common to all the examined slags was that their compositions, once converted and plotted on the FeO-SiO2-CaO phase diagram, were located at the phase boundary between olivine and wollastonite, resulting in melting temperatures of approx. 1100 °C for the slags. Slags with a composition which fall within the olivine region exhibit long, thin olivine crystals in a glassy matrix. Slags in the wollastonite region have a very fine-grained structure, making phase identification impossible. The copper-containing inclusions in the slag mainly consist of Fe-poor Cu2S, but FeO and SiO2 may also be present.
General assertions about the local copper production in Acqua Fredda should not be made based on the slag analyses conducted in this study.
Kurzfassung
Von der archäologischen Fundstelle Acqua Fredda konnten Plattenschlacken der bronzezeitlichen Kupferverhüttung untersucht werden. Allen untersuchten Schlacken ist gemeinsam, dass ihre Zusammensetzungen, umgerechnet auf das FeO-SiO2-CaO Phasendiagramm, an der Phasengrenze von Olivin und Wollastonit liegen. Daraus ergeben sich Schlackenschmelztemperaturen um 1100 °C. Schlacken mit einer Zusammensetzung, die eher im Olivingebiet liegt, zeigen lange, dünne Olivinkristalle in einer Glasmatrix. Schlacken im Wollastonitgebiet sind sehr feinkörnig aufgebaut, weshalb eine Unterscheidung von Phasen nicht möglich war. Kupferhaltige Schlackeneinschlüsse bestehen überwiegend aus Fe-armem Cu2S, daneben können noch FeO und SiO2 vorliegen.
Generelle Aussagen über die lokale Kupferproduktion in Acqua Fredda sollten aus den vorliegenden Schlackenanalysen aber nicht abgeleitet werden.
1 Introduction
In prehistoric times, copper ore was already mined and smelted at different sites in Europe [1]. The smelting methods were largely dependent on the type of ore deposits available and later on, metallurgy was influenced by the production of alloys such as bronze [2, 3]. After most smelting stages, slags remain as waste material so that the examination of slags may reveal quite a bit about how they were formed, but certainly, not everything. Simple average chemical analyses are not conclusive since the phases which had not been fully molten (e. g., quartz) lead to erroneous conclusions about the melting behavior of the slags. Metallography can be used to show the homogeneity of the slags and to gain insights into the crystallization behavior of the phases present. Along the way, metallic and ore inclusions can be analyzed as well. [4, 5, 6].
Acqua Fredda is located in the Province of Trentino (Italy) near the Passo del Redebus and is an archaeological site of Bronze Age copper processing [7, 8, 9, 10].
Some of the slags were examined metallographically for subsequent comparison with other slags found in the Alpine region.
2 The slags, sample preparation and examination methods
From the five plate slags that were received, examination results of four of them will be discussed in this paper. For metallographic examination, the slags were sectioned using a cut-off machine with a diamond saw blade. After cold-mounting and plane grinding of the samples, they were each ground and polished down to 1 μm diamond and examined in the as-polished condition under the light optical microscope (LOM) and scanning electron microscope (SEM) equipped with an energy-dispersive X-ray spectroscopy (EDS) detector.
The FeO-SiO2-CaO phase diagram was used to determine the chemical composition of the slags [11]. The element contents obtained by EDS analyses were converted into the respective oxides. Earlier studies have shown that for the calculation, Al2O3 and MgO contents should be added to CaO in order to obtain more realistic melting temperature values in the evaluation [3].
3 Examination results and discussion
The slags examined for this study are classified as plate slags which are thought to have been smelted for the most part and not contain any coarse quartz inclusions.
3.1 Slag piece 1
This plate slag exhibits a smooth, somewhat corrugated surface (Figure 1a). Under the LOM, a homogeneous structure with some individual, spherical and coppery inclusions are observed (Figure 1b). SEM examination revealed that the microstructure consists of olivine crystals of up to 500 μm in length and approx. 10 μm in thickness (Figure 1c). Since this variety of olivine usually contains much iron, it is commonly referred to as fayalite. SEM/ EDS point measurements were performed on characteristic regions of the microstructure and complemented by area measurements (Table 1) (Figure 1d). The composition of a larger olivine crystal was determined and the converted measurement data was plotted on the FeO-SiO2-CaO phase diagram (Figure 1e).

Slag piece 1: a) Photograph, b) LOM, c, d, f) SEM-BSE image, e) Detail of FeO-SiO2-CaO phase diagram with converted SEM-EDS measurement data.
Bild 1a bis f: Schlackenstück 1: a) Foto, b) LOM, c, d, f) REM-BSE Aufnahme, e) Ausschnitt des FeO-SiO2-CaO Phasendiagramm mit berechneten REM-EDX Messwerten.
The composition of a larger olivine crystal was found to be located at the phase boundary between olivine and wüstite (FeO). It is noticeable that little Ca and a good deal of Mg were detected at this point. This is due to the fact that Mg can be incorporated into the olivine much easier under the present conditions (Figure 1e, point 1). Measurements in the region of the socalled glassy phase revealed elevated Al concentrations, shifting the composition towards wollastonite in the phase diagram (Figure 1e, point 2 and point 3). Surface analysis across the entire image shown in Figure 1e revealed a composition located in the middle of the olivine region and close to point 2. Figure 1f shows a (Cu,Fe)S inclusion in the Cu ore of approx. 8 μm in size, with strong variations in the Cu/Fe ratio within this region.
3.2 Slag piece 2
This piece of plate slag exhibits a bulge on the edge (Figure 2a). Under the LOM, rounded and cracked quartz inclusions of up to 500 μm in size are already visible (Figures 2b, c). An ore particle of approx. 500 μm in size is also observed in Figure 2b. Under the SEM, olivine crystals up to 600 μm long and approx. 10 μm thick are visible (Figure 2d). The area measurement across the entire image shown in Figure 2d was performed using SEM/EDS (Table 1) and the measurement data was plotted on the FeO-SiO2-CaO phase diagram (Figure 2e). Due to higher SiO2, as well as CaO contents, the composition of the slag is located at the phase boundary between olivine and wollastonite. In the SEM image shown in Figure 2f, a larger copper-containing inclusion can be seen.

Slag piece 2: a) Photograph, b, c) LOM, d, f) SEM-BSE image, e) Detail of FeO-SiO2-CaO phase diagram with converted SEM/EDS measurement data.
Bild 2a bis f: Schlackenstück 2: a) Foto, b, c) LOM, d, f) REM-BSE Aufnahme, e) Ausschnitt des FeO-SiO2-CaO Phasendiagramm mit berechneten REM-EDX Messwerten.
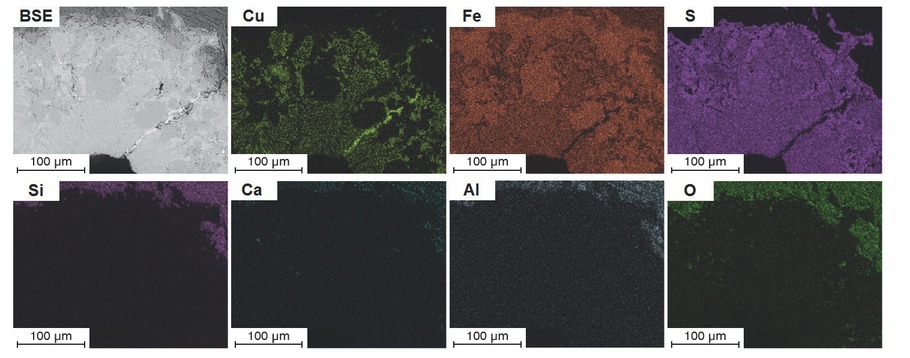
A SEM/EDS elemental distribution map of a selected region was generated (Figure 3).

Slag piece 2, SEM/EDS elemental distribution map of a selected region of the slag.
Bild 3: Schlackenstück 2, REM-EDX Elementverteilung eines Schackenbereichs.
The white inclusion, on the right of the BSE image, as well as some other white spots in the image, mostly contain Cu and S. The gray region in the top left corner contains not only Si, but also Al and K, suggesting an argillaceous inclusion. Regions with an elevated Fe content are interpreted as wüstite (FeO).
Figure 4 shows a SEM/EDS elemental distribution map of a partly reacted ore inclusion. It is clearly visible that both the Cu and Fe sulfides are not distributed homogeneously in this inclusion. A prominent feature is a narrow streak with a high Cu concentration. This streak appearing light in the SEM/BSE image is metallic copper. The elements Si, Ca and Al are also found in the slag, but only outside the inclusion.
Slag piece 2, SEM/EDS elemental distribution map of a copper-containing inclusion in the ore.
Bild 4: Schlackenstück 2, REM-EDX Elementverteilung eines kupferhaltigen Erzeinschlusses.
3.3 Slag piece 3
This slag sample exhibits a partly conchoidal fracture (Figure 5a, left). Under the LOM, no structures are observed within the slag, only various inclusions (Figure 5b). In the SEM image, a granular microstructure can be seen, but no olivine crystals (Figure 5d).

Slag piece 3: a) Photograph, b) LOM, c, d, f) SEM-BSE image, e) Detail of FeO-SiO2-CaO phase diagram with converted SEM/EDS measurement data.
Bild 5a bis f: Schlackenstück 3: a) Foto, b) LOM, c, d, f) REM-BSE Aufnahme, e) Ausschnitt des FeO-SiO2-CaO Phasendiagramm mit berechneten REM-EDX Messwerten.
SEM/EDS area measurements (Table 1) revealed higher Ca, as well as Si values so that the measured composition falls into the wollastonite region in the FeO-SiO2-CaO phase diagram (Figure 5e). In addition, various FeO, as well as Cu(Fe)S inclusions were observed (Figure 5c, f).
SEM/EDS results for the different slag samples [wt.%].
Tabelle 1: REM-EDX Ergebnisse für die verschiedenen Schlackenproben [Gew.%].
| Fig. 1d, Point 1 / Bild 1d, Punkt 1 | Fig. 1d, Point 2 / Bild 1d, Punkt 2 | Fig. 1d, Point 3 / Bild 1d, Punkt 3 | Fig. 1d, Area / Bild 1d, Fläche | Fig. 2d, Area / Bild 2d, Fläche | Fig. 5d, Area / Bild 5d, Fläche | Fig. 7d, Area / Bild 7d, Fläche | |
|---|---|---|---|---|---|---|---|
| Fe | 52 | 45 | 43 | 45 | 39 | 38 | 36 |
| Si | 15 | 16 | 18 | 17 | 18 | 20 | 20 |
| Al | 1.6 | 5.6 | 6.6 | 5.4 | 6.0 | 5.0 | 5.0 |
| Ca | 0.9 | 2.4 | 2.6 | 2.3 | 3.4 | 4.5 | 3.0 |
| Mg | 2.9 | 0.7 | 0.05 | 0.8 | 1.3 | 1.0 | 1.4 |
| Na | – | – | – | – | 1.4 | – | 1.8 |
| K | 0.4 | 1.2 | 0.8 | 1.2 | 1.7 | 1.3 | 1.6 |
| Cu | – | – | – | – | 1.0 | – | – |
| S | 0.2 | 1.0 | 0.7 | 0.9 | 0.9 | 0.5 | 0.6 |
A SEM/EDS elemental distribution map of an inclusion with a complex structure within the sample was generated (Figure 6). The light regions mostly consist of Cu and S. The light gray regions exhibit elevated Fe contents (FeO).

Slag piece 3, SEM/EDS elemental distribution map.
Bild 6: Schlackenstück 3, REM-EDX Elementverteilung.
3.4 Slag piece 4
This slag exhibits a corrugated surface (Figure 7a). Under the LOM, no structures within the slag are observed, merely inclusions with diameters of up to 100 μm (Figure 7b). Similar observations were made under the SEM at low magnification (Figure 7c). At higher magnifications, lamellae are visible in the SEM image, some of them reaching lengths of 400 μm (Figure 7d, f).

Slag piece 4: a) Photograph, b) LOM, c, d, f) SEM-BSE image, e) Detail of FeO-SiO2-CaO phase diagram with converted SEM/EDS measurement data.
Bild 7a bis f: Schlackenstück 4: a) Foto, b) LOM, c, d, f) REM-BSE Aufnahme, e) Ausschnitt des FeO-SiO2-CaO Phasendiagramm mit berechneten REM-EDX Messwerten.
In contrast to other slags, SEM/EDS area measurements (Table 1) revealed higher Ca and Si values so that the measured composition falls into the wollastonite region in the FeO-SiO2-CaO phase diagram (Figure 7e).
4 Summary
The slags from Acqua Fredda are plate slags which most likely formed during one of the final stages of copper production. One characteristic of these plate slags is that they had been fully molten. Also, some isolated and very small quartz inclusions of up to approx. 500 μm in size were found. In addition to quartz, copper-containing inclusions were identified, containing not only Cu, but also Fe and S of varying compositions. Average analyses of the slag microsections by means of SEM/EDS revealed that their compositions are located at the phase boundary between olivine and wollastonite. In the FeO-SiO2-CaO phase diagram, this corresponds to an approximate melting temperature of 1100 °C for the slags. For slags with a composition in the olivine phase region, the microstructure mostly consists of very thin, but long olivine crystals, surrounded by a glassy phase. This olivine morphology has also been described in cases where the melts were subjected to higher cooling rates. The microstructure of slags with a composition falling within the wollastonite region on the other hand, are homogeneous and fine-grained. The coppercontaining inclusions in the slag mostly consist of Fe-poor Cu2S and FeO. In the melting process, these particles were unable to deposit sufficiently fast onto the metallic bun ingot and were thus trapped in the slag.
Given the large size of the Acqua Fredda slag heaps, the examinations carried out for this study should be considered as being based on random samples. Therefore, general assertions about copper production in Acqua Fredda should not be made based on these slag analyses.
1 Einleitung
Bereits in prähistorischer Zeit wurde Kupfererz an verschiedenen Plätzen in Europa bergmännisch abgebaut und verhüttet [1]. Die Verhüttungsmethoden hingen wesentlich von der Art der Erzvorkommen ab und in weiterer Folge beeinflusste die Herstellung von Legierungen, wie z. B. Bronze, die Metallurgie [2, 3]. Bei den meisten Verhüttungsstufen fallen Schlacken als Abfallprodukte an, wodurch die Untersuchungen von Schlacken einiges über deren Entstehung offenbaren können, aber sicher nicht alles. Einfache chemische Durchschnittsanalysen sind nicht aussagekräftig, da nicht aufgeschmolzene Phasen (z. B. Quarz) zu falschen Rückschlüssen auf das Schmelzverhalten der Schlacken führen. Mit der Metallographie ist es einerseits möglich die Homogenität der Schlacken zu zeigen und andererseits werden Informationen über das Kristallisationsverhalten der vorliegenden Phasen erhalten. Ganz nebenbei können auch Metall- und Erzeinschlüsse analysiert werden. [4, 5, 6].
Acqua Fredda liegt in der Provinz Trentino (Italien) in der Nähe des Passo del Redebus und ist eine archäologische Stätte der bronzezeitlichen Kupferverarbeitung [7, 8, 9, 10]
Einige Schlackenstücke wurden metallographisch untersucht, um später Vergleiche mit anderen Schlacken des Alpenraums anstellen zu können.
2 Die Schlackenstücke, Probenpräparation und Untersuchungsmethoden
Von den fünf erhaltenen Plattenschlacken werden die Untersuchungsergebnisse von vieren hier beschrieben. Für metallographische Untersuchungen wurden die Schlacken mit einer Trennmaschine, unter Verwendung eines Diamantsägeblattes, zerkleinert. Nach dem Kalteinbetten und Planschleifen der Proben wurden sie stufenweise bis 1 μm Diamant geschliffen bzw. poliert und im polierten Zustand mittels Lichtmikroskop (LOM) und Rasterelektronenmikroskop (REM) mit angeschlossener energiedispersiver Röntgenanalyse (EDX) untersucht.
Für die Auswertung der chemischen Zusammensetzungen der Schlacken wurde das FeO-SiO2-CaO Phasendiagramm verwendet [11]. Dazu wurden die Elementgehalte der EDX-Analysen in die entsprechenden Oxide umgerechnet. Frühere Arbeiten haben gezeigt, dass bei der Berechnung die Gehalte von Al2O3 und MgO zum CaO gerechnet werden sollten, wodurch realistische Werte für Schmelztemperaturen bei der Auswertung erhalten werden [3].
3 Untersuchungsergebnisse und Diskussion
Die untersuchten Schlackenstücke gehören zur Gruppe der Plattenschlacken, von denen angenommen werden kann, dass sie weitgehend aufgeschmolzen waren und keine groben Quarzeinschlüsse enthalten.
3.1 Schlackenstück 1
Diese Plattenschlacke weist eine glatte, etwas wellige Oberfläche auf (Bild 1a). Im LOM ist eine gleichmäßige Struktur mit vereinzelten, kugeligen, kupferfarbenen Einschlüssen zu erkennen (Bild 1b). Erst im REM zeigt sich, dass das Gefüge aus bis zu 500 μm langen und etwa 10 μm dicken Olivinkristallen besteht (Bild 1c). Da dieser Olivin üblicherweise viel Eisen enthält, wird er gerne als Fayalit bezeichnet. Mittels REM-EDX wurden Punktmessungen an charakteristischen Stellen des Gefüges und Flächenmessungen vorgenommen (Tabelle 1) (Bild 1d). Die Zusammensetzung eines größeren Olivinkristalls wurde bestimmt und die umgerechneten Messwerte in das FeO-SiO2-CaO Phasendiagramm eingetragen (Bild 1e).
Die Zusammensetzung eines größeren Olivinkristalls liegt an der Phasengrenze OlivinWüstit (FeO). Es ist auffällig, dass an diesem Punkt wenig Ca und viel Mg gemessen wird. Dies liegt daran, dass unter den vorliegenden Bedingungen im Olivin das Mg leichter eingebaut wird (Bild 1e, Punkt 1). Bei Messungen in Bereich der sogenannten Glasphase sind die Al-Konzentrationen erhöht, wodurch sich die Zusammensetzung im Phasendiagramm Richtung Wollastonit verschiebt (Bild 1e, Punkt 2 und Punkt 3). Eine Flächenanalyse über das gesamte Bild 1e ergab eine Zusammensetzung mitten im Olivinbereich nahe Punkt 2. Bild 1f zeigt einen etwa 8 μm großen Einschluss aus Cu-Erz (Cu,Fe)S, wobei das Cu:Fe-Verhältnis innerhalb des Bereichs stark schwankt.
3.2 Schlackenstück 2
Dieses Teilstück einer Plattenschlacke weist einen Randwulst auf (Bild 2a). Bereits im LOM sind abgerundete, rissige Quarzeinschlüsse mit einer Größe von bis zu 500 μm zu sehen (Bild 2b, c). In Bild 2b ist auch ein etwa 500 μm großer Erzpartikel erkennbar. Im REM sind wiederum bis zu 600 μm lange und etwa 10 μm dicke Olivinkristallen zu sehen (Bild 2d). Mittels REM-EDX wurde über das gesamte Bild 2d eine Flächenmessung durchgeführt (Tabelle 1) und die Messwerte im FeO-SiO2-CaO Phasendiagramm eingetragen (Bild 2e). Aufgrund höherer SiO2- und CaO-Gehalte liegt diese Schlackenzusammensetzung an der Phasengrenze zwischen Olivin und Wollastonit. Im REM-Bild 2f ist ein größerer kupferhaltiger Einschluss zu sehen.
Von einem ausgewählten Bereich wurde eine REM-EDX Elementverteilung erstellt (Bild 3).
Der weiße Einschluss, rechts im BSE-Bild, und einige weiße Punkte im Bild, enthalten überwiegend Cu und S. Die graue Stelle links oben enthält neben Si auch Al und K, was auf einen tonartigen Einschluss hindeutet. Bereiche mit erhöhtem Fe-Gehalt werden als Wüstit (FeO) gedeutet.
Bild 4 zeigt eine REM-EDX Elementverteilung von einem bereits teilweise umgesetzten Erzeinschluss. Es ist deutlich zu erkennen, dass die Cu- und Fe-Sulfide nicht gleichmäßig in diesem Einschluss verteilt sind. Auffällig ist ein schmaler Streifen mit hoher Cu Konzentration, welcher im REM-BSE-Bild hell erscheint. Dabei handelt es sich um metallisches Kupfer. Die Elemente Si, Ca und Al sind nur außerhalb des Einschlusses in der Schlacke zu finden.
3.3 Schlackenstück 3
Diese Schlacke weist teilweise einen muscheligen Bruch auf (Bild 5a, links). Im LOM sind keine Strukturen innerhalb der Schlacke zu erkennen, sondern nur diverse Einschlüsse (Bild 5b). Auch im REM ist ein körniges Gefüge, jedoch keine Olivinkristalle, zu sehen (Bild 5d).
Die REM-EDX Flächenmessung (Tabelle 1) ergab höhere Ca- und Si-Werte, wodurch der Messwerte im FeO-SiO2-CaO Phasendiagramm dem Wollastonitbereich zugeordnet werden kann (Bild 5e). Es wurden auch verschiedene Einschlüsse aus FeO und Cu(Fe)S beobachtet (Bild 5c, f).
Bei dieser Probe wurde von einem komplex aufgebauten Einschluss eine REM-EDX Elementverteilung erstellt (Bild 6). Die hellen Stellen bestehen überwiegend aus Cu und S. Die hellgrauen Bereiche weisen erhöhte Fe-Gehalte auf (FeO).
3.4 Schlackenstück 4
Diese Schlacke weist eine wellige Oberfläche auf (Bild 7a). Im LOM sind keine Strukturen innerhalb der Schlacke zu erkennen, sondern nur Einschlüsse mit Durchmessern von bis zu 100 μm (Bild 7b). Ähnlich verhält es sich auch bei Aufnahmen im REM bei geringer Vergrößerung (Bild 7c). Bei höheren Vergrößerungen sind Lamellen zu erkennen, die teilweise eine Länge von 400 μm erreichen (Bild 7d, f).
Die REM-EDX Flächenmessung (Tabelle 1) ergab, im Vergleich zu den anderen Schlacken, höhere Ca- und Si-Werte, wodurch der Messwerte im FeO-SiO2-CaO Phasendiagramm dem Wollastonitbereich zugeordnet werden kann (Bild 7e).
4 Zusammenfassung
Bei den vorliegenden Schlacken aus Acqua Fredda handelt es sich um Plattenschlacken, welche aus einem der letzten Produktionsschritte der Kupfergewinnung stammen dürften. Für diese Schlacken ist charakteristisch, dass sie vollständig aufgeschmolzen waren. Es wurden auch nur vereinzelt sehr kleine, bis etwa 500 μm große Quarzeinschlüsse, gefunden. Neben Quarz konnten auch kupferhaltige Einschlüsse identifiziert werden, welche neben Cu auch Fe und S in variierender Zusammensetzung enthielten. Durchschnittsanalysen der Schlacken an metallographischen Schliffen mittels REM-EDX ergaben, dass ihre Zusammensetzungen an der Phasengrenze von Olivin und Wollastonit liegen. Im FeO-SiO2-CaO Phasendiagramm entspricht dies einer ungefähren Schmelztemperatur der Schlacken von 1100 °C. Bei Schlacken mit einer Zusammensetzung im Olivin-Phasengebiet besteht das Gefüge überwiegend aus sehr dünnen, aber langen Olivinkristallen, die von einer Glasphase umgeben sind. Diese Olivinmorphologie wird auch bei höheren Abkühlraten der Schmelzen beschrieben. Das Gefüge von Schlacken mit Wollastonit-Zusammensetzung ist hingegen gleichmäßig und feinkörnig aufgebaut. Die kupferhaltigen Schlackeneinschlüsse bestehen überwiegend aus Fe-armem Cu2S und FeO. Beim Schmelzvorgang konnten sich diese Teilchen nicht genügend schnell zum metallischen Gusskuchen absetzen und wurden so in der Schlacke eingeschlossen.
Da die Schlackenhalden in Acqua Fredda sehr groß sind, können diese Untersuchungen nur als Stichproben bewertet werden. Generelle Aussagen über die Kupferproduktion in Acqua Fredda sollten daher aus diesen Schlackenanalysen nicht abgeleitet werden.
About the authors

Roland Haubner is Ao.Univ.Prof. at TU-Wien. His fields of activity till now were industrial tungsten production, CVD (Chemical Vapor Deposition) and the low-pressure diamond deposition. He is also involved in materials characterization, ceramics, corrosion and archaeometallurgy.

Suanne Strobl is working as a scientific officer at the Institute of Chemical Technologies and Analytics (TU-Wien) and is teaching supervisor of metallography. She studied chemistry and her doctoral thesis was about sintered steels.
5 Acknowledgements
The authors would like to thank Mr. Hannes Herdits from the Burgenland State Museum (Landesmuseum Burgenland) in Eisenstadt for providing the samples.
The authors acknowledge TU Wien Bibliothek for financial support through its Open Access Funding Program.
5 Danksagung
Unser Dank geht an Herrn Hannes Herdits von den Burgenländischen Landesmuseen in Eisenstadt für die Bereitstellung der Proben.
Die Autoren danken der TU Wien Bibliothek für die finanzielle Unterstützung durch ihr OpenAccess-Förderprogramm.
References / Literatur
[1] Stöllner, T.: Between mining and smelting in the Bronze Age – Beneficiation processes in an Alpine copper producing district, In: R. Turck/T. Stöllner/G. Goldenberg (Hrsg.), Alpine Copper II – Alpenkupfer II – Rame delle Alpi II – Cuivre des Alpes II. New Results and Perspectives on Prehistoric Copper Production. Der Anschnitt. Beiheft, 42 (Rahden, Westfalen 2019), pp. 165–190Search in Google Scholar
[2] Tylecote, R.F: A history of metallurgy, The Metals Society, (1976), Mid County Press London.Search in Google Scholar
[3] Haubner, R.: Die prähistorische Kupfermetallurgie – allgemeine Betrachtungen, BHM Berg- und Hüttenmännische Monatshefte, 166, (2021), pp. 343–351 DOI: 10.1007/s00501-020-01056-010.1007/s00501-020-01056-0Search in Google Scholar
[4] Haubner, R.; Strobl, S.; Klemm, S.: Investigations of a slag from copper smelting discovered at the Bronze Age site Prein VII/Cu in Lower Austria, in Ignacio Montero-Ruiz and Alicia Perea (Eds), Archaeometallurgy in Europe IV. Bibliotheca Praehistorica Hispana, Vol. 33. Editorial CSIC, Madrid. (2017), pp. 135–142.Search in Google Scholar
[5] Haubner, R.; Strobl, S.; Trebsche, P.: Metallographic analyses from the late Urnfield period copper mining settlement at Prigglitz-Gasteil in Lower Austria, in: R. Turck, T. Stöllner and G. Goldenberg (Eds), Alpine Copper II. New Results and Perspectives on Prehistoric Copper Production, Der Anschnitt, Beiheft 42, Verlag Marie Leidorf, Bochum. (2019), pp. 323–332.Search in Google Scholar
[6] Haubner, R.; Strobl, S.: Slag investigations from Bronze Age copper smelting sites, Materials Science Forum, 891 (2017), S. 608–612 10.4028/www.scientific.net/MSF.891.60810.4028/www.scientific.net/MSF.891.608Search in Google Scholar
[7] Addis, A.; Angelini, I.; Nimis, P.; Artioli, G.: Late Bronze Age Copper Smelting Slags from Luserna (Trentino, Italy): Interpretation of the Metallurgical Process. Archaeometry 58 (2016), pp. 96-114 DOI: 10.1111/arcm.1216010.1111/arcm.12160Search in Google Scholar
[8] Bourgarit, D.; Rostan, P.; Burger, E.; Carozza, L.; Mille, B.; Artioli, G.: The beginning of copper mass production in the western Alps: the Saint-Véran mining area reconsidered, Historical Metallurgy 42 (2008), pp. 1–11Search in Google Scholar
[9] Pearce, M.; Bellintani, P.; Nicolis, F.: Frattesina and the later Bronze Age – Early Iron Age metals trade: the absolute chronology of smelting sites in the Trentino – Alto Adige/Südtirol, Padusa, Bollettino del Centro Polesano, 55, (2020), pp. 67–86Search in Google Scholar
[10] Silvestri, E.; Hauptmann, A.; Bellintani, P.; Mottes, E.; Nicolis, F.: Bronzezeitliche Kupferverhüttung in Trentino. In T. Stöllner, K. Oeggl (Hrsg.), Bergauf – Bergab. 10.000 Jahre Bergbau in den Ostalpen. Veröffentlichung aus dem DBM Bochum 206 (2015), pp. 201–208Search in Google Scholar
[11] Slag Atlas, 2nd Edition, Edited by Verein Deutscher Eisenhüttenleute (VDEh), (1995) Verlag Stahleisen GmbH, DüsseldorfSearch in Google Scholar
© 2022 Walter de Gruyter GmbH, Berlin/Boston, Germany
This work is licensed under the Creative Commons Attribution 4.0 International License.
Articles in the same Issue
- Contents
- Editorial
- Editorial
- Slags from Bronze Age copper production in Acqua Fredda
- Microstructure of an extraordinary Bronze Age copper ingot with a high antimony content
- Metallography on a sickle fragment from the Drassburg/Burgenland hoard find
- Materialographic sample preparation of ancient copper materials
- Picture of the Month
- Picture of the Month
- People
- Interview with guest editor Prof. Roland Haubner
- News
- News
- Meeting Dairy
- Meeting Diary