Defence Spending and Sovereign Debt in Greece: A Long-Term Historical Perspective
-
Christos Kollias

 ,
Suzanna-Maria Paleologou
,
Suzanna-Maria Paleologou

Abstract
The paper sets out to examine the military spending-public debt nexus in the case of Greece. Unlike previous studies that exclusively focus their analyses in the post-WWII period, the empirical investigation conducted herein covers almost the entire two hundred years of the modern Greek state. The estimations using an ARDL framework cover the period 1848–2018 as well as sub-periods therein. To the best of our knowledge, this is the first paper to approach this issue in the case of Greece with such a long-term perspective. In broad terms, the findings do not unearth a statistically traceable effect of defence expenditures on public debt accumulation. The results indicate that this was very much driven by debt dynamics and the need to draw funds to service existing loans. This finding is consistent across both the entire period under scrutiny here as well as the various sub-periods.
1 Introduction
It is well established that throughout history military spending, particularly during periods of war and armed confrontation, is a major contributing factor to the accumulation of public debt (Smith 2020). “… war is a matter not so much of arms as of money, which makes arms of use … ” states Thucydides in the History of the Peloponnesian War.[1] “… nervos belli, pecuniam infinitam … ”[2] declares Cicero in his Fifth Philippic speech. The problem of financing war preparations and war has been an issue that has always attracted the attention of economic analysis (inter alia: Durbin 1939; Fisher 1918; Hirst 1916; Keynes 1940; Pigou 1916; Sprague 1917). Invariably in history, treasury resources have proven insufficient to fund the financial costs of a war effort: «when the army marches abroad, the treasury will be emptied at home» we read in Sun Tzu’s The Art of War.[3] Hence the need to resort to borrowing (inter alia: Bordo and White 1991; Fisher 1918; Grossman 1988; Grossman and Han 1993; Hirst 1916; Miller et al. 1917). For instance, as pointed out by Ellison and Scott (2020), the origins of the UK’s national debt can be traced back to William of Orange and the need to finance the Nine Years’ War (1688–97). The finance was provided by a syndicate of merchants that subsequently became the Bank of England.
The theoretical underpinnings of the military expenditure-public debt nexus are provided by Barro (1979, 1987 while Smith (2020) offers a comprehensive and in-depth discussion of the issues associated with war financing, military expenditures, deficit spending and the accumulation of public debt. Consequently, for reasons of brevity, we refrain from engaging in a fundamentally similar discussion herein. The links between these two variables, have attracted considerable attention in the relevant empirical literature. The accumulated body of this strand of the literature includes both single country case studies as well as papers that focus on groups of countries (inter alia: Abbas and Wizarat 2018; Alexander 2013; Caruso and Di Domizio 2015, 2017; Dunne et al. 2004, 2019; Paleologou 2013). A comprehensive review of the many previously published papers on the military spending-public debt nexus is beyond our scope here. Moreover, this is an issue taken up by other papers. For instance, Pempetzoglou (2021) offers an extensive and in-depth comprehensive literature review of the defence expenditure-external debt nexus.
By comparison, the focus of the present paper is narrower. It concentrates its analysis in the case of Greece and approaches the issue through a long-term perspective. As one would expect given the levels of the Greek defence burden (military expenditure as a share of GDP), the defence spending-public debt theme in the case of Greece has been examined by previous empirical papers (Dimitraki and Kartsaklas 2018; Kollias et al. 2004; Nikolaidou 2016). However, with no exceptions, all of them focus their analysis in the post-World War II (henceforth WWII) period. For instance, the recent analysis by Dimitraki and Kartsaklas (2018) covers the period 1960–2015, while in the paper by Nikolaidou (2016) the period under scrutiny is 1970–2011. In contrast to all these studies, the present paper addresses this theme by taking a long-term perspective as Smith (2020) does in the case of the UK. The analysis that follows covers almost the entire two centuries of the Modern Greek state spanning back to the early years of national independence in the mid-19th century. Specifically, the empirical investigation covers the years 1848–2018. The beginning of the period examined was dictated by data availability on pre-WWII Greek public debt. This is an issue addressed in the section that follows, where the two main variables concerned are presented in relation to the major issues and events of Greek economic and political history. The methodology adopted to probe into the issue, and the findings are presented and discussed in section three, while section four concludes the paper.
2 Military Spending and Sovereign Debt in Historical Perspective
The roots of Greek public debt can be traced back to the two loans of independence taken out in 1824 and 1825 to provide much needed resources for the Greek War of Independence from the Ottoman Empire. «Every loan is not merely a speculative hit But seats a nation or upsets a Throne» is the way Lord Byron chooses in Don Juan [4] to refer to the Greek loans of independence.[5] He was a member of the London Greek Committee the group of philhellenes that assisted in the negotiations for the loans to finance the Greek War of Independence (Kalyvas 2015; Koliopoulos and Veremis 2010). The first loan of a nominal value of £800,000 was concluded in 1824. The second one was concluded in 1825 with a nominal value of £2,000,000. The final amounts disbursed to finance the liberation struggle were £472,000 and £1,100,000 representing 59% and 55% of the nominal value of each loan respectively.[6] A couple of years later, in 1827, Greece failed to service the two loans and the first of the four Greek sovereign defaults occurred. This was the first sovereign default that in fact occurred before the formal recognition by the international community of the newly-born state. The almost total inability of the institutionally weak state to find domestic revenue sources and to impose taxes to finance the loan repayments led to the 1827 default.
From its inception, Greece has always been a fiscally frail state. Thus, in terms of fiscal performance, Greek economic history is a rather turbulent one since government revenues were never enough to finance the operation of the state functions and the many war efforts over the last two centuries. As a result, it heavily relied on loans mainly from the international money markets to finance deficit spending. Three more official sovereign defaults followed the 1827 one: in 1843, 1893 and 1932 while a fifth sovereign default in 2010 was marginally avoided due to the emergency bail-out financial assistance received by the tripartite mechanism of the EU, the ECB and the IMF (inter alia: Alogoskoufis 2021; Conte 2019; Tsoulfidis and Zouboulakis 2016). In broad terms these defaults were the result of a combination of both domestic factors affecting Greece’s ability to service its debts as well international financial crises. The latter reduced the liquidity of the international capital markets from where Greece drew funds to service existing loans and finance budgetary needs as in the case of the two loans of 1824 and 1825 to finance the War of Independence. The necessary funds to support the war effort could not be met via domestic sources. These sources largely consisted of private, voluntary donations of wealthy Greeks and many romantic Philhellenes such as Byron but were not sufficient.
Lord Byron and the London Greek Committee played an instrumental role in securing these loans since Greece was not at the time a formally recognized sovereign state entity.[7] Formal recognition from the international community came with the Treaty of London in 1832 co-signed between the Great Powers – that is Great Britain, France and Russia – and the Ottoman Empire. In other words, when Greece was eventually formally recognized was already an indebted state and had already defaulted once in 1827 since it was unable to service the two independence loans mentioned above. In the decades that followed, the sovereign territory of the newly born state gradually increased. This territorial expansion was achieved either through provisions stemming from various international agreements or (mainly) as the result of war (Kalyvas 2015; Koliopoulos and Veremis 2010; Kostis 2018). Indeed, throughout the pre-WWII period, Greece was in an almost continuous state of military mobilisation and engaged in several national and international wars including the Balkan Wars (1912–13) and World War I (henceforth WWI). Consequently, throughout this period military spending was by far the largest budgetary outlay. During 1833–1939 it averaged at around 9% of GDP and 39% of total government expenditure. Obviously, it was even higher during war periods. For example, during the 1919–22 Greek–Turkish War it reached such spending averaged at around 23.9% of GDP.
We start the discussion and presentation of the two main time-series of concern here by taking a long-term view of how they have evolved and changed throughout the entire period examined. Figure 1 offers a bird’s eye view of public debt and defence spending during 1848–2018. Both are expressed as shares of GDP. The military spending series (Milex/GDP) is drawn from two different sources. For the pre-WWII years, i.e. 1848–1939, the military spending data used herein is drawn from the recently published macroeconomic dataset by the Bank of Greece (henceforth BoG), as part of the activities of the South-East European Monetary History Network (SEEMHN).[8] The dataset offers consistently compiled series on many macroeconomic variables, including defence expenditures (Lazaretou 2014). For the post-WWII period, all defence expenditure data are drawn from SIPRI.[9]

A bird’s eye view of debt and defence spending as shares of GDP 1848–2018.
Similarly, the public debt series (Debt/GDP) is drawn from two different sources. IMF’s Global Debt Database[10] is the source for the public debt series that spans the post-WWII period. Specifically, the debt time-series is available for 1950–2018. The public debt series for 1848–1939 is drawn from Reinhart’s “Debt-to-GDP Ratios”[11] (Abbas and Rogoff 2019; Reinhart and Rogoff 2009, 2011, 2014). As can be seen in Figure 1, debt data is not available for the years 1914–18 and 1940–49 while in the case of the military spending series data is missing for the years 1940–48. That is for the entire Second World War and for the duration of the Greek Civil War that followed the liberation from the Nazi occupation. At this point, it should be mentioned that for the purposes of the estimations in the section that follows that span the entire period (1848–2018), linear interpolation is used to fill these gaps of the missing data in the series.
In rather broad terms and for the purposes of the analysis here, Greek economic and political history can be divided into two large sub-periods (Kalyvas 2015; Koliopoulos and Veremis 2010; Kostis 2018). The first spanning the years from the outbreak of the War of Independence in 1821 up to the Second World War (WWII). The second sub-period covers the post-WWII decades. In comparative terms, the first sub-period was the most turbulent in terms of major political and economic events. The newly established state was involved in several major national and international military confrontations and wars. These were the Greek–Turkish War of 1897, the Balkan Wars of 1912–13, World War I, the Greek–Turkish War of 1919–22 and World War II. In fact, it could be argued that during the entire pre-WWII period, Greece was constantly in a state of war alertness and military mobilization. As a result, throughout the pre-WWII period, defence expenditure constituted by far the largest individual budgetary item of total government spending. Based on the BoG database used here, during 1848–1939 such government outlays averaged at around 9.2% of GDP with noteworthy variation from one decade to the other (Table 1). Expectedly, during war periods, military spending was appreciably higher. For instance, during the Balkan Wars of 1912–13 it averaged at 16.4% of GDP and 58.6% of total public spending. During the Greek–Turkish War of 1919–22 defence expenditures were even higher: 23.9% of GDP, 70.4% of total spending.
Public debt (Debt/GDP), defence spending (Milex/GDP) as a share of GDP and GDP growth rates (GDP%) in the pre-WWII period 1848–1939.
| Debt/GDP | Milex/GDP | GDP% | |
|---|---|---|---|
| 1848–59 | 294.7 | 5.9 | 5.0 |
| 1860–69 | 182.1 | 6.1 | 2.2 |
| 1870–79 | 132.0 | 6.0 | 2.2 |
| 1880–89 | 101.3 | 10.2 | 4.4 |
| 1890–99 | 193.9 | 8.5 | 0.9 |
| 1900–09 | 175.4 | 6.4 | 2.8 |
| 1910–19 | 97.3 | 13.5 | 5.2 |
| 1920–29 | 62.6 | 17.6 | 5.2 |
| 1930–39 | 108.5 | 9.5 | 3.6 |
| Entire pre-WWII period 1848–1939 | 156.1 | 9.2 | 3.5 |
As mentioned, the pre-WWII period was also marked by four sovereign defaults. They took place in 1827, 1843, 1893 and 1932 (inter alia: Alogoskoufis 2021; Conte 2019; Lazaretou 1993; Tsoulfidis and Zouboulakis 2016). Greece has always been fiscally frail as government revenues seldom sufficed to finance expenditures. Hence the need to borrow. Loans were drawn mainly from the international money markets. They financed deficit spending on the various state functions including the many and often protracted war efforts during the pre-WWII period.
In broad terms the sovereign defaults were the result of both domestic factors affecting Greece’s ability to service its debts as well international financial crises that reduced the liquidity of capital markets from where Greece drew funds to service existing loans and finance current budgetary needs (Chouliarakis and Lazaretou 2014; Ginammi and Conte 2016; Reinhart and Trebesch 2015). As can be seen in Table 1, during 1848–1939, public debt amounted to 156.1% of GDP on average. Nonetheless, significant variation in the level of public debt is observed in the various sub-periods presented in Table 1 as well as Figure 1. The lowest annual average value of 62.6% is recorded during 1920–29. Finally, allowing for the inevitable fluctuations from one period to another, during 1848–1939 GDP growth averaged at 3.5% annually. The highest annual averages of 5.2% are recorded during 1910–19 and 1920–29 while the lowest of 0.9% during 1890–99 (Table 1).
Turning to the post-WWII period, it can be observed that the debt to GDP ratio exhibits an almost steady upward trend (Figure 1). The average share for the entire period is 65% but with significant and noteworthy differences in the sub-periods presented in Table 2. For instance, from an average of 20.1% in 1970–79 it more than doubles to an average of 43% during 1980–89 and doubles again to 92.6% in 1990–99. In fact, using the public debt as a criterion to periodise the post-WWII period, one can identify two distinct sub-periods (Figure 1). The first roughly spanning from 1950 to the end of the 1970s when the debt to GDP ratio averaged at 16.4% annually. In the second sub-period, 1980–2018, the average annual debt to GDP ratio stood at 102.4%. It grew from 24.6% in 1980 to 194.3% in 2018. The steady accumulation of public debt eventually led to the debt crisis of 2010 (Alogoskoufis 2021; Pegkas 2019; Reinhart and Trebesch 2015). In fact, a fifth sovereign default was marginally avoided due to the emergency bail-out financial assistance received by Greece from the tripartite mechanism of the EU, the ECB and the IMF (Chouliarakis and Lazaretou 2014; Ginammi and Conte 2016; Petrakis 2011). A broadly similar periodisation is possible in terms of economic performance. The average annual GDP growth rate during 1950–79 stood at 6.1% whereas in the subsequent sub-period (1980–2018) it sharply declines to an annual average of 0.9%. Not surprisingly, the lowest annual average GDP growth of −2.4% is recorded during the recent protracted recession that followed the debt crisis of 2010 whereas the highest annual average growth rate of 7.3% is recorded during 1960–69 (Table 2). A comprehensive discussion and analysis of post-WWII economic performance and the recent debt crisis can be found in Alogoskoufis (2021) and Chouliarakis and Lazaretou (2014).
Public debt (Debt/GDP), defence spending (Milex/GDP) as a share of GDP and GDP growth rates (GDP%) during 1950–2018.
| Debt/GDP | Milex/GDP | GDP% | |
|---|---|---|---|
| 1950–59 | 12.4 | 5.5 | 5.6 |
| 1960–69 | 16.6 | 4.1 | 7.3 |
| 1970–79 | 20.1 | 4.9 | 5.4 |
| 1980–89 | 43.0 | 4.7 | 0.8 |
| 1990–99 | 92.6 | 3.5 | 2.1 |
| 2000–09 | 104.9 | 3.0 | 2.8 |
| 2010–18 | 176.7 | 2.5 | −2.4 |
| Entire period 1950–2018 | 65.0 | 4.0 | 3.2 |
In contrast to the broad upward trend exhibited by the public debt series (Debt/GDP), the time-series of the ratio of defence spending to GDP (Milex/GDP) follows an almost steady downward path during 1950–2018 (Figure 1). As can be seen in Table 2, during the post-WWII period, it declines from an annual average of 5.5% during 1950–59[12] to 2.5% during 2010–18. The determinants of Greek defence spending during this period are examined in detail in the extant literature (inter alia: Brauer 2002, 2003; Kollias et al. 2016). Hence, we refrain from engaging in a similar detailed discussion here. For our purposes it suffices to mention that the main external security concern of Greece during this period is Turkey. In particular, the 1974 Turkish invasion of Cyprus led to a sharp deterioration of Greek–Turkish bilateral relations. Currently, they are marred by several contentious issues that include the demarcation of their mutual exclusive economic zones. Such issues often lead to bellicose rhetoric and saber-rattling (Kollias et al. 2016). Perhaps also worth mentioning is that during the first two and a half decades of the post-WWII period and the Greek Civil War of 1946–49, the Greek armed forces were systematically used for internal security purposes and following the 1967 putsch, the country was ruled by military junta until 1974.
3 Results from Long-Term Empirical Estimations
We start the empirical investigation by plotting the scatter diagrams of the two main variables (Debt/GDP and Milex/GDP) under scrutiny here. The scatter plots for the entire period examined here (1848–2018) and the two major sub-periods mentioned in the previous section (1848–1939 and 1950–2018) are presented in Figure 2 and offer an initial visual observation of the relationship between the two time-series. Although robust inferences can hardly be derived from a simple visual inspection of the two scatter diagrams, they nevertheless provide an initial and very preliminary picture of the two variables’ long-term association.
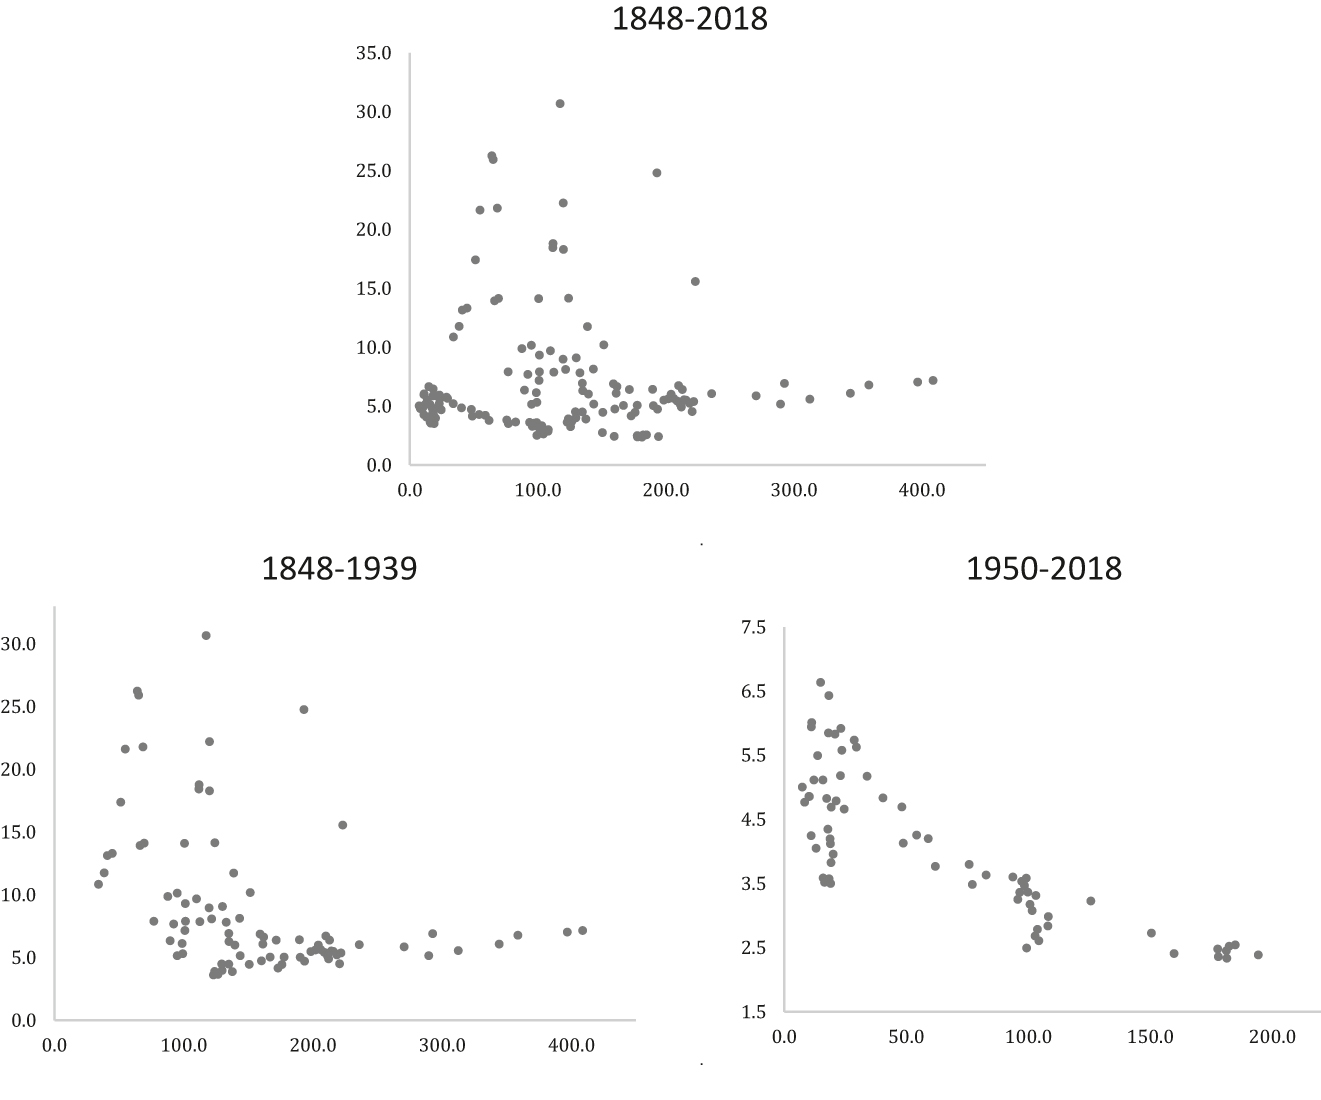
Scatter plots of Debt/GDP and Milex/GDP.
As noted in the previous section, the original sample data available from the databases is from 1848–1913, 1919–1939 and 1950–2018. The rest of the data 1914–1918 and 1940–1949 have been generated with linear interpolations which is a method of curve fitting using linear polynomials to construct the missing data points within the range of a discrete set of known data points. The data points generated by linear interpolations are used only in the estimations that span the entire period examined here i.e. 1848–2018 as well as for the pre-WWII period (i.e. 1848–1939).
We proceed with the empirical investigation by checking the time series properties of the variables involved. That is D = debt/GDP, M = milex/GDP, C = civilian expenditures/GDP and Y = GDP growth rate. To this effect we resort to estimating the augmented Dickey–Fuller (ADF) and the Phillips–Perron (PP) unit root tests (Dickey and Fuller 1979, 1981; Phillips and Perron 1988). The null hypothesis for both tests is unit root. The optimal lag length for the ADF test is chosen using the Akaike Information Criterion and for the PP is determined by the Newey–West method. The level of significance of the ADF and the PP tests is 1%. The results of estimating the two tests are presented in Table 3. Thus, in view of these unit-root results, to probe into the issue at hand, we opt to use the Autoregressive Distributed Lags (ARDL) model developed by Pesaran et al. (2001). The ARDL model tests for cointegration at the levels of variables by employing the Bounds Test within the framework of the estimated ARDL model. The ARDL Bounds Test procedure is considered superior to the two-step procedure of Engle and Granger (1987) and the Johansen (1991, 1995 cointegration technique. The superiority of the ARDL model lies in the fact that it can be employed irrespective of whether each of the time series variables are integrated of order zero I(0), of order one I(1), or are mutually cointegrated. In brief, as long as the variables are not of order I(2) or higher, the ARDL model can be employed. Such features allow researchers to incorporate many variables in their research that could not have been included with other methodologies. In using the ARDL model, researchers have the option to include lagged differences of varying orders in their variables. The optimal lag length of each variable of the ARDL model is found by estimating:
Results of the ADF and PP unit root tests 1848–2018.
| ADF | PP | |
|---|---|---|
| D (debt/GDP) | −1.435 | −2.497 |
| ΔD | −8.361* | −13.950* |
| M (milex/GDP) | −3.074 | −2.482 |
| ΔM | −11.880* | −16.829* |
| C (civilian expenditures/GDP) | −2.762 | −3.215 |
| ΔC | −12.484* | −18.981* |
| Y (gdp growth rate) | −5.038* | −16.136* |
| ΔY | −18.930* | −41.860* |
-
*represents stationarity at 1% level.
To allow for a possibly differential impact on the accumulation of public debt, apart from the military spending time-series, it was also decided to introduce as a determinant non-defence, civilian public spending also expressed as a share of GDP. The civilian spending series was derived by subtracting defence spending from total expenditure. Moreover, to allow for the effect exerted on public debt by the broader economic performance, the GDP growth rate was also introduced in the empirical estimations. Hence, the estimated ARDL model uses the following variables: D = debt/GDP, M = milex/GDP, C = civilian expenditures/GDP and Y = GDP growth rate. Equation (1) below represents the unrestricted or conditional ARDL model for the variables D, M, C, and Y.
where
As previously noted, the bounds test is mainly based on the joint F-statistic, which its asymptotic distribution is non-standard under the null hypothesis of no cointegration. We denote the F-statistic of the test which is normalized on Debt by
Results from bounds testing.
| AIC lags | F-statistic | Decision | |
|---|---|---|---|
| 1848–2018 | |||
|
|
1 | 5.896 | Cointegrated |
| 1848–1949 | |||
|
|
1 | 2.956 | Cointegrated |
| 1848–1939 | |||
|
|
1 | 4.192 | Inconclusive |
| 1950–2018 | |||
|
|
1 | 5.100 | Cointegration |
| 1980–2018 | |||
| 1 | 3.901 | Cointegration | |
| Lower bound 1% | 2.72 | ||
| Upper bound 1% | 3.77 |
-
Lower and upper bound critical values taken from Pesaran et al. (2001).
The results from estimating (1) are presented in Table 5. As previously noted, unlike previous papers that address the military spending-public debt nexus in the case of Greece, the empirical investigation undertaken by the present study spans almost the entire two hundred years of the modern Greek state. Thus, the results of estimations that are reported in Table 5, cover the entire period under scrutiny here, i.e. 1848–2018 but also various sub-periods in order to allow for better insights and more reliable inferences given the significant differences between the pre- and post-WWII periods mentioned in the previous section. Specifically, the ARDL is estimated for 1848–1949 where all the data points generated via linear interpolations are included; 1848–1939 where only the debt to GDP data points generated by linear interpolation for 1914–18 are included; 1950–2018 that covers the post-WWII for which data is available; and finally for 1980–2018 given the discussion in the previous section concerning both the growth performance of the Greek economy and the significant increase in the debt to GDP ratio compared to the 1950–79 sub-period. The diagnostic tests for the residual of the regressions and model specification for both the entire period as well as the sub-periods mentioned above are presented in Table 6. Overall, they appear to perform well. The residuals are normally distributed, there is no higher order serial correlation in the models or heteroskedasticity and the RAMSEY test for misspecification does not reject the null hypothesis of no misspecification. Thus, the functional form of the model, for all the samples, is appropriate (Table 6).
ARDL estimations, dependent variable:
| 1848–2018 | 1848–1949 | 1848–1939 | 1950–2018 | 1980–2018 | |
|---|---|---|---|---|---|
| C | −4.245 | −2.245 | −1.986 | 13.509 | −10.451 |
| (−0.80) | (−0.19) | (−0.16) | (1.30) | (−0.14) | |
|
|
−0.051 | −0.080 | −0.108 | −0.060 | −0.040 |
| (−3.23)** | (−2.54)** | (−3.21)** | (−1.21) | (−0.35) | |
|
|
−0.103 | −0.094 | −0.172 | −0.223 | −0.495 |
| (−1.28) | (−0.87) | (−1.51) | (−1.65) | (−2.26)** | |
|
|
0.131 | 0.019 | −0.044 | 0.163 | −0.059 |
| (0.36) | (0.04) | (−0.09) | (0.70) | (−0.01) | |
|
|
3.879 | −3.024 | −5.205 | −27.867 | −24.369 |
| (0.63) | (−0.54) | (−1.26) | (−1.22) | (−0.11) | |
|
|
0.174 | 0.025 | 0.536 | 0.751 | 1.224 |
| (0.47) | (0.05) | (0.89) | (1.97)** | (1.18) | |
|
|
6.556 | 8.601 | 12.908 | 1.769 | 14.900 |
| (1.89)** | (1.03) | (1.76)* | (0.73) | (0.31) | |
|
|
−0.156 | 8.345 | 2.200 | −16.404 | −23.184 |
| (−0.02) | (1.12) | (0.39) | (−0.11) | (−0.39) | |
|
|
0.087 | 0.336 | 0.175 | −0.693 | −1.223 |
| (0.51) | (1.35) | (0.67) | (−2.72)** | (−1.60) | |
|
|
0.15 | 0.14 | 0.22 | 0.35 | 0.55 |
| SER | 15.2 | 19.24 | 19.59 | 5.83 | 7.35 |
-
t-ratios in parentheses; *, **, *** statistically significant at 10%, 5% and 1%. The optimal lag length has been determined with the AIC criterion.
Diagnostic tests.
| 1848-2018 | |
|---|---|
| Normality test: Jarque Bera | 0.367 (0.501) |
| Serial correlation test: Breusch Godfrey LM | 0.654 (0.419) |
| ARCH test | 1.145 (0.320) |
| Ramsey RESET test | 1.473 (0.175) |
| 1848–1949 | |
| Normality test: Jarque Bera | 1.327 (0.401) |
| Serial correlation test: Breusch Godfrey LM | 1.050 (0.354) |
| ARCH test | 0.730 (0.394) |
| Ramsey RESET test | 1.448 (0.231) |
| 1848–1939 | |
| Normality test: Jarque Bera | 0.849 (0.110) |
| Serial correlation test: Breusch Godfrey LM | 1.077 (0.897) |
| ARCH test | 0.559 (0.456) |
| Ramsey RESET test | 0.750 (0.388) |
| 1950–2018 | |
| Normality test: Jarque Bera | 0.162 (0.471) |
| Serial correlation test: Breusch Godfrey LM | 0.788 (0.463) |
| ARCH test | 0.718 (0.848) |
| Ramsey RESET test | 0.436 (0.302) |
| 1980–2018 | |
| Normality test: Jarque Bera | 0.551 (0.622) |
| Serial correlation test: Breusch Godfrey LM | 3.044 (0.100) |
| ARCH test | 1.122 (0.292) |
| Ramsey RESET test | 0.085 (0.992) |
-
Probabilities in parentheses.
We now turn to the discussion of the results from estimating (1) that are presented in Table 5. Primarily, we focus on the military expenditure variable (Milex/GDP) since it is the main series of interest here. As can be observed from the results, the coefficient of this variable is not statistically significant in any of the estimations presented in Table 5. That is, it is not significantly different from zero in any of the periods for which (1) was estimated. This consistent finding strongly suggests that military spending did not exert a statistically traceable effect on public debt. On the contrary, it seems that non-defence, civilian spending had a statistically traceable, albeit not always strong, effect on the debt to GDP ratio. This seems to be the case for the entire period (1848–2018) at the 5% level of significance which is also the case for the 1950–2018 period. A statistically weaker – at the 10% level of significance – effect of civilian expenditure on public debt is also established for the pre-WWII period (1848–1939). Moreover, the results reported in Table 5, indicate in a rather consistent manner that debt dynamics are the main driver of debt accumulation. Except for the results yielded by the estimations for the 1950–2018 period, in all other cases debt dynamics as captured by
4 Concluding Remarks
Throughout history, military spending particularly during periods of war and armed confrontation has played an instrumental role in the accumulation of public debt. Consequently, the military expenditure-public debt nexus has attracted considerable attention in the relevant literature (inter alia: Alexander 2013; Caruso and Di Domizio 2015, 2017; Smith 2020). The origins of Greek public debt can be traced back to the two loans of independence taken out in 1824 and 1825 to finance the War of Independence. Except for Smith (2020), all previous studies that address empirically the nexus between these two macroeconomic variables, i.e. public debt and military spending, focus their analyses in various post-WWII periods. The same applies for the studies that examine this issue in the case of Greece (Dimitraki and Kartsaklas 2018; Kollias et al. 2004; Nikolaidou 2016). In contrast, this paper examined the nexus between defence spending and public debt for almost the entire two hundred years of the modern Greek state. To the best of our knowledge, this is the first paper to approach this theme in the case of Greece with such a long-term perspective. The findings from the ARDL estimations for the entire period (1848–2018) as well as several sub-periods (1848–1949, 1848–1939, 1950–2018, 1980–2018) did not uncover a statistically significant effect of defence expenditures on public debt. The results reported herein indicate that debt accumulation was very driven by debt dynamics and the need to draw funds to service existing loans. This finding was consistent across both the entire period under scrutiny here as well as the various sub-periods.
References
Abbas, A., and K. Rogoff. 2019. “A Guide to Sovereign Debt Data.” In IMF Working Paper WP/19/195. Washington, DC. Also available at https://www.imf.org/en/Publications/WP/Issues/2019/09/13/A-Guide-to-Sovereign-Debt-Data-48611.10.1093/oso/9780198850823.001.0001Search in Google Scholar
Abbas, S., and S. Wizarat. 2018. “Military Expenditure and External Debt in South Asia: A Panel Data Analysis.” Peace Economics, Peace Science and Public Policy 24 (3): 1–7, https://doi.org/10.1515/peps-2017-0045.Search in Google Scholar
Alexander, R. 2013. “The Defence-Debt Nexus: Evidence from the High-Income Members of NATO.” Defence and Peace Economics 24 (2): 133–45, https://doi.org/10.1080/10242694.2012.673839.Search in Google Scholar
Alogoskoufis, G. 2021. “Historical Cycles of the Economy of Modern Greece from 1821 to the Present, Hellenic Observatory Papers on Greece and Southeast Europe.” In GreeSE Paper No. 158. London. Also available at http://eprints.lse.ac.uk/109848/2/GreeSE_No158.pdf.10.2139/ssrn.3801664Search in Google Scholar
Barro, R. 1979. “On the Determination of the Public Debt.” Journal of Political Economy 87 (5): 940–71, https://doi.org/10.1086/260807.Search in Google Scholar
Barro, R. 1987. “Government Spending, Interest Rates, Prices, and Budget Deficits in the United Kingdom, 1701–1918.” Journal of Monetary Economics 20 (2): 221–47, https://doi.org/10.1016/0304-3932(87)90015-8.Search in Google Scholar
Bordo, M., and E. White. 1991. “A Tale of Two Currencies: British and French Finance during the Napoleonic Wars.” The Journal of Economic History 51 (2): 303–16, https://doi.org/10.1017/s002205070003895x.Search in Google Scholar
Brauer, J. 2002. “Survey and Review of the Defence Economics Literature on Greece and Turkey: What Have We Learned?” Defence and Peace Economics 13 (2): 85–107, https://doi.org/10.1080/10242690210969.Search in Google Scholar
Brauer, J. 2003. “Turkey and Greece: A Comprehensive Survey of the Defence Economics Literature.” In Greece and Turkey in the 21st Century. The Political Economy Perspective, edited by C. Kollias, and G. Gunluk-Senesen, 193–241. New York: Nova Science Publishers.Search in Google Scholar
Caruso, R., and M. Di Domizio. 2017. “Military Spending and Budget Deficits: The Impact of US Military Spending on Public Debt in Europe (1988–2013).” Defence and Peace Economics 28 (5): 534–49, https://doi.org/10.1080/10242694.2016.1228259.Search in Google Scholar
Caruso, R., and M. Di Domizio. 2015. “The Impact of US Military Spending on Public Debt in Europe (1992–2013): A Note.” Peace Economics, Peace Science and Public Policy 21 (4): 459–66, https://doi.org/10.1515/peps-2015-0040.Search in Google Scholar
Chouliarakis, G., and S. Lazaretou. 2014. “Déjà Vu? the Greek Crisis Experience, the 2010s versus the 1930s. Lessons from History.” In Bank of Greece Working Paper No 176. Athens. Also available at https://www.bankofgreece.gr/Publications/Paper2014176.pdf.Search in Google Scholar
Conte, G. 2019. “Ottoman and Greek Sovereign Debt and Bankruptcy: A Long-Term Comparative Analysis.” Journal of European Economic History 48 (2): 111–23.Search in Google Scholar
Dickey, D., and W. Fuller. 1979. “Distribution of the Estimators for Autoregressive Time Series with a Unit Root.” Journal of the American Statistical Association 74: 427–31, https://doi.org/10.1080/01621459.1979.10482531.Search in Google Scholar
Dickey, D., and W. Fuller. 1981. “Likelihood Ratio Statistics for Autoregressive Time Series with a Unit Root.” Econometrica 49: 1057–72, https://doi.org/10.2307/1912517.Search in Google Scholar
Dimitraki, O., and A. Kartsaklas. 2018. “Sovereign Debt, Deficits and Defence Spending: The Case of Greece.” Defence and Peace Economics 29 (6): 712–27.10.1080/10242694.2017.1289497Search in Google Scholar
Dunne, J. P., E. Nikolaidou, and A. Chiminya. 2019. “Military Spending, Conflict and External Debt in Sub-Saharan Africa.” Defence and Peace Economics 30 (4): 462–73, https://doi.org/10.1080/10242694.2018.1556996.Search in Google Scholar
Dunne, J. P., S. Perlo-Freeman, and A. Soydan. 2004. “Military Expenditure and Debt in Small Industrialised Economies: A Panel Analysis.” Defence and Peace Economics 15 (2): 125–32, https://doi.org/10.1080/1024269032000110504.Search in Google Scholar
Durbin, E. 1939. How to Pay for the War: An Essay on the Financing of War. London: Routledge.Search in Google Scholar
Ellison, M., and A. Scott. 2020. “Managing the UK National Debt 1694–2017.” American Economic Journal: Macroeconomics 12 (3): 227–57, https://doi.org/10.1257/mac.20180263.Search in Google Scholar
Engle, R. F., and C. W. J. Granger. 1987. “Co-Integration and Error Correction: Representation, Estimation, and Testing.” Econometrica 55 (2): 251–76, https://doi.org/10.2307/1913236.Search in Google Scholar
Fisher, I. 1918. “How the Public Should Pay for the War.” The Annals of the American Academy of Political and Social Science 78 (July): 112–7, https://doi.org/10.1177/000271621807800122.Search in Google Scholar
Ginammi, A., and G. Conte. 2016. “Greek Bailouts in Historical Perspective: Comparative Case Studies, 1893 and 2010.” Journal of European Economic History 45 (2): 51–86.Search in Google Scholar
Grossman, H. 1988. “The Political Economy of War Debts and Inflation.” In NBER Working Paper No. 2743. Washington, DC. Also available at https://www.nber.org/papers/w2743.10.3386/w2743Search in Google Scholar
Grossman, H., and T. Han. 1993. “A Theory of War Finance.” Defence Economics 4 (1): 33–44. https://doi.org/10.1080/10430719308404746.Search in Google Scholar
Hirst, F. W. 1916. The Political Economy of War. London: J. M. Dent & Sons LTD.Search in Google Scholar
Johansen, S. 1991. “Estimation and Hypothesis Testing of Cointegration Vectors in Gaussian Vector Autoregressive Models.” Econometrica 59 (6): 1551–580, https://doi.org/10.2307/2938278.Search in Google Scholar
Johansen, S. 1995. “A Statistical Analysis of Cointegration for I(2) Variables.” Econometric Theory 11 (1): 25–59, https://doi.org/10.1017/s0266466600009026.Search in Google Scholar
Kalyvas, S. 2015. Modern Greece: What Everyone Needs to Know. New York: Oxford.10.1093/wentk/9780199948772.001.0001Search in Google Scholar
Keynes, J. M. 1940. How to Pay for the War. London: Macmillan.Search in Google Scholar
Kollias, C., S.-M. Paleologou, and A. Stergiou. 2016. “Military Expenditure in Greece: Security Challenges and Economic Constraints.” The Economics of Peace and Security Journal 11 (1): 23–9, https://doi.org/10.15355/epsj.11.1.28.Search in Google Scholar
Kollias, C., G. Manolas, and S. M. Paleologou. 2004. “Military Expenditure and Government Debt in Greece: Some Preliminary Empirical Findings.” Defence and Peace Economics 15 (2): 189–97, https://doi.org/10.1080/1024269032000110559.Search in Google Scholar
Koliopoulos, J., and T. Veremis. 2010. Modern Greece: A History Since 1821. West Sussex: Wiley-Blackwell.10.1002/9781444314823Search in Google Scholar
Kostis, K. 2018. History’s Spoiled Children: The Story of Modern Greece. Oxford: Oxford University Press.Search in Google Scholar
Lazaretou, S. 1993. “Monetary and Fiscal Policies in Greece: 1833–1914.” Journal of European Economic History 22 (2): 285–311.Search in Google Scholar
Lazaretou, S. 2014. “Greece: From 1833 to 1949.” In South-Eastern European Monetary and Economic Statistics from the Nineteenth Century to World War II, ch. 3, 101–70. Athens: Bank of Greece, Bulgarian National Bank, National Bank of Romania, Oesterreichische Nationalbank.Search in Google Scholar
Miller, E. T., H. L. Lutz, E. Lincoln, T. K. Urdahl, and O. M. W. Sprague. 1917. “Loans and Taxes in War Finance: Discussion. Papers and Proceedings of the Twenty-Ninth Annual Meeting of the American Economic Association.” The American Economic Review 7 (S1): 214–23.Search in Google Scholar
Nikolaidou, E. 2016. “The Role of Military Expenditure and Arms Imports in the Greek Debt Crisis.” The Economics of Peace and Security Journal 11 (1): 18–27, https://doi.org/10.15355/epsj.11.1.18.Search in Google Scholar
Paleologou, S. M. 2013. “A Dynamic Panel Model for Analysing the Relationship Between Military Expenditure and Governmental Debt in the EU.” Defence and Peace Economics 24 (5): 419–28, https://doi.org/10.1080/10242694.2012.717204.Search in Google Scholar
Pegkas, P. 2019. “Government Debt and Economic Growth. A Threshold Analysis for Greece.” Peace Economics, Peace Science and Public Policy 25 (1): 1–6, https://doi.org/10.1515/peps-2018-0003.Search in Google Scholar
Pempetzoglou, M. 2021. “A Literature Survey on Defense Expenditures-External Debt Nexus.” Peace Economics, Peace Science and Public Policy 27 (1): 119–41, https://doi.org/10.1515/peps-2019-0049.Search in Google Scholar
Pesaran, H. M., Y. Shin, and R. J. Smith. 2001. “Bounds Testing Approaches to the Analysis of Level Relationship.” Journal of Applied Econometrics 16 (3): 289–326, https://doi.org/10.1002/jae.616.Search in Google Scholar
Petrakis, P. 2011. The Greek Economy and the Crisis Challenges and Responses. Berlin, Heidelberg: Springer.10.1007/978-3-642-21175-1_12Search in Google Scholar
Pigou, A. C. 1916. The Economy and Finance of War. London: J.M. Dent and Sons LTD.Search in Google Scholar
Phillips, P., and P. Perron. 1988. “Testing for a Unit Root in Time Series Regression.” Biometrika 75 (2): 335–46, https://doi.org/10.1093/biomet/75.2.335.Search in Google Scholar
Reinhart, C., and K. Rogoff. 2009. This Time is Different: Eight Centuries of Financial Folly. Princeton: Princeton University Press.10.1515/9781400831722Search in Google Scholar
Reinhart, C., and K. Rogoff. 2011. “From Financial Crash to Debt Crisis.” The American Economic Review 101 (5): 1676–706, https://doi.org/10.1257/aer.101.5.1676.Search in Google Scholar
Reinhart, C., and K. Rogoff. 2014. “This Time is Different: A Panoramic View of Eight Centuries of Financial Crises.” Annals of Economics and Finance 15 (2): 1065–188.10.3386/w13882Search in Google Scholar
Reinhart, C., and C. Trebesch. 2015. “The Pitfalls of External Dependence: Greece, 1829–2015.” Brookings Papers on Economic Activity 46 (2): 307–28, https://doi.org/10.1353/eca.2015.0000.Search in Google Scholar
Smith, R. 2020. “Debt, Deficits and Defence: The UK Experience 1700–2016.” Defence and Peace Economics 31 (4): 414–22, https://doi.org/10.1080/10242694.2019.1710996.Search in Google Scholar
Sprague, O. M. W. 1917. “Loans and Taxes in War Finance. Papers and Proceedings of the Twenty-Ninth Annual Meeting of the American Economic Association.” The American Economic Review 7 (S1): 199–213.Search in Google Scholar
St Clair, W. 1972/2008. That Greece Might Still be Free. The Philhellenes in the War of Independence. Cambridge: Oxford University Press/ Open Book Publishers.10.11647/OBP.0001Search in Google Scholar
Tsoulfidis, L., and Μ. Zouboulakis. 2016. “Greek Sovereign Defaults in Retrospect and Prospect.” South-Eastern Europe Journal of Economics 27 (2): 141–57.Search in Google Scholar
© 2021 Walter de Gruyter GmbH, Berlin/Boston
Articles in the same Issue
- Frontmatter
- Research Articles
- Palestinian Firms’ Status and Employment Under the Israeli Security Regime: Evidence from Establishment Censuses
- The Relationship Between Economic Structure and Political Violence in Latin America (1990–2019)
- Defence Spending and Sovereign Debt in Greece: A Long-Term Historical Perspective
- Trade Sanctions and Customs Union Partners of the Target Country: Evidence from Kazakhstan