Glossary of terms for mass and volume in analytical chemistry (IUPAC Recommendations 2024)
-
Maria F. Camões


Abstract
A glossary of terms and definitions for concepts in the use of mass and volume in analytical chemistry is presented. These include definitions for analytical methods of measurement (gravimetry, volumetry, and titrimetry) and supporting terms. Terms are updates of earlier recommendations or Orange Book entries.
1 Introduction
In 2018, an IUPAC Technical Report “Mass and volume in analytical chemistry” was published 1 as part of the revision of the IUPAC Compendium of Terminology in Analytical Chemistry (the Orange Book). 2 A glossary of terms was included. These are reproduced here as an IUPAC Recommendations to allow inclusion in the revised IUPAC Compendium of Chemical Terminology (the Gold Book). 3
The terms are reproduced from Chapter 4 of Ref. 2 in alphabetical order, with source documents and any changes from Ref. 1 noted.
Formatting follows the IUPAC Guidelines 4 with italics denoting a term defined in the glossary.
2 Glossary of terms
For historical definitions see Ref. 5. Terms relating to acidity are defined in the IUPAC Recommendation. 6 See Ref. 7 for a comprehensive glossary of terms related to solubility.
adsorption indicator
Visual indicator adsorbed or desorbed, with concomitant color change, at the end-point of the titration.
Example: The yellow dye fluorescein added to chloride titrations which adsorbs on the silver chloride precipitate at the end-point giving it a pink color.
Source: Ref. 1, 6.3.1.
alkalinity, A
Measure of the capacity of aqueous media to react with hydrogen ions.
Note 1: Alkalinity is used to assess the buffering capacity of natural waters and is measured by titration using methyl red (pH 4.5, total alkalinity) or phenolphthalein (pH 8.3, composite alkalinity).
Note 2: Alkalinity is often expressed as a mass concentration of calcium carbonate, for example, “alkalinity equals 3.2 mg L−1 as CaCO3.”
See also: Ref. 8.
Source: Ref. 1, 6.3.2 with minor amendment.
back titration
Titration of remaining reagent after addition of excess reagent to the titrand.
Source: Ref. 1, 6.3.3 with minor amendment.
blank titration
Titration performed with titrand containing no analyte.
Note: A blank titration is used to estimate systematic error such as indicator consumption error.
cerimetric titration
cerimetry
Redox titration using cerium(IV), in which an iron(II)-1,10-phenanthroline complex (ferroin) color change indicates the end-point.
Source: Ref. 9, with minor amendment.
color indicator
Visual indicator that changes color at the end-point of a titration.
Note: A one-color indicator changes between colorless and a color (e.g., phenolphthalein and many complexometric indicators (see complexometric titration)). A two-color indicator changes between two colors (e.g., litmus, red-acid: blue-alkaline).
Source: Ref. 1, entry 6.3.4 with minor amendment.
complexometric titration
Titration based on the formation of metal complexes.
Note 1: For measurement of the concentration of metal ions, ethylenediaminetetraacetic acid (EDTA) is a common reagent.
Note 2: A commonly used visual indicator is Eriochrome Black T, which has wine-red solutions when complexed.
composite alkalinity, A P
phenolphthalein end-point alkalinity
Measurement (Ref. 10, entry 2.1) by titration to the phenolphthalein end-point (pH 8.3) of that portion of alkalinity arbitrarily attributed to all the hydroxyl content and half the carbonate content of a titrand.
Note 1: For the carbonate system, with no other oxoanions, A P = [CO3 2−] + [OH−] where the concentrations refer to the solution before the titration CO3 2− + H+ → HCO3 − and OH− + H+ → H2O performed to discoloration of the visual indicator.
Note 2: By definition, composite alkalinity is zero for solutions which have a pH value of 8.3 or less.
Source: Ref. 8, entry 3.3 with added Notes and amendments.
conventional mass, m c
Mass of a body that is balanced by a standard mass under conventionally chosen conditions.
Note 1: The International Organization of Legal Metrology recommends that the conventionally chosen conditions are: reference temperature, t ref = 20 °C, density of air as a reference quantity value (Ref. 10, entry 5.18), ρ 0 = 1.2 kg m−3; reference density of standard weight, ρ c = 8000 kg m−3. In this case, the conventional mass is related to the mass (m) and density (ρ) of the object by
Source: Ref. 1, entry 3.4.1 with amendments.
co-precipitation
Simultaneous precipitation of a normally soluble component with a component from the same solution by the formation of mixed crystals, by adsorption, occlusion or mechanical entrapment.
Note: In gravimetric analysis involving precipitation, co-precipitation of an impurity is usually not desired. Proper washing may remove adsorbed impurities.
See also: Ref. 13.
Source: Ref. 1, entry 5.2.1 with amendment.
direct titration
Titration in which titrant is added directly to titrand.
See also: back titration.
Source: Ref. 1, from entry 6.3.19 with amendment.
end-point
Operational indication of the completion of a titration.
Note 1: The term “end-point” is also used for the quantity (Ref. 10, entry 1.1) that expresses the volume or mass of titrant at the completion of a titration.
Note 2: The conditions of the titration should be chosen so that the end-point is as close as possible to the equivalence-point.
Note 3: The difference between the end-point and equivalence-point is the end-point error.
Source: Ref. 1, entry 6.3.8 with amendment and added Note.
end-point error
Difference in the volume or mass of titrant, or the corresponding difference in the volume or mass of titrand, between the end-point value and equivalence-point value.
See also: titration error.
Source: Ref. 1, entry 6.3.9 with amendment.
equivalence-point
Stage of a titration at which the titrant has completely reacted with the titrand according to the stoichiometry of the reaction.
Note: The term “equivalence-point” is also used for the quantity (Ref. 10, entry 1.1) that expresses the volume or mass of titrant at the equivalence-point.
Source: Ref. 1, entry 6.3.10 with amendment and added Note.
equivalent (in volumetric and gravimetric analysis)
Numerical quantity value (Ref. 10, entry 1.20) of the amount of substance of a chemical compound providing or receiving one mole of a specified reacting species.
Example 1: 1 mol of sulfuric acid (H2SO4) has 2 mol of H+ to be titrated with a strong base. Therefore, the equivalent of sulfuric acid in providing H+ is 1/2.
Example 2: 1 mol of potassium permanganate (KMnO4) receives 3 mol of transferable electrons when reduced to MnO2 in alkaline solution and 5 mol of transferable electrons when reduced to Mn2+ in acid solution. Therefore, the equivalent of potassium permanganate is 1/3 in alkaline solution and 1/5 in acid solution.
See also: Ref. 14, section 6.2.
Source: Ref. 1, entry 4.2.1 with amendments.
gravimetric analysis
gravimetry
Measurement principle (Ref. 10, entry 2.4) of quantitative chemical analysis based on measurement (Ref. 10, entry 2.1) of mass.
Note: The analyte of interest is separated from the sample in a form that allows measurement of mass (e.g., by precipitation), and its mass or amount of substance is calculated from the mass of the weighed compound whose stoichiometric composition must be exactly known.
See also: Ref. 15.
Source: Ref. 1, entry 5.2.3 with amendments.
gravimetric factor, (GF), g F
Mass fraction of analyte in a precipitate (see precipitation) obtained in a gravimetric analysis.
Note 1: Gravimetric factor is calculated by g F = (M A ν A)/(M P ν P), where M A, M P are the molar masses of analyte and precipitate, respectively, and v A and v P are the stoichiometric numbers in the precipitation reaction.
Note 3: The gravimetric factor is used to calculate the mass fraction of an analyte in a sample (w) by w = m P/m sample × g F, where m p is the mass of precipitate and m sample the mass of sample.
Example 1: Sulfur trioxide (M(SO3) = 80.0640 g mol−1) is precipitated as barium sulfate (M(BaSO4) = 233.390 g mol−1), 1 mol SO3 becomes 1 mol BaSO4. Therefore, g F = 80.0640/233.390 = 0.343048.
Example 2: Disilver oxide (M(Ag2O) = 231.736 g mol−1) is dissolved and precipitated as silver chloride (M(AgCl) = 143.321 g mol−1), 1 mol Ag2O becomes 2 mol AgCl. Therefore, g F = ½(231.736/143.321) = 0.808451.
Source: Ref. 1, entry 5.2.4 with added Note and amendments.
homogeneous precipitation
Precipitation in gravimetric analysis in which the precipitating agent is produced from a homogeneously dissolved precursor to minimize local excesses and supersaturation.
See also: Ref. 17.
Source: Ref. 1, entry 5.2.5.
indicator (in a titration)
See visual indicator.
indicator consumption error
Systematic measurement error (Ref. 10, entry 2.17) arising from the reaction of a visual indicator with a reactant in a titration.
Note 1: The magnitude and sign of this error depends on the amount of substance of indicator used and the nature of the interaction between the indicator and the analyte.
Note 2: Indicator consumption error may be expressed as a volume or mass of titrant.
Note 3: A significant compensation of this error usually takes place because the standardization of the titrant is carried out in similar conditions to the analysis titration.
Note 4: Indicator consumption error may be estimated by performing a blank titration.
Source: Ref. 1, 6.3.12 with amendment and added Notes.
mixed indicator
Visual indicator containing a supplementary dye selected to heighten the overall color change at the end-point of a titration.
Example: A solution of bromocresol green (1 g L−1) and methyl red (0.2 g L−1) gives a sharp color change for acid titrations of the weak base morpholine.
Source: Ref. 1, entry 6.3.13 with minor amendment.
nucleation
Initial formation of small crystals from which larger crystals will grow.
Note 1: In gravimetric analysis involving precipitation, supersaturation should be minimized to avoid large numbers of nuclei and small crystals. See von Weimarn ratio.
Note 2: Nucleation is dependent on specific conditions of pressure, temperature, and concentration . 18
See also: Ref. 19.
Source: Ref. 1, entry 5.2.6 with amendment.
potentiometric titration
Redox titration in which the course of the reaction is followed by potentiometry (See: Ref. 20, entry 6.1.2).
Example: Titration of iron(II) by permanganate (MnO4 −) while measuring the electric potential difference between a platinum wire and a silver-silver chloride reference electrode.
precipitation (in chemistry)
Formation of a solid material (precipitate) from a liquid solution in which the material is present in amounts greater than its solubility in the liquid.
Note: The solid material may eventually sediment due to the action of gravity.
See also: Ref. 21, page 2207.
Source: Ref. 7, page 260.
precipitation indicator
Visual indicator precipitated, with concomitant color change, by reaction with excess titrant at the end-point of a titration.
Example: Mohr method for chloride analysis by titration with silver nitrate using chromate (CrO4 2−) as indicator. The end-point of the titration occurs when all the chloride ions are precipitated. Then additional silver ions react with the chromate ions of the indicator to form a red-brown precipitate of silver chromate.
Source: Ref. 1, entry 6.3.14 with minor amendment and expanded Example.
redox indicator
Visual indicator that reacts with excess titrant or titrand with a color change at the end-point of a redox titration.
Example: Titration of diiodine by thiosulfate (SO3S2−) uses a starch solution to produce a strong blue color. At the end-point when all diiodine is reacted, the solution becomes colorless.
Source: Ref. 1, 6.3.15 with amendment.
redox titration
Titration depending on oxidation or reduction reactions between components of titrant and titrand.
Note 1: The end-point may be observed using a redox indicator.
Note 2: Titrations using diiodine as an oxidizing agent are known as iodimetry. Titrations in which diiodine is the product of oxidation of iodide are known as iodometry. 22
Source: Ref. 1, 6.3.16 with amendment.
solubility, s
Analytical composition of a mixture or solution which is saturated with one of the components of the mixture or solution, expressed in terms of the proportion of the designated component in the designated mixture or solution.
Note 1: The definition refers to component B; i.e., s B
Note 2: Solubility may be expressed in any units (Ref. 10, entry 1.9) corresponding to quantities (Ref. 10, entry 1.1) that denote relative composition, such as mass concentration, number concentration, amount of substance concentration, molality, mass fraction, amount of substance fraction, volume fraction, etc.
Note 3: The mixture or solution may involve any physical state: solid, liquid, gas, vapour, supercritical fluid.
Note 4: The term “solubility” is also often used in a more general sense to refer to processes and phenomena related to dissolution.
Note 5: Critically-evaluated solubilities have been published as the IUPAC-NIST Solubility Data Series, initially as book volumes and since 1998 (Volume 66) in the Journal of Physical and Chemical Reference Data. 23
Example: Solubility of helium in water at 1 atm 273.15 K, s He = 7.585 × 10⁻⁶ mol/mol. 24
Source: Ref. 7, page 264 with minor amendment.
solution
Liquid or solid phase containing more than one component, when for convenience one (or more) component, which is called the solvent, is treated differently from the other components, which are called solutes.
Note 1: When the sum of the amount of substance fractions of solutes is small compared with unity, the solution is called a dilute solution.
Note 2: A superscript ∞ attached to the quantity symbol for a property of a solution denotes the property in the limit of infinite dilution.
Source: Ref. 7, page 266 with amendment.
standard solution
Solution of accurately known composition prepared using a reference measurement standard (Ref. 10, entry 5.6).
Note: Quantities (Ref. 10, entry 1.1) that denote relative composition include mass concentration, number concentration, amount of substance concentration, molality, mass fraction, amount of substance fraction, and volume fraction.
Source: Ref. 1, entry 4.2.3 with amendment and added Note.
standardization
Measurement (Ref. 10, entry 2.1) of the composition of a component of a solution with a reference measurement standard (Ref. 10, entry 5.6) for the preparation of a secondary measurement standard (Ref. 10, entry 5.5).
Note 1: Standardization is commonly performed by titration. It may be done by other means such as gravimetric analysis, e.g., standardize AgNO3 by precipitating AgCl.
Note 2: Quantities (Ref. 10, entry 1.1) that denote relative composition include mass concentration, number concentration, amount of substance concentration, molality, mass fraction, amount of substance fraction, and volume fraction.
Source: Ref. 1, entry 4.2.4 with amendment and added Note.
stock solution
Solution prepared by weighing an appropriate portion of a solid or by measuring out an appropriate volume of a liquid and dissolving it in the weighed mass of solvent or by adding solvent to a given volume.
Note: A stock solution is usually of a greater concentration than is needed for the chemical purpose and is diluted to give the required composition before use.
See also: standard solution.
Source: Ref. 1, entry 4.2.5 with amendment.
supersaturation
State of an unstable solution with a greater concentration of the dissolved component than would exist at equilibrium.
See also: Ref. 21.
titrand
Reactant solution being titrated in a titration.
Source: Ref. 1, entry 6.3.17 with amendment.
titrant
Reactant solution added in a titration.
Source: Ref. 1, 6.3.18 with minor amendment.
titration
Addition of a reactant A (in a solution termed titrant) in measured increments to a solution containing a second reactant B (in a solution termed titrand) with provision for some means of indicating the end-point at which essentially all of B has reacted.
Note 1: The titrant can be added by volume (see volumetric titration) or by mass.
Note 2: If the titrant reacts directly with the analyte, the process is known as a direct titration. In a back titration excess reactant is added followed by titration of the remaining reactant.
Note 3: Knowing the stoichiometry of the reaction (ν A A + ν B B → products), the composition of the titrand (e.g., amount of substance concentration c B) may be calculated from the volume of titrant (V A), composition of titrant (c A), and volume of titrand (V B): c B = (ν A c A V A)/(ν B V B).
Note 4: The term “titre”, defined in the second edition of the Orange Book 25 as “The reacting strength of a standard solution, usually expressed as the weight (mass) of the substance equivalent to 1 cm3 of the solution,” is considered obsolete.
Note 5: The end-point may be indicated by a visual indicator, or obtained from a titration curve.
Source: Ref. 1, 6.3.19 with amendments and added Note.
titration curve
titration diagram
titration plot
Graphical representation of the course of a titration showing measured quantity values (Ref. 10, entry 2.10) plotted against the volume of titrant added.
Note 1: The quantity values plotted may be of pH or the first or second differences of the pH against volume added. See Fig. 1.
Note 2: Although ‘titration diagram’ is the correct metrological term (Ref. 10, entry 4.30), ‘titration curve’ is given as the preferred term, because of its long use in analytical chemistry.
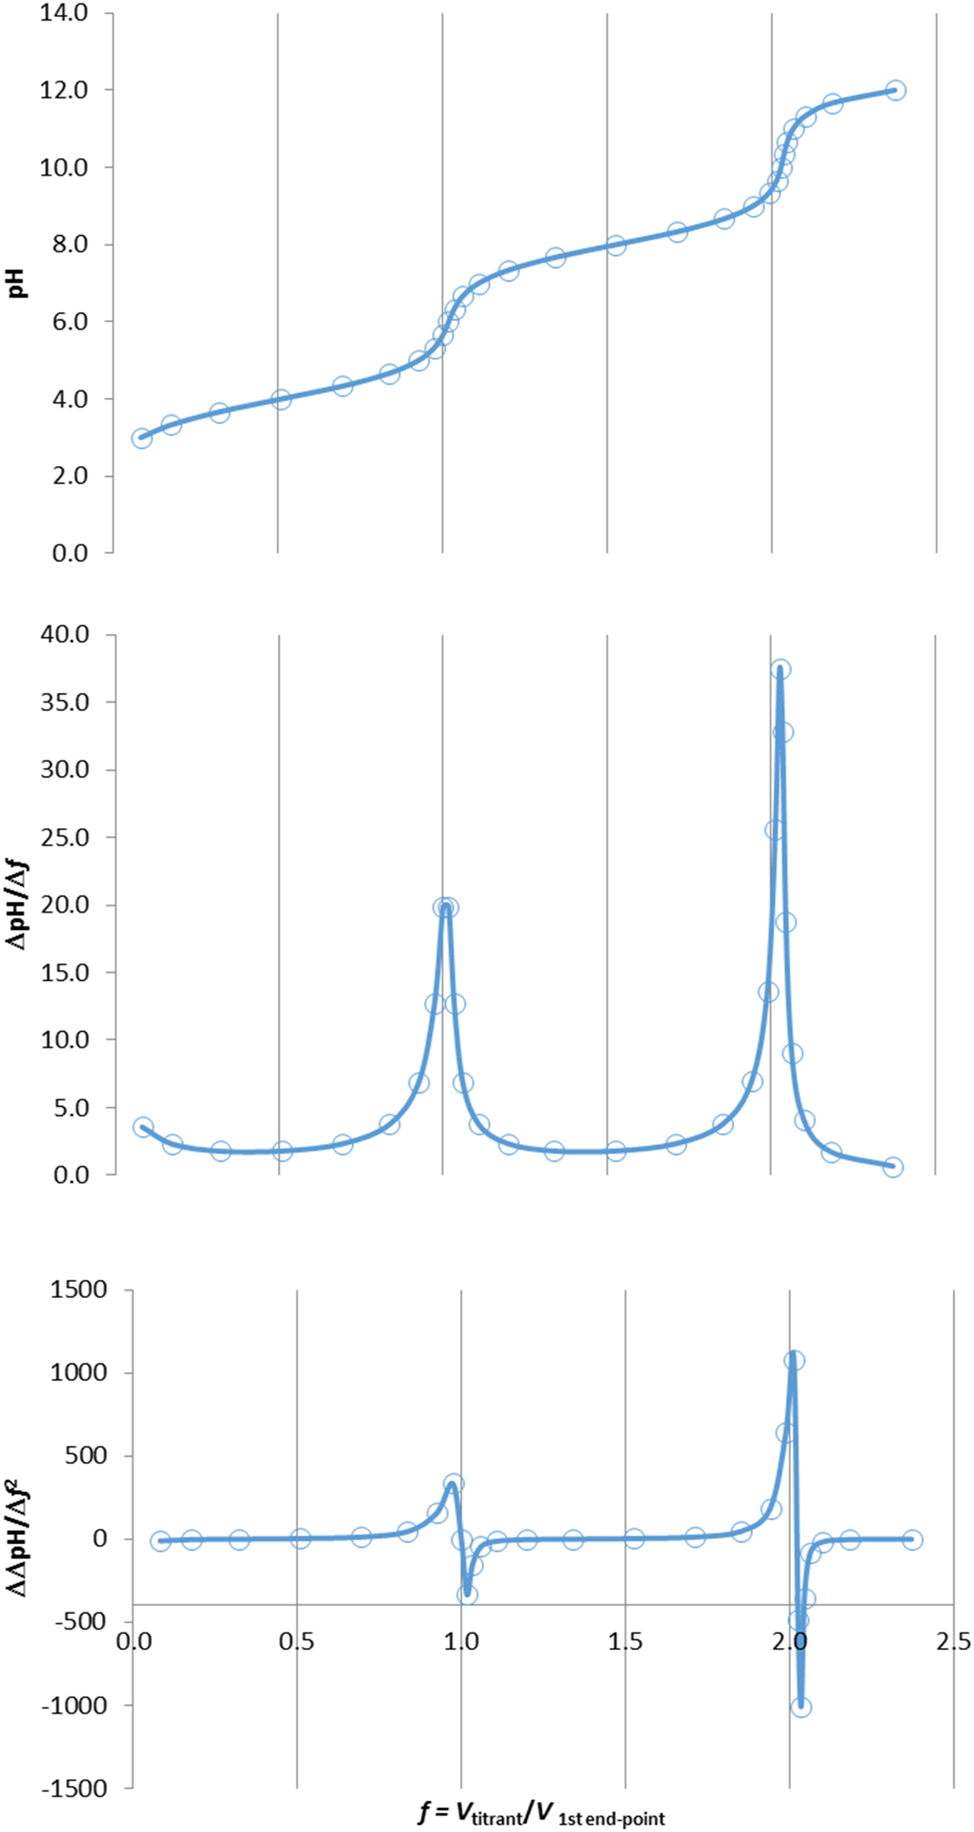
Strong base–weak acid titration (top) pH versus fractional end-point volume (f) (middle) first difference of pH curve (bottom) second difference of pH curve. Source Ref. 1, Figure 6.1-1.
titration error
indicator error
Sum of end-point error and indicator consumption error.
Source: Ref. 1, entry 6.3.20.
titrimetric analysis
titrimetry
Methods of quantitative analysis employing titration.
Note: The titrant added is usually measured by volume (volumetric titration), but it can be weighed.
Source: Ref. 1, 6.3.21 with amendment.
transition potential (of a redox indicator)
Electric potential at the end-point of a redox titration.
Note: The transition potential is a function of the formal redox potential, the total concentration of the indicator (especially for one color indicators), the depth of the color layer, the minimal observable absorbance change (which depends on wavelength and eye sensitivity), and the absorption coefficient.
Source: Ref. 1, 6.3.23 with amendment.
universal indicator
Visual indicator composed of a solution of several pH indicators (main components are thymol blue, methyl red, bromothymol blue and phenolphthalein) that changes color through a range of pH values, usually from 1 to 14.
Note: Universal indicators are commercially available in the form of a solution or in paper strips accompanied by a color matching chart.
See also: Ref. 26.
Source: Ref. 1, entry 6.3.24 with amendment.
visual indicator
indicator
Substance which interacts with a species in a titration giving a visual change at the end-point.
Note 1: Visual indicators may be described by the nature of the indication (color indicator, one-color indicator, two-color indicator, adsorption indicator) or by the nature of the reaction (acid-base indicator, redox indicator).
Note 2: If the indicator takes part in the reaction, for example an acid base indicator, sufficiently little indicator must be added to avoid disrupting the equivalence-point through its interaction with the reacting species. See also: indicator consumption error.
Note 3: When there is no ambiguity, the term “indicator” may be used for visual indicator.
Example: Phenolphthalein changes from colorless to pink in the pH interval 8.2 to 10.0 and so may be used as an indicator for titration of a strong-base anion or its weak acid.
Source: Ref. 1, entry 6.3.11.
volumetric titration
volumetry
Titration in which the titrant is added by volume.
Note: Titrant is usually added from a calibrated burette.
See also: Ref. 21.
Source: Ref. 1, entry 6.3.25.
von Weimarn ratio
relative supersaturation
Difference between the concentration of the supersaturated solution (see supersaturation) required for nucleation (Q) and its solubility (S), divided by the solubility, (Q − S)/S.
Note 2: The particle size of a precipitate increases as its relative supersaturation decreases, so Q should be kept low and S should be high during gravimetric analysis by precipitation.
See also: Ref. 27, page 420.
Source: Ref. 1, entry 5.2.11 with correction to spelling of Weimarn added Note and amendments.
3 Glossary of initialisms and symbols
- A
-
alkalinity
- A P
-
composite alkalinity
- m c
-
conventional mass
- GF
-
gravimetric factor (initialism)
- g F
-
gravimetric factor (symbol)
- s
-
solubility
4 Membership of sponsoring body
Membership of the IUPAC Analytical Chemistry Division (Division V), 2022-2023:
President: David Shaw; Vice President: Derek Craston; Past President: Zoltán Mester; Secretary: Luisa Torsi; Titular Members: Resat Apak, Vasilisa B. Baranovskaia, Jiri Barek, Ilya Kuselman, Takae Takeuchi, Susanne Wiedmer; Associate Members: Franziska Emmerling, Erico Marlon de Moraes Flores, Ivo Leito, Hongmei Li, Aura Tintaru, Winfield Earle Waghorne; National Representatives: Raychelle Burks, Hye Ryung Byon, Orawon Chailapakul, Jan Labuda, Charles Lucy, M. Clara F. Magalhães, Thalappil Pradeep, Malarvili Ramalingam, Rufus Sha’Ato, Danny van Oevelen.
Acknowledgement
The authors acknowledge the critical reading of the manuscript by Professor Clara Magalhães.
-
Research ethics: Not applicable.
-
Informed consent: Not applicable.
-
Author contributions: All contributed equally (see statement under Research funding).
-
Use of Large Language Models, AI and Machine Learning Tools: No AI or other machine learning tool was used in the preparation of this work.
-
Conflict of interest: There are no conflicts of interest.
-
Research funding: This work was prepared under the project 2021-018-1-500 – “Gold Book Update of Terms for Analytical Chemistry.” The Technical Report 1 on which it is based was the output of the project 2015-028-2-500, “Methods of analysis depending on measurement of mass and volume – revision of the Orange Book Chapter 3” with membership M. Filomena Camões (Task group chair) and Gary Christian.
-
Data availability: There is no data.
References
1. Camões, M. F.; Christian, G. D.; Hibbert, D. B. Mass and Volume in Analytical Chemistry (IUPAC Technical Report). Pure Appl. Chem. 2018, 90, 563–603. https://doi.org/10.1515/pac-2017-0410.Search in Google Scholar
2. Hibbert, D. B., Ed.; Compendium of Terminology in Analytical Chemistry: IUPAC Orange Book, 4th ed. RSC: London, 2023.10.1039/9781788012881Search in Google Scholar
3. Compendium of Chemical Terminology. IUPAC Gold Book, 2nd ed., Compiled by A. D. McNaught and A. Wilkinson. Blackwell Scientific Publications Oxford, 1997. https://goldbook.iupac.org/ (accessed 2023-7-1).Search in Google Scholar
4. Kaiser, J.; Hibbert, D. B.; Stohner, J. Preparation, Formatting and Review of IUPAC Technical Reports and Recommendations, IUPAC-Sponsored Books, or Other Items Carrying the IUPAC label. Pure Appl. Chem. 2022, 94, 1257–1267. https://doi.org/10.1515/pac-2022-1106.Search in Google Scholar
5. Sandell, E. B.; West, T. S. Recommended Nomenclature for Titrimetric Analysis. Pure Appl. Chem. 1969, 18, 427–436. https://doi.org/10.1351/pac196918030427.Search in Google Scholar
6. Perrin, C. L.; Agranat, I.; Bagno, A.; Braslavsky, S. E.; Fernandes, P. A.; Gal, J.-F.; Lloyd-Jones, G. C.; Mayr, H.; Murdoch, J. R.; Nudelman, N. S.; Radom, L.; Rappoport, Z.; Ruasse, M.-F.; Siehl, H.-U.; Takeuchi, Y.; Tidwell, T. T.; Uggerud, E.; Williams, I. H. Glossary of Terms Used in Physical Organic Chemistry (IUPAC Recommendations 2021). Pure Appl. Chem. 2022, 94, 353–534; https://doi.org/10.1515/pac-2018-1010.Search in Google Scholar
7. Gamsjäger, H.; Lorimer, J. W.; Scharlin, P.; Shaw, D. G. Glossary of Terms Related to Solubility (IUPAC Recommendations 2008). Pure Appl. Chem. 2008, 80, 233–276. https://doi.org/10.1351/pac200880020233.Search in Google Scholar
8. ISO 9963-1 Water Quality – Determination of Alkalinity – Part 1: Determination of Total and Composite Alkalinity; International Organization for Standardization: Geneva, 1994.Search in Google Scholar
9. Gschneidner, K. A.; Bunzli, J. C. G.; Pecharsky, V. K. Handbook on the Physics and Chemistry of Rare Earths; Elsevier: Amsterdam, 2006, pp. 286–288.Search in Google Scholar
10. BIPM, IEC, IFCC, ILAC, ISO, IUPAC, IUPAP, OIML JCGM 200:2012. International Vocabulary of Metrology – Basic and General Concepts and Associated Terms (VIM); BIPM: Sèvres, France, 2012.Search in Google Scholar
11. International Organization of Legal Metrology (OIML) D-28 . Conventional Value of the Result of Weighing in Air; OIML: Paris, 2004.Search in Google Scholar
12. International Organization of Legal Metrology (OIML) Part 1: Metrological and Technical Requirements. R 111-1; Weights of Classes E1, E2, F1, F2, M1, M1-2, M2, M2-3 and M3; OIML: Paris, 2004.Search in Google Scholar
13. Commission on Microchemical Techniques and Trace Analysis. Pure Appl. Chem. 1979, 51, 1195. https://doi.org/10.1351/pac197951051195.Search in Google Scholar
14. Inczedy, J.; Lengyel, T.; Ure, A. M. IUPAC Compendium of Analytical Nomenclature. Definitive Rules 1997, IUPAC Orange Book, 3rd ed.; Blackwell Scientific: Oxford, UK, 1998.Search in Google Scholar
15. Richter, W. Primary Methods of Measurement in Chemical Analysis. Accredit. Qual. Assur. 1997, 2, 354–359. https://doi.org/10.1007/s007690050165.Search in Google Scholar
16. Cohen, E. R.; Cvitaš, T.; Frey, J. G.; Holmström, B.; Kuchitsu, K.; Marquardt, R.; Mills, I.; Pavese, F.; Quack, M.; Stohner, J.; Strauss, H. L.; Tamaki, M.; Thor, A. Quantities, Units and Symbols in Physical Chemistry, IUPAC Green Book, 3rd ed.; The Royal Society of Chemistry: Cambridge, UK, 2007.Search in Google Scholar
17. Gordon, L. Precipitation from Homogeneous Solution. Anal. Chem. 1952, 24, 459–462. https://doi.org/10.1021/ac60063a006.Search in Google Scholar
18. Giacovazzo, C.; Monaco, H. L.; Artioli, G.; Viterbo, D.; Milaneso, M.; Ferraris, G.; Gilli, G.; Gilli, P.; Zanotti, G.; Catti, M. IUCr Fundamentals of Crystallography, 3rd ed.; Oxford University Press, 2011.10.1093/acprof:oso/9780199573653.001.0001Search in Google Scholar
19. Clarke, J. B.; Hastie, J. W.; Kihlborg, L. H. E.; Metselaar, R.; Thackeray, M. M. Definitions of Terms Relating to Phase Transitions of the Solid State (IUPAC Recommendations 1994). Pure Appl. Chem. 1994, 66, 577–594. https://doi.org/10.1351/pac199466030577.Search in Google Scholar
20. Pingarrón, J. M.; Labuda, J.; Barek, J.; Brett, C. M. A.; Camões, M. F.; Fojta, M.; Hibbert, D. B. Terminology of Electrochemical Methods of Analysis (IUPAC Recommendations 2019). Pure Appl. Chem. 2020, 92, 641–694. https://doi.org/10.1515/pac-2018-0109.Search in Google Scholar
21. Calvert, J. G. Glossary of Atmospheric Chemistry Terms (Recommendations 1990). Pure Appl. Chem. 1990, 62, 2167–2219. https://doi.org/10.1351/pac199062112167.Search in Google Scholar
22. Christian, G. D.; Dasgupta, P. K.; Schug, K. A. Analytical Chemistry, 7th ed.; Wiley & Sons: New York, 2014.Search in Google Scholar
23. IUPAC-NIST Solubility Database. NIST: Gaithersburg. https://srdata.nist.gov/solubility/index.aspx (accessed 2024-10-24).Search in Google Scholar
24. IUPAC Analytical Chemistry Division: Commission on Equilibrium Data: Subcommittee on Solubility Data. Helium and Neon-Gas Solubilities; Pergamon Press: Oxford, 1979.Search in Google Scholar
25. Freiser, H.; Nancollas, G. H., Eds. Compendium of Analytical Nomenclature (Definitive Rules 1987) - The Orange Book, 2nd ed.; Blackwell Science: Oxford, UK, 1987.Search in Google Scholar
26. Foster, L. S.; Gruntfest, I. J. Demonstration Experiments Using Universal Indicators. J. Chem. Ed. 1937, 14, 274. https://doi.org/10.1021/ed014p274.Search in Google Scholar
27. Barlow, D. A.; Baird, J. K.; Su, C.-H. Theory of the von Weimarn Rules Governing the Average Size of Crystals Precipitated from a Supersaturated Solution. J. Cryst. Growth 2004, 264, 417–423. https://doi.org/10.1016/j.jcrysgro.2003.12.047.Search in Google Scholar
© 2024 IUPAC & De Gruyter
This work is licensed under the Creative Commons Attribution-NonCommercial-NoDerivatives 4.0 International License.
Articles in the same Issue
- Frontmatter
- IUPAC Recommendations
- Glossary of terms for mass and volume in analytical chemistry (IUPAC Recommendations 2024)
- IUPAC Technical Report
- Toward a definition of valence as a quantity (IUPAC Technical Report)
- Corrigendum
- Corrigendum to: Green chemistry for all: three principles of Inclusive Green and Sustainable Chemistry Education